is information always informative? perhaps to you, … information always informative? perhaps to...
TRANSCRIPT

Is information always informative?Perhaps to you, but is it to the Colour-vision deficient?
MAJED ALSAFYANI, COLIN EGAN and AMANDA L. JEFFERIESSchool of Computer ScienceUniversity of Hertfordshire
College Lane, Hertfordshire. Hertfordshire AL10 9ABUK
Abstract: - Every day we are surrounded by information which is supplied in many forms and we might beexpected to make important decisions from that information. However, it may not be possible for all recipientsof the information to make such necessary and informed decisions. In this paper we focus on the difficultiesencountered by those who suffer from colour-vision deficiencies. We provide one mechanism of a potentialsolution to information derived from the frequently used pie-chart which are commonly used by businesses tovisually represent (raw) data as information. We use the pie-chart creation tutorial provided by MSDN tohighlight how the colour-vision deficient might have difficulties in interpreting information. Our potentialsolution is an image processing software tool called the HCBEenhanced. HCBEenhanced identifies the actualpie-chart within an image, which we call the Region of Concern (ROC) and any legend provided within theimage. HCBEenhanced then inserts a halo around each segment of the pie-chart, which we call the halo-effectof segments. This new pie-chart is then provided as an output file to the user. We demonstrate that thosesuffering from colour-vision deficiencies, by use of HCBEenhanced, can have significant improvements in theability to interpret the information that was intended from the original pie-chart.
Key-Words: - Colour-vision deficient, colourblind, information, data, image, image processing, pie-chart,Microsoft Developer Network (MSDN)
1 IntroductionToday we are bombarded with information, whereinformation is the meaning that has been applied todata. Data are gathered facts and/or statistics whichare collated for analysis and/or for reference. Forexample, pie-charts and other images are commonlyused to show information from gathered (raw) datain a meaningful and graphical manner. But do pie-charts, as images, actually achieve what theircreators intended? This is an interesting questionand it poses many dilemmas. As authors of thispaper we deliberately use the term dilemma as theinformative information that pie-charts, as images,are intended to provide may result in a positionwhere difficult choices have to be made and thosechoices may be desirable or even undesirable.We consider that it is the pie-charts creators’responsibility to convey the information in ameaningful manner such that those difficult choicesthat may be made are correct and true [1]. However,if you were colour-vision deficient do you considerthat the dilemmas we have highlighted would beexacerbated? Do you think if you were colour-
vision deficient you would be in a position to makeaccurate and true decisions from the intendedinformation provided by a typical pie-chart? Wouldyou be able to process the pie-chart image in theway that the creator intended? Just think, if you didnot appreciate that the information you werederiving was not what was intended, you couldmake severe undesirable choices.
Approximately 1 in 12 males are colourblind andvery few females (approximately 1 in 250) are alsocolourblind. What difficulties do you think theymight encounter when interpreting information frompie-charts? Consider, a small business is consideredto consist of less than 100 employees and a mediumsize business is considered to consist of between100 and 999 employees. Potentially, that means asmall business could employ up to approximately 8male colourblind males, and a medium size businesscould employ up to 80 colourblind male employeesand up to 4 female colourblind employees.
In the remainder of this paper we intend todemonstrate some of the problems that informationfrom typical business pie-charts may cause the
Majed Alsafyani et al.International Journal of Computers
http://www.iaras.org/iaras/journals/ijc
ISSN: 2367-8895 259 Volume 1, 2016
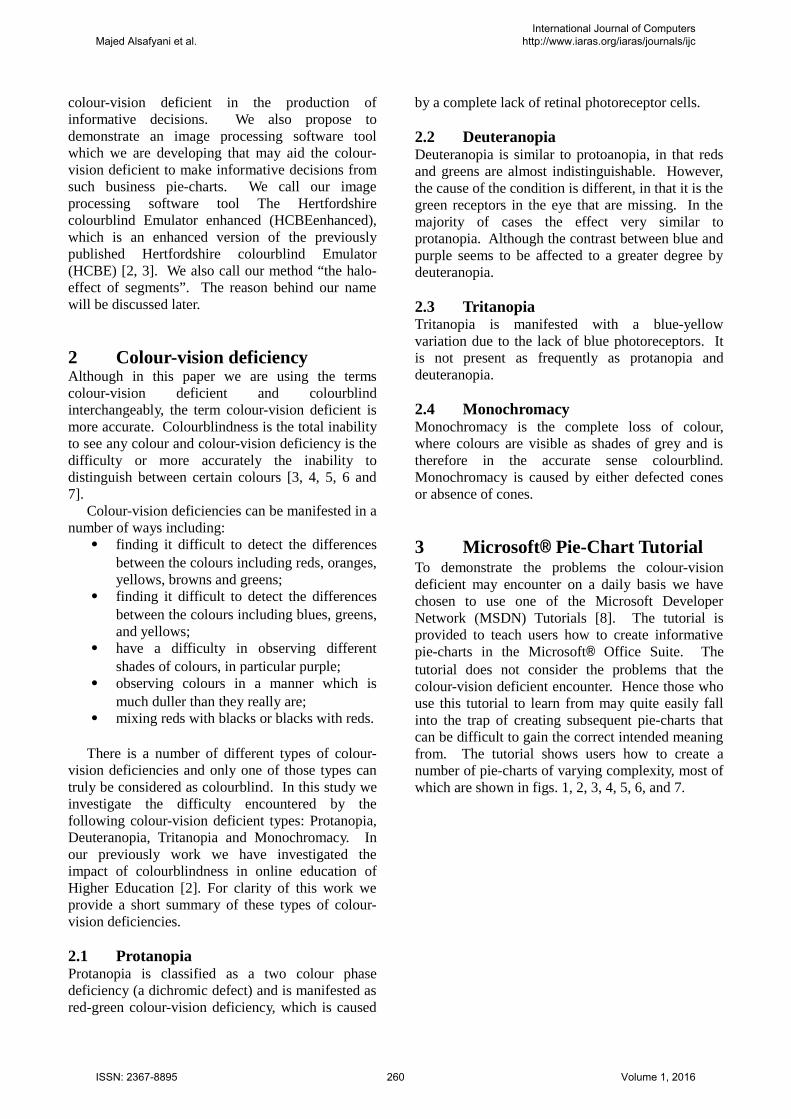
colour-vision deficient in the production ofinformative decisions. We also propose todemonstrate an image processing software toolwhich we are developing that may aid the colour-vision deficient to make informative decisions fromsuch business pie-charts. We call our imageprocessing software tool The Hertfordshirecolourblind Emulator enhanced (HCBEenhanced),which is an enhanced version of the previouslypublished Hertfordshire colourblind Emulator(HCBE) [2, 3]. We also call our method “the halo-effect of segments”. The reason behind our namewill be discussed later.
2 Colour-vision deficiencyAlthough in this paper we are using the termscolour-vision deficient and colourblindinterchangeably, the term colour-vision deficient ismore accurate. Colourblindness is the total inabilityto see any colour and colour-vision deficiency is thedifficulty or more accurately the inability todistinguish between certain colours [3, 4, 5, 6 and7].
Colour-vision deficiencies can be manifested in anumber of ways including:
finding it difficult to detect the differencesbetween the colours including reds, oranges,yellows, browns and greens;
finding it difficult to detect the differencesbetween the colours including blues, greens,and yellows;
have a difficulty in observing differentshades of colours, in particular purple;
observing colours in a manner which ismuch duller than they really are;
mixing reds with blacks or blacks with reds.
There is a number of different types of colour-vision deficiencies and only one of those types cantruly be considered as colourblind. In this study weinvestigate the difficulty encountered by thefollowing colour-vision deficient types: Protanopia,Deuteranopia, Tritanopia and Monochromacy. Inour previously work we have investigated theimpact of colourblindness in online education ofHigher Education [2]. For clarity of this work weprovide a short summary of these types of colour-vision deficiencies.
2.1 ProtanopiaProtanopia is classified as a two colour phasedeficiency (a dichromic defect) and is manifested asred-green colour-vision deficiency, which is caused
by a complete lack of retinal photoreceptor cells.
2.2 DeuteranopiaDeuteranopia is similar to protoanopia, in that redsand greens are almost indistinguishable. However,the cause of the condition is different, in that it is thegreen receptors in the eye that are missing. In themajority of cases the effect very similar toprotanopia. Although the contrast between blue andpurple seems to be affected to a greater degree bydeuteranopia.
2.3 TritanopiaTritanopia is manifested with a blue-yellowvariation due to the lack of blue photoreceptors. Itis not present as frequently as protanopia anddeuteranopia.
2.4 MonochromacyMonochromacy is the complete loss of colour,where colours are visible as shades of grey and istherefore in the accurate sense colourblind.Monochromacy is caused by either defected conesor absence of cones.
3 Microsoft® Pie-Chart TutorialTo demonstrate the problems the colour-visiondeficient may encounter on a daily basis we havechosen to use one of the Microsoft DeveloperNetwork (MSDN) Tutorials [8]. The tutorial isprovided to teach users how to create informativepie-charts in the Microsoft® Office Suite. Thetutorial does not consider the problems that thecolour-vision deficient encounter. Hence those whouse this tutorial to learn from may quite easily fallinto the trap of creating subsequent pie-charts thatcan be difficult to gain the correct intended meaningfrom. The tutorial shows users how to create anumber of pie-charts of varying complexity, most ofwhich are shown in figs. 1, 2, 3, 4, 5, 6, and 7.
Majed Alsafyani et al.International Journal of Computers
http://www.iaras.org/iaras/journals/ijc
ISSN: 2367-8895 260 Volume 1, 2016
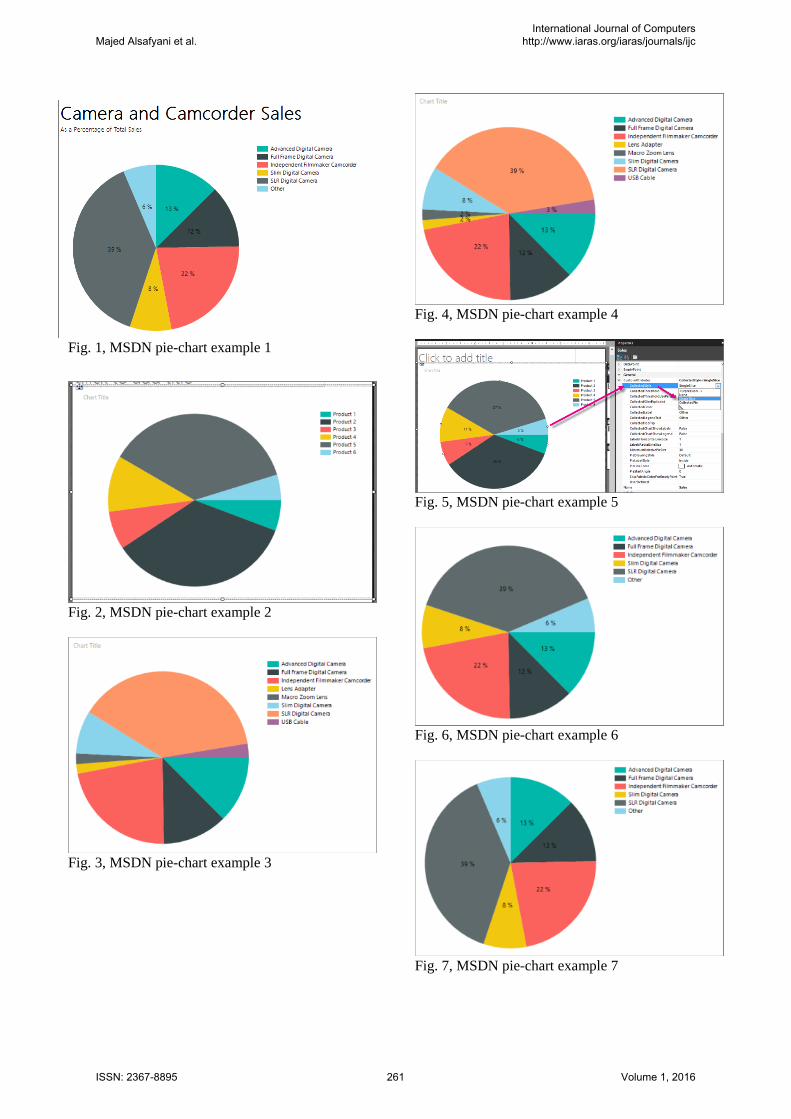
Fig. 1, MSDN pie-chart example 1
Fig. 2, MSDN pie-chart example 2
Fig. 3, MSDN pie-chart example 3
Fig. 4, MSDN pie-chart example 4
Fig. 5, MSDN pie-chart example 5
Fig. 6, MSDN pie-chart example 6
Fig. 7, MSDN pie-chart example 7
Majed Alsafyani et al.International Journal of Computers
http://www.iaras.org/iaras/journals/ijc
ISSN: 2367-8895 261 Volume 1, 2016

3 The Hertfordshire ColourblindEmulator (HCBE)The Hertfordshire Colourblind Emulator (HCBE) [2and 3] generates images as they would be seen bythe colour-vision deficient. Currently, HCBE relieson the images creators’ to make the decisionwhether the original image conveys the informationto the colour-vision deficient as intended or not. Inthe case that the information is not conveyed asintended then it is the creators’ responsibility tomake necessary changes to the image such that theinformation is conveyed as intended [ref equalityact]. This could be, for example, by simplychanging colour schemes.
HCBE is a software tool that, as input, takes inan image in a number of formats and one of fourtypes of colourblindness selected (protanopia,deuteranopia, tritanopia or monochromacy). Thatimage is then processed pixel by pixel such that ifthe type of colourblindness is detected then thecolour of the pixel undergoing processing is alteredto that seen by the selected colour-vision deficiency.Once the input image has completely beenprocessed a new processed image is then output tothe user as a Joint Photographic Experts Group(jpeg) file [9].
In subsequent sections of this paper we showenhancements we have been making to HCBE(currently called HCBEenhanced) output .jpegimages that potentially may convey to the colour-vision deficient the meaning that the images’creators originally intended.
3.1 HCBE and the Microsoft® Pie-ChartTutorialWe have input each of the MSDN pie-charttutorial’s images into HCBE for each of the fourtypes of colourblindness, resulting in 28 altered.jpegs highlighting how the colour-vision deficientwould view the pie-charts. In this paper, we onlypresent the output images associated withDeuteranopia (figs. 8, 9, 10, 11, 12, 13, and 14) butwe will discuss all of our 28 output files.
Fig. 8, Deuteranomaly MSDN pie-chart example 1
Fig. 9, Deuteranomaly MSDN pie-chart example 2
Fig. 10, Deuteranomaly MSDN pie-chart example 3
Majed Alsafyani et al.International Journal of Computers
http://www.iaras.org/iaras/journals/ijc
ISSN: 2367-8895 262 Volume 1, 2016
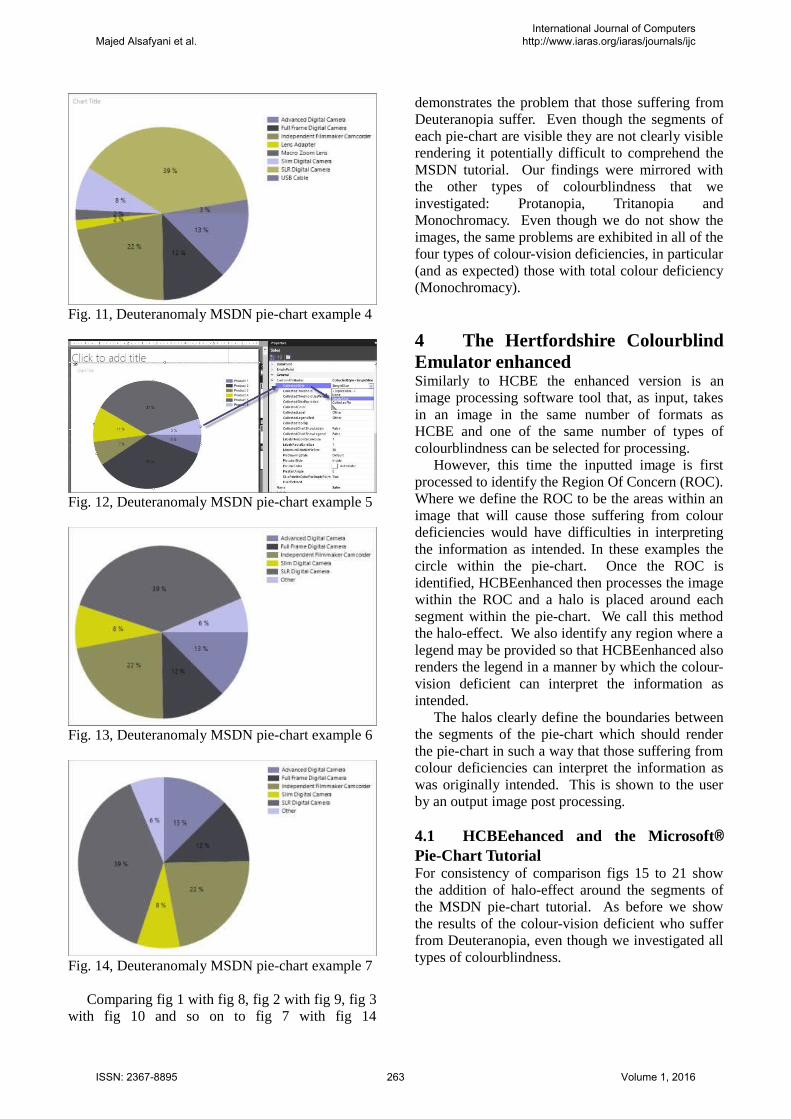
Fig. 11, Deuteranomaly MSDN pie-chart example 4
Fig. 12, Deuteranomaly MSDN pie-chart example 5
Fig. 13, Deuteranomaly MSDN pie-chart example 6
Fig. 14, Deuteranomaly MSDN pie-chart example 7
Comparing fig 1 with fig 8, fig 2 with fig 9, fig 3with fig 10 and so on to fig 7 with fig 14
demonstrates the problem that those suffering fromDeuteranopia suffer. Even though the segments ofeach pie-chart are visible they are not clearly visiblerendering it potentially difficult to comprehend theMSDN tutorial. Our findings were mirrored withthe other types of colourblindness that weinvestigated: Protanopia, Tritanopia andMonochromacy. Even though we do not show theimages, the same problems are exhibited in all of thefour types of colour-vision deficiencies, in particular(and as expected) those with total colour deficiency(Monochromacy).
4 The Hertfordshire ColourblindEmulator enhancedSimilarly to HCBE the enhanced version is animage processing software tool that, as input, takesin an image in the same number of formats asHCBE and one of the same number of types ofcolourblindness can be selected for processing.
However, this time the inputted image is firstprocessed to identify the Region Of Concern (ROC).Where we define the ROC to be the areas within animage that will cause those suffering from colourdeficiencies would have difficulties in interpretingthe information as intended. In these examples thecircle within the pie-chart. Once the ROC isidentified, HCBEenhanced then processes the imagewithin the ROC and a halo is placed around eachsegment within the pie-chart. We call this methodthe halo-effect. We also identify any region where alegend may be provided so that HCBEenhanced alsorenders the legend in a manner by which the colour-vision deficient can interpret the information asintended.
The halos clearly define the boundaries betweenthe segments of the pie-chart which should renderthe pie-chart in such a way that those suffering fromcolour deficiencies can interpret the information aswas originally intended. This is shown to the userby an output image post processing.
4.1 HCBEehanced and the Microsoft®Pie-Chart TutorialFor consistency of comparison figs 15 to 21 showthe addition of halo-effect around the segments ofthe MSDN pie-chart tutorial. As before we showthe results of the colour-vision deficient who sufferfrom Deuteranopia, even though we investigated alltypes of colourblindness.
Majed Alsafyani et al.International Journal of Computers
http://www.iaras.org/iaras/journals/ijc
ISSN: 2367-8895 263 Volume 1, 2016

Fig. 15, Deuteranomaly with the halo-effect MSDNpie-chart example 1
Fig. 16, Deuteranomaly with the halo-effect MSDNpie-chart example 2
Fig. 17, Deuteranomaly with the halo-effect MSDNpie-chart example 3
Fig. 18, Deuteranomaly with the halo-effect MSDNpie-chart example 4
Fig. 19, Deuteranomaly with the halo-effect MSDNpie-chart example 5
Fig. 20, Deuteranomaly with the halo-effect MSDNpie-chart example 6
Fig. 21, Deuteranomaly with the halo-effect MSDN
Majed Alsafyani et al.International Journal of Computers
http://www.iaras.org/iaras/journals/ijc
ISSN: 2367-8895 264 Volume 1, 2016

pie-chart example 7
By doing a similar comparisons as before,comparing fig 1 with fig 8 and fig 15, fig 2 with fig9 and fig 16, fig 3 with fig 10 and fig 17and so on tofig 7 with fig 14 and 21 demonstrates the problemthat those suffering from Deuteranopia suffer.However, with the halo-effect we now show that thecolour-vision deficient can interpret the originalinformation as intended.
As before, our findings were mirrored with theother types of colourblindness that we investigated:Protanopia, Tritanopia and Monochromacy.
Note that the percentage values shown in somesegments of the images are altered to white. This isbecause we have also surrounded these percentagevalues with the halo-effect. This means that anyproblems the colour-vision deficient would havereading the percentage values in the original imageare now made visible to the user. Unfortunately, dueto size of the images in this paper the percentagevalues are not clearly shown. However, in theactual output images the percentage values canclearly be identified by the user.
5 ConclusionIn this study we sought to demonstrate howinformation, as intended, is not always informativein particular for those who suffer from colour-visiondeficiency. To highlight this hypothesis we chose touse pie-charts as they are a commonly used visualmechanism to show descriptive or qualitativeinformation. We also chose the MSDN pie-charttutorial as a publicly available means to show howto provide information in a meaningful and visualmanner. However, we also showed that this may notalways be as easy at it may seem in particular tothose who suffer from colour-vision deficiencies.
We have also shown that by altering the originalimage then the information as intended can beprovided to those suffering colour-visiondeficiencies. In this paper, we only show a subset ofour results for those suffering from Deuteranopia.Our full set of results mirror what we have shownfor Deuteranopia with the three other major types ofcolourblindness: Protanopia, Tritanopia andMonochromacy.
Our conclusion, therefore, is that by makingminor changes to the way information is presentedthen informative information can be obtained asintended to include those who suffer from thecolour-vision deficiencies.
We have introduced the HCBEenhanced as animage processing software tool to achieve this. We
consider that it would be better for tutorials such asthe MSDN tutorial to consider those who sufferfrom colour-vision deficiencies, which would meanimage processing software tools such asHCBEenhanced would be rendered redundant.Research into this area is also important not only tohighlight such problems, but to encourage pie-chartcreators to be aware of all different types of userswho may view their visual representations.However, until this happens image processingsoftware tools such as HCBEenhanced will berequired.
HCBEenhanced is in its infancy in the way toprovide potential solutions to the problems ofshowing how information should be conveyed inpie-charts. Currently, the user would have to have acopy of HCBEenhanced on one of their (non-mobile) desk-top computer systems. The userwould then have to obtain an e-copy of the pie-chartin question and input it into HCBEenhanced beforeviewing the output image. We are alreadydeveloping a version of HCBEenhanced for use onmobile computer systems such as smart-phones andtablet PCs.
Our research is on-going and we have recentlyundertaken a survey on colour-vision problems thatboth the colour-vision deficient suffer and the non-colour-vision deficient suffer. It is too early torelease the finding of this study but it will enable usto develop software to enhance the opportunity tointerpret information provided in other colourinformation formats such as the popular ‘traffic lightsystem’ [10]. We propose to continue our workwith international collaboration with Saudi Arabiaand with individual subjects in the UK.
References:
[1] Colour Bilnd Awarenes.http://www.colourblindawareness.org/colour-blindness/living-with-colour-vision-deficiency/[date of last access 26 July 2016].
[2] Egan C., Jefferies A., Dipple E. and Smith D.Do you see what I see? Understanding thechallenges of colour-blindness in onlinelearning, School of Computer Science,University of Hertfordshire, Hatfield UK, 2011.
[3] Egan C., Jefferies A., Dipple E. and Smith D.‘Do You See What I See? Understanding theChallenges of Colour-Blindness in OnlineLearning’ In Greeners, ,S. & Rospiglio, A.(Eds) Proceedings of the 10th European
Majed Alsafyani et al.International Journal of Computers
http://www.iaras.org/iaras/journals/ijc
ISSN: 2367-8895 265 Volume 1, 2016
Conference for E-Learning, Brighton, UK, APIpp. 210-217, 2011
[4] NHS Choices,http://www.nhs.uk/conditions/Colour-vision-deficiency/Pages/Introduction.aspx [date of lastaccess 26 July 2016].
[5] Deeb S. S., and Motulsky A. G. Red-GreenColor Vision Defects, GeneReviews, LastUpdate 2015.
[6] Geissbuehler M., and Lasser T., How to displaydata by color schemes compatible with red-green color perception deficiencies, OpticsExpress Vol. 21, Issue 8, pp. 9862-9874, 2013.
[7] Poret S., Dony R, D., Gregori S. Imageprocessing for colour blindness correction,Science and Technology for Humanity (TIC-STH), IEEE Toronto International Conference,26-27 Sept. 2009, pp 539 – 544.
[8] Microsoft Developer Network Tutorial,https://msdn.microsoft.com/en-us/library/dd255283.aspx [date of last access 26July 2016].
[9] Joint Photographic Experts Group,https://jpeg.org/jpeg/index.html]. [date of lastaccess 26 July 2016].
[10] Food Standards Agency,http://tna.europarchive.org/20120419000433/http://www.food.gov.uk/multimedia/pdfs/publication/foodtrafficlight1107.pdf [date of last access03 October 2016].
Majed Alsafyani et al.International Journal of Computers
http://www.iaras.org/iaras/journals/ijc
ISSN: 2367-8895 266 Volume 1, 2016