irrigation system evaluation and pump efficiency
TRANSCRIPT

Irrigation System Evaluation and Pump Efficiency
By: Greg Borges
Agriculture Systems Management
California Polytechnic State University
San Luis Obispo, CA
2012

i
SIGNATURE PAGE
TITLE : Irrigation System Evaluation and Pump Selection
AUTHOR : Greg Borges
DATE SUBMITTED : June, 2012
Dr. Daniel Howes
Senior Project Advisor Signature
Date
Dr. Richard Cavaletto
Department Head Signature
Date

ii
ACKNOWLEDGEMENTS
First I would like to thank Dr. Daniel Howes, who helped me understand the evaluation techniques used in this project and the methodical process of putting this report together. His advice was always helpful and appreciated.
Second, I would like to thank Borges Farms for allowing me to use their field and facilities for the evaluations performed in this project.
Third I would like to thank Bill Loflin and Hydrotech Inc. for their help understanding the irrigation system.
Fourth, but most important, I would like to thank my parents and sister for all of their love and support. I would have never completed my education without their involvement.

iii
ABSTRACT This project encompasses the Evaluation of a drip irrigation system for a Pistachio orchard in Tulare, Ca. The project parameters were decided on by Borges Farms. After the evaluation suggestions are to be made for improving the system’s efficiency. These suggestions must be approved by the grower and show whether they are cost efficient. The irrigation system cannot be modified to fit the pump chosen.
Research for the project encompasses drip irrigation systems, irrigation pump efficiency, irrigation management, well reclamation techniques and pistachio water requirements. A Distribution Uniformity evaluation was performed to understand how sand has affected the system. I consulted local growers in the area to discover how sand problems have been dealt with in the past. The systems requirements have been calculated and the proper pump and motor for the irrigation system were selected. A cost analyisis was then performed to give the grower an understanding of the costs involved and make his decision of how he wants to proceed.

iv
DISCLAIMER STATEMENT
The university makes it clear that the information forwarding herewith is a project resulting from a class assignment and has been graded and accepted only as a fulfillment of a course requirement. Acceptance by the university does not imply technical accuracy or reliability. Any use of the information in the report is made by the user(s) at his or herown risk, which may include catastrophic failure of the device or infringement of patent or copyright laws.
Therefore, the recipient and/or user of the information contained in this report agrees to indemnify, defend and save harmless the state its offices, agents and employees from any and all claims and losses accruing of resulting to any person, firm, or corporation who may be injured or damaged as a result of the use of this report.

v
TABLE OF CONTENTS
Page
SIGNATURE PAGE ........................................................................................................... i
ACKNOWLEDGEMENTS ................................................................................................ ii
ABSTRACT ....................................................................................................................... iii
DISCLAIMER STATEMENT .......................................................................................... iv
TABLE OF CONTENTS .................................................................................................... v
LIST OF FIGURES .......................................................................................................... vii
LIST OF TABLES ........................................................................................................... viii
INTRODUCTION .............................................................................................................. 1
LITERATURE REVIEW ................................................................................................... 2
Pistachio Irrigation. ......................................................................................................... 2
Distribution Uniformity................................................................................................... 3
Filtration Systems. ...................................................................................................... 3
Clogging Emitters. ...................................................................................................... 3
Irrigation Wells. .............................................................................................................. 4
Well Rehabilitation. .................................................................................................... 5
Motor. .............................................................................................................................. 5
Pump................................................................................................................................ 6
Procedures and Methods ..................................................................................................... 7
Research Procedure. ........................................................................................................ 7
Distribution Uniformity................................................................................................... 7
Data Collection. ............................................................................................................... 7
Pumping Station. ......................................................................................................... 9
Irrigation Scheduling. ................................................................................................. 9
Well Rehabilitation. .................................................................................................. 10
Cost Analysis. ........................................................................................................... 10
Results ............................................................................................................................... 11
Distribution Uniformity. ........................................................................................... 11
Pumping Station Efficiency. ..................................................................................... 12
Motor Selection ......................................................................................................... 12
Discussion ......................................................................................................................... 14
Recommendations ............................................................................................................. 15

vi
References ......................................................................................................................... 16
Appendixes ....................................................................................................................... 18
Appendix A ....................................................................................................................... 19
Senior Project Contract ................................................................................................. 19
Appendix B ....................................................................................................................... 22
Data Entry Sheets .......................................................................................................... 22
Appendix C ....................................................................................................................... 44
Pressure and Flow Test Locations ................................................................................. 44
Appendix D ....................................................................................................................... 47
Calculations ................................................................................................................... 47
DU Formulas ................................................................................................................. 48
DU due to Differences in Pressure............................................................................ 48
DU due to Other Causes ........................................................................................... 48
DU due to Uneven Spacing....................................................................................... 48
DU due to Unequal Drainage .................................................................................... 48
Pump Efficiency Calculations ....................................................................................... 48
2007........................................................................................................................... 48
2011........................................................................................................................... 49
Motor Selection Calculations ........................................................................................ 49
Appendix E ....................................................................................................................... 51
DU Evaluation Tools Required ..................................................................................... 51
Appendix F........................................................................................................................ 54
Pumping and Filtration Station ..................................................................................... 54

vii
LIST OF FIGURES
Figure 1- Drip tube with in-line emitter. ............................................................................. 1
Figure 2- Evapotranspiration Process (Kimak, 1998)......................................................... 2
Figure 3- Irrigation well diagram (Scherer,2005) ............................................................... 4
Figure 4- DU Evaluation Loctaion .................................. Error! Bookmark not defined.8
Figure 5- Pressure regulator at manifold inlet. ................................................................... 8
Figure 6- Flow Measurements ............................................................................................ 8
Figure 7- Watermark Soil Moisture Tester ......................................................................... 9
Figure 8- Sand Worn Impeller .......................................................................................... 10
Figure 9- Goof Pulg .......................................................................................................... 52
Figure 10- Pitot Tube and Pressure Gauge ....................................................................... 52
Figure 11- Small Tube Hole Punch .................................................................................. 52
Figure 12- Graduated Cylinder ......................................................................................... 53
Figure 13- 28 Clear Plastic Buckets .................................................................................. 53
Figure 14- Pumping and Filtration Station ....................................................................... 55
Figure 15- Fertigation Injection Site ................................................................................. 56

viii
LIST OF TABLES
Page Table 1- Pressure Test Results .......................................................................................... 11
Table 2- Hydraulic Test Results ....................................................................................... 12
Table 3 Irrigation Schedule for Mature Pistachios ........................................................... 13

About five years ago Borges Farms decided it was time to become more diverse in the crops they grow. This led to the planting of their first twenty acres of pistachios. planted the water well on the property was very old and had alrwith the water. It had been used for flood irrigation in the past and the sand did not cause problems within the flood irrigation system made up of 1/2” tubing and small micro emitters. These micro emitters are designed to deliver a specified amount of water to each tree and can easily plug due to the small orifice. following year another fifteen acres of pistachio were planted at the same ranch requiring the pump to provide even more water. expansion plans taken into account so that it could filt
of sending an employee through every time the crop is irrigated to check emitters one at a time ensuring that they are all working properly. owners of the farm so that they can decide the proper course of action that is best.that could be investigated include replacement of the well, rehabilitating the just adding a sand separator between the pumping station and the filtration system.
Figure 1- Drip tube with in-line emitter.
INTRODUCTION
About five years ago Borges Farms decided it was time to become more diverse in the crops they This led to the planting of their first twenty acres of pistachios. When these trees were
planted the water well on the property was very old and had already begun to pump sand along It had been used for flood irrigation in the past and the sand did not cause
irrigation system or drip irrigation system initially. This drip system is ll micro emitters. These micro emitters are designed to deliver a
specified amount of water to each tree and can easily plug due to the small orifice. following year another fifteen acres of pistachio were planted at the same ranch requiring the
to provide even more water. The irrigation system had been designed with these expansion plans taken into account so that it could filter and transport the extra flow Rate
needed. During the last couple years the owners of Borges Farms have noticed more problems have been occurring with sand plugging up emitters and filters. filters have been added in hope of curbing the sand problem but the owner finds that they plug quickly and must be rinsed out often.
I would like to test the efficiencthe system to discover how much flow is being block by sand that collects in the system. If it is found that the well has begun to pump too much sand it may be more cost effective to re-drill the well rather than continuing to replace expensive filters. A new well would increase the efficiency of the irrigation system as well as reduce the saput through the water lines and emitters.
addition to reducing costs incurred through filter purchases, a new well would cut the cost
of sending an employee through every time the crop is irrigated to check emitters one at a time are all working properly. The results of these tests will be shared with the
owners of the farm so that they can decide the proper course of action that is best.that could be investigated include replacement of the well, rehabilitating the well properly, or just adding a sand separator between the pumping station and the filtration system.
line emitter.
1
About five years ago Borges Farms decided it was time to become more diverse in the crops they When these trees were
eady begun to pump sand along It had been used for flood irrigation in the past and the sand did not cause
This drip system is ll micro emitters. These micro emitters are designed to deliver a
specified amount of water to each tree and can easily plug due to the small orifice. The following year another fifteen acres of pistachio were planted at the same ranch requiring the
The irrigation system had been designed with these er and transport the extra flow Rate
During the last couple years the owners of Borges Farms have noticed more problems have been occurring with sand plugging up emitters and filters. Extra in-line filters have been added in hope of curbing the sand problem but the owner finds that they plug quickly and must be rinsed out often.
I would like to test the efficiency of the system to discover how much flow is being block by sand that collects in the
If it is found that the well has begun to pump too much sand it may be more cost
drill the well rather than continuing to replace expensive filters. A new well would increase the efficiency of the irrigation system as well as reduce the sand put through the water lines and emitters. In
addition to reducing costs incurred through filter purchases, a new well would cut the cost
of sending an employee through every time the crop is irrigated to check emitters one at a time The results of these tests will be shared with the
owners of the farm so that they can decide the proper course of action that is best. Some options well properly, or
just adding a sand separator between the pumping station and the filtration system.

Irrigation System
Pistachio Irrigation. Evapotranspiration (ET) is a basis for determining the water requirement combination of the water lost through transpiration and evaporation from the plant and soil surfaces (Kirnak, 1998). ET rates from orchards are influenced primarily by micrometeorological, plant, and soil factors. Tensiometers are the most commonly used sensors for measuring soil water status as they are relatively cheap and practical when compared other types of soil matric potential sensors. These sensors cannot measure the full range of soil tension values but the most practical when setting an irrigation schedule.
Figure 2-
Efficient irrigation is the act of providing water to the plant when and where it needs it and knowing the soil moisture levels are important. Improperly scheduling and poor systemperformance can lead to under-irrigation at the wrong which can reduce growth and yield, or over-irrigation resulting in root rot or salinity problems. The pistachio tree is known to have some tolerance to drought though when grown for commercial nut prohave adequate soil moisture. As with any other crop, there are critical periods when it is important not to under irrigate a pistachio orchard. The first of these occurs in the first stage of growth, between bloom and the end o
LITERATURE REVIEW
Evapotranspiration (ET) is a basis for determining the water requirement water lost through transpiration and evaporation from the plant and soil
surfaces (Kirnak, 1998). ET rates from orchards are influenced primarily by micrometeorological, plant, and soil factors. Tensiometers are the most commonly used sensors
ing soil water status as they are relatively cheap and practical when compared other types of soil matric potential sensors. These sensors cannot measure the full range of soil tension values but the most practical when setting an irrigation schedule.
- Evapotranspiration Process (Kimak, 1998)
Efficient irrigation is the act of providing water to the plant when and where it needs it and knowing the soil moisture levels are important. Improperly scheduling and poor system
irrigation at the wrong which can reduce growth and yield, or irrigation resulting in root rot or salinity problems. The pistachio tree is known to have
some tolerance to drought though when grown for commercial nut production it is necessary to have adequate soil moisture. As with any other crop, there are critical periods when it is important not to under irrigate a pistachio orchard. The first of these occurs in the first stage of growth, between bloom and the end of shell expansion. It is also unwise to cut water application
2
Evapotranspiration (ET) is a basis for determining the water requirement water lost through transpiration and evaporation from the plant and soil
micrometeorological, plant, and soil factors. Tensiometers are the most commonly used sensors ing soil water status as they are relatively cheap and practical when compared other
types of soil matric potential sensors. These sensors cannot measure the full range of soil tension
Efficient irrigation is the act of providing water to the plant when and where it needs it and knowing the soil moisture levels are important. Improperly scheduling and poor system
irrigation at the wrong which can reduce growth and yield, or irrigation resulting in root rot or salinity problems. The pistachio tree is known to have
duction it is necessary to have adequate soil moisture. As with any other crop, there are critical periods when it is important not to under irrigate a pistachio orchard. The first of these occurs in the first stage of
f shell expansion. It is also unwise to cut water application

3
short in the third stage of growth between the periods of nut filling and hull slip (Goldhamer, 2005). Unlike with other tree crops like almonds pistachio tree are capable of deficit irrigation because they have a period of time from mid-May through June when nut development has slowed and the trees can withstand water stress. Unlike with conventional surface irrigation using furrows or borders, drip irrigation allows for deficit irrigation because of its ability to uniformly distribute the desired amount of water to each tree. Other benefits of drip irrigation include a reduced tendency for fungal disease problem, lower irrigation costs, and higher efficiencies.
Distribution Uniformity. Distribution Uniformity (DU) refers to how evenly water is applied to the area being irrigated. The most common method of measuring the distribution uniformity is known as the Low Quarter DU (DU lq). Cal Poly’s ITRC has developed a rapid evaluation procedure for the measuring the DU lq. This procedure uses a limited amount of sampling to estimate the fields overall distribution uniformity shortening the time it takes to complete the evaluation (Burt, 2004). This indirect estimate does not provide a precise measure of the DU because it does not take all system effects, soil differences, and emitter application rates into account. However from the standpoint of helping a farm improve the DU for their field this estimate is sufficient.
The low quart DU is computed by dividing the average low quarter depth of water received by plants by the average of water received by all plants in the field. For example, if measurements are taken at twelve locations the lowest three values would be the low quarter of the sample.
����� ����� �� � �� ����� �� �������� ����� �� ��� ����� ��� �� � ������
An element, as stated in the formula above, refers to the smallest area in a field that requires water but where the variation of distribution is not important (Burt et al., 1997).
Filtration Systems. Most modern drip irrigation systems employ some type of filtration to prevent clogging of the emitters flow path by small waterborne particles. The three types of filter generally used are sand media, screen, and disk. Screen filters are simple and relatively inexpensive, used most often for the removal of fine sands and large organic debris. These filtration systems are not well suited for use when large amounts of algae must be removed as they require frequent cleaning (Haman, 1998). Therefore these filters should not be used as primary filtration when surface water is being used. Disk filters consist of a stack of round disks covered in various sizes of small bumps. These bumps leave a small between the plates and filter out debris as water is forced between the disks. Some of these filtration systems come with a self-cleaning mechanism that separates the disks so that captured particles can be flushed out. Sand media filters have become commonly used in micro irrigation. These filters are capable of providing filtration to 200 mesh and can be used with either surface water of well water as they are capable of catching most fine grit and organic materials. Another benefit to of using this type of filter is their self-cleaning design. When the system detects a drop in pressure a back flush mechanism engages to wash foreign particles out (Haman, 1998).
Clogging Emitters. The clogging of emitters is a major problem in drip irrigation systems and can occur even when all of the factors relating to emitter are designed for a uniform water distribution, thus decreasing the DU. The three types of causes for plugged emitters are

4
biological, chemical, and physical. Biological clogging is normally caused by algae or various kinds of slime that bock the orifice. Chemical plugging happens when dissolved solids react with each other and precipitate inside the hoses. Physical contaminates that clog emitters are either organic; such as sand, clay and plastics that have gotten through the filtration system, or inorganic; such as animal residues. Factors that can increase clogging in a micro irrigation system are poor filtration, poor water quality, and/or running the system at insufficient pressure (Capra, 1998).
When the causes of clogging are known, steps can be taken to prevent or control the problem in the future. Modern filtration systems have vastly improved a farmers ability to remove much of the suspend debris from well water before it enters the system. However, filtration does not remove all suspended material from the system. Over time sediments will accumulate in the hoses and plug emitters. When filtration is not enough to prevent clogging chemical treatment of the water is a useful addition. Often chlorine or various acids are used to control microbial activity in irrigation hoses. Chemical treatment is a good method for prevention of plugging emitters but is not practical for the reclamation of emitter (Nakayama, 1991). This would require far too much material and it is likely that the chemicals would reach through the working emitters but not the plugged ones.
Pump and Well
Irrigation Wells. Aquifers are large underground reservoirs where 97% of the world’s fresh water can be found. A well is an excavation that is constructed as a way to retrieve that water for use on the surface (Haman, 1998). A typical well has a non-perforated pipe called a casing which has a screen at the bottom and rises to the surface.
Figure 3- Irrigation well diagram (Scherer,2005)

5
Well drawdown is the distance that the water level in a well drops from its height at the static water table after pumping starts. Because the water in the well is not replaced immediately there will always be drawdown. The amount of drawdown in a well depends on the well size and efficiency, aquifer properties, and pumping (Bowman,2003)
Well Rehabilitation. Water well performance deteriorates with time, due to clogging, corrosion, or changes in the aquifer condition. Rehabilitating a well and the surrounding aquifer formation should be a four-step process using a combination of mechanical tools and chemical treatment. In practice, chemical treatment and redevelopment often are done at the same time (Scherer, 2005). First a variety of brushes and swabs, along with a pump to lift out debris, are used to remove any encrusted minerals on the lining. Next a chemical treatment, often using acids meant to remove any biological material and minerals, is run through the well. The third step of the rehabilitation process is well redevelopment. Like when developing a well when it’s just been drilled, redevelopment removes any fine sand or mud that may have washed into the bore hole. However in this step it is also removing any leftover debris in the gravel pack and outside of the screen. Finally the well is chlorinated to kill any bacteria that may have been introduced during the rehabilitation process.
Motor. When selecting a power unit for an irrigation well there are many different factors that must be taken into consideration. To determine the actual horsepower requirement first the total dynamic head and the pumping rate must be found.
�� !" �#$!%&' ()!*+��(, -
- �� !" . ! &' /)!* 0 12)3342) ()!* 0 52&' &�$ ()!* 0 6)"�'& # ()!*
Water Horsepower (WHP) represents the power required if the pump and drive are 100% efficient.
7(1 - 8 9 ��(3960
8 - �&3'/!2>) &$ ?!""�$3 @)2 %&$4 ) The Brake Horsepower is the actual horsepower requirement at the drive unit. The continuous horsepower rating of the motor to be used must equal this value (Lundstrom, 1990).
A(1 - 7(114%@&$> 1"!$ BCC&'&)$'#
The pump efficiency is specific to the individual pump being used and can be obtained from the manufacturer. Various drive efficiencies varies with
If a previously used motor is to be used, the unit should be carefully checked, and have the condition, available horsepower, and speed evaluated. The use of an old or misfit power unit could be more costly in the long run than simply purchasing the proper motor for the system.

6
Pump. For an irrigation system to be as efficient as possible it is important to choose the proper pump to match the water source, water piping system, the flow rate needed and the total dynamic head. Head, a term commonly used when dealing with pumps, refers to the height of a vertical column of water. In irrigation pressure and head are interchangeable with the simple conversion factor of 2.31 to 1(Scherer, 1993).
2.31 C . �C /)!* - 1 @�4$* @)2 3G4!2) &$'/
Suction head is a value that includes the vertical suction lift in addition to any friction losses that occur through pipes and fittings that the water encounters prior to the inlet of the pump. Operating a pump beyond its suction lift limit can cause cavitation due to the impellors coming in contact with air (Scherer, 1993). The implosion of numerous bubbles, caused by cavitation, can wear out an impellor quickly. A pump curve is used to diagram the efficiency and characteristics of a pump. These diagrams are supplied by the pump manufacture and indicate the GPM verses the TDH at a specific RPM. When the desired flow rate and TDH are known these curves are used to select the proper pump for the irrigation system in in question. Overall Pumping Plant Efficiency. The overall pumping plant efficiency for a pumping station is represented as a ratio of the energy imparted into the water and the input power to the motor. Reasons for low efficiency include worn parts, improper adjustment, or failure to select equipment to match the specific pumping conditions (Leon, 1995). If a pump is selected based on some anticipated future condition it will deliver excess fluid at a higher head than necessary when new.
A throttling valve on the pump discharge is often set to turn down the flow when the pump is oversized. This method of throttling the output of the pumping station increases the inefficiencies of the irrigation system. Better methods include Impeller trimming, pump speed changes, and parallel or series pumping for more energy-efficient ways to reduce the energy waste associated with oversized pumps.

7
PROCEDURES AND METHODS
Research Procedure. I began my research using broad searches of drip system designs to better understand their benefits for pistachios. The overall study involved examining the following:
• DU Evaluation
• Pumping Plant Evaluation
• Irrigation Scheduling
I found that sand problems in micro-irrigation systems are usually solved by adding a higher quality filtration system such as sand media with a screen or disk filter before it to remove larger debris. This helps by cutting the amount of debris to be removed by the main filter and improves the chances of keeping your system clean. With this information I moved into tests and evaluations that I could use to discover the damage that has been done to the system that I am analyzing. With the distribution uniformity test that I will be performing I am able to gain a good estimate on how much sand is plugging the hoses, manifolds, and mainlines in the system.
Distribution Uniformity. The evaluation procedure that I used for the efficiency of the system was developed by Cal poly’s ITRC. Their rapid evaluation procedure for DU lq is a great way to estimate the distribution uniformity of the irrigation system that I am analyzing. To learn the procedures first hand I attended a lab session for the BRAE 438 class where a DU evaluation was performed at the Cal Poly vineyards. The data entry sheets for this evaluation can be found in appendix B.
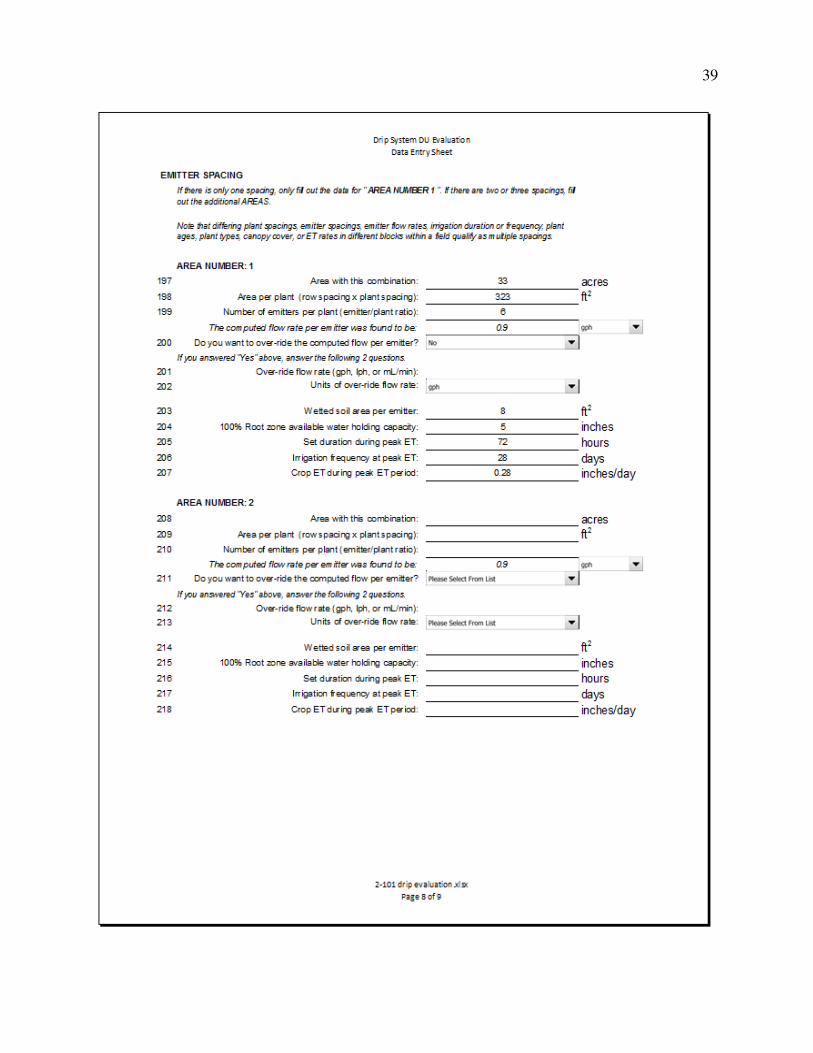
Data Collection. The data collection for the DU lq evaluation was performed at Borges Farms pistachio orchard. This orchard is comprised of 33 acres of pistachios spread between 3 fields split by an irrigation canal
.
Before going out to the field it was important for me to compile a number of maps of the plot. These maps showed the placement, in the field, of each measurement that I would be taking.
I began the evaluation by cleaning out the individual hoses and checking the
contaminants the came out of the hose furthest from the pumping station. A nylon sock was
placed over the end of this hose before the irrigation system was
Figure 4 DU Evaluation Location

8
turned on. As contaminant came out of the hose they were caught by the sock and examined to see what may be causing problems within the system. Next pressure measurements were taken at the filter station upstream and downstream from the filter. This was done to discover pressure losses due to the filter or any throttling valve that may be present. There is no manually adjusted throttling valve on this system but any pressure loss across the filter needs to be accounted for
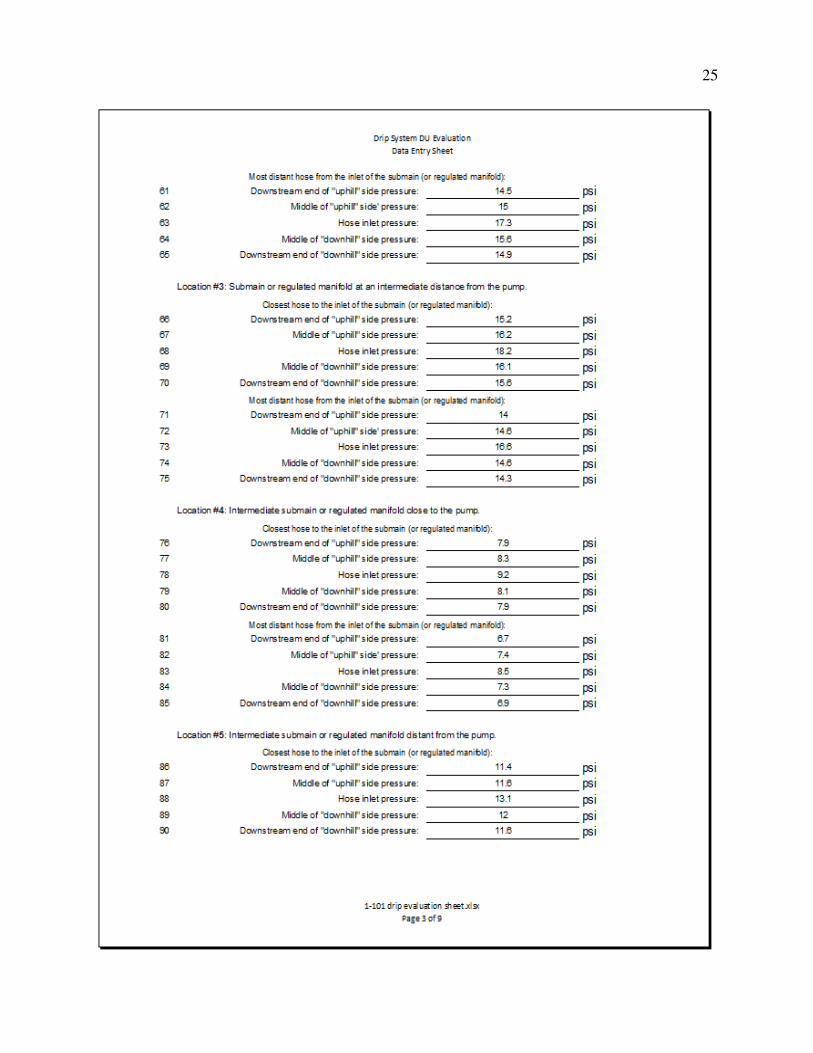
The first set of measurements to taken are meant to discover the DUlq as it relates to differences in pressure. I chose six locations throughout the field to gather pressure readings in the hoses. Location 1 is located closest to the pumping station and the readings for location 2 were taken from the manifold farthest downstream of the pumping station. The remaining locations are spread evenly along the main line. For a Diagram of these data locations see Appendix C. At each of these locations there were 10 pressure measurements taken, 5 on both the closest and most distant hoses from the inlet on the chosen manifold. On each of these hoses two pressure measurements were taken upstream of the manifold, two were taken downstream and one was taken near the inlet. Taking the pressure measurements involved making a small hole in the hose at the locations mentioned above and inserting a pitot tube connected to a pressure gauge. When taking these pressure readings it is important that the open end of the pitot tube is facing downstream so that the pressure reading isn’t affected by the flow coming through the hose. This process was repeated at the remaining five locations then all pressure measurements were compiled in the ITRC Drip System DU Evaluation Results Sheet (Appendix B).
After the first set of pressure measurements I adjusted all of the pressure regulators at the manifold inlets. By turning the screw shown in figure 5, I am able to control the amount of pressures across the field. Once this was finished I needed to retake the pressure measurements.
This should improve the distribution uniformity of the system a lot.
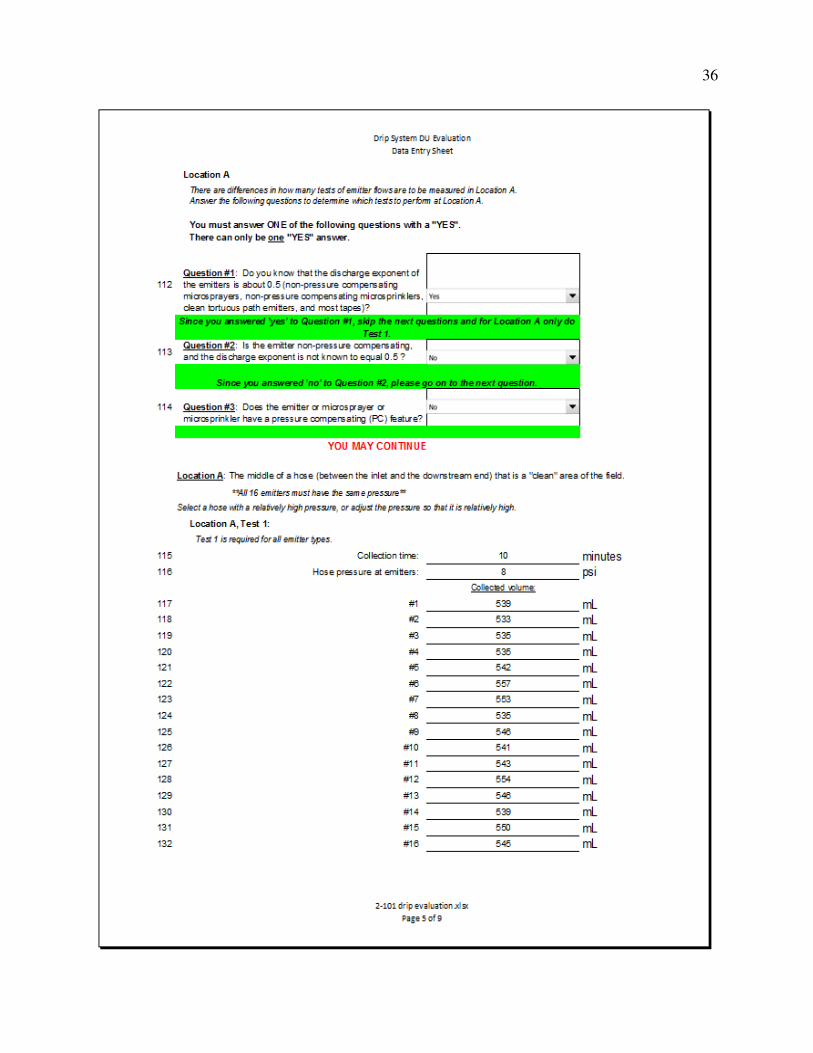
For the evaluation of the distribution uniformity due to differences in pressure, flow measurements were then taken at 3 different locations spread through the field. At the first two locations sixteen cups were spread to adjacent emitters on the drip line. These cups collected the water from the emitters for 5 minutes each. The amount of water collected was then measured in a graduated cylinder and recorded onto the DU evaluation spreadsheet. At the third and final location the evaluation process required that I
Figure 6- Flow Measurements
Figure 5- Pressure regulator at manifold inlet.
9
gather flow volume measurements from 28 adjacent emitters. In all of these flow tests I set up at least 1 additional cup to gather data in case a problem occurred with one of the other measuring cups in the test sample.
Pumping Station. For the evaluation of the pumping plant I collected pump tests from 2007 and 2011. From these pump tests I was able to collect the total dynamic head and the flow rate for each year the tests were performed. With this information I am able to calculate the water horsepower which is the energy imparted onto the water as it leaves the impellers and pump. This value and the total input horsepower are needed for calculating the efficiency of the pumping station. For each year I then calculated the overall Pumping Plant Efficiency and compared the two to see how the efficiency has been affected by the years of pumping sand (Appendix D).
The pumping station for that delivers water to this property has been steadily losing efficiency over the years due to sand problems. Just prior to the pistachio orchard being planted the motor and bowls were removes and replaced with bowls better suited for providing the head needed for the pressure system that would eventually be put in. the pumping station now includes a 60 HP energy saver motor coupled seven 9.25 inch bowls. The impellers contained within have been trimmed to 9.125 inches and are pumping at a depth of 180 feet. When data collection began I checked to see what contaminants were in the system and found a lot of sand. This leads me to believe that sand problems have continues through the years.
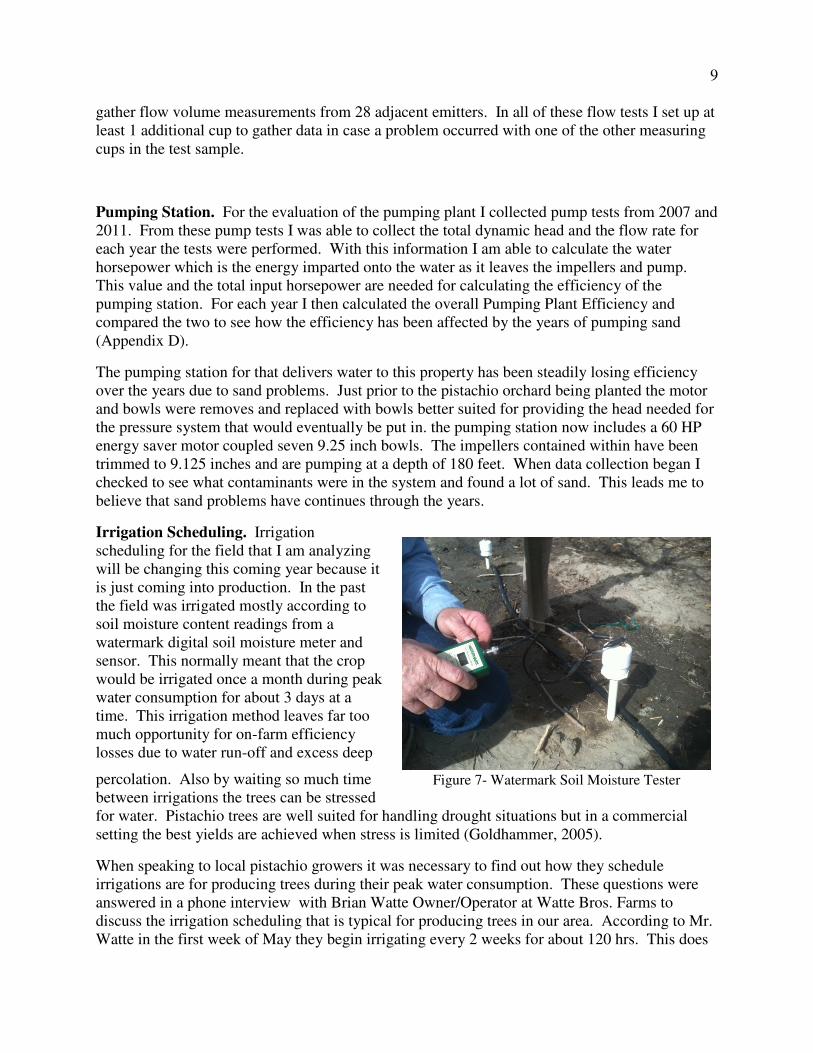
Irrigation Scheduling. Irrigation scheduling for the field that I am analyzing will be changing this coming year because it is just coming into production. In the past the field was irrigated mostly according to soil moisture content readings from a watermark digital soil moisture meter and sensor. This normally meant that the crop would be irrigated once a month during peak water consumption for about 3 days at a time. This irrigation method leaves far too much opportunity for on-farm efficiency losses due to water run-off and excess deep
percolation. Also by waiting so much time between irrigations the trees can be stressed for water. Pistachio trees are well suited for handling drought situations but in a commercial setting the best yields are achieved when stress is limited (Goldhammer, 2005).
When speaking to local pistachio growers it was necessary to find out how they schedule irrigations are for producing trees during their peak water consumption. These questions were answered in a phone interview with Brian Watte Owner/Operator at Watte Bros. Farms to discuss the irrigation scheduling that is typical for producing trees in our area. According to Mr. Watte in the first week of May they begin irrigating every 2 weeks for about 120 hrs. This does
Figure 7- Watermark Soil Moisture Tester

10
not match up with the ideal irrigation method in that it is best to irrigate more frequently for shorter periods of time. When asked about this Mr. Watte agreed that this would be the most efficient method however it is impractical especially as the system ages. As the system ages more parts and components begin to corrode and wear. Every time the system is turned on the initial surge of water causes parts to break. He says that if he irrigated more frequently to improve the efficiency he would lose money with the time required to make repairs. After checking with other pistachio growers in the area it became clear that most others follow a similar schedule.
Well Rehabilitation. After discussing well rehabilitation methods with various companies including Valley Pump and Dairy Supply in Tulare and Grosch Irrigation Company incorporated it was found that there are no ways to rehabilitate a well that has sand problems without pulling out the pump to replace the bowls. This is a very costly process as it requires having a pump installation company to come out. They would have to use a truck with a crane on it to pull out the column and shaft joint by joint then remove the bowls from the end. This process normally requires at least a full working day to complete then most of another day to replace into the well. Because it is a lengthy process the labor cost is expensive on its own.
Cost Analysis. The cost analysis portion of my project looked at the costs involved with removing a pump to replace the bowls and impellers. The problem with trying to find a price quote from a pump installation company for this procedure is the number of variable costs involved. These variables need to be taken into account when budgeting for pump or well repair.
The base price for pulling a pump, column, and shaft from a well is about $1,500.00. All that this price includes is the cost for getting the crew and truck out to the field and the time required. From there you must also consider any shaft bearings that have gotten worn out over the years of use. As the pump and column are pulled out these bearings must be checked and replaced when necessary. Next the impellors must be checked to see if all need to be replaced. Though since the pump is already out of the well it is best to replace all of them if any are worn.
Since the pump has already been removed from the well this is a good time to send a camera down the well. This will show any corrosion or holes in the outer casing and offers an excellent chance to check the condition of the well screen. If the screen is plugged or worn repairs should be made before the new bowls are replaces. Putting the pump back into the well always takes longer than pulling it out. This additional time involved raises the typical price for installing a pump to about $2,000.00. When all of the materials, time, and equipment are paid for it is not unusual for this procedure to cost well over $6,000.00, a costly endeavor for any size of farm.
Figure 8- Sand Worn Impeller

11
RESULTS
Distribution Uniformity. When the pressure tests for the DU evaluation were first performed it was clear that there were large differences in the pressure at different manifolds along the main line. Normally this problem could be attributed to any number of problems in the system. However, the fact that these pressure differences seemed located at the manifold inlets lead me to believe that it may be less complicated than originally anticipated. Along each manifold the pressure measurements were fairly uniform the only real problems occurred along the mainline. This lead me to believe that the pressure regulators located at the inlet to each manifold may be out of adjustment. Once adjustments were made and all of the pressure regulators relatively uniform a second set of pressure measurements were taken. This simple adjustment of the pressure regulators brought the Distribution uniformity of the system up from 75% after the first test to 95% after the second. On the second test 85% of the uniformity problems occurred due to differences in pressure and 13% was due to differences in flow. Other problems that I found in the system are a large pressure difference through the filter station. The reasons for this pressure loss will be covered later in the report during the discussion portion.
Table 1- Pressure Test Results

12
Pumping Station Efficiency. The Overall pumping station efficiency (OPPE) was calculated for a pump test taken in 2007. The water horsepower (WHP) for this year was calculated to be 25.37hp. The WHP is needed because it is one of the components needed to compute the OPPE. The OPPE from the 2007 pump test was computed to equal 45.06.
The same calculations were then done for another pump test performed in January of 2011. The WHP computed from this test equaled 21.5 hp. With this value I calculated the OPPE for the 2011 pump test to be 41.51%. This means that in the 4 years between the two tests the pumping plant has lost a total of 3.55% efficiency.
Table 2- Hydraulic Test Results
Motor Selection. For the motor selection portion of this project I first needed to calculate the required total dynamic head for the irrigation system. With this value along with the flow rate I am able to calculate the water horsepower needed. The water horsepower divided by the overall pumping plant efficiency that was calculated in the previous section gives me the Brake Horsepower required from the motor. The Brake horsepower value that I got from my calculations is 64.2 hp. With this required horsepower I could be able to use a 65hp motor but if I select this size of motor I would be counting on the safety factor of the motor to be able to handle any increases in static lift when the water table drops over time. It is for this reason that I would prefer to use a 70hp motor. The calculations for the motor selection can be viewed in appendix D.
Irrigation Scheduling. The typical irrigation schedule used by pistachio growers in the area where these tests occurred does not match with the ideal schedule we learn to follow in our irrigation classes. In the field at the time of peak irrigation need local farmers tend to irrigate once every 2 weeks for 120 hours each irrigation.

13
Table 3 Irrigation Schedule for Mature Pistachios
The table above shows both the proper irrigated schedule calculated for the pistachio grove analyzed. Formulas for these calculations can be found in Appendix D. After analyzing the results of these calculations it was decided that it would be best to irrigate once a week during the months of March and April for 10 hours each time. From May until October it would be best to split the irrigations to twice a week for half of the weekly time listed for that month in the table above.

14
DISCUSSION
The first set of pressure measurements taken to find the Distribution Uniformity due to differences in pressure showed that the pressure regulators found at the inlet of every were out of adjustment. This action alone was enough to raise the distribution uniformity of the system from a poor 75% to an excellent 95%. Though I was not able to get the pressures up to the ideal operating pressure for the system (16PSI), I was able to get them to stabilize near 13.5 PSI. This means that the pumping station is unable to provide the pressure needed for the irrigation system to operate at peak performance. After looking at the results of the testing performed I believe that there are two problems occurring that need to be corrected. First I believe that the impellers on the pump have been worn out after drawing too much sand through them. When looking at the drop in overall pumping plant efficiency we see the effects of this wear. The only other possible cause of the efficiency loss would be an increase in static lift. However, the winter prior to the final pump test used for the calculations was one of the wettest we have had in the last decade. Because it was a wet year the water levels in that aquifer had risen 20 feet, eliminating the possibility of a rise in static lift.
The next problem that I found came up when I was calculating the proper motor size to achieve the amount of water horsepower we need to supply the system. According Soults Pump, the company who installed the current pumping station, the current motor is rated to produce 60 horsepower. The calculations that I did, for the system requirements of 38 psi and 468 gallons per minute, tell me that at a minimum the station requires 64.2 hp. This is more than the 60 hp motor is capable of producing and if it exceeds its load rating in an attempt to meet the horsepower requirements it will likely burn out.

15
RECOMMENDATIONS
As the tests above show any current problems with this irrigation system lie within the pumping station and not the drip system. However, I do believe that it would be best to continue performing these DU evaluations every 2-3 year to monitor the health of the system.
As far as the well and pumping station are concerned, if Borges Farms wishes to get peak performance out of this irrigation system it would be best to pull the pump to replace the bowls. While the pump is out is would be best to inspect the casing and the screen by sending a camera down the well. When the pump is replaced I would also advise replacing the existing motor with a larger 70 horsepower unit. This increased horsepower will be useful in future years as water tables around the valley continue to fall.
Other options for Borges Farms to look into concerning the sand problems in the well would be to to remove the pump and drop a camera down the well to look for worn sections of the casing and to see if there are holes in the well screen. Either of these problems would allow sand into the well and make replacing the impellers a useless act.
To prevent any future sand problems in the well from becoming problematic for the irrigation system it would be a good preventative measure to add a sand separator before the filtration system. This would also stop sand wear problems in the filter element.

16
REFERENCES
Bowman,Brian., S. Shukla, and J.D. Hardin. 2003. Design and Construction of Screened Wells for Agricultural Irrigation Systems. EDIS University of Florida
Burt, C. M. 2004 . “Rapid field evaluation of drip and microspray distribution uniformity.” Irrig. Drain. Syst., 18, 275–297.
Burt, C.M., Clemmens, A.J., Strelkoff, TS., Solomon, KH., Bliesner, R.D., Hardy, L.A., Howell, TA. &Eisenhauer, D.E. 1997. Irrigation performance measures-efficiency and uniformity. Journal ofIrrigation and Drainage Engineering ASCE 123(6): 423-442.
Capra, Antonia, and B.Scicolone. "Water Quality and Distribution Uniformity in Drip/Trickle Irrigation Systems." SciVerse. Journal of Agricultural Engineering Research, 4 Feb. 1998. Web. 8 Feb. 2012.
Chavez, J.L., D. Reich, J.C. Loftis, and D.L. Miles. 2011. Irrigation Pumping Plant Efficiency. Colorado State University. No. 4.712
Cote, Claire , K.L. Bristow, P.B. Charlesworth, F. J. Cook, and Peter J. Thorburn. "Analysis of Soil Wetting and Solute Transport in Subsurface Trickle Irrigation." Irrigation Science (2003): 143-56. Print
Goldhamer, D.A. 2005. Irrigation Management chapter of University of California Pistachio Production Manual. pgs 103-116.
Goldhamer, D., B. Beede, T. Prichard, B. Sanden, and L. Schwankl. Irrigation Water Management in Trees. UC Drought Management. University of California. Web. 26 Oct. 2011
Haman, D. Z., and F. S. Zazueta. "Media Filters for Trickle Irrigation in Florida." EDIS. University of Florida, Oct. 1998. Web. 27 Oct. 2011
Kirnak, H., B.E. Ak, and I. Acar. 1998. Irrigation and irrigation management strategies of pistachio orchards.
Leon,L. 1995. Pumping Plant Efficiencyand Irrigation Costs. Texas Agricultural extension Service. L-2218.
Lundstrom, Darnel R. 1990. Irrigation Power Unit Selection. North Dakota State University, Feb. 1990
Nakayama, F.S., and D.A. Bucks. "Water Quality in Drip/trickle Irrigation: A Review." Irrigation Science 12.4 (1991). Print. Scherer, Thomas. 2005. Care and Maintenance of Irrigation Wells. North Dakota State Univerity. AE-97. July 2005
Scherer, Thomas. 1993. Irrigation Water Pumps. North Dakota State University. AE-1057. April 1993

17
Yetis Yavuz, M., and K. Demırel. 2010. Emitter Clogging and Effects on Drip Irrigation
Systems Performances." Academicjournals.org. African Journal of Agricultural Research, 4 Apr. 2010

18
APPENDIXES

19
APPENDIX A
Senior Project Contract

20
C a l i f o rn i a P o l y t ec h n i c S t a t e U n i ve rs i t y 11-03-2011
BioResource and Agricultural Engineering Department Borges, Greg
ASM Senior Project Contract 004250086 ASM
Project Title
Irrigation System and Pump Efficiency
Background Information
About 5 years ago Borges Farms decided it was time to become more diverse in the crops they grow. This led to the planting of their first 20 acres of pistachios. When these trees were planted the well on the property was very old and had already begun to pump sand along with the water that had been used for flood irrigation in the past. The sand did not cause problems within the flood or drip irrigation system initially. This drip system is made up of 1/2” tubing and small micro emitters. These micro emitters are calibrated to deliver a specified amount of water to each tree and can easily plug due to the small orifice. The following year another 15 acres of pistachio were planted at the same ranch requiring the pump to provide more water. The irrigation system had been designed with these expansion plans taken into account so that it could filter and transport the extra water volume needed. During the last couple years the grower has noticed more problems have been occurring with sand plugging up emitters and filters. Extra in-line filters have been added in hope of curbing the sand problem but they find that they plug quickly and must be rinsed out often.
Statement of Work
The first phase of this project will be collecting and analyzing pump tests from the existing pump assembly. The second phase of the project will be testing the distribution uniformity of the existing irrigation system. The third phase of the project is to compare available filtration systems to the one currently in use. The fourth phase of the project is to find the pump assembly that would be best for the irrigation system and analyze the costs of installation. The Fifth phase of the project is to present long-term recommendations to the grower.
How Project Meets Requirements for the ASM Major
ASM Project Requirements - The ASM senior project must include a problem solving experience that incorporates the application of technology and the organizational skills of business and management, and quantitative, analytical problem solving.
Application of agricultural technology
The Project will involve the application of mechanical systems and irrigation design.
Application of business and/or management skills
The project will involve business/management skills in areas of cost and efficiency analysis.
Quantitative, analytical problem solving
Quantitative problem solving will include the cost analysis, system efficiency analysis, and calculations needed to select the pump needed.
Capstone Project Experience - The ASM senior project must incorporate knowledge and skills acquired in earlier coursework (Major, Support and/or GE courses).
Incorporates 129 Lab Skills/Safety, 133 Engineering Graphics, 151 AutoCAD, 152 Solid

21
knowledge/skills from earlier coursework
works, 301 Hydraulic/Mechanical Power Systems, 321 Ag Safety, 340 Irrigation Management, 418/419 Ag Systems Management
ASM Approach - Agricultural Systems Management involves the development of solutions to technological, business or management problems associated with agricultural or related industries. A systems approach, interdisciplinary experience, and agricultural training in specialized areas are common features of this type of problem solving. (insert N/A for any area not applicable to this project)
Systems approach The project involves the integration of Mechanical and Irrigation systems to improve system efficiency for a pistachio grower.
Interdisciplinary features The project incorporates aspects of mechanical systems, irrigation management, and system analysis.
Specialized agricultural knowledge
This project incorporates specialized knowledge of mechanical and irrigation systems.
Project Parameters
1. The drip irrigation system cannot be modified to fit the pump chosen.
2. The drip systems must be more efficient after change.
3. The grower must approve all changes proposed.
4. Must show if any changes are cost effective.
List of Tasks and Time Estimate
TASK
-Research in Library on Drip Irrigation, Irrigation Pump Assemblies, and Irrigation Management
-Evaluating the existing irrigation system
-Evaluating existing pump
-Consultation with Drip Irrigation Companies
-Visitation of pistachio growers to discuss Irrigation Scheduling
-Calculations that influence Motor selection
-Preparation of written report
TOTAL
Hours
30
8
6
4
10
8
40
______
106
Financial Responsibility
Preliminary estimate of project costs: $ N/A
Finances approved by (signature of Project Sponsor):
Final Report Due: June 6, 2012 Number of Copies: 3
Approval Signatures Date
Student:
Proj. Supervisor:
Department Head:

22
APPENDIX B
Data Entry Sheets

23
Pressure Test 1

24
25

26

27

28

29

30

31

32
Pressure Test 2

33

34

35
36

37

38
39

40

41

42

43

44
APPENDIX C
Pressure and Flow Test Locations

45

46

47
APPENDIX D
Calculations

48
DU Formulas ����� ����� �� � �� ����� �� ���
����� ����� �� ��� ����� ��� �� � ������
DU due to Differences in Pressure
����∆I - JKL>. "�M G4!2 )2 )3 &%! )* C"�M3KL>. !"" )3 &%! )* C"�M3 N
Estimated Flow= 1O
DU due to Other Causes
����PQRST - 1 U 1√$ +1 U !L)2!>) 8��
8!L>,
!L)2!>) 8��8!L> - ��WSXQ Y��WSXQ Z��WSXQ [
3
DU due to Uneven Spacing
����∆I - JKL>. "�M G4!2 )2 )3 &%! )* C"�M3KL>. !"" )3 &%! )* C"�M3 N
This equals 1.0 because all of the emitters, rows, and trees in the have the same spacing.
DU due to Unequal Drainage
����∆I - 1 U J)\ 2! %&$4 )3 �C �@)2! &�$ C�2 3�%) )%& )23KL> 3) *42! &�$, %&$4 )3 N
This DU component has minimal effect upon the field DU except on fields that are located on a hillside. This field was laser leveled prior to planting 6 years ago so I am sure that it is level.
Pump Efficiency Calculations
7(1 - 8 9 ��( 3960�
^11B - 7(1_$@4 (1
2007
7(1 - 684 9 146.9 3960� - 25.37/@
^11B - 25.3756.3 9 100 - 45.06%

49
45.06%
2011
7(1 - 558 9 152.6 3960� - 21.50/@
^11B - 21.5051.8 9 100 - 41.51%
41.51%
45.06% U 41.51% - 3.55%
Efficiency loss of 3.55%
Motor Selection Calculations �� !" �#$!%&' ()!* - . ! &' e&C 0 �2!M*�M$ 0 �&3'/!2>) ()!* 0 6)"�'& # ()!*
A2!f) (�23)@�M)2 - 7(114%@&$> 1"!$ BCC&'&)$'#
��( - 126.9C 0 10.7C 0 +38@3& 9 2.31, 0 .14C - 225.52 C
g)G4&2)* 7(1 - 468 9 225.52 3960� - 26.65 /@
A2!f) (�23)@�M)2 - 26.65. 4151 - 64.2
Needs at least a 70 HP motor
Irrigattion Scheduling Formulas
?1h/�2)) - ?1h B%& )2�
# B%& )23 �2))�
?2�33 K@@"&)* - B�k 0.85�

50
(23/�!# - ?2�33 K@@"&)* 9 �2)) .@!'&$>?1h �2))� 9 96.3
(23 7))f� - (23 �!#� 9 7 �!#3

51
APPENDIX E
DU Evaluation Tools Required

52
Figure 10- Pitot Tube and Pressure Gauge
Figure 11- Small Tube Hole Punch
Figure 9- Goof Pulg

53
Figure 12- Graduated Cylinder
Figure 13- 28 Clear Plastic Buckets

54
APPENDIX F
Pumping and Filtration Station

55
Figure 14- Pumping and Filtration Station

56
Figure 15- Fertigation Injection Site