irrigation and watershed management case study in madagascar
TRANSCRIPT

On-line resource materials for policy making
Ex-Act Software for Carbon-Balance Analysis of Investment Projects
Irrigation and Watershed Management Case Study in Madagascar
Provisional version
EASYPol Module 263

Ex-Act Software for Carbon-Balance Analysis of Investment Projects
Irrigation and Watershed Management Case Study in Madagascar by Louis Bockel, Policy Assistance Support Service, Policy and Programme Development Support Division,FAO, Rome, Italy Hermann Joseph Pfeiffer, Investment Officer, Investment Centre, Food and Agriculture Organization of the United Nations, FAO, Rome, Italy Marianne Tinlot, FAO Consultant, FAO, Rome, Italy for the FOOD AND AGRICULTURE ORGANIZATION OF THE UNITED NATIONS, FAO
About EASYPol EASYPol is a multilingual repository of freely downloadable resources for policy making in agriculture and rural development and food security. The EASYPol home page is available at: www.fao.org/easypol. EASYPol has been developed and is maintained by the Policy Assistance Support Service, FAO.
The designations employed and the presentation of the material in this information product do not imply the expression of any opinion whatsoever on the part of the Food and Agriculture Organization of the United Nations concerning the legal status of any country, territory, city or area or of its authorities, or concerning the delimitation of its frontiers or boundaries.
© FAO May 2010: All rights reserved. Reproduction and dissemination of material contained on FAO's Web site for educational or other non-commercial purposes are authorized without any prior written permission from the copyright holders provided the source is fully acknowledged. Reproduction of material for resale or other commercial purposes is prohibited without the written permission of the copyright holders. Applications for such permission should be addressed to: [email protected].
On-line resource materials for policy making

Acknowledgements
This module is part of a set of documents which aim at providing support to project developers in the process of learning and applying the EX-Ante Carbon balance Tool (EX-ACT). This case study has been developed as a result of the application of EX-ACT to a FAO Programme in Madagascar, which was selected to test the software.
The analysis described in the module is the result of the work of a team of professionals from FAO: Louis Bockel, Economist, group leader of the EX-ACT team; Martial Bernoux, FAO Consultant from IRD, main designer of the software; Giacomo Branca, Project analyst and Economist; Hermann Pfeiffer, Project formulation expert for the Tanzania case; and Marianne Tinlot, case study practitioner.
The authors would like to acknowledge with thanks the contribution of Paola Landolfi who reviewed the first draft of this module.


EX-ACT Software for Carbon Balance Appraisal of Investment Projects Irrigation and Watershed Management Case Study in Madagascar
Table of contents
1. Summary ...................................................................................1
2. Introduction ...............................................................................1
3. Project Description ......................................................................2
3.1. Background .........................................................................2 3.2. Project characterization.........................................................3
4. Measuring the Mitigation Potential of the Project: An Application of EX-ACT...........................................................................................5
4.1. Decreasing the rate of deforestation .......................................6
4.2. Widening forested areas........................................................7
4.3. Developing agroforestry areas................................................7
4.4. Improving annual crops.........................................................8
4.5. Improving rice crops.............................................................9
4.6. Restoring grassland ............................................................10
4.7. Improving lands with inputs.................................................11
5. EX-ACT Results .........................................................................13
5.1. Land use and changes.........................................................13
5.2. Project C-balance analysis ...................................................14
5.3. Economic analysis and use of generated carbon funds .............15
6. Scenario Analysis ......................................................................17
6.1. Simulate project options : resizing watershed component ........17
6.2. Results .............................................................................18
6.3. Economic analysis and use of generated carbon funds .............19
7. Conclusions ..............................................................................19
8. Readers’ Notes..........................................................................19
9. Further References ....................................................................20

EX-ACT Software for Carbon Balance Appraisal of Investment Projects Irrigation and Watershed Management Case Study in Madagascar
1
1. SUMMARY
This module presents a Case Study of a Carbon-Balance Appraisal for an investment programme. It is useful for people who wish to improve their skills on how to estimate the climate change mitigation potential of agricultural programmes/projects and how to integrate it into the economic analysis of projects. This case is part of a set of documents which intend to provide support project developers in the process of learning and applying the EX-Ante Carbon balance Tool (EX-ACT). More specifically, the EX-ACT application was tested on a FAO Programme in Madagascar and the results are demonstrated in this Case Study, which consists of a brief description of the project, guidelines for structuring project data and an appendix with project data.
2. INTRODUCTION
Objectives
The main objective of this module is to illustrate the results issued from a real case project (although simplified), starting with row data. Due to the fact that this exercise puts the user in a situation somehow similar to a real case faced by Carbon Balance Appraisal, it can be used in a training course, where it is not possible to organize field visits to gather data for a practical application of the EX-ACT software.
Target audience
This module targets current or future practitioners in formulation and analysis of investment projects, working for public administration offices, NGO’s, professional organizations or for consulting firms. Academics may also find this material useful to support their courses in Carbon Balance Analysis and development economics. Furthermore, students can use this material to improve their skills in Climate Change Mitigation and to complement their curricula.
Required background
To fully understand the content of this module the user must be familiar with: Concepts of climate change mitigation and adaptation Concepts of land use planning and management Elements of project economic analysis
Readers can download the EX-ACT Tool and related flyer1. Links are included in the text to other EASYPol modules or references2. See also the list of EASYPol links included at the end of this module. 1 EASYPol Module 210: EX-ACT tool EX-ACT Brochure
2 EASYPol hyperlinks are shown in blue, as follows: a) training paths are shown in underlined bold font b) other EASYPol modules or complementary EASYPol materials are in bold underlined italics; c) links to the glossary are in bold; and d) external links are in italics.
EASYPol Module 263 Analytical Tools
2
Analytical steps of Carbon-balance ex-ante appraisal
The Ex-ante appraisal of Carbon balance of agriculture projects is a process made up of three main steps: i) Project data collection and organization
• current land use together with land use changes in the “without project” and “with project” scenarios, with description of the relevant farming systems, livestock production, input use, and other project investments;
• land management options which will be promoted within every sub-sector (forests, cropland, grasslands, ...)
ii) Estimation of project Carbon-balance using EX-ACT iii) Description of the scenarios, analysis of the results, and economic analysis.
3. PROJECT DESCRIPTION
This Case Study illustrates the use of the Ex-Act Software in the analysis of a rural development project.
3.1. Background
Country information. Madagascar is a southern African island in the Indian Ocean, located to the east of Mozambique. With a total area of 587,041 km2, it is divided into 22 regions (faritra). The estimated population for 2009 is about 20,7 million inhabitants (CIA, 2010) 29% of whom live in urban areas. Agriculture, Rice and Irrigation. Agriculture forms the foundation of Madagascar’s domestic economy. It contributes to about one third of the total GDP and to 40% of total exports. About three quarters of the population depend on agriculture for their livelihood. About one-half of Madagascar includes cultivable land, but little more than 5% of the land is currently used for crops, with a large part of the cultivated area used for irrigation (about 40%). Rice is the main staple crop, accounting for 70% of total farm output. Land degradation, natural resources and land development. Land degradation is one of the most serious and widespread problems for the agricultural sector in Madagascar. The degradation dynamics in the uplands and lowlands are often linked and undermine each other. With the stagnation of yields in the irrigated lowland areas and demographic growth, farmers have extended their agricultural activities to the hillsides. Upper watershed land use is often based on extensive and unsustainable management practices, the most important being the lack of erosion control and lack of soil fertility management on agricultural plots, slash and burn agriculture (tavy), and the frequent burning of pastures.

EX-ACT Software for Carbon Balance Appraisal of Investment Projects Irrigation and Watershed Management Case Study in Madagascar
3
Land degradation is also caused by deforestation for agricultural purposes, causing increased carbon emissions, biodiversity loss and declining regulatory ecological services. These practices not only contribute to the degradation and low productivity of highland areas but also have a significant impact on lowland agriculture. Highland soil erosion and water surface run-off also cause sedimentation for downstream infrastructure, contributing to the reduction of cultivated, irrigated areas, local flooding of rice paddies in rainy seasons and water shortages in dry seasons. In this situation, the Irrigation and Watershed Management Project intends to accelerate economic growth in rural areas, through an integrated effort aimed at increasing productivity in high potential production zones that benefit from public irrigation systems. Watersheds form integrated geographical management units with irrigation schemes: failure to address synergies between the two has lead to missed opportunities and reduced returns on investments. This project proposes to address the productivity of agriculture in both the irrigated lowland areas and rainfed watersheds, while capturing the environmental externalities associated with a more sustainable land use and management. The integrated design of the project is based on similar projects in Madagascar financed by FAO and Agence Française de Développement (AFD), and on an Africa Land and Water Initiative pilot project in Anjepy.
3.2. Project characterization
Irrigation investment operations in Madagascar have had mixed experiences. While investments were generally justified in terms of increase in production, sustainability has been far from sure. The project focuses on increased production and higher value, but in particular on translating higher income into better maintenance of infrastructure through capacity strengthening and improving governance of hydraulic assets. In addition, the project invests in upper watersheds to promote sustainable land use practices, which are expected to deliver higher production of rainfed agriculture, while at the same time reduce sedimentation and thus reduce maintenance costs. The project thus adopts a three-pronged strategy: (i) increase production and farmers’ income, (ii) set up mechanisms for sustainable irrigation maintenance; and (iii) reduce irrigation maintenance costs. The strategy is based among others on the experience of the BV-Lac project in PC15/Marianana (Lac Alaotra) and the GTZ-funded project in Marovoay. The development objective of the Project is to establish the basis for viable irrigated agriculture and natural resources management in four rural ‘growth poles’: (i) Andapa (Sava Region), (ii) Marovoay (Boina Region), (iii) Itasy Region, and (iv) Lac Aloatra (Alaotra Mangoro Region). These four zones are characterized by medium- and large-scale public irrigation where a number of conditions have been met to ensure a rapid kick-off of growth, including relatively easy access by road, and better access to finance, inputs, markets and equipment. The total cost of the project is estimated at US$40.5 million, to be financed by IDA, GEF and beneficiaries. The project covers about 134,200 ha, organised as follows: irrigated rice = 21,800 ha; annual crops = 12,400 ha; watershed landscape = 100,000 ha; grassland = 40,000 ha; degraded land = 25,000 ha; and forestry shrubland = 35000 ha. .

EASYPol Module 263 Analytical Tools
4
The proposed project will be implemented over a period of 10 years and will comprise the three technical components covering major strategic orientations: (i) Development of Commercial Agriculture; (ii) Irrigation Development; (iii) Watershed Development; Table 1: Overview of the project
N.beneficiaries 30,000 households (at full implementation)
Duration Implementation phase: 10 years Capitalization phase: 10 years
Budget 40.6 Millions US$
Comp.1 Development of commercial agriculture (13 M.)
Comp.2 Irrigation devt (17.8 M)
Comp.3 Watershed development (5.2 M)
Comp.4 Programme Management + others (4.6 M)
Areas targeted 21,800 ha of irrigated rice
12,400 ha of other annual crops,
75,000 ha of watershed landscape
The table below provides a land use situation in with and without project situations. It corresponds to the basic data required to appraise the carbon balance of the proposed project. It can be useful for practitioners who want to use the case study as a practical exercise. Table 1 bis: Basic data to enter in the EX-ACT tool within the proposed project Annual rainfed cropping - ha start without project with project used technics
system 1 – unchanged 12400 12400 0 residue burning system 2 – improved 0 0 7700 zero-tillage residue
management
Total 12400 12400 7700 Annual off-season cropping – ha start without project with project system 3 – improved 0 0 4700 improved irrigation
Total 0 0 4700
Rice flooded – ha start without project with project
system 1 – unchanged 13080 13080 9156 continuously flooded during cultivation
system 2 – improved 0 0 3924 SRI interim flooded
Total 13080 13080 13080
Forestry – ha start without project with project slow down deforestation: evolution of forest area 35000 29000 31000 forest 4
afforestation on degraded 0 0 2250 plantation 2

EX-ACT Software for Carbon Balance Appraisal of Investment Projects Irrigation and Watershed Management Case Study in Madagascar
5
land
Total 35000 29000 33250
Grassland start without project with project
Degraded grasslands 40000 40000 37500
Improved grasslands 0 0 2500 with inputs improvement
Degraded land start without project with project
Unchanged Degraded land 25000 25000 25000
Degraded land to perennial 1500
Irrigation – ha start without project with project
Hand moved sprinkle 0 4700
Total 0 4700
Inputs start without project with project
urea 200 200 1111
phosphorous 92 138 625.6
herbicides 5 5 37
DAP (T) 200 300 1,360
4. 4. MEASURING THE MITIGATION POTENTIAL OF THE PROJECT: AN APPLICATION OF EX-ACT
This section describes the effects of project activities on GHG emissions and C sequestration indicating the overall impact on the C balance, computed using EX-ACT. The analysis takes into account the three components presented before which supports all technical activities foreseen by the project, and which is therefore expected to have a relevant impact on the carbon balance:
• Reducing the current deforestation
• Widening forested areas
• Developing agroforestry
• Improving annual crops
• Improving rice crops
• Restoring grasslands
• Improving land with inputs
• Investing in some irrigation system The project foresees to develop forestry areas by reducing the current deforestation rate and by restoring degraded lands with tree plantations. It should allow for the protection of watersheds by reducing erosion and sedimentation, but also by sequestrating carbon, which should impact positively on carbon balance.
The project will also promote the adoption of improved agricultural practices in annual crops which should allow for both an increase in yields and a reduction in carbon emissions. Improving annual crops is expected through sustainable intensification and

EASYPol Module 263 Analytical Tools
6
diversification of irrigated and rainfed agricultural systems in the project’s watersheds. Improved practices will consist mainly in adopting new measures in irrigation and also foster the abandon of the tillage practice.
These activities should ensure an increase in productivity in a conservative approach that strengthens the management of natural resources to improve the environment and living conditions. It should generate substantial financial and economic benefits.
Due to the broad land cover of the project, data entered to describe the climate pattern and soil properties, do not take into account the large inter and intra regional variability of pedo-climatic conditions. The climate is described as Tropical, with a Mean Annual Temperature (MAT) of 22°C and under a Moist moisture regime. These settings correspond to average temperatures and rainfalls for the country. We chose to describe the area soil type as LAC (Low Activity Clays), the most representative type for the country.
As mentioned above, the project will be implemented over a 10-year period. The carbon accounting method also integrates a capitalisation phase (10 years) which should cumulate to 20 years when summed to the project implementation phase.
A complete description of the activities carried out and the corresponding EX-ACT analysis is provided below.
4.1. Decreasing the rate of deforestation
The project covers 35,000 ha of tropical shrublands. Most of time deforestation leads to degraded lands making watersheds more vulnerable to any impact due to climate change. Without the intervention of a project it is expected that the forested area will decrease by about 17%. With the project, it is expected that only 11% of the current forests will be deforested. This activity is taken into account in the “deforestation” EX-ACT module. Thus, deforestation has been entered to show a slow down of 2,000 ha due to the project that should ensure a reduction in carbon emissions. Changes are considered as linear in both scenarios. Table 2: Screendump of the EX-ACT “deforestation” module
Conversion details (Harvest wood product exported before the conversion, use of fire, final use after conversion)
Vegetation Type HWP bifore Fire use Final Use after Biomass
Name tonne
t C exported yes/no
% released deforestation 1 yr after
Defor. 1 Forest4 0 0 NO 0 Degraded 1.0 … GHG emissions Vegetation Type Forested Area (ha) Area deforested (ha) Biomass loss Start Without Project With Project Without With Without With t0 End Rate End Rate tCO2 tCO2 Defor. 1 35000 29000 Linear 31000 Linear 6000 4000 1093620 729080

EX-ACT Software for Carbon Balance Appraisal of Investment Projects Irrigation and Watershed Management Case Study in Madagascar
7
4.2. Widening forested areas
This activity concerns watershed areas and is accounted in EX-ACT in the “afforestation/reforestation” module. On the one hand, the project is expected to take a lead in planting 2,500 ha of tropical moist deciduous forest (called plantation 2 in EX-ACT) that would have been remained as degraded lands if no project was implemented. It should tackle soil degradation, act on water management for lowlands and mitigate climate change. Table 3: Screen dump of the EX-ACT “afforestation/reforestation” module Conversion details (Previous land use, use of fire before afforestation/reforestation,...) Vegetation Type Soil Name
Previous use before afforestation/reforestation
Burnt before conversion
Default Biomass
Specific Biomass ksoil
A/R1 Plantation1 Set Aside NO 5.0 0.82 A/R2 Plantation2 Degraded Land NO 1.0 0.33 A/R7 Degraded land Degraded Land NO 1.0 0.33 GHG emissions Vegetation Type Afforested or reforested Area (ha) Area afforested (ha) Start Without Project With Project Without With t0 End Rate End Rate A/R1 0 0 Linear Linear 0 0 A/R2 0 0 Linear 2250 Linear 0 2250 A/R7 0 0 Immediate 0 Immediate 0 0
4.3. 4.3 Developing agroforestry areas
Within the watershed component of the project, 1,500 ha of degraded lands will be converted into an agroforestry plantation of coffee. This will be accounted among the “other land use change” module in EX-ACT as follows: Table 4: Screen dump of the EX-ACT “other land use change” module
Description of LUCName Your NameInitial Land Use Final Land UseLUC-1 Coffe
GHG emissionsVegetation Type Area concerned by LUC Soil Change Total Balance
Without Project With Project Without With Without With Without WithArea Rate Area Rate tCO2 tCO2 tCO2 tCO2 tCO2 tCO2
LUC-1 Coffe 0 Linear 1500 Linear 0 -8800 0 -179644 0 -188444
Degraded Land Perennial/Tree Crop
Biomass Change
In this case, the development of agroforestry on previous degraded lands will cover the soil hence avoiding soil degradation and implies gains of biomass. This agroforestry activity will also be automatically implemented in the perennial EX-ACT module. Thus the tool takes into account both the land use change impact on carbon balance and the expected storage of carbon in soil by this plantation of coffee.
EASYPol Module 263 Analytical Tools
8
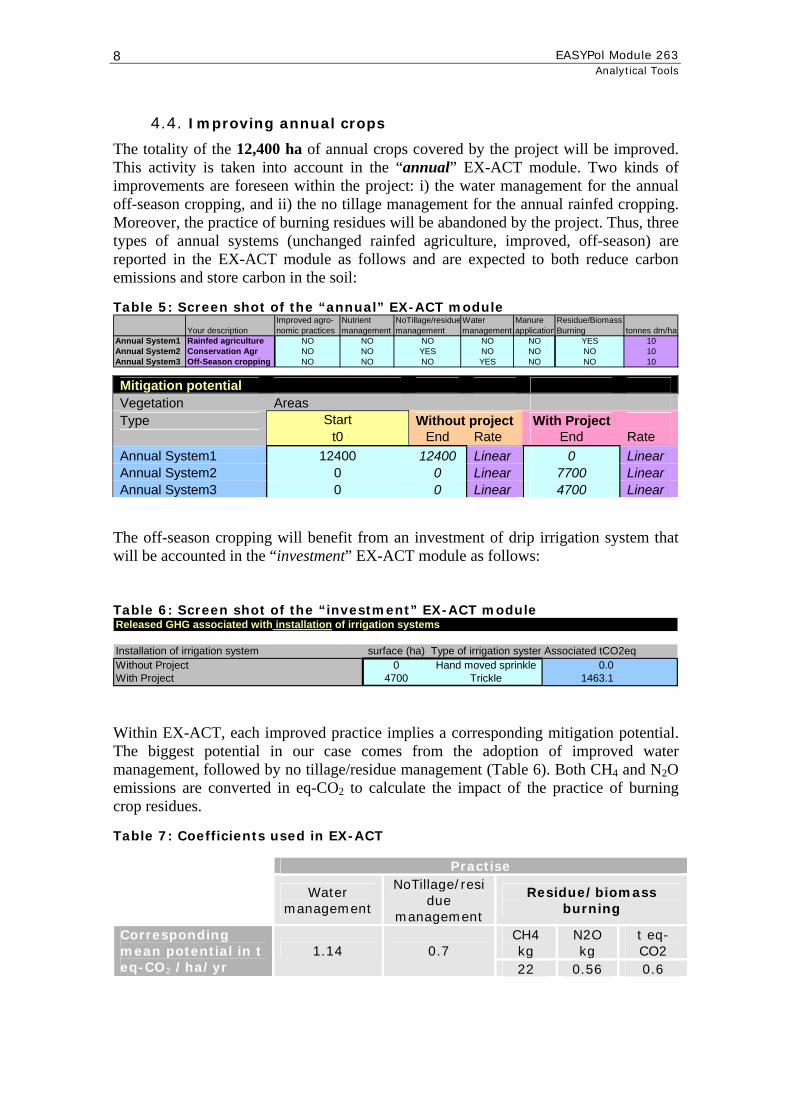
4.4. Improving annual crops
The totality of the 12,400 ha of annual crops covered by the project will be improved. This activity is taken into account in the “annual” EX-ACT module. Two kinds of improvements are foreseen within the project: i) the water management for the annual off-season cropping, and ii) the no tillage management for the annual rainfed cropping. Moreover, the practice of burning residues will be abandoned by the project. Thus, three types of annual systems (unchanged rainfed agriculture, improved, off-season) are reported in the EX-ACT module as follows and are expected to both reduce carbon emissions and store carbon in the soil: Table 5: Screen shot of the “annual” EX-ACT module
Improved agro- Nutrient NoTillage/residue Water Manure Residue/BiomassYour description nomic practices management management management application Burning tonnes dm/ha
Annual System1 Rainfed agriculture NO NO NO NO NO YES 10Annual System2 Conservation Agr NO NO YES NO NO NO 10Annual System3 Off-Season cropping NO NO NO YES NO NO 10
Mitigation potential Vegetation Areas Type Start Without project With Project t0 End Rate End Rate Annual System1 12400 12400 Linear 0 Linear Annual System2 0 0 Linear 7700 Linear Annual System3 0 0 Linear 4700 Linear
The off-season cropping will benefit from an investment of drip irrigation system that will be accounted in the “investment” EX-ACT module as follows: Table 6: Screen shot of the “investment” EX-ACT module Released GHG associated with installation of irrigation systems
Installation of irrigation system surface (ha) Type of irrigation systemAssociated tCO2eqWithout Project 0 Hand moved sprinkle 0.0With Project 4700 Trickle 1463.1 Within EX-ACT, each improved practice implies a corresponding mitigation potential. The biggest potential in our case comes from the adoption of improved water management, followed by no tillage/residue management (Table 6). Both CH4 and N2O emissions are converted in eq-CO2 to calculate the impact of the practice of burning crop residues. Table 7: Coefficients used in EX-ACT
Practise
Water management
NoTillage/residue
management
Residue/biomass burning
CH4 kg
N2O kg
t eq-CO2
Corresponding mean potential in t eq-CO2 /ha/yr
1.14 0.7 22 0.56 0.6
EX-ACT Software for Carbon Balance Appraisal of Investment Projects Irrigation and Watershed Management Case Study in Madagascar
9
The coefficient used represents annual soil carbon change rate for a 20-year time horizon in the top 30 cm of the soil.
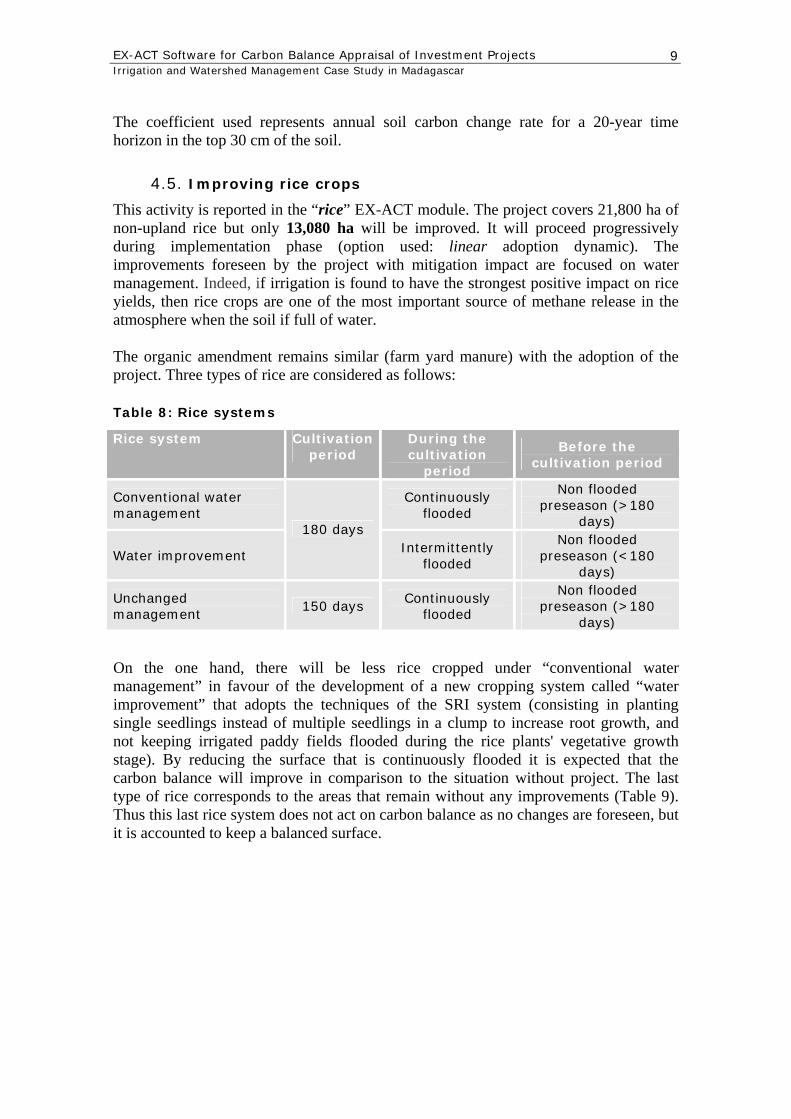
4.5. Improving rice crops
This activity is reported in the “rice” EX-ACT module. The project covers 21,800 ha of non-upland rice but only 13,080 ha will be improved. It will proceed progressively during implementation phase (option used: linear adoption dynamic). The improvements foreseen by the project with mitigation impact are focused on water management. Indeed, if irrigation is found to have the strongest positive impact on rice yields, then rice crops are one of the most important source of methane release in the atmosphere when the soil if full of water. The organic amendment remains similar (farm yard manure) with the adoption of the project. Three types of rice are considered as follows:
Table 8: Rice systems
Rice system Cultivation period
During the cultivation
period
Before the cultivation period
Conventional water management
Continuously flooded
Non flooded preseason (>180
days)
Water improvement
180 days Intermittently
flooded
Non flooded preseason (<180
days)
Unchanged management 150 days Continuously
flooded
Non flooded preseason (>180
days)
On the one hand, there will be less rice cropped under “conventional water management” in favour of the development of a new cropping system called “water improvement” that adopts the techniques of the SRI system (consisting in planting single seedlings instead of multiple seedlings in a clump to increase root growth, and not keeping irrigated paddy fields flooded during the rice plants' vegetative growth stage). By reducing the surface that is continuously flooded it is expected that the carbon balance will improve in comparison to the situation without project. The last type of rice corresponds to the areas that remain without any improvements (Table 9). Thus this last rice system does not act on carbon balance as no changes are foreseen, but it is accounted to keep a balanced surface.

EASYPol Module 263 Analytical Tools
10
Table 9: Areas of the different rice systems
Rice system Start (ha) Without (ha) With (ha) Conventional water
management 13,080 13,080 9,156
Water improvement 0 0 3,924
Unchanged management 8,720 8,720 8,720
Table 10: Print screen of the EX-ACT “rice” module
CH4 emission from rice systems Areas (ha) of the different options
Start Without Project With Project Type t0 End Rate End Rate … Rice1 13080 13080 Linear 9156 Linear Rice2 0 0 Linear 3924 Linear Rice3 8720 8720 Linear 8720 Linear
The water regime reflects the potential methane emissions due to anaerobic decomposition of organic matter as shown below: Table 11: Coefficients used in the EX-ACT “rice” module Rice system Water regime
during the cultivation
period
Water regime before the
cultivation period
Rate (t)
CH4 IPCC coefficient kg/ha/day
Conventional water management and unchanged management
Continuously flooded
Non flooded preseason (>180
days) 1.24
Water improvement intermittently flooded
Non flooded preseason (<180
days)
5.5 1.02
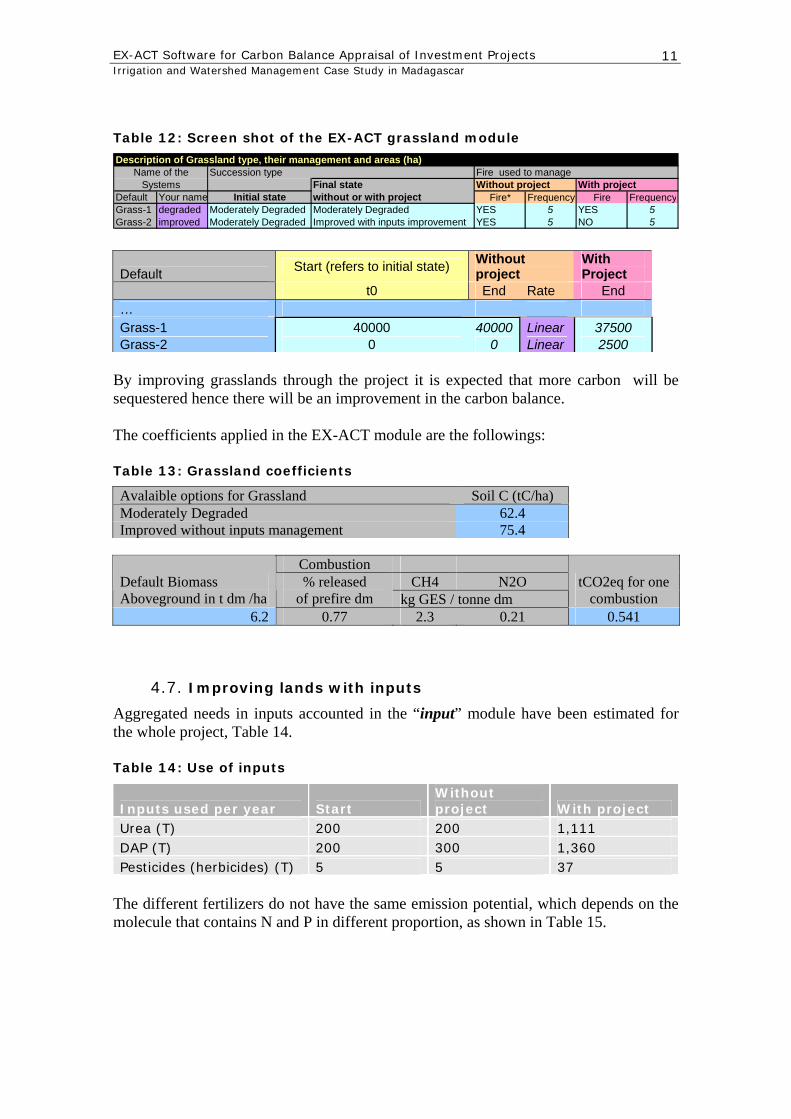
4.6. Restoring grassland
The restoration of grassland is covered in the “grassland” module. The current option of improving 2,500 ha on grasslands with the project stays a low target option which leaves over 90% of grasslands degraded. Grasslands are expected to be moderately degraded. The 2,500 ha will be improved by the use of different inputs: including rotational grazing, using fire control, enrichment planting with fodder grasses and legumes.
EX-ACT Software for Carbon Balance Appraisal of Investment Projects Irrigation and Watershed Management Case Study in Madagascar
11
Table 12: Screen shot of the EX-ACT grassland module
Description of Grassland type, their management and areas (ha)Succession type Fire used to manage
Final state Without project With projectDefault Your name without or with project Fire* Frequency Fire FrequencyGrass-1 degraded YES 5 YES 5Grass-2 improved YES 5 NO 5Moderately Degraded Improved with inputs improvement
Initial state
Name of the Systems
Moderately Degraded Moderately Degraded
Default Start (refers to initial state) Without project
With Project
t0 End Rate End … Grass-1 40000 40000 Linear 37500 Grass-2 0 0 Linear 2500
By improving grasslands through the project it is expected that more carbon will be sequestered hence there will be an improvement in the carbon balance. The coefficients applied in the EX-ACT module are the followings: Table 13: Grassland coefficients
Avalaible options for Grassland Soil C (tC/ha) Moderately Degraded 62.4 Improved without inputs management 75.4
Combustion
CH4 N2O Default Biomass Aboveground in t dm /ha
% released of prefire dm kg GES / tonne dm
tCO2eq for one combustion
6.2 0.77 2.3 0.21 0.541
4.7. Improving lands with inputs
Aggregated needs in inputs accounted in the “input” module have been estimated for the whole project, Table 14. Table 14: Use of inputs
Inputs used per year Start Without project With project
Urea (T) 200 200 1,111 DAP (T) 200 300 1,360 Pesticides (herbicides) (T) 5 5 37
The different fertilizers do not have the same emission potential, which depends on the molecule that contains N and P in different proportion, as shown in Table 15.

EASYPol Module 263 Analytical Tools
12
Table 15: Quantity of N and P2O5 in fertilizers
Type of input N quantity (%) P2O5 quantity (%)
Urea 46 0 DAP 18 46
Thus, the assessment of fertilizers is realized as follows: Table 16: Quantity of N and P2O5 in fertilizers
Amounts in t/year/ha Start
(t/year)
With the project (t/year)
Without the project (t/year)
Amount of synthetic N from urea 92 92 511.06 Amount of synthetic N from DAP 36 54 244.8 Amount of phosphorus synthetic fertilizer 92 138 625.6
Thus the EX-ACT module will be filled in as shown below: Table 17: Print screen of the input module
Carbon dioxide emissions from Urea application
IPCC Specific Default Startfactor factor Factor t0 End Rate End Rate
Urea 0.2 YES 200 200 Linear 1111 Linear
N2O emissions from N application on managed soils (except manure management see above)Amount of N Applied (t per year)
Type of input IPCC Specific Default Startfactor factor Factor t0 End Rate End Rate
Chemical N Fertiliser 0.01 YES 128 146 Linear 755.86 Linear
CO2 equivalent emissions from production, transportation, storage and transfer of agricultural chemicalsAmount in tonnes of product (active ingrediente for Pesticides)
Type of input** Default Specific Default Startfactor* factor Factor t0 End Rate End Rate
Chemical N Fertiliser 4.8 YES 128 146 Linear 755.86 LinearPhosphorus synthetic fertilizer 0.7 YES 92 138 Linear 625.6 LinearHerbicides (Pesticides) 23.1 YES 5 5 Linear 37 Linear
Without Project With Project
Without Project With Project
Without Project With Project
Amount of Urea in tonnes per year
EX-ACT takes into account the expected GHG emissions due to production, transformation and application of fertilizers, as shown by the corresponding default coefficients proposed by IPCC and used in the EX-ACT estimations (Table 18).

EX-ACT Software for Carbon Balance Appraisal of Investment Projects Irrigation and Watershed Management Case Study in Madagascar
13
Table 18: IPCC coefficients (in t eq-CO2) used in the input module for one ton of inputs applied
Inputs applied Coefficient (t eq-CO2)
Urea (regarding CO2 emissions) 0.2
Chemical N fertilizers (regarding N2O emissions) 3.1
N fertilizers in non upland rice (regarding N2O application) 0.9
Chemical N fertilizers (regarding CO2 emissions from the production, transportation...)
4.8
Phosphorous synthetic fertilizers (regarding CO2 emissions from the production, transportation...)
0.7
Pesticides (Herbicides) 23.1
5. EX-ACT RESULTS
5.1. Land use and changes
This section provides an overview of land use for project area and of the changes in land use foreseen by project activities. The total project area covers 112,250 ha of land. This surface can be divided into two kinds of lands: the croplands and the non-cropped watershed areas. The croplands are composed of rice and other annual crops. Reducing deforestation, afforestation and restoring grasslands are the main non-cropped watershed areas. There is no land use change within the project for the croplands and the grasslands as project activities are fostering the implementation of changes in land management and not in land use. However there are land use changes in some watershed areas. Indeed the project allows reducing degraded lands in favour of the growth of forested areas (2,250 ha reforested, 1,500 ha of agroforestry) but it does not convert all the degraded land into other land uses. The land use matrix indicates that the area with and without project are balanced and that the aggregated results obtained are consistent with land use and changes promoted by project activities.

EASYPol Module 263 Analytical Tools
14
Table 19: Screenshot of the EX-ACT matrix of land-use and land-use changes
5.2. Project C-balance analysis
The rough result directly provided by the software includes a presentation of carbon balances of every project physical component; components are then summed within an aggregated Carbon Balance for the whole project (showing either a carbon source or sink). The project creates a total emission of 92,611 tons of equivalent CO2, but also creates a total sink of about 2.5 million tons of eq-CO2, hence a net sink carbon balance of almost 2.4 million tons of eq-CO2. Thus the project shows a mitigation potential generated at over 86% by watershed management (forest management, afforestation and grassland, land use change). The project also promotes the adoption of more sustainable practices in annual crops (water management, no tillage/residues management). Indeed as the result of demographic growth and stagnation of yields, rainfed crops tend to be extended on hill slopes often by removing forests and applying inappropriate farming practices. Tackling both watershed and agriculture should achieve the dual objective of higher productivity and reduced soil degradation and erosion. The results of the EX-ACT analysis performed as describes in previous sections are summarised here:
With Project Forest/ GrasslandPlantation Annual Perennial Rice Degraded Other Total Initial
INITIAL Forest/Plantation 31000 0 0 0 0 4000 0 35000Annual 0 12400 0 0 0 0 0 12400
Cropland Perennial 0 0 0 0 0 0 0 0Rice 0 0 0 21800 0 0 0 21800
Grassland 0 0 0 0 40000 0 0 40000Other Land Degraded 2250 0 1500 0 0 0 0 3750
Other 0 0 0 0 0 0 0 0
Total Final 33250 12400 1500 21800 40000 4000 0 112950
CroplandFINAL
Other Land
Without Project Forest/ GrasslandPlantation Annual Perennial Rice Degraded Other Total Initial
INITIAL Forest/Plantation 29000 0 0 0 0 6000 0 35000Annual 0 12400 0 0 0 0 0 12400
Cropland Perennial 0 0 0 0 0 0 0 0Rice 0 0 0 21800 0 0 0 21800
Grassland 0 0 0 0 40000 0 0 40000Other Land Degraded 0 0 0 0 0 3750 0 3750
Other 0 0 0 0 0 0 0 0
Total Final 29000 12400 0 21800 40000 9750 0 112950
CroplandFINAL
Other Land
EX-ACT Software for Carbon Balance Appraisal of Investment Projects Irrigation and Watershed Management Case Study in Madagascar
15
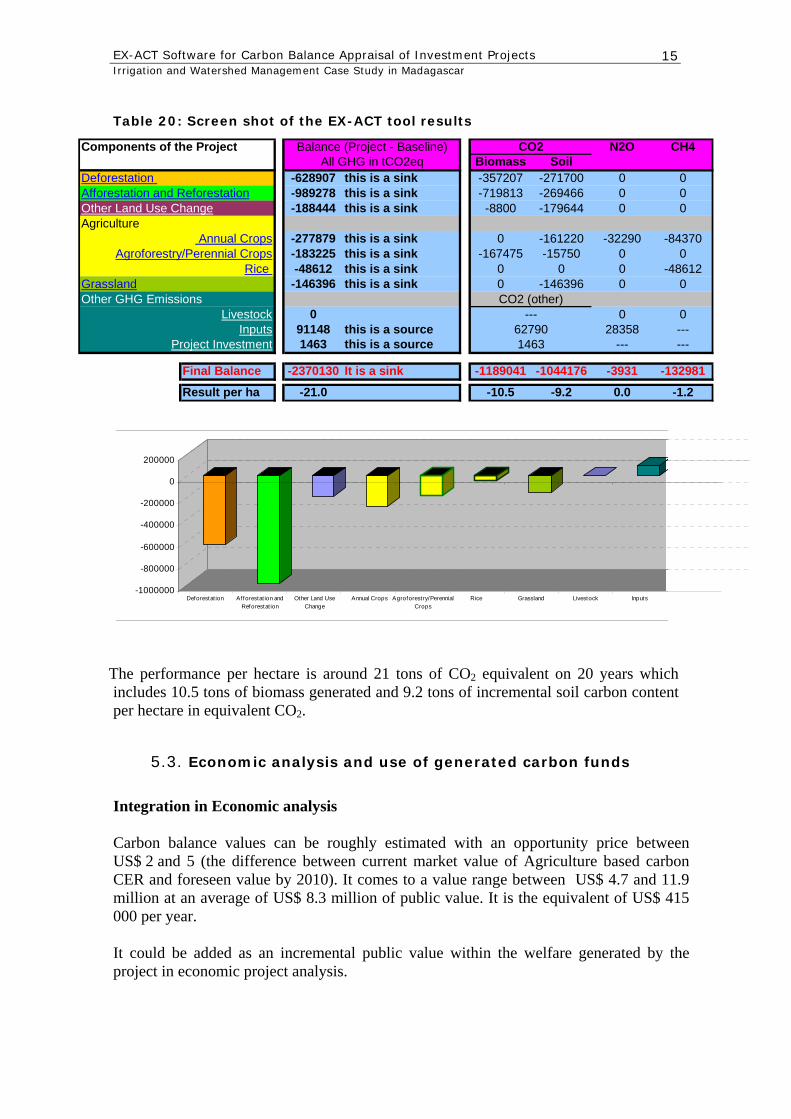
Table 20: Screen shot of the EX-ACT tool results
The performance per hectare is around 21 tons of CO2 equivalent on 20 years which includes 10.5 tons of biomass generated and 9.2 tons of incremental soil carbon content per hectare in equivalent CO2.
5.3. Economic analysis and use of generated carbon funds
Integration in Economic analysis Carbon balance values can be roughly estimated with an opportunity price between US$ 2 and 5 (the difference between current market value of Agriculture based carbon CER and foreseen value by 2010). It comes to a value range between US$ 4.7 and 11.9 million at an average of US$ 8.3 million of public value. It is the equivalent of US$ 415 000 per year. It could be added as an incremental public value within the welfare generated by the project in economic project analysis.
N2O CH4Biomass Soil
-628907 this is a sink -357207 -271700 0 0-989278 this is a sink -719813 -269466 0 0-188444 this is a sink -8800 -179644 0 0
-277879 this is a sink 0 -161220 -32290 -84370-183225 this is a sink -167475 -15750 0 0-48612 this is a sink 0 0 0 -48612-146396 this is a sink 0 -146396 0 0
0 0 091148 this is a source 28358 ---1463 this is a source --- ---
Final Balance -2370130 It is a sink -1189041 -1044176 -3931 -132981
Result per ha -21.0 -10.5 -9.2 0.0 -1.2
Components of the Project
Other GHG EmissionsLivestock
Inputs
Deforestation Afforestation and ReforestationOther Land Use ChangeAgriculture
Project Investment
Annual CropsAgroforestry/Perennial Crops
Rice Grassland
1463
All GHG in tCO2eqBalance (Project - Baseline)
CO2 (other)---
62790
CO2
-1000000
-800000
-600000
-400000
-200000
0
200000
Deforestat ion Afforestat ion andReforestat ion
Other Land UseChange
Annual Crops Agroforestry/PerennialCrops
Rice Grassland Livestock Inputs

EASYPol Module 263 Analytical Tools
16
Table 21: Simulation of economic analysis with Carbon Value integrated at different prices
Carbon constant
price US$/ton
Total public value
million US$
Project Net present value
million US$
Internal IRR
without Carbon value 0 0 9.1 14.7% with carbon valued at 2 4.7 10.5 15.3% with carbon valued at 5 11.9 12.7 16.2% with carbon valued at 3.5 8.3 11.6 15.8% carbon price increasing between 2010 and 2020
from 2 to 20 38.7 17.8 17.7%
carbon price increasing from 2010 to 2020
from 2 to 10 20.4 13.9 16.5%
The table above also shows simulations which consider a progressive increase of price of carbon on next 10 years from US$ 2 to US$ 10 and from US$ 2 to US$ 20 These projections seem realistic in the perspective of IPCC projections of carbon price by 2020 (US$ 40-60 market price). This proves how agriculture project’s current internal returns usually between 10 and 15% can reasonably increase and stay closer to industry – service related investment returns (13-20%) when environmental return is considered. Furthermore the Net Present Value is increasing by over 25% with carbon valued at a conservative rate of US$ 3.5 per ton. Table 22: Appraising the carbon potential rent at different levels of possible use within project implementation
at low carbon price of US$ 3.5 Annual Equivalent
Agregated amount
Carbon value per ha US$ 3.7 US$ 72 Carbon value per farmer US$ 14 US$ 276 Equiv Carbon financial rent per village US$ 1 400 US$ 27 600 Equivalent carbon financial rent per watershed
US$ 104 000 US$ 2.1 million
Assuming that the estimated virtual carbon value of US$ 8.3 million over 20 years is effectively allowing for funds mobilisation, with a conservative assumption of annual delivery, there would be an opportunity of annual funding of US$ 415 000. When divided by the number of farmers or by the number of hectares, this carbon rent represents very low value, insignificant in the perspective to increase the farmers’ annual income. However cumulated at community level (village), with US$ 1400, it can fund equivalent to 3 full time permanent village workers (US$ 40 per month) or a team of 12 workers during 3 months or at watershed level (four watersheds in the project: Andapa, Marovoay, Itasy, Alaotra), it can provide regular yearly funds for all kinds of environment services (control and reduced deforestation, afforestation work). For every watershed considered, the carbon rent could fund equivalent of 40-45000 man-days of public work (200 workers at 20 days per month during 7-8 months per year in every

EX-ACT Software for Carbon Balance Appraisal of Investment Projects Irrigation and Watershed Management Case Study in Madagascar
17
watershed). These figures are provided to illustrate the potential employment generation in the area of Paid Environmental Services (PES) through regular carbon annual monetary inflows. It is therefore important to deliver PES through a limited number of workers from vulnerable households in a situation of hidden unemployment or of dairy workers (or landless farmers) and to propose them either full time of low-season-targeted environmental work
Table 23: Options of Payment of Environment Services (PES) within a simulation of increasing carbon price to all farmer/ Social Safety Nets (SSN)
at increasing carbon price of US$
equivalent by 2015 at US$ 9/ ton
equivalent by 2020
at US$ 12/ton
equivalent by 2025
at US$ 15/ton Annual Carbon value (US$ million)
1.1 1.4 1.7
Carbon value per ha per year
US$ 9.5 US$ 12.6 US$ 16
Carbon value per farmer per year
US$ 35 US$ 55 US$ 77
Equivalent carbon fund per village per year
US$ 3500 US$ 5500 US$ 7700
Equivalent carbon fund per watershed per year
US$ 275 000 US$ 350 000 US$ 425 000
In such a perspective, the potential of mobilised annual funds would allow for a much wider set of payments of environmental services combined as a subsidy per ha per year of improved annual crop, the environment and reforestation annual budget per village or other community services are to be considered.
6. SCENARIO ANALYSIS
6.1. Simulate project options : resizing watershed component
The project case study was in actual fact re-dimensioned at the start due to the gap in funding resources. The watershed component has been to some extent sacrificed (component at US$ 4.58 million). This simulation will be used to resize the watershed component within a perspective of project option with incremental funding (which could be implemented through appropriate integration in phase 2 of the present project). Within this project option, the watershed component targets 65,000 ha of improved watershed on the total watershed area which is around 100 000 ha. It will include:
(i) 15,000 ha of afforested areas,
(ii) 6,000 ha of avoided deforestation,
(iii) 34,000 ha of improved pasture and
(iv) 10,000 ha of agro forestry.

EASYPol Module 263 Analytical Tools
18
These figures will replace the initial figures used in project for afforestation, deforestation, improved pasture...as shown below: Table 23: Watershed activities among the project and in the new scenario proposed With the project
(ha) New scenario (ha)
Afforested areas 2,250 15,000 Avoided deforestation 2,000 6,000 Improved pasture 2,500 34,000 Agro forestry 1,500 10,000 Total of surface improved 8,250 65,000 Total Surface of watershed component 100,000 100,000 The incremental improved areas will require additional funding to be computed on the following cost per ha: US$ 1500 / ha reforested, US$ 300 / ha of avoided deforestation, US$ 400 per ha of improved pasture, US$ 1000 per ha of agro forestry. These area figures will allow for the recalculation of the Watershed component budget.
6.2. Results
Table 24: Print screen of the EX-ACT results among the new simulation
This watershed component is estimated at US$ 47.9 million. The aggregate project budget will go up to around US$ 83 million (+103%). It generates 12.4 million tons of carbon sink effect with 89% of carbon mitigation issued from watershed management (6.6 million tons from afforestation, 1.9 million from reduced deforestation, 1.3 million tons from grassland. We are up to 4.6 tons of carbon reduction per ha per year and to 92 tons per ha on 20 years.
Components of the ProjectDeforestation Afforestation and ReforestationOther Land Use ChangeAgriculture
Annual CropsAgroforestry/Perennial Crops
Rice GrasslandOther GHG Emissions
LivestockInputs
Project Investment
Balance with Project (tCO2eq for 20 yrs) Mean per year-1886720 this is a sink -94336-6595188 this is a sink -329759-1256292 this is a sink -62815
-277879 this is a sink -13894-1221500 this is a sink -61075-48612 this is a sink -2431
-1270720 this is a sink -63536
0 091148 this is a source 45571463 this is a source 73
Final Balance -12464299 This is a sink
Total Area (ha)= 134200Positive value = Source of GHG Mean per ha -92.9Negative value = Sink of GHG Mean per ha / yr -4.6

EX-ACT Software for Carbon Balance Appraisal of Investment Projects Irrigation and Watershed Management Case Study in Madagascar
19
By doubling the budget of the project in this scenario, and by allocating the incremental funds for the watershed management, the benefits in term of carbon balance are not doubling but multiplied by six!
6.3. Economic analysis and use of generated carbon funds
Carbon value used in project co-funding
In Table 25 below, the possibility to fund the incremental project option through carbon funding shows very reliable in ant carbon price option. Furthermore it allows incremental balance of around 69.5 million US$ on 20 years, or the equivalent of US$ 3.3 million per year for PEMS and other use. Table 25: Carbon value used in project co-funding among the new simulation
Carbon price
US$/ton
Total public value of carbon
(a)
million US$
project cost (b)
million US$
Incrementalproject
option cost ©
Remaining balance for PEMS and
other public uses
(a)-(c)
Min 6 74 83 42.5 31.5
Max 12 149 83 42.5 116.5
Average 9 112 83 42.5 69.5
7. CONCLUSIONS
The analysis of the ex-ante carbon-balance results shows that the project in its current design has a mitigation potential of almost 2.4 million tons of eq-CO2 over 20 years, thereby participating in the global effort to lower anthropogenic emission and tackle climate change. The mitigation impacts were considered in the formulation of the project as co-benefits. It reflects the significant effect on incrementing project at watershed level. It particularly points out the fact that synergies are possible between watershed management and agriculture mitigation.
8. READERS’ NOTES
The exercise can be fruitfully used in a training course, where there is no possibility to organize a field visit to gather data for the application of EX-ACT to a practical situation.

EASYPol Module 263 Analytical Tools
20
This module belongs to a set of EASYPol modules and other related documents: EASYPol Module 210:
EX-ANTE Carbon-Balance Tool version beta 1: Software
EX-ANTE Carbon-Balance Tool : Technical Guidelines
EX-ANTE Carbon-Balance Tool : Brochure
These are the other related documents: Bernoux M., Branca G., Carro A., Lipper L., Smith G., Bockel L., 2010. Ex-Ante
Greenhouse Gas Balance of Agriculture and Forestry Development Programs. Sci. Agric. (Piracicaba, Braz.), v.67, n.1, p 31-40, January/February 2010.
Bockel L..2009. Climate Change and Agricultural Policies, How to Mainstream Climate
Change Adaptation and Mitigation into Agriculture Policies, EASYPol Module
240, Prepared for the FAO Policy Learning Programme 2009, FAO, Rome. FAO. 2009. Food Security and Agricultural Mitigation in Developing countries:
Options for capturing Synergies.
9. FURTHER REFERENCES
CIA. 2010. The World Factbook. Available at : https://www.cia.gov/library/publications/the-world-factbook/geos/ma.html