iroquois wastewater treatment plant 2016 annual ... · jan 69,866 2,254 4,424 68,106 2,197 4,550 47...
TRANSCRIPT

Page 1 of 3
Iroquois Wastewater Treatment Plant 2016 Annual Performance Report
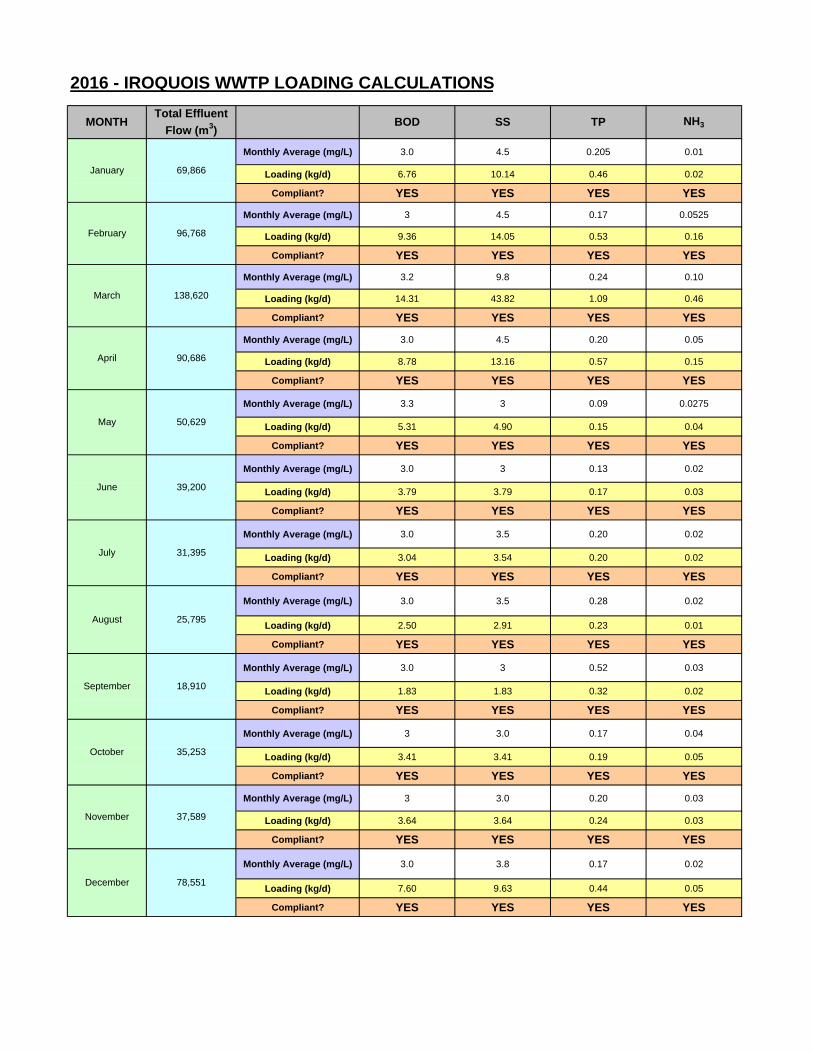
The Iroquois WWTP is a Class II wastewater treatment facility owned and operated by the Municipality of South Dundas. Raw sewage is conveyed from the collection system to the plant pumping station which is equipped with three submersible pumps. From the pumping station, wastewater passes through the inlet works, including mechanically cleaned fine screens and a grit removal and disposal system. Aluminum Sulphate is added to assist in phosphorous removal. The wastewater then moves through either of two parallel Sequential Batch Reactors (SBR) equipped with individual aeration systems, mixers, decanters and sludge removal pumps. Effluent decanted from the SBRs is treated by UV disinfection and subsequently passes through an outfall pipe to the St. Lawrence River. Sludge removed from the SBRs is transferred to a waste activated sludge tank. From the tank, the sludge enters a rotary drum thickener. Polymer is added to assist with the thickening process. Thickened sludge is pumped to an Autothermal Thermophilic Aerobic Digestion (ATAD) system for stabilization. The ATAD system is equipped with an off-gas scrubber and biofilter to provide odour control. The digested sludge is then pumped to one of three biosolids storage tanks. From the storage tanks, biosolids are hauled off site to be utilized as soil conditioner. The following report addresses the requirements outlined in Condition 10 (6) of Amended Certificate of Approval #9689-8MQHNK issued on October 25, 2011. 10(6) The Owner shall prepare and submit to the District Manager, a performance report, on an annual basis, within ninety (90) days following the end of the period being reported upon. The first such report shall cover the first annual period following the commencement of operation of the Works and subsequent reports shall be submitted to cover successive annual periods following thereafter. The reports shall contain, but shall not be limited to, the following information: (a) a summary and interpretation of all monitoring data and a comparison to the effluent limits outlined in Condition 7, including an overview of the success and adequacy of the Works; The total volume of effluent discharged in 2016 was approximately 685,510 m3. The average rate of effluent discharge was approximately 1,877 m3/day. The calculated percent removal of CBOD5, TP, SS and NH3 in the final effluent described in the following paragraphs was determined using data from weekly effluent samples and monthly raw sewage composite sample results for the reporting period.
The allowable monthly average concentration for CBOD5 in the effluent as stated in Condition 7 is 25 mg/L. The corresponding loading limit is 82.5 kg/day. Average concentrations and loadings were well below the limits specified in the ECA. For 2016, the average CBOD5 in the effluent was < 3.04 mg/L which equates to > 89 % removal of CBOD5 from the raw sewage. The average loading rate for 2016 was < 5.92 kg/day which is < 7.2% of the allowable limit of 82.5 kg/day.
The allowable monthly average concentration for Suspended Solids (SS) as stated in Condition 7 is 25mg/L. The corresponding loading limit is 82.5 kg/day. Average concentrations and loadings were well below the limits specified in the ECA. In 2016, the average concentration of SS in the effluent was approximately 4.1 mg/L which equates to 84% removal of SS from the raw influent. The average loading rate of SS for 2016 was 8 kg/day which is 9.7% of the allowable 82.5 kg/day limit.

Iroquois WWTP - 2016 Annual Report
Page 2 of 3
The monthly average concentration limit of Total Phosphorus (TP) as stated in Condition 7 is 1.0 mg/L. The corresponding loading limit is 3.3 kg/day. Average concentrations and loadings were well below the limits specified in the ECA. The average monthly concentration for TP during this reporting period was 0.21 mg/L. This represents a 78% removal of TP from the raw influent. The average monthly loading rate of TP for 2016 was 0.42 kg/day which is 12.7% of the allowable 3.3 kg/day limit as outlined in Condition 7. The monthly average concentration limit for ammonia as stated in Condition 7 is 10 mg/L from June through September and 15 mg/L from October through May. The monthly average loading limit is 33.0 kg/day and 49.5, respectively. The average monthly concentration for ammonia during the June - September reporting period was 0.03 mg/L. The average monthly loading rate of ammonia during that time was 0.027 kg/day which is 0.09% of the allowable 33.0 kg/day limit. The average monthly concentration for ammonia during the October - May reporting period was 0.05 mg/L. The average monthly loading rate of ammonia during that time was 0.113 kg/day which is 0.23% of the allowable 49.5 kg/day limit, as outlined in Condition 7. Condition 7 stipulates that the E. coli monthly geometric mean density must not exceed 200 organisms/100 mL of effluent. During 2016, the average monthly geometric mean was < 3.64 CFU/ 100 mL which did not exceed the monthly limit. Condition 7 also requires the effluent too be non-acutely lethal to Rainbow Trout and Daphnia Magna, with grab samples being collected on a quarterly basis. None of the samples collected in 2016 were found to be acutely lethal. The pH of the effluent remained within the range of 6.0 – 9.5 specified in Table 2. A summary of laboratory results can be found in the 2016 PARs, attached in Appendix A.
(b) a description of any operating problems encountered and corrective actions taken;
- Screen compacter system motor overloaded due to build up of debris. Removed debris and returned to normal operation.
- High flows caused inlet channel to back up. Manually switched plant operation to ‘storm’ mode. Plant is now programmed to automatically switch to ‘storm’ mode upon detection of high inflow.
(c) a summary of all maintenance carried out on any major structure, equipment, apparatus, mechanism or thing part of the Works; Please see the External Maintenance Summary in Appendix B. (d) a summary of any effluent quality assurance or control measures undertaken in the reporting period; Effluent samples are collected on a weekly basis. All samples are analyzed by a laboratory accredited by the Canadian Association for Laboratory Accreditation (CALA). Accreditation ensures that the laboratory has acceptable laboratory protocols and test methods in place. It also requires the laboratory to provide evidence and assurances of the proficiency of the analysts performing the test methods.
Iroquois WWTP - 2016 Annual Report
Page 3 of 3
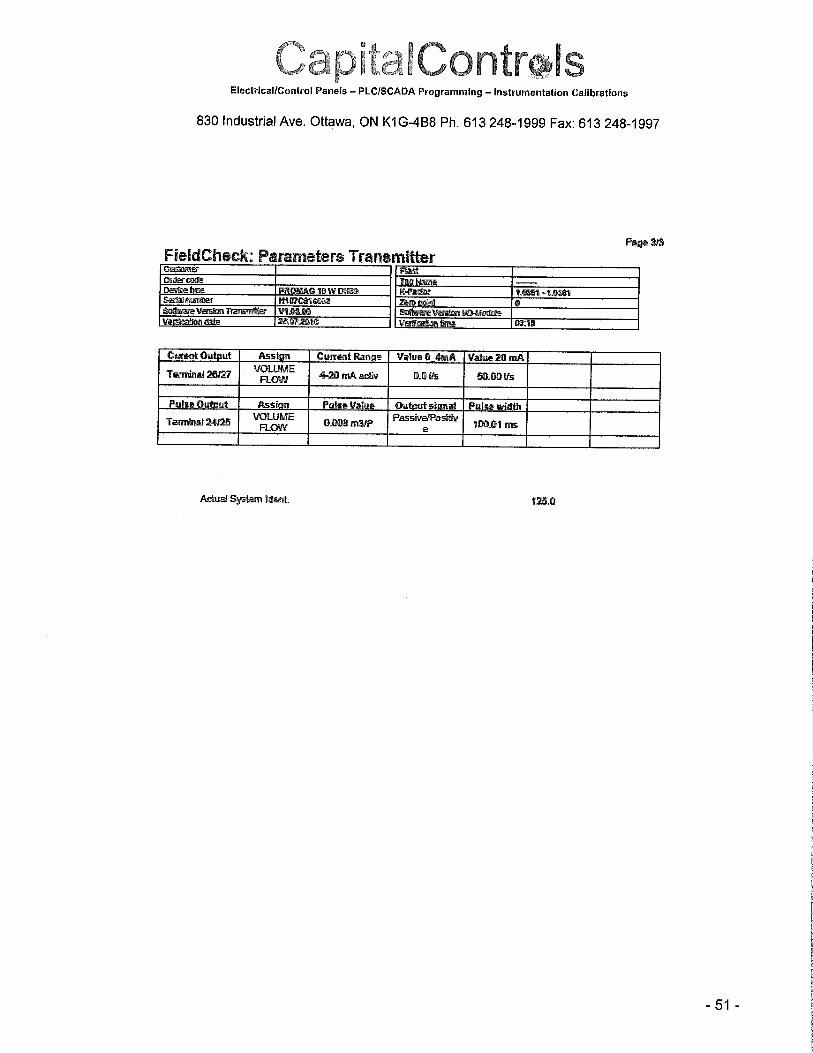
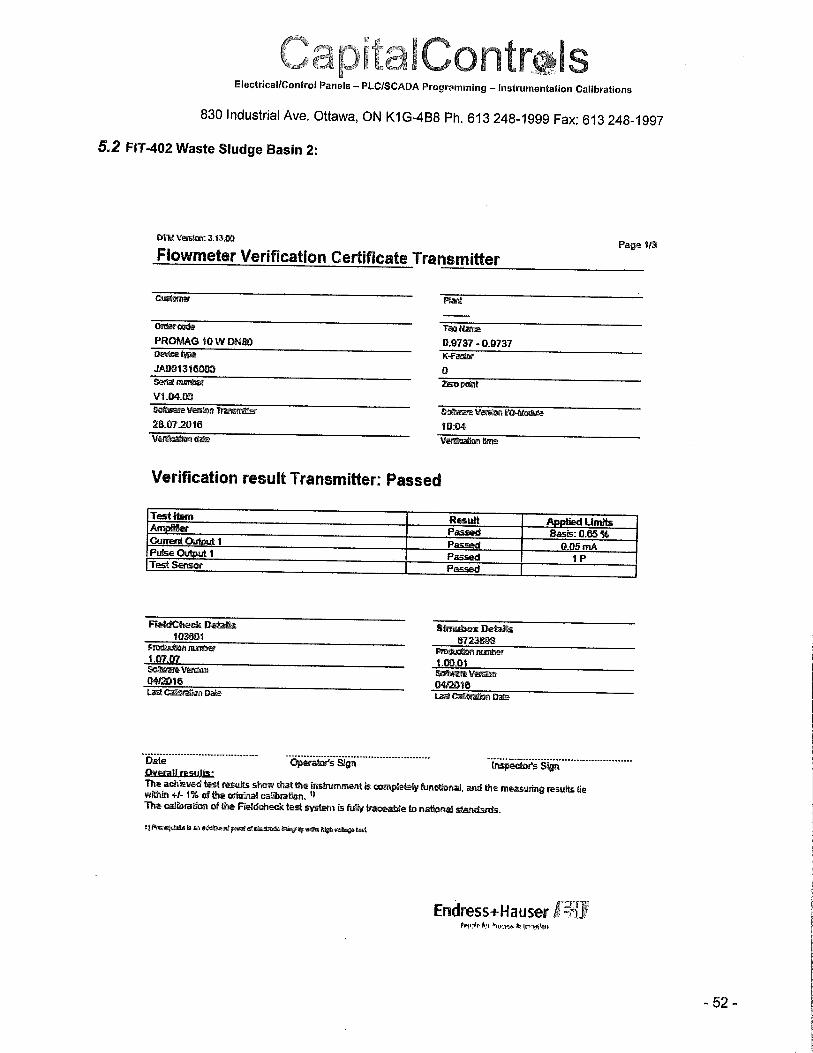
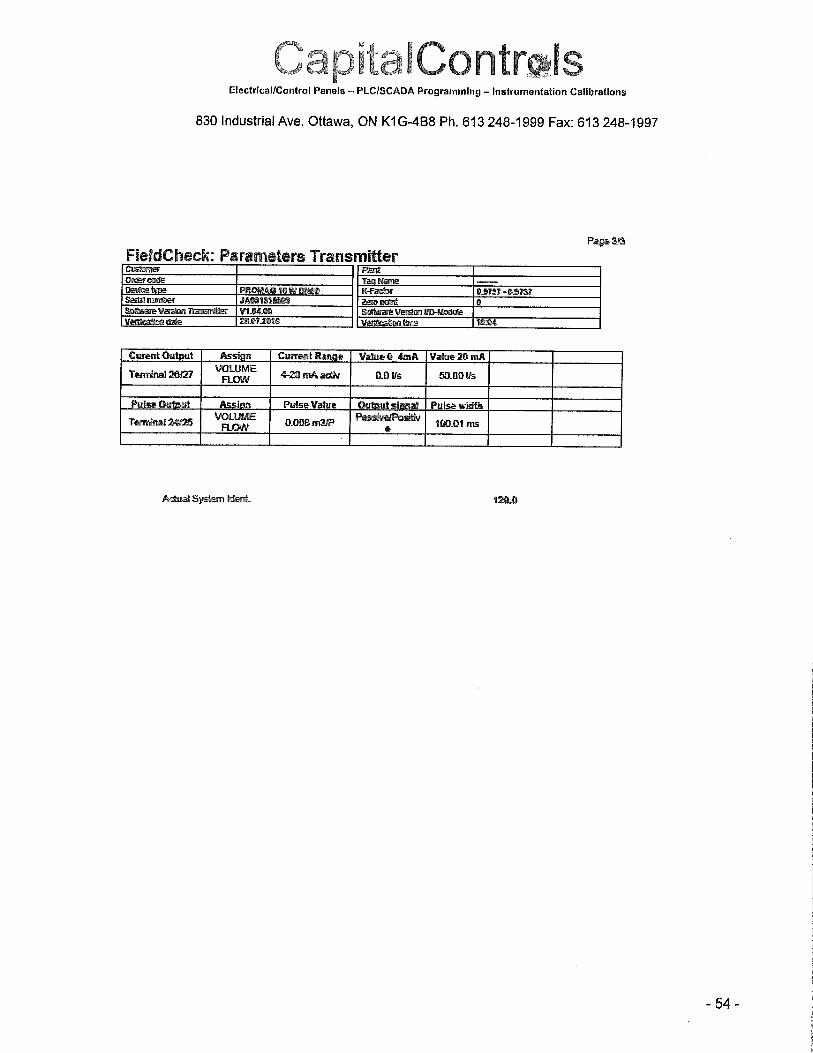
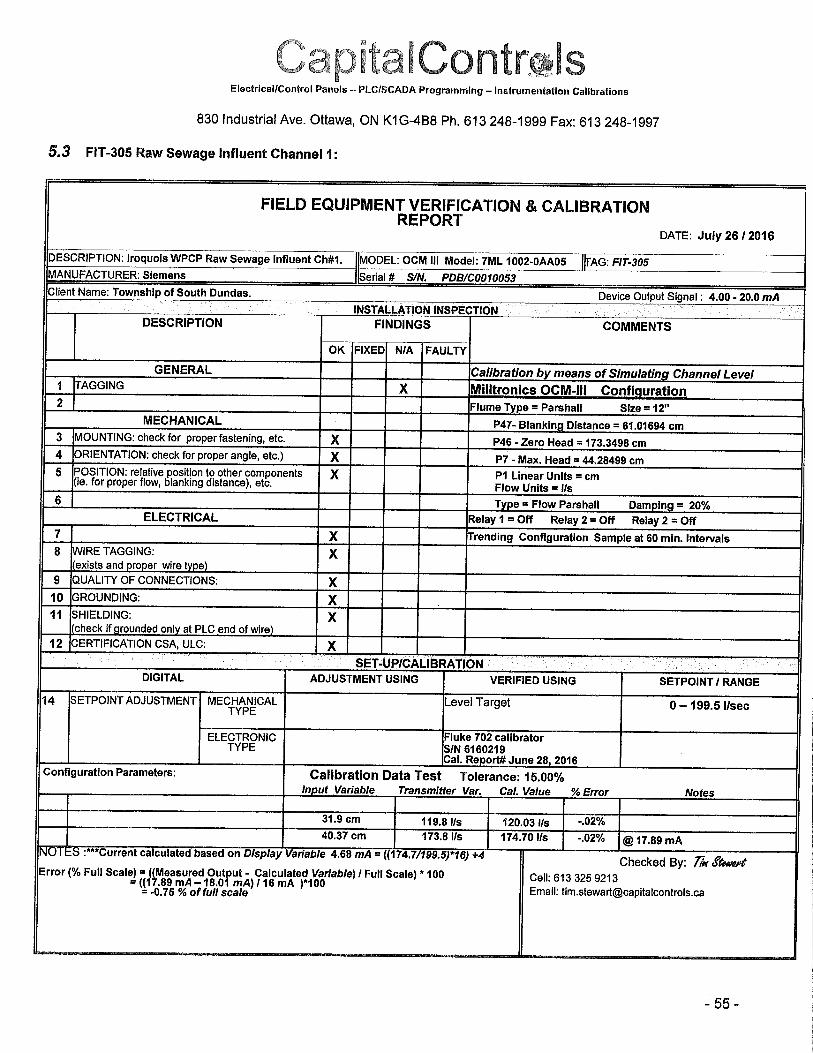
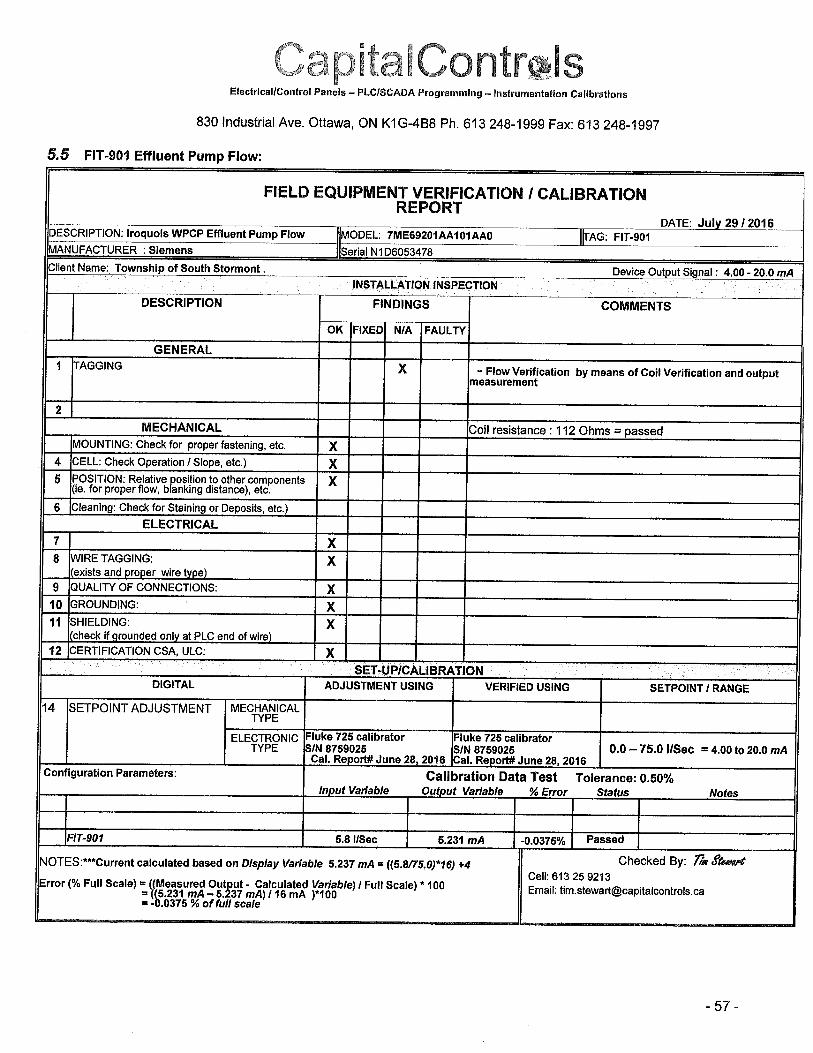
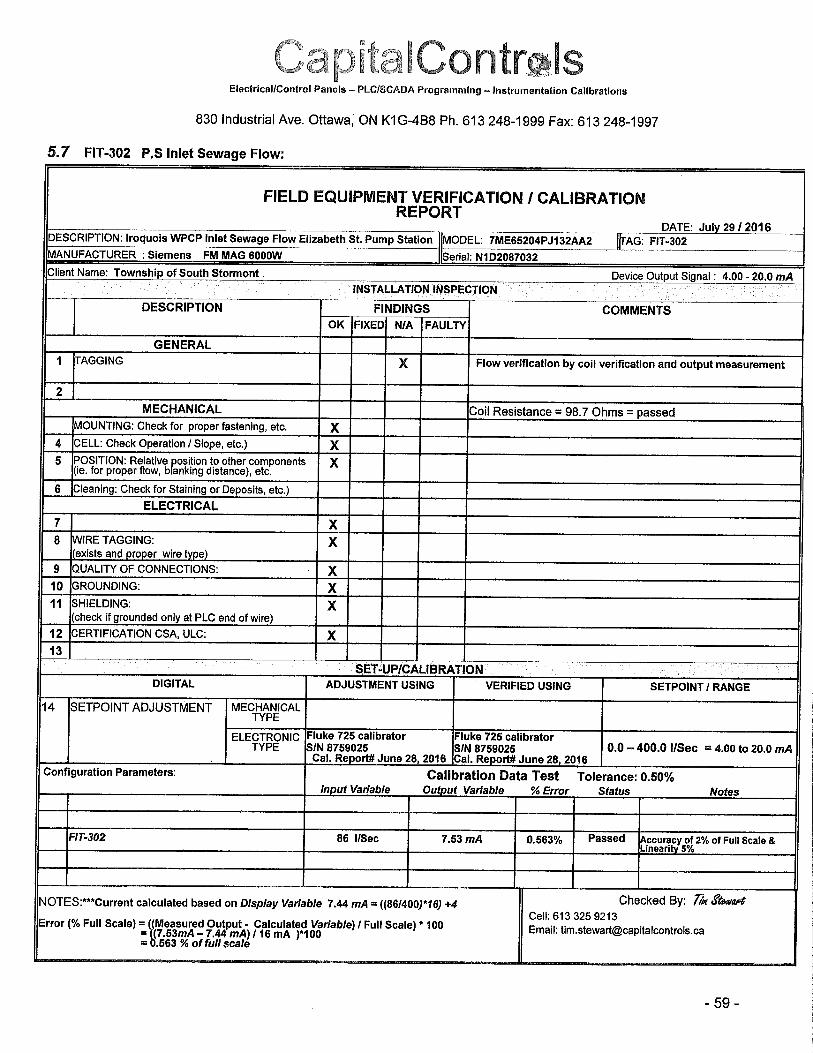
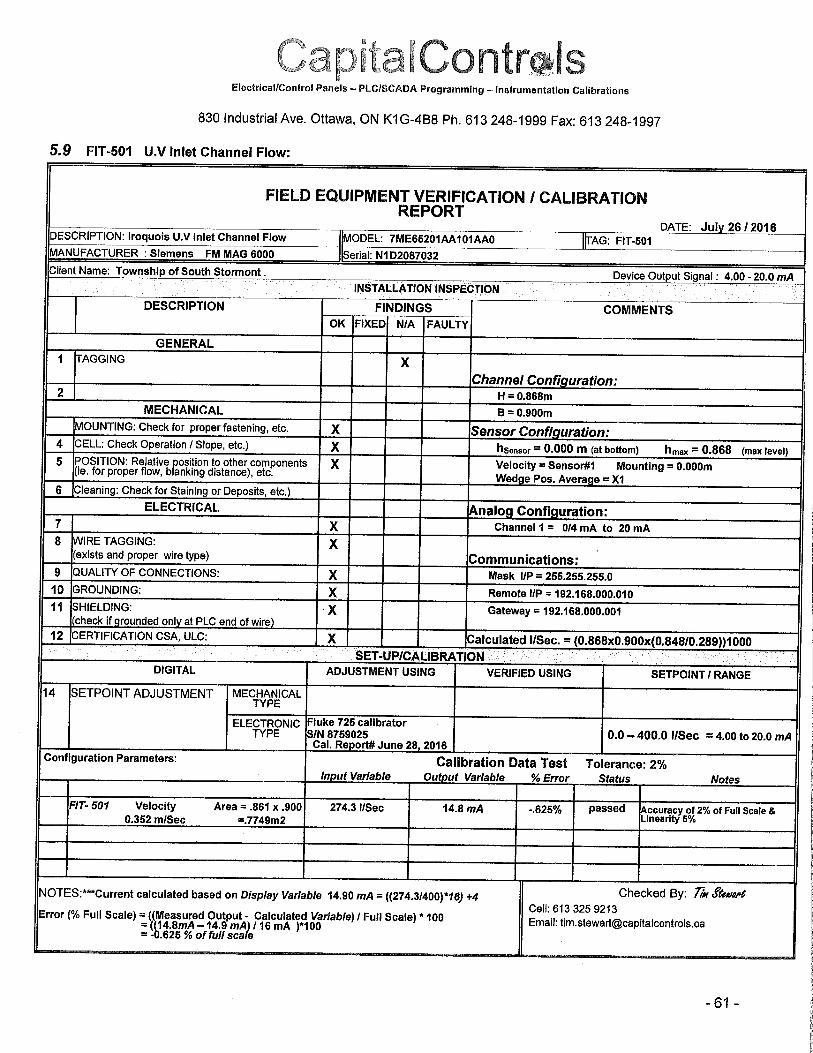
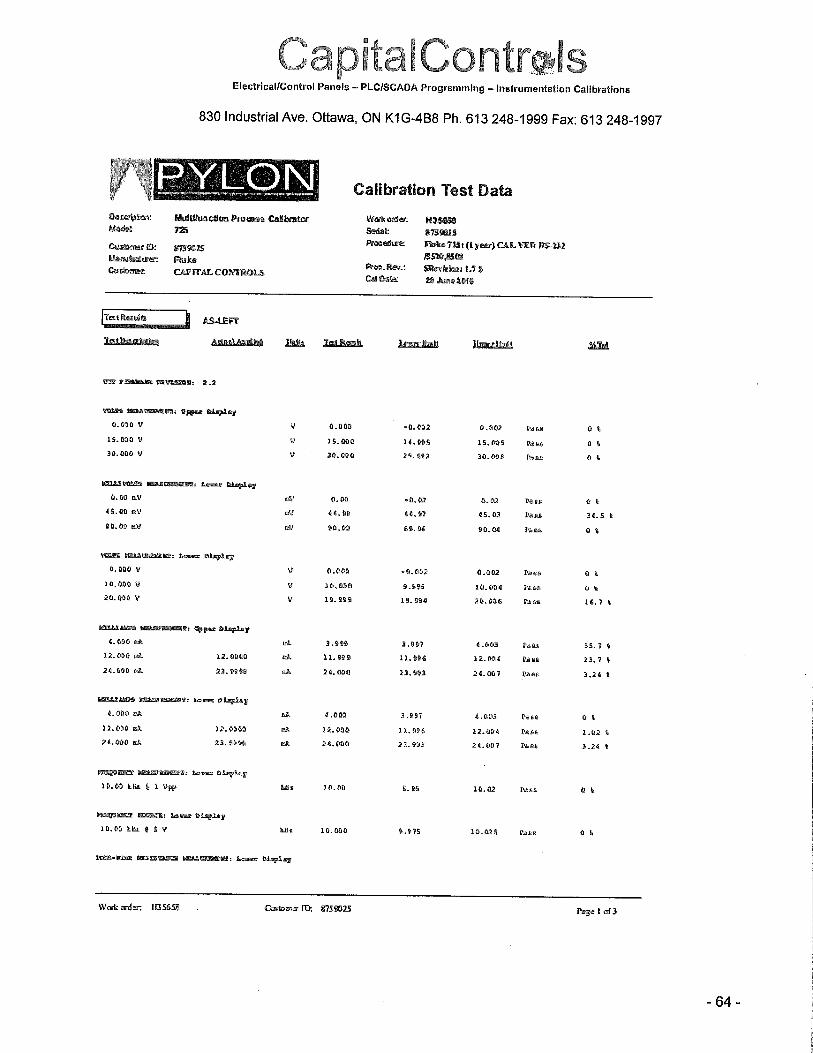
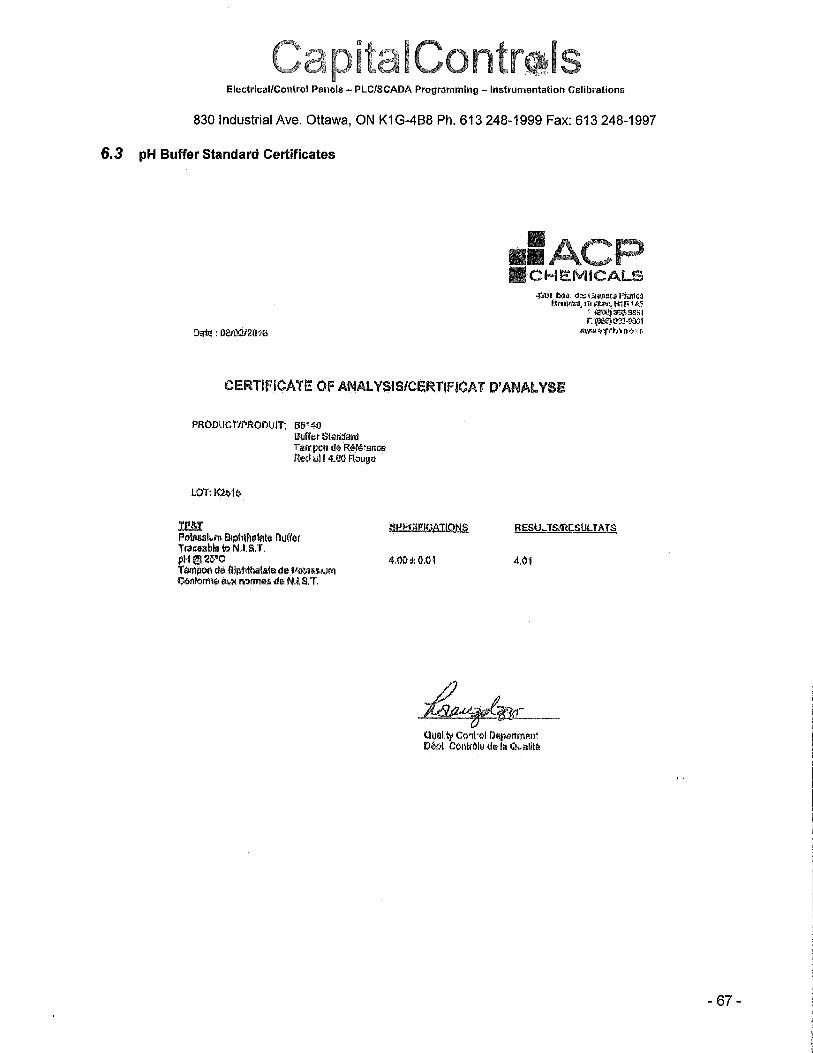
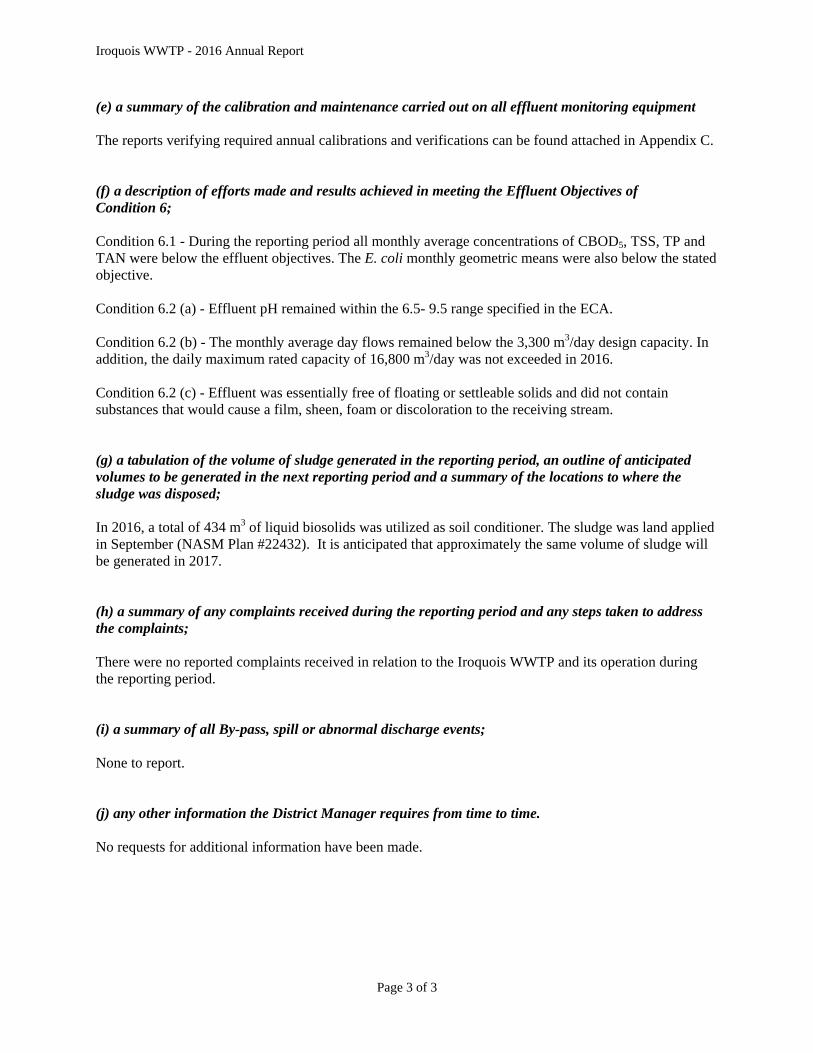
(e) a summary of the calibration and maintenance carried out on all effluent monitoring equipment The reports verifying required annual calibrations and verifications can be found attached in Appendix C. (f) a description of efforts made and results achieved in meeting the Effluent Objectives of Condition 6;
Condition 6.1 - During the reporting period all monthly average concentrations of CBOD5, TSS, TP and TAN were below the effluent objectives. The E. coli monthly geometric means were also below the stated objective. Condition 6.2 (a) - Effluent pH remained within the 6.5- 9.5 range specified in the ECA. Condition 6.2 (b) - The monthly average day flows remained below the 3,300 m3/day design capacity. In addition, the daily maximum rated capacity of 16,800 m3/day was not exceeded in 2016. Condition 6.2 (c) - Effluent was essentially free of floating or settleable solids and did not contain substances that would cause a film, sheen, foam or discoloration to the receiving stream. (g) a tabulation of the volume of sludge generated in the reporting period, an outline of anticipated volumes to be generated in the next reporting period and a summary of the locations to where the sludge was disposed;
In 2016, a total of 434 m3 of liquid biosolids was utilized as soil conditioner. The sludge was land applied in September (NASM Plan #22432). It is anticipated that approximately the same volume of sludge will be generated in 2017.
(h) a summary of any complaints received during the reporting period and any steps taken to address the complaints; There were no reported complaints received in relation to the Iroquois WWTP and its operation during the reporting period. (i) a summary of all By-pass, spill or abnormal discharge events;
None to report. (j) any other information the District Manager requires from time to time. No requests for additional information have been made.

APPENDIX A:
OPERATIONAL DATA
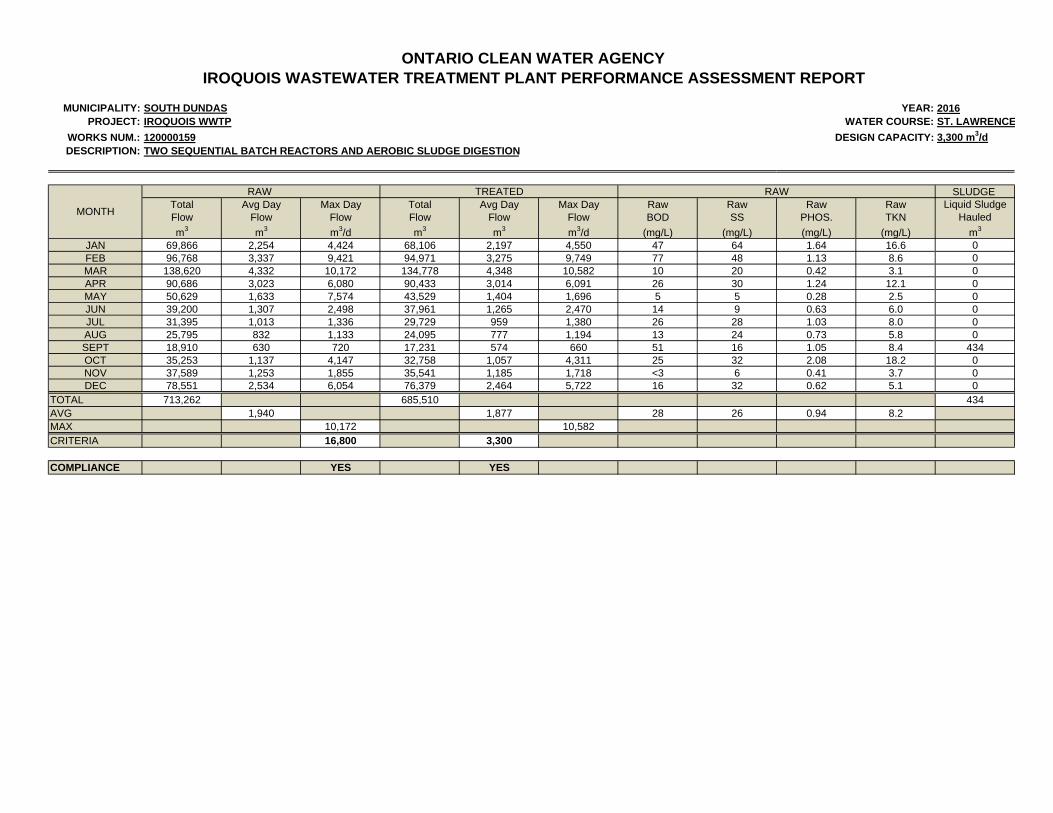
MUNICIPALITY: SOUTH DUNDAS YEAR: 2016PROJECT: IROQUOIS WWTP WATER COURSE: ST. LAWRENCE
WORKS NUM.: 120000159 DESIGN CAPACITY: 3,300 m3/dDESCRIPTION: TWO SEQUENTIAL BATCH REACTORS AND AEROBIC SLUDGE DIGESTION
SLUDGE Total Avg Day Max Day Total Avg Day Max Day Raw Raw Raw RawFlow Flow Flow Flow Flow Flow BOD SS PHOS. TKNm3 m3 m3/d m3 m3 m3/d (mg/L) (mg/L) (mg/L) (mg/L) m3
JAN 69,866 2,254 4,424 68,106 2,197 4,550 47 64 1.64 16.6 0FEB 96,768 3,337 9,421 94,971 3,275 9,749 77 48 1.13 8.6 0MAR 138,620 4,332 10,172 134,778 4,348 10,582 10 20 0.42 3.1 0APR 90,686 3,023 6,080 90,433 3,014 6,091 26 30 1.24 12.1 0MAY 50,629 1,633 7,574 43,529 1,404 1,696 5 5 0.28 2.5 0JUN 39,200 1,307 2,498 37,961 1,265 2,470 14 9 0.63 6.0 0JUL 31,395 1,013 1,336 29,729 959 1,380 26 28 1.03 8.0 0AUG 25,795 832 1,133 24,095 777 1,194 13 24 0.73 5.8 0SEPT 18,910 630 720 17,231 574 660 51 16 1.05 8.4 434OCT 35,253 1,137 4,147 32,758 1,057 4,311 25 32 2.08 18.2 0NOV 37,589 1,253 1,855 35,541 1,185 1,718 <3 6 0.41 3.7 0DEC 78,551 2,534 6,054 76,379 2,464 5,722 16 32 0.62 5.1 0
TOTAL 713,262 685,510 434AVG 1,940 1,877 28 26 0.94 8.2MAX 10,172 10,582CRITERIA 16,800 3,300
COMPLIANCE YES YES
RAW
MONTH
RAWLiquid Sludge
Hauled
TREATED
ONTARIO CLEAN WATER AGENCYIROQUOIS WASTEWATER TREATMENT PLANT PERFORMANCE ASSESSMENT REPORT

2016 - IROQUOIS WWTP EFFLUENT SAMPLING MONTHLY AVERAGES
7-Jan-16 < 3 3 0.17 < 0.01 214-Jan-16 < 3 6 0.23 < 0.01 < 221-Jan-16 < 3 5 0.19 < 0.01 < 228-Jan-16 < 3 4 0.23 < 0.01 < 2
Monthly Average 3 4.5 0.205 0.01 2Compliant? YES YES YES YES YES04-Feb-16 < 3 7 0.25 < 0.01 < 211-Feb-16 < 3 5 0.21 < 0.01 < 218-Feb-16 < 3 < 3 0.1 < 0.01 < 225-Feb-16 < 3 < 3 0.12 0.18 < 10
Monthly Average 3.0 4.5 0.17 0.05 3Compliant? YES YES YES YES YES03-Mar-16 < 3 7 0.14 < 0.01 < 210-Mar-16 4 12 0.24 0.35 217-Mar-16 < 3 12 0.32 0.03 < 222-Mar-16 < 3 9 0.26 0.05 231-Mar-16 < 3 9 0.26 0.07 < 2
Monthly Average 3.2 9.8 0.24 0.10 2Compliant? YES YES YES YES YES07-Apr-16 < 3 3 0.12 0.06 < 214-Apr-16 < 3 6 0.26 < 0.01 < 220-Apr-16 < 3 6 0.25 0.06 828-Apr-16 < 3 3 0.15 0.07 4
Monthly Average 3 4.5 0.195 0.05 3Compliant? YES YES YES YES YES05-May-16 4 3 0.12 0.02 412-May-16 < 3 < 3 0.08 0.04 819-May-16 < 3 3 0.09 0.03 426-May-16 < 3 < 3 0.08 0.02 16
Monthly Average 3.25 3 0.09 0.03 7Compliant? YES YES YES YES YES02-Jun-16 3 < 3 0.12 0.04 609-Jun-16 < 3 < 3 0.11 < 0.01 216-Jun-16 < 3 < 3 0.15 0.02 623-Jun-16 < 3 3 0.15 0.03 430-Jun-16 3 3 0.13 < 0.01 6
Monthly Average 3.00 3.00 0.13 0.02 4Compliant? YES YES YES YES YES
07-Jul-16 < 3 < 3 0.14 < 0.01 214-Jul-16 < 3 3 0.15 < 0.01 821-Jul-16 < 3 3 0.17 0.03 1428-Jul-16 < 3 5 0.32 < 0.01 10
Monthly Average 3 3.5 0.20 0.02 7Compliant? YES YES YES YES YES04-Aug-16 < 3 3 0.25 0.01 < 211-Aug-16 < 3 < 3 0.29 0.02 < 218-Aug-16 < 3 5 0.34 0.02 1025-Aug-16 < 3 3 0.24 0.01 4
Monthly Average 3 3.5 0.28 0.02 4Compliant? YES YES YES YES YES01-Sep-16 < 3 < 3 0.35 < 0.01 1008-Sep-16 < 3 3 0.41 < 0.01 215-Sep-16 < 3 3 0.49 0.04 1222-Sep-16 3 3 0.56 0.06 1429-Sep-16 < 3 3 0.78 0.04 < 2
Monthly Average 3 3 0.52 0.03 6Compliant? YES YES YES YES YES06-Oct-16 < 3 3 0.9 0.09 413-Oct-16 < 3 < 3 0.16 0.03 220-Oct-16 < 3 < 3 0.12 0.07 < 227-Oct-16 < 3 < 3 0.21 0.02 2
Monthly Average 3 3.0 0.35 0.05 2Compliant? YES YES YES YES YES03-Nov-16 < 3 3 0.21 < 0.01 410-Nov-16 < 3 3 0.23 0.05 < 217-Nov-16 < 3 3 0.17 0.04 624-Nov-16 < 3 < 3 0.17 < 0.01 6
Monthly Average 3 3 0.20 0.03 4Compliant? YES YES YES YES YES01-Dec-16 < 3 7 0.27 < 0.01 1208-Dec-16 < 3 < 3 0.19 < 0.01 < 215-Dec-16 < 3 < 3 0.13 0.01 < 222-Dec-16 < 3 < 3 0.17 < 0.01 -28-Dec-16 < 3 < 3 0.1 0.06 < 2
Monthly Average 3.0 3.8 0.17 0.02 3Compliant? YES YES YES YES YES
November
December
January
February
March
April
September
October
May
June
E. Coli (CFU/100ml)
July
August
CBOD (mg/L) SS (mg/L) TP (mg/L) NH3 (mg/L)MONTH DATE
2016 - IROQUOIS WWTP LOADING CALCULATIONS
Monthly Average (mg/L) 3.0 4.5 0.205 0.01
Loading (kg/d) 6.76 10.14 0.46 0.02
Compliant? YES YES YES YES
Monthly Average (mg/L) 3 4.5 0.17 0.0525
Loading (kg/d) 9.36 14.05 0.53 0.16
Compliant? YES YES YES YES
Monthly Average (mg/L) 3.2 9.8 0.24 0.10
Loading (kg/d) 14.31 43.82 1.09 0.46
Compliant? YES YES YES YES
Monthly Average (mg/L) 3.0 4.5 0.20 0.05
Loading (kg/d) 8.78 13.16 0.57 0.15
Compliant? YES YES YES YES
Monthly Average (mg/L) 3.3 3 0.09 0.0275
Loading (kg/d) 5.31 4.90 0.15 0.04
Compliant? YES YES YES YES
Monthly Average (mg/L) 3.0 3 0.13 0.02
Loading (kg/d) 3.79 3.79 0.17 0.03
Compliant? YES YES YES YES
Monthly Average (mg/L) 3.0 3.5 0.20 0.02
Loading (kg/d) 3.04 3.54 0.20 0.02
Compliant? YES YES YES YES
Monthly Average (mg/L) 3.0 3.5 0.28 0.02
Loading (kg/d) 2.50 2.91 0.23 0.01
Compliant? YES YES YES YES
Monthly Average (mg/L) 3.0 3 0.52 0.03
Loading (kg/d) 1.83 1.83 0.32 0.02
Compliant? YES YES YES YES
Monthly Average (mg/L) 3 3.0 0.17 0.04
Loading (kg/d) 3.41 3.41 0.19 0.05
Compliant? YES YES YES YES
Monthly Average (mg/L) 3 3.0 0.20 0.03
Loading (kg/d) 3.64 3.64 0.24 0.03
Compliant? YES YES YES YES
Monthly Average (mg/L) 3.0 3.8 0.17 0.02
Loading (kg/d) 7.60 9.63 0.44 0.05
Compliant? YES YES YES YES
BOD SS TP NH3
January 69,866
February 96,768
March 138,620
MONTHTotal Effluent
Flow (m3)
April 90,686
37,589
December
May 50,629
June 39,200
July 31,395
78,551
August 25,795
September 18,910
October 35,253
November

Sample Sample Sample Temp. Dissociation Effluent Fraction of Un-ionized Date Temperature Kelvin Constant Sample pH Un-ionized Ammonia
° C pKa on-site Ammonia (mg/L)7-Jan-16 10.1 283.25 9.73 8.00 0.0184 < 0.01 0.000214-Jan-16 9.5 282.65 9.75 8.00 0.0175 < 0.01 0.000221-Jan-16 7.9 281.05 9.80 8.60 0.0589 < 0.01 0.000628-Jan-16 9.6 282.75 9.75 8.60 0.0668 < 0.01 0.000704-Feb-16 7.2 280.35 9.83 8.20 0.0230 < 0.01 0.000211-Feb-16 8.5 281.65 9.78 8.10 0.0203 < 0.01 0.000218-Feb-16 8.1 281.25 9.80 8.20 0.0247 < 0.01 0.000225-Feb-16 7.9 281.05 9.80 8.30 0.0304 0.18 0.005503-Mar-16 7.1 280.25 9.83 8.00 0.0145 < 0.01 0.000110-Mar-16 5.7 278.85 9.88 8.20 0.0205 0.35 0.007217-Mar-16 7.4 280.55 9.82 8.40 0.0366 0.03 0.001122-Mar-16 7.0 280.15 9.83 8.50 0.0442 0.05 0.002231-Mar-16 7.1 280.25 9.83 7.50 0.0046 0.07 0.000307-Apr-16 7.1 280.25 9.83 8.00 0.0145 0.06 0.000914-Apr-16 7.2 280.35 9.83 8.10 0.0184 < 0.01 0.000221-Apr-16 7.7 280.85 9.81 8.10 0.0191 0.06 0.001128-Apr-16 8.0 281.15 9.80 8.50 0.0477 0.07 0.003305-May-16 10.4 283.55 9.72 8.40 0.0459 0.02 0.000912-May-16 9.9 283.05 9.73 8.40 0.0442 0.04 0.001819-May-16 10.2 283.35 9.72 7.80 0.0118 0.03 0.000426-May-16 11.8 284.95 9.67 8.20 0.0327 0.02 0.000702-Jun-16 13.3 286.45 9.62 7.80 0.0149 0.04 0.000609-Jun-16 12.9 286.05 9.63 8.00 0.0227 < 0.01 0.000216-Jun-16 14.2 287.35 9.59 7.50 0.0081 0.02 0.000223-Jun-16 14.2 287.35 9.59 7.80 0.0159 0.03 0.000530-Jun-16 14.8 287.95 9.57 7.50 0.0084 < 0.01 0.000107-Jul-16 15.2 288.35 9.56 7.80 0.0172 < 0.01 0.000214-Jul-16 15.8 288.95 9.54 7.70 0.0143 < 0.01 0.000121-Jul-16 17.1 290.25 9.50 7.80 0.0198 0.03 0.000628-Jul-16 16.5 289.65 9.52 7.50 0.0096 < 0.01 0.000104-Aug-16 17.6 290.75 9.48 7.90 0.0257 0.01 0.000311-Aug-16 17.5 290.65 9.48 7.30 0.0065 0.02 0.000118-Aug-16 17.5 290.65 9.48 7.50 0.0103 0.02 0.000225-Aug-16 17.6 290.75 9.48 7.50 0.0104 0.01 0.000101-Sep-16 18.1 291.25 9.46 7.30 0.0068 < 0.01 0.000108-Sep-16 18.1 291.25 9.46 7.70 0.0170 < 0.01 0.000215-Sep-16 17.3 290.45 9.49 7.80 0.0200 0.04 0.000822-Sep-16 19.2 292.35 9.43 7.60 0.0146 0.06 0.000929-Sep-16 17.7 290.85 9.48 7.50 0.0105 0.04 0.000406-Oct-16 17.5 290.65 9.48 7.50 0.0103 0.09 0.000913-Oct-16 17.1 290.25 9.50 7.60 0.0126 0.03 0.000420-Oct-16 17.8 290.95 9.47 7.70 0.0166 0.07 0.001227-Oct-16 15.1 288.25 9.56 8.00 0.0268 0.02 0.000504-Nov-16 15.5 288.65 9.55 7.90 0.0220 < 0.01 0.000210-Nov-16 15.8 288.95 9.54 8.10 0.0352 0.05 0.001817-Nov-16 15.0 288.15 9.56 8.50 0.0794 0.04 0.003224-Nov-16 13.8 286.95 9.60 8.00 0.0243 < 0.01 0.000201-Dec-16 13.7 286.85 9.61 8.20 0.0377 < 0.01 0.000408-Dec-16 13.0 286.15 9.63 8.10 0.0286 < 0.01 0.000315-Dec-16 12.4 285.55 9.65 8.40 0.0532 0.01 0.000522-Dec-16 12.0 285.15 9.66 8.00 0.0212 < 0.01 0.000228-Dec-16 10.4 283.55 9.72 8.40 0.0459 0.06 0.0028
f = 1/(10^(pKa - pH) +1), where f is the decimal fraction of un-ionized ammonia (NH3).
pKa = 0.09018 + 2729.92/T, where pKa is the dissociation constant of ammonia at a given temperature.
T = (K = degrees C + 273.16), where T is the ambient water temperature in Kelvin.
2016 - IROQUOIS WWTP EFFLUENT UN-IONIZED AMMONIA
Total Ammonia (mg/L)
(NH3 + NH4 as N)
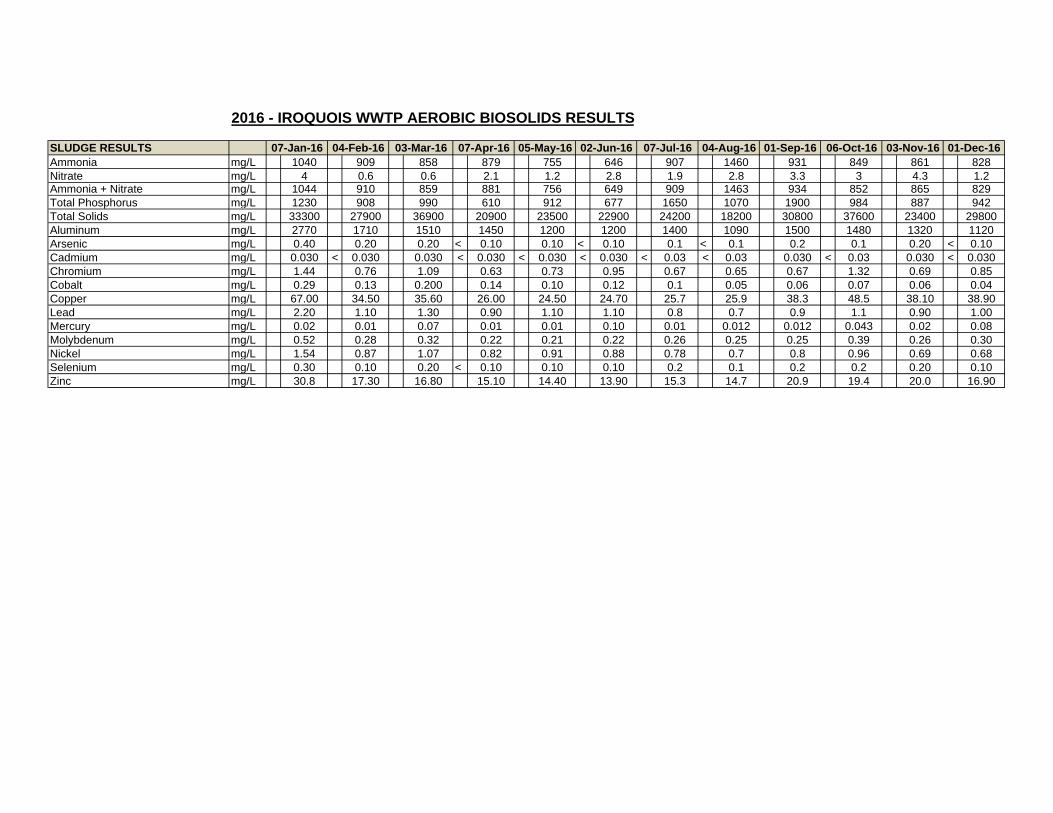
2016 - IROQUOIS WWTP AEROBIC BIOSOLIDS RESULTS
SLUDGE RESULTSAmmonia mg/L 1040 909 858 879 755 646 907 1460 931 849 861 828Nitrate mg/L 4 0.6 0.6 2.1 1.2 2.8 1.9 2.8 3.3 3 4.3 1.2Ammonia + Nitrate mg/L 1044 910 859 881 756 649 909 1463 934 852 865 829Total Phosphorus mg/L 1230 908 990 610 912 677 1650 1070 1900 984 887 942Total Solids mg/L 33300 27900 36900 20900 23500 22900 24200 18200 30800 37600 23400 29800Aluminum mg/L 2770 1710 1510 1450 1200 1200 1400 1090 1500 1480 1320 1120Arsenic mg/L 0.40 0.20 0.20 < 0.10 0.10 < 0.10 0.1 < 0.1 0.2 0.1 0.20 < 0.10Cadmium mg/L 0.030 < 0.030 0.030 < 0.030 < 0.030 < 0.030 < 0.03 < 0.03 0.030 < 0.03 0.030 < 0.030Chromium mg/L 1.44 0.76 1.09 0.63 0.73 0.95 0.67 0.65 0.67 1.32 0.69 0.85Cobalt mg/L 0.29 0.13 0.200 0.14 0.10 0.12 0.1 0.05 0.06 0.07 0.06 0.04Copper mg/L 67.00 34.50 35.60 26.00 24.50 24.70 25.7 25.9 38.3 48.5 38.10 38.90Lead mg/L 2.20 1.10 1.30 0.90 1.10 1.10 0.8 0.7 0.9 1.1 0.90 1.00Mercury mg/L 0.02 0.01 0.07 0.01 0.01 0.10 0.01 0.012 0.012 0.043 0.02 0.08Molybdenum mg/L 0.52 0.28 0.32 0.22 0.21 0.22 0.26 0.25 0.25 0.39 0.26 0.30Nickel mg/L 1.54 0.87 1.07 0.82 0.91 0.88 0.78 0.7 0.8 0.96 0.69 0.68Selenium mg/L 0.30 0.10 0.20 < 0.10 0.10 0.10 0.2 0.1 0.2 0.2 0.20 0.10Zinc mg/L 30.8 17.30 16.80 15.10 14.40 13.90 15.3 14.7 20.9 19.4 20.0 16.90
06-Oct-1604-Aug-16 01-Sep-1607-Jul-16 03-Nov-16 01-Dec-1602-Jun-1607-Jan-16 04-Feb-16 03-Mar-16 07-Apr-16 05-May-16

Jan Feb Mar Apr May June July Aug Sept Oct Nov DecAmmonia 1040 909 858.00 879 755.0 646.0 907 1460 931 849 861 828
Nitrate 4 0.6 0.60 2.1 1.2 2.8 1.9 2.8 3.3 3 4 1Ammonia + Nitrate 1044 909.6 858.60 881.1 756.2 648.8 908.9 1462.8 934.3 852 865 829Total Phosphorus 1230 908 990.00 610 912.0 677.0 1650 1070 1900 984 887 942
Total Solids 33300 27900 36900.00 20900 23500.0 22900.0 24200 18200 30800 37600 23400 29800Aluminum 2770 1710 1510.00 1450 1200.0 1200.0 1400 1090 1500 1480 1320 1120Arsenic 0.4 0.2 0.20 0.1 0.1 0.1 0.1 0.1 0.2 0 0 0
Cadmium 0.0 0.03 0.03 0.03 0.0 0.0 0.0 0.0 0.0 0.0 0.0 0.0Chromium 1.4 0.76 1.09 0.63 0.7 1.0 0.7 0.7 0.7 1.3 0.7 0.9
Cobalt 0.29 0.13 0.20 0.14 0.10 0.12 0.10 0.05 0.06 0.07 0.06 0.04Copper 67.0 34.5 35.60 26 24.5 24.7 25.7 25.9 38.3 48.5 38.1 38.9Lead 2.2 1.1 1.30 0.9 1.1 1.1 0.8 0.7 0.9 1.1 0.9 1.0
Mercury 0.023 0.010 0.07 0.008 0.010 0.101 0.010 0.012 0.012 0.043 0.015 0.075Molybdenum 0.5 0.28 0.32 0.22 0.2 0.2 0.3 0.3 0.3 0.4 0.3 0.3
Nickel 1.5 0.87 1.07 0.82 0.9 0.9 0.8 0.7 0.8 1.0 0.7 0.7Selenium 0.3 0.1 0.20 0.1 0.1 0.1 0.2 0.1 0.2 0.2 0.2 0.1
Zinc 30.8 17.3 16.80 15.1 14.4 13.9 15.3 14.7 20.9 19.4 20.0 16.9
Jan Feb Mar Apr May June July Aug Sept Oct Nov Dec LimitArsenic 12.01 7.17 5.42 4.78 4.26 4.37 4.13 5.49 6.49 2.66 8.55 3.36 170
Cadmium 0.90 1.08 0.81 1.44 1.28 1.31 1.24 1.65 0.97 0.80 1.28 1.01 34Chromium 43.24 27.24 29.54 30.14 31.06 41.48 27.69 35.71 21.75 35.11 29.49 28.52 2800
Cobalt 8.71 4.66 5.42 6.70 4.26 5.24 4.13 2.75 1.95 1.86 2.56 1.34 340Copper 2012.01 1236.56 964.77 1244.02 1042.55 1078.60 1061.98 1423.08 1243.51 1289.89 1628.21 1305.37 1700Lead 66.07 39.43 35.23 43.06 46.81 48.03 33.06 38.46 29.22 29.26 38.46 33.56 1100
Mercury 0.69 0.36 2.01 0.38 0.43 4.41 0.41 0.66 0.39 1.14 0.64 2.52 11Molybdenum 15.62 10.04 8.67 10.53 8.94 9.61 10.74 13.74 8.12 10.37 11.11 10.07 94
Nickel 46.25 31.18 29.00 39.23 38.72 38.43 32.23 38.46 25.97 25.53 29.49 22.82 420Selenium 9.01 3.58 5.42 4.78 4.26 4.37 8.26 5.49 6.49 5.32 8.55 3.36 34
Zinc 924.92 620.07 455.28 722.49 612.77 606.99 632.23 807.69 678.57 515.96 854.70 567.11 4200
Sludge is Acceptable FALSE TRUE TRUE TRUE TRUE TRUE TRUE TRUE TRUE TRUE TRUE TRUE
2016 - IROQUOIS WWTP MONTHLY AEROBIC BIOSOLIDS CONCENTRATION RATIO
SOME ANALYSIS RESULTS EXPRESSED AS "<" (LESS THAN);HOWEVER, IN ORDER TO COMPLETE THECALCULATION, ONLY THE NUMERIC VALUE WAS USED; THEREFORE THE AVG. CONC. IS GREATER
THAN ACTUAL.
Metal/Solids Ratio (Sludge)
Metals ratio = mg metals/kg solids2016 - IROQUOIS WWTP MONTHLY AEROBIC BIOSOLIDS CONCENTRATION RATIO
APPENDIX B:
EXTERNAL MAINTENANCE SUMMARY

Iroquois Wastewater External Maintenance Summary - 2016
Jan 5: Atel Air on site to fix furnace Jan 19: Atel Air on site to fix fire damper Jan 27: TPS on site to adjust programming for foam LIT Feb 4-5: Hewitt’s replacing bearings in scrubber fan Feb 29: Premier Tech changed wasting removal to a fixed number and not based off of
nominal flow April 4: Premier Tech changed timing of SBR sequences April 12-13: Gen Rep & All-Teck Electrical set up temporary generator April 15: Arthor Thom Electric looking at Screen 2 motor April 20: Hewitt’s on site to fix screen motor April 22: Gen Rep and All-Teck Electrical onsite to install new controller in generator May 30: Hewitt removed scrubber fan June 3: Hewitt’s re-installed scrubber fan June 24: Hewitt’s on site to work on de-grit shoot July 27-29: Capital Controls on site to calibrate flow meters Aug 22: ISI on site to do ATAD programming Sept 19: Bell replacing modem Nov. 29: Edge Tech verifying gas detectors Oct. 24: Gen Rep on site to conduct generator maintenance
APPENDIX C:
INSTRUMENT CALIBRATIONS & VERIFICATIONS