irdai public disclosures
TRANSCRIPT
IRDAI PUBLIC DISCLOSURESFOR THE YEAR ENDED MARCH 31, 2017
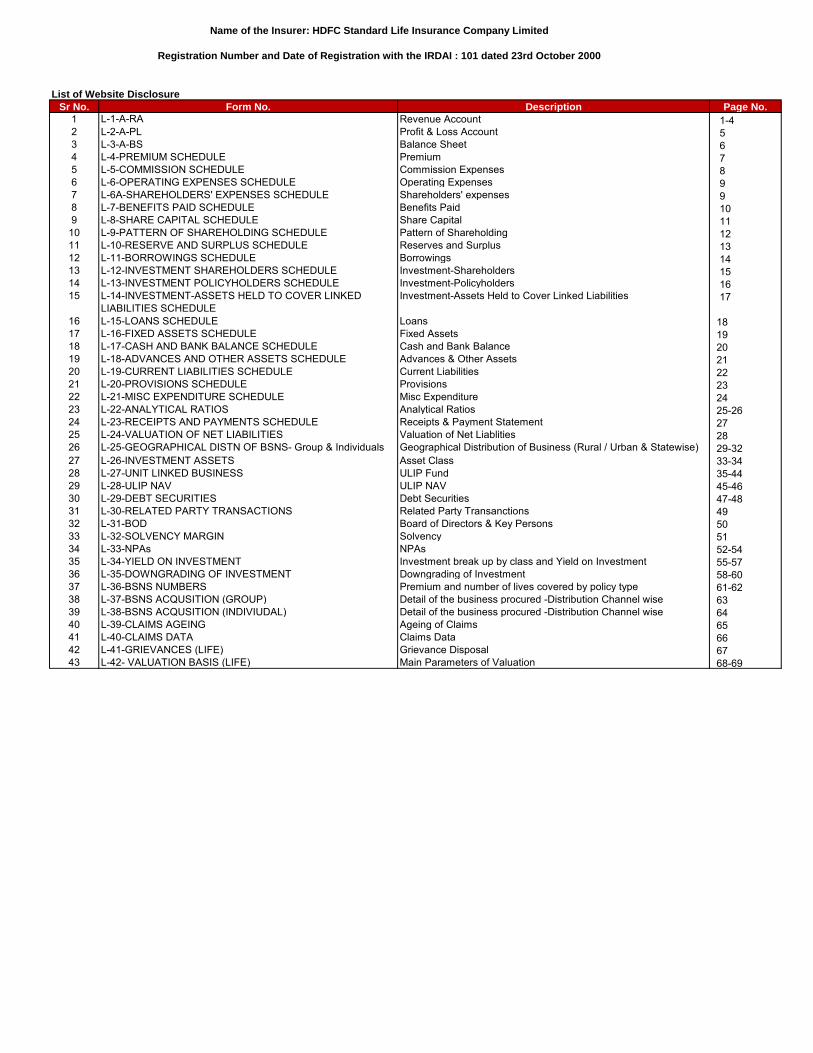
Sr No. Form No. Description Page No.
1 L-1-A-RA Revenue Account2 L-2-A-PL Profit & Loss Account3 L-3-A-BS Balance Sheet4 L-4-PREMIUM SCHEDULE Premium5 L-5-COMMISSION SCHEDULE Commission Expenses6 L-6-OPERATING EXPENSES SCHEDULE Operating Expenses 7 L-6A-SHAREHOLDERS' EXPENSES SCHEDULE Shareholders' expenses8 L-7-BENEFITS PAID SCHEDULE Benefits Paid9 L-8-SHARE CAPITAL SCHEDULE Share Capital
10 L-9-PATTERN OF SHAREHOLDING SCHEDULE Pattern of Shareholding11 L-10-RESERVE AND SURPLUS SCHEDULE Reserves and Surplus12 L-11-BORROWINGS SCHEDULE Borrowings13 L-12-INVESTMENT SHAREHOLDERS SCHEDULE Investment-Shareholders14 L-13-INVESTMENT POLICYHOLDERS SCHEDULE Investment-Policyholders15 L-14-INVESTMENT-ASSETS HELD TO COVER LINKED
LIABILITIES SCHEDULEInvestment-Assets Held to Cover Linked Liabilities
16 L-15-LOANS SCHEDULE Loans17 L-16-FIXED ASSETS SCHEDULE Fixed Assets18 L-17-CASH AND BANK BALANCE SCHEDULE Cash and Bank Balance19 L-18-ADVANCES AND OTHER ASSETS SCHEDULE Advances & Other Assets20 L-19-CURRENT LIABILITIES SCHEDULE Current Liabilities21 L-20-PROVISIONS SCHEDULE Provisions22 L-21-MISC EXPENDITURE SCHEDULE Misc Expenditure 23 L-22-ANALYTICAL RATIOS Analytical Ratios 24 L-23-RECEIPTS AND PAYMENTS SCHEDULE Receipts & Payment Statement25 L-24-VALUATION OF NET LIABILITIES Valuation of Net Liablities26 L-25-GEOGRAPHICAL DISTN OF BSNS- Group & Individuals Geographical Distribution of Business (Rural / Urban & Statewise)27 L-26-INVESTMENT ASSETS Asset Class28 L-27-UNIT LINKED BUSINESS ULIP Fund29 L-28-ULIP NAV ULIP NAV30 L-29-DEBT SECURITIES Debt Securities31 L-30-RELATED PARTY TRANSACTIONS Related Party Transanctions32 L-31-BOD Board of Directors & Key Persons33 L-32-SOLVENCY MARGIN Solvency34 L-33-NPAs NPAs35 L-34-YIELD ON INVESTMENT Investment break up by class and Yield on Investment36 L-35-DOWNGRADING OF INVESTMENT Downgrading of Investment37 L-36-BSNS NUMBERS Premium and number of lives covered by policy type38 L-37-BSNS ACQUSITION (GROUP) Detail of the business procured -Distribution Channel wise39 L-38-BSNS ACQUSITION (INDIVIUDAL) Detail of the business procured -Distribution Channel wise40 L-39-CLAIMS AGEING Ageing of Claims41 L-40-CLAIMS DATA Claims Data42 L-41-GRIEVANCES (LIFE) Grievance Disposal43 L-42- VALUATION BASIS (LIFE) Main Parameters of Valuation
Registration Number and Date of Registration with the IRDAI : 101 dated 23rd October 2000
List of Website Disclosure
Name of the Insurer: HDFC Standard Life Insurance Company Limited
1-45678991011121314151617
1819202122232425-26272829-3233-3435-4445-4647-4849505152-5455-5758-6061-62636465666768-69
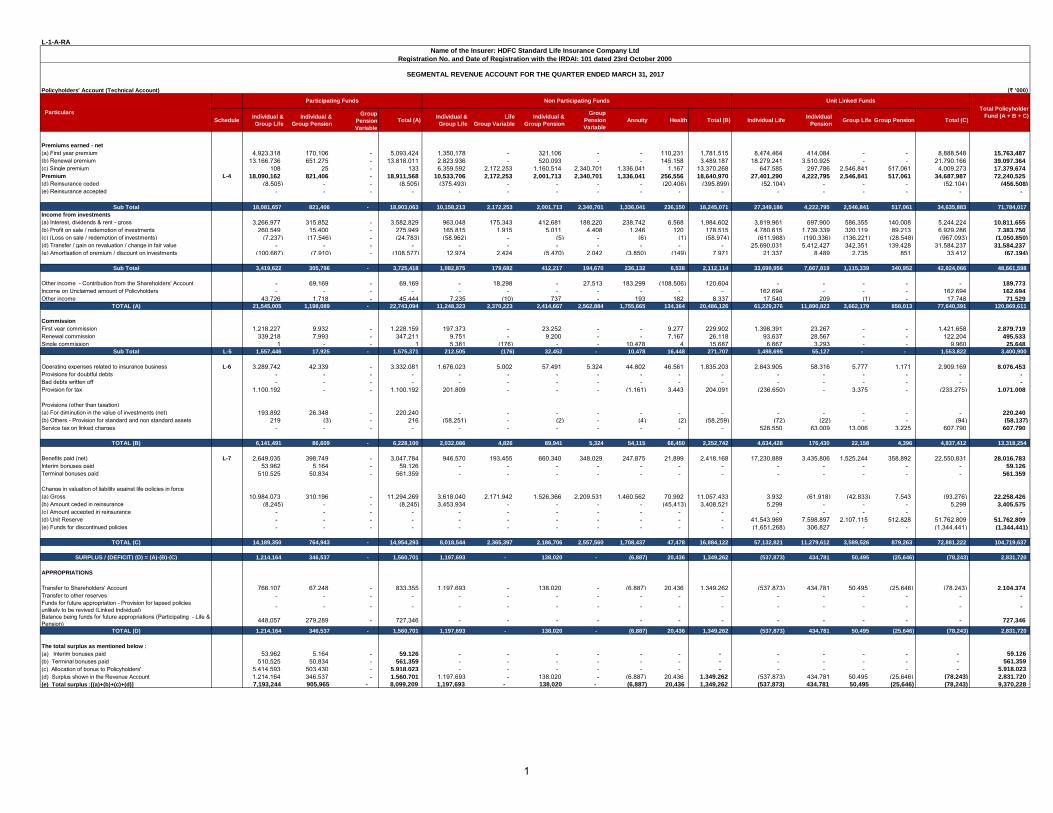
L-1-A-RA
Policyholders' Account (Technical Account) (` '000)
ScheduleIndividual &
Group Life
Individual &
Group Pension
Group
Pension
Variable
Total (A)Individual &
Group Life
Life
Group Variable
Individual &
Group Pension
Group
Pension
Variable
Annuity Health Total (B) Individual LifeIndividual
PensionGroup Life Group Pension Total (C)
Premiums earned - net
(a) First year premium 4,923,318 170,106 - 5,093,424 1,350,178 - 321,106 - - 110,231 1,781,515 8,474,464 414,084 - - 8,888,548 15,763,487
(b) Renewal premium 13,166,736 651,275 - 13,818,011 2,823,936 - 520,093 - - 145,158 3,489,187 18,279,241 3,510,925 - - 21,790,166 39,097,364
(c) Single premium 108 25 - 133 6,359,592 2,172,253 1,160,514 2,340,701 1,336,041 1,167 13,370,268 647,585 297,786 2,546,841 517,061 4,009,273 17,379,674
Premium L-4 18,090,162 821,406 - 18,911,568 10,533,706 2,172,253 2,001,713 2,340,701 1,336,041 256,556 18,640,970 27,401,290 4,222,795 2,546,841 517,061 34,687,987 72,240,525
(d) Reinsurance ceded (8,505) - - (8,505) (375,493) - - - - (20,406) (395,899) (52,104) - - - (52,104) (456,508)
(e) Reinsurance accepted - - - - - - - - - - - - - - - - -
Sub Total 18,081,657 821,406 - 18,903,063 10,158,213 2,172,253 2,001,713 2,340,701 1,336,041 236,150 18,245,071 27,349,186 4,222,795 2,546,841 517,061 34,635,883 71,784,017
Income from investments
(a) Interest, dividends & rent - gross 3,266,977 315,852 - 3,582,829 963,048 175,343 412,681 188,220 238,742 6,568 1,984,602 3,819,961 697,900 586,355 140,008 5,244,224 10,811,655
(b) Profit on sale / redemption of investments 260,549 15,400 - 275,949 165,815 1,915 5,011 4,408 1,246 120 178,515 4,780,615 1,739,339 320,119 89,213 6,929,286 7,383,750
(c) (Loss on sale / redemption of investments) (7,237) (17,546) - (24,783) (58,962) - (5) - (6) (1) (58,974) (611,988) (190,336) (136,221) (28,548) (967,093) (1,050,850)
(d) Transfer / gain on revaluation / change in fair value - - - - - - - - - - - 25,690,031 5,412,427 342,351 139,428 31,584,237 31,584,237
(e) Amortisation of premium / discount on investments (100,667) (7,910) - (108,577) 12,974 2,424 (5,470) 2,042 (3,850) (149) 7,971 21,337 8,489 2,735 851 33,412 (67,194)
Sub Total 3,419,622 305,796 - 3,725,418 1,082,875 179,682 412,217 194,670 236,132 6,538 2,112,114 33,699,956 7,667,819 1,115,339 340,952 42,824,066 48,661,598
Other income - Contribution from the Shareholders' Account - 69,169 - 69,169 - 18,298 - 27,513 183,299 (108,506) 120,604 - - - - - 189,773
Income on Unclaimed amount of Policyholders - - - - - - - - - - - 162,694 - - - 162,694 162,694
Other income 43,726 1,718 - 45,444 7,235 (10) 737 - 193 182 8,337 17,540 209 (1) - 17,748 71,529 TOTAL (A) 21,545,005 1,198,089 - 22,743,094 11,248,323 2,370,223 2,414,667 2,562,884 1,755,665 134,364 20,486,126 61,229,376 11,890,823 3,662,179 858,013 77,640,391 120,869,611
Commission
First year commission 1,218,227 9,932 - 1,228,159 197,373 - 23,252 - - 9,277 229,902 1,398,391 23,267 - - 1,421,658 2,879,719
Renewal commission 339,218 7,993 - 347,211 9,751 - 9,200 - - 7,167 26,118 93,637 28,567 - - 122,204 495,533
Single commission 1 - - 1 5,381 (176) - - 10,478 4 15,687 6,667 3,293 - - 9,960 25,648 Sub Total L-5 1,557,446 17,925 - 1,575,371 212,505 (176) 32,452 - 10,478 16,448 271,707 1,498,695 55,127 - - 1,553,822 3,400,900
Operating expenses related to insurance business L-6 3,289,742 42,339 - 3,332,081 1,676,023 5,002 57,491 5,324 44,802 46,561 1,835,203 2,843,905 58,316 5,777 1,171 2,909,169 8,076,453
Provisions for doubtful debts - - - - - - - - - - - - - - - - -
Bad debts written off - - - - - - - - - - - - - - - - -
Provision for tax 1,100,192 - - 1,100,192 201,809 - - - (1,161) 3,443 204,091 (236,650) - 3,375 - (233,275) 1,071,008
Provisions (other than taxation)(a) For diminution in the value of investments (net) 193,892 26,348 - 220,240 - - - - - - - - - - - - 220,240
(b) Others - Provision for standard and non standard assets 219 (3) - 216 (58,251) - (2) - (4) (2) (58,259) (72) (22) - - (94) (58,137)
Service tax on linked charges - - - - - - - - - - - 528,550 63,009 13,006 3,225 607,790 607,790
TOTAL (B) 6,141,491 86,609 - 6,228,100 2,032,086 4,826 89,941 5,324 54,115 66,450 2,252,742 4,634,428 176,430 22,158 4,396 4,837,412 13,318,254
Benefits paid (net) L-7 2,649,035 398,749 - 3,047,784 946,570 193,455 660,340 348,029 247,875 21,899 2,418,168 17,230,889 3,435,806 1,525,244 358,892 22,550,831 28,016,783
Interim bonuses paid 53,962 5,164 - 59,126 - - - - - - - - - - - - 59,126
Terminal bonuses paid 510,525 50,834 - 561,359 - - - - - - - - - - - - 561,359
Change in valuation of liability against life policies in force(a) Gross 10,984,073 310,196 - 11,294,269 3,618,040 2,171,942 1,526,366 2,209,531 1,460,562 70,992 11,057,433 3,932 (61,918) (42,833) 7,543 (93,276) 22,258,426
(b) Amount ceded in reinsurance (8,245) - - (8,245) 3,453,934 - - - - (45,413) 3,408,521 5,299 - - - 5,299 3,405,575
(c) Amount accepted in reinsurance - - - - - - - - - - - - - - - - -
(d) Unit Reserve - - - - - - - - - - - 41,543,969 7,598,897 2,107,115 512,828 51,762,809 51,762,809
(e) Funds for discontinued policies - - - - - - - - - - - (1,651,268) 306,827 - - (1,344,441) (1,344,441)
TOTAL (C) 14,189,350 764,943 - 14,954,293 8,018,544 2,365,397 2,186,706 2,557,560 1,708,437 47,478 16,884,122 57,132,821 11,279,612 3,589,526 879,263 72,881,222 104,719,637
SURPLUS / (DEFICIT) (D) = (A)-(B)-(C) 1,214,164 346,537 - 1,560,701 1,197,693 - 138,020 - (6,887) 20,436 1,349,262 (537,873) 434,781 50,495 (25,646) (78,243) 2,831,720
APPROPRIATIONS
Transfer to Shareholders' Account 766,107 67,248 - 833,355 1,197,693 - 138,020 - (6,887) 20,436 1,349,262 (537,873) 434,781 50,495 (25,646) (78,243) 2,104,374
Transfer to other reserves - - - - - - - - - - - - - - - - - Funds for future appropriation - Provision for lapsed policies unlikely to be revived (Linked Individual) - - - - - - - - - - - - - - - - -
Balance being funds for future appropriations (Participating - Life & Pension) 448,057 279,289 - 727,346 - - - - - - - - - - - - 727,346
TOTAL (D) 1,214,164 346,537 - 1,560,701 1,197,693 - 138,020 - (6,887) 20,436 1,349,262 (537,873) 434,781 50,495 (25,646) (78,243) 2,831,720
The total surplus as mentioned below :
(a) Interim bonuses paid 53,962 5,164 - 59,126 - - - - - - - - - - - - 59,126
(b) Terminal bonuses paid 510,525 50,834 - 561,359 - - - - - - - - - - - - 561,359
(c) Allocation of bonus to Policyholders' 5,414,593 503,430 - 5,918,023 - - - - - - - - - - - - 5,918,023
(d) Surplus shown in the Revenue Account 1,214,164 346,537 - 1,560,701 1,197,693 - 138,020 - (6,887) 20,436 1,349,262 (537,873) 434,781 50,495 (25,646) (78,243) 2,831,720
(e) Total surplus :[(a)+(b)+(c)+(d)] 7,193,244 905,965 - 8,099,209 1,197,693 - 138,020 - (6,887) 20,436 1,349,262 (537,873) 434,781 50,495 (25,646) (78,243) 9,370,228
Name of the Insurer: HDFC Standard Life Insurance Company Ltd
Registration No. and Date of Registration with the IRDAI: 101 dated 23rd October 2000
SEGMENTAL REVENUE ACCOUNT FOR THE QUARTER ENDED MARCH 31, 2017
Participating Funds Non Participating Funds Unit Linked Funds
Total Policyholder
Fund (A + B + C) Particulars
1
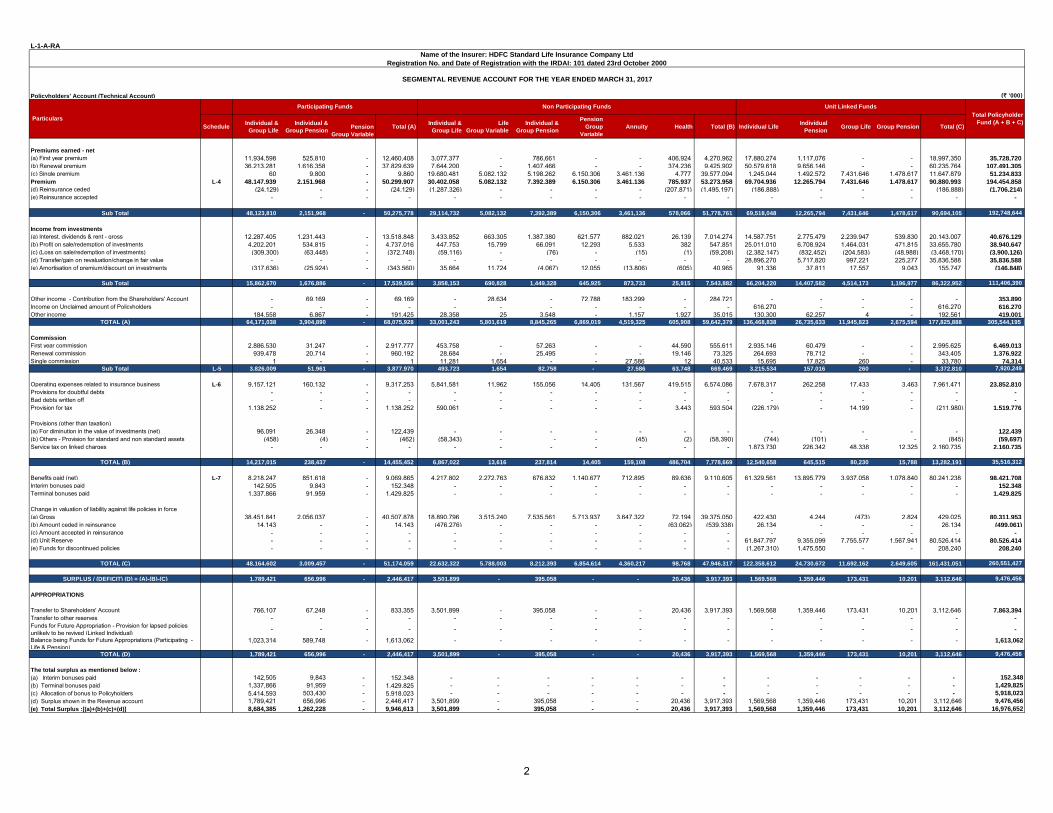
L-1-A-RA
Policyholders' Account (Technical Account) (` '000)
ScheduleIndividual &
Group Life
Individual &
Group Pension
Pension
Group Variable
Total (A)Individual &
Group Life
Life
Group Variable
Individual &
Group Pension
Pension
Group
Variable
Annuity Health Total (B) Individual LifeIndividual
PensionGroup Life Group Pension Total (C)
Premiums earned - net
(a) First year premium 11,934,598 525,810 - 12,460,408 3,077,377 - 786,661 - - 406,924 4,270,962 17,880,274 1,117,076 - - 18,997,350 35,728,720
(b) Renewal premium 36,213,281 1,616,358 - 37,829,639 7,644,200 - 1,407,466 - - 374,236 9,425,902 50,579,618 9,656,146 - - 60,235,764 107,491,305
(c) Single premium 60 9,800 - 9,860 19,680,481 5,082,132 5,198,262 6,150,306 3,461,136 4,777 39,577,094 1,245,044 1,492,572 7,431,646 1,478,617 11,647,879 51,234,833
Premium L-4 48,147,939 2,151,968 - 50,299,907 30,402,058 5,082,132 7,392,389 6,150,306 3,461,136 785,937 53,273,958 69,704,936 12,265,794 7,431,646 1,478,617 90,880,993 194,454,858
(d) Reinsurance ceded (24,129) - - (24,129) (1,287,326) - - - - (207,871) (1,495,197) (186,888) - - - (186,888) (1,706,214)
(e) Reinsurance accepted - - - - - - - - - - - - - - - - -
Sub Total 48,123,810 2,151,968 - 50,275,778 29,114,732 5,082,132 7,392,389 6,150,306 3,461,136 578,066 51,778,761 69,518,048 12,265,794 7,431,646 1,478,617 90,694,105 192,748,644
Income from investments
(a) Interest, dividends & rent - gross 12,287,405 1,231,443 - 13,518,848 3,433,852 663,305 1,387,380 621,577 882,021 26,139 7,014,274 14,587,751 2,775,479 2,239,947 539,830 20,143,007 40,676,129
(b) Profit on sale/redemption of investments 4,202,201 534,815 - 4,737,016 447,753 15,799 66,091 12,293 5,533 382 547,851 25,011,010 6,708,924 1,464,031 471,815 33,655,780 38,940,647
(c) (Loss on sale/redemption of investments) (309,300) (63,448) - (372,748) (59,116) - (76) - (15) (1) (59,208) (2,382,147) (832,452) (204,583) (48,988) (3,468,170) (3,900,126)
(d) Transfer/gain on revaluation/change in fair value - - - - - - - - - - - 28,896,270 5,717,820 997,221 225,277 35,836,588 35,836,588
(e) Amortisation of premium/discount on investments (317,636) (25,924) - (343,560) 35,664 11,724 (4,067) 12,055 (13,806) (605) 40,965 91,336 37,811 17,557 9,043 155,747 (146,848)
Sub Total 15,862,670 1,676,886 - 17,539,556 3,858,153 690,828 1,449,328 645,925 873,733 25,915 7,543,882 66,204,220 14,407,582 4,514,173 1,196,977 86,322,952 111,406,390
Other income - Contribution from the Shareholders' Account - 69,169 - 69,169 - 28,634 - 72,788 183,299 - 284,721 - - - - - 353,890
Income on Unclaimed amount of Policyholders - - - - - - - - - - - 616,270 - - - 616,270 616,270
Other income 184,558 6,867 - 191,425 28,358 25 3,548 - 1,157 1,927 35,015 130,300 62,257 4 - 192,561 419,001 TOTAL (A) 64,171,038 3,904,890 - 68,075,928 33,001,243 5,801,619 8,845,265 6,869,019 4,519,325 605,908 59,642,379 136,468,838 26,735,633 11,945,823 2,675,594 177,825,888 305,544,195
Commission
First year commission 2,886,530 31,247 - 2,917,777 453,758 - 57,263 - - 44,590 555,611 2,935,146 60,479 - - 2,995,625 6,469,013
Renewal commission 939,478 20,714 - 960,192 28,684 - 25,495 - - 19,146 73,325 264,693 78,712 - - 343,405 1,376,922
Single commission 1 - - 1 11,281 1,654 - - 27,586 12 40,533 15,695 17,825 260 - 33,780 74,314 Sub Total L-5 3,826,009 51,961 - 3,877,970 493,723 1,654 82,758 - 27,586 63,748 669,469 3,215,534 157,016 260 - 3,372,810 7,920,249
Operating expenses related to insurance business L-6 9,157,121 160,132 - 9,317,253 5,841,581 11,962 155,056 14,405 131,567 419,515 6,574,086 7,678,317 262,258 17,433 3,463 7,961,471 23,852,810
Provisions for doubtful debts - - - - - - - - - - - - - - - - -
Bad debts written off - - - - - - - - - - - - - - - - -
Provision for tax 1,138,252 - - 1,138,252 590,061 - - - - 3,443 593,504 (226,179) - 14,199 - (211,980) 1,519,776
Provisions (other than taxation)(a) For diminution in the value of investments (net) 96,091 26,348 - 122,439 - - - - - - - - - - - - 122,439
(b) Others - Provision for standard and non standard assets (458) (4) - (462) (58,343) - - - (45) (2) (58,390) (744) (101) - - (845) (59,697)
Service tax on linked charges - - - - - - - - - - - 1,873,730 226,342 48,338 12,325 2,160,735 2,160,735
TOTAL (B) 14,217,015 238,437 - 14,455,452 6,867,022 13,616 237,814 14,405 159,108 486,704 7,778,669 12,540,658 645,515 80,230 15,788 13,282,191 35,516,312
Benefits paid (net) L-7 8,218,247 851,618 - 9,069,865 4,217,802 2,272,763 676,832 1,140,677 712,895 89,636 9,110,605 61,329,561 13,895,779 3,937,058 1,078,840 80,241,238 98,421,708
Interim bonuses paid 142,505 9,843 - 152,348 - - - - - - - - - - - - 152,348
Terminal bonuses paid 1,337,866 91,959 - 1,429,825 - - - - - - - - - - - - 1,429,825
Change in valuation of liability against life policies in force(a) Gross 38,451,841 2,056,037 - 40,507,878 18,890,796 3,515,240 7,535,561 5,713,937 3,647,322 72,194 39,375,050 422,430 4,244 (473) 2,824 429,025 80,311,953
(b) Amount ceded in reinsurance 14,143 - - 14,143 (476,276) - - - - (63,062) (539,338) 26,134 - - - 26,134 (499,061)
(c) Amount accepted in reinsurance - - - - - - - - - - - - - - - - -
(d) Unit Reserve - - - - - - - - - - - 61,847,797 9,355,099 7,755,577 1,567,941 80,526,414 80,526,414
(e) Funds for discontinued policies - - - - - - - - - - - (1,267,310) 1,475,550 - - 208,240 208,240
TOTAL (C) 48,164,602 3,009,457 - 51,174,059 22,632,322 5,788,003 8,212,393 6,854,614 4,360,217 98,768 47,946,317 122,358,612 24,730,672 11,692,162 2,649,605 161,431,051 260,551,427
SURPLUS / (DEFICIT) (D) = (A)-(B)-(C) 1,789,421 656,996 - 2,446,417 3,501,899 - 395,058 - - 20,436 3,917,393 1,569,568 1,359,446 173,431 10,201 3,112,646 9,476,456
APPROPRIATIONS
Transfer to Shareholders' Account 766,107 67,248 - 833,355 3,501,899 - 395,058 - - 20,436 3,917,393 1,569,568 1,359,446 173,431 10,201 3,112,646 7,863,394
Transfer to other reserves - - - - - - - - - - - - - - - - - Funds for Future Appropriation - Provision for lapsed policies unlikely to be revived (Linked Individual) - - - - - - - - - - - - - - - - -
Balance being Funds for Future Appropriations (Participating - Life & Pension)
1,023,314 589,748 - 1,613,062 - - - - - - - - - - - - 1,613,062
TOTAL (D) 1,789,421 656,996 - 2,446,417 3,501,899 - 395,058 - - 20,436 3,917,393 1,569,568 1,359,446 173,431 10,201 3,112,646 9,476,456
The total surplus as mentioned below :
(a) Interim bonuses paid 142,505 9,843 - 152,348 - - - - - - - - - - - - 152,348
(b) Terminal bonuses paid 1,337,866 91,959 - 1,429,825 - - - - - - - - - - - - 1,429,825
(c) Allocation of bonus to Policyholders 5,414,593 503,430 - 5,918,023 - - - - - - - - - - - - 5,918,023
(d) Surplus shown in the Revenue account 1,789,421 656,996 - 2,446,417 3,501,899 - 395,058 - - 20,436 3,917,393 1,569,568 1,359,446 173,431 10,201 3,112,646 9,476,456
(e) Total Surplus :[(a)+(b)+(c)+(d)] 8,684,385 1,262,228 - 9,946,613 3,501,899 - 395,058 - - 20,436 3,917,393 1,569,568 1,359,446 173,431 10,201 3,112,646 16,976,652
Name of the Insurer: HDFC Standard Life Insurance Company Ltd
Registration No. and Date of Registration with the IRDAI: 101 dated 23rd October 2000
SEGMENTAL REVENUE ACCOUNT FOR THE YEAR ENDED MARCH 31, 2017
Participating Funds Unit Linked Funds
Total Policyholder
Fund (A + B + C)
Non Participating Funds
Particulars
2
L-1-A-RA
Policyholders' Account (Technical Account) (` '000)
ScheduleIndividual & Group
Life
Individual &
Group PensionGroup
Pension Variable
Total (A)Individual & Group
Life
Life
Group Variable
Individual &
Group Pension
Group
Pension VariableAnnuity Health Total (B) Individual Life
Individual
PensionGroup Life
Group
PensionTotal (C)
Premiums earned - net
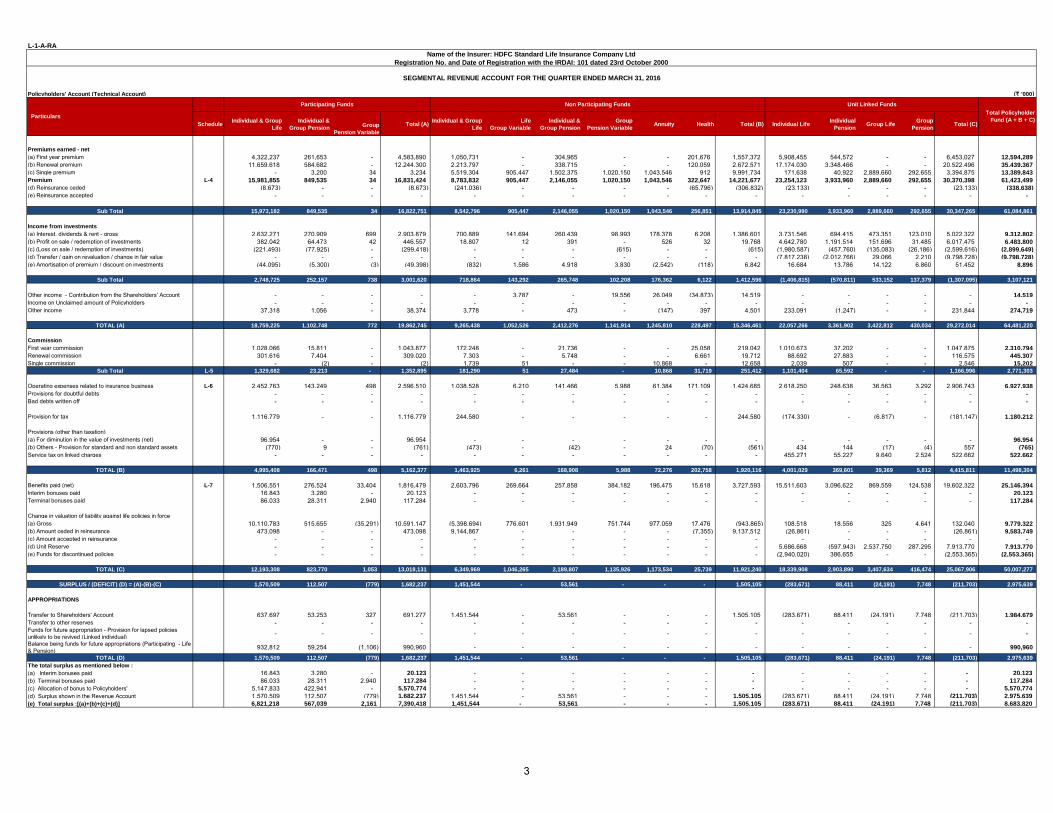
(a) First year premium 4,322,237 261,653 - 4,583,890 1,050,731 - 304,965 - - 201,676 1,557,372 5,908,455 544,572 - - 6,453,027 12,594,289
(b) Renewal premium 11,659,618 584,682 - 12,244,300 2,213,797 - 338,715 - - 120,059 2,672,571 17,174,030 3,348,466 - - 20,522,496 35,439,367
(c) Single premium - 3,200 34 3,234 5,519,304 905,447 1,502,375 1,020,150 1,043,546 912 9,991,734 171,638 40,922 2,889,660 292,655 3,394,875 13,389,843
Premium L-4 15,981,855 849,535 34 16,831,424 8,783,832 905,447 2,146,055 1,020,150 1,043,546 322,647 14,221,677 23,254,123 3,933,960 2,889,660 292,655 30,370,398 61,423,499
(d) Reinsurance ceded (8,673) - - (8,673) (241,036) - - - - (65,796) (306,832) (23,133) - - - (23,133) (338,638)
(e) Reinsurance accepted - - - - - - - - - - - - - - - - -
Sub Total 15,973,182 849,535 34 16,822,751 8,542,796 905,447 2,146,055 1,020,150 1,043,546 256,851 13,914,845 23,230,990 3,933,960 2,889,660 292,655 30,347,265 61,084,861
Income from investments
(a) Interest, dividends & rent - gross 2,632,271 270,909 699 2,903,879 700,889 141,694 260,439 98,993 178,378 6,208 1,386,601 3,731,546 694,415 473,351 123,010 5,022,322 9,312,802
(b) Profit on sale / redemption of investments 382,042 64,473 42 446,557 18,807 12 391 - 526 32 19,768 4,642,780 1,191,514 151,696 31,485 6,017,475 6,483,800
(c) (Loss on sale / redemption of investments) (221,493) (77,925) - (299,418) - - - (615) - - (615) (1,980,587) (457,760) (135,083) (26,186) (2,599,616) (2,899,649)
(d) Transfer / gain on revaluation / change in fair value - - - - - - - - - - - (7,817,238) (2,012,766) 29,066 2,210 (9,798,728) (9,798,728)
(e) Amortisation of premium / discount on investments (44,095) (5,300) (3) (49,398) (832) 1,586 4,918 3,830 (2,542) (118) 6,842 16,684 13,786 14,122 6,860 51,452 8,896
Sub Total 2,748,725 252,157 738 3,001,620 718,864 143,292 265,748 102,208 176,362 6,122 1,412,596 (1,406,815) (570,811) 533,152 137,379 (1,307,095) 3,107,121
Other income - Contribution from the Shareholders' Account - - - - - 3,787 - 19,556 26,049 (34,873) 14,519 - - - - - 14,519
Income on Unclaimed amount of Policyholders - - - - - - - - - - - - - - - - -
Other income 37,318 1,056 - 38,374 3,778 - 473 - (147) 397 4,501 233,091 (1,247) - - 231,844 274,719
TOTAL (A) 18,759,225 1,102,748 772 19,862,745 9,265,438 1,052,526 2,412,276 1,141,914 1,245,810 228,497 15,346,461 22,057,266 3,361,902 3,422,812 430,034 29,272,014 64,481,220
Commission
First year commission 1,028,066 15,811 - 1,043,877 172,248 - 21,736 - - 25,058 219,042 1,010,673 37,202 - - 1,047,875 2,310,794
Renewal commission 301,616 7,404 - 309,020 7,303 - 5,748 - - 6,661 19,712 88,692 27,883 - - 116,575 445,307
Single commission - (2) - (2) 1,739 51 - - 10,868 - 12,658 2,039 507 - - 2,546 15,202 Sub Total L-5 1,329,682 23,213 - 1,352,895 181,290 51 27,484 - 10,868 31,719 251,412 1,101,404 65,592 - - 1,166,996 2,771,303
Operating expenses related to insurance business L-6 2,452,763 143,249 498 2,596,510 1,038,528 6,210 141,466 5,988 61,384 171,109 1,424,685 2,618,250 248,638 36,563 3,292 2,906,743 6,927,938
Provisions for doubtful debts - - - - - - - - - - - - - - - - -
Bad debts written off - - - - - - - - - - - - - - - - -
Provision for tax 1,116,779 - - 1,116,779 244,580 - - - - - 244,580 (174,330) - (6,817) - (181,147) 1,180,212
Provisions (other than taxation)(a) For diminution in the value of investments (net) 96,954 - - 96,954 - - - - - - - - - - - - 96,954
(b) Others - Provision for standard and non standard assets (770) 9 - (761) (473) - (42) - 24 (70) (561) 434 144 (17) (4) 557 (765)
Service tax on linked charges - - - - - - - - - - - 455,271 55,227 9,640 2,524 522,662 522,662
TOTAL (B) 4,995,408 166,471 498 5,162,377 1,463,925 6,261 168,908 5,988 72,276 202,758 1,920,116 4,001,029 369,601 39,369 5,812 4,415,811 11,498,304
Benefits paid (net) L-7 1,506,551 276,524 33,404 1,816,479 2,603,796 269,664 257,858 384,182 196,475 15,618 3,727,593 15,511,603 3,096,622 869,559 124,538 19,602,322 25,146,394
Interim bonuses paid 16,843 3,280 - 20,123 - - - - - - - - - - - - 20,123
Terminal bonuses paid 86,033 28,311 2,940 117,284 - - - - - - - - - - - - 117,284
Change in valuation of liability against life policies in force(a) Gross 10,110,783 515,655 (35,291) 10,591,147 (5,398,694) 776,601 1,931,949 751,744 977,059 17,476 (943,865) 108,518 18,556 325 4,641 132,040 9,779,322
(b) Amount ceded in reinsurance 473,098 - - 473,098 9,144,867 - - - - (7,355) 9,137,512 (26,861) - - - (26,861) 9,583,749
(c) Amount accepted in reinsurance - - - - - - - - - - - - - - - - -
(d) Unit Reserve - - - - - - - - - - - 5,686,668 (597,943) 2,537,750 287,295 7,913,770 7,913,770
(e) Funds for discontinued policies - - - - - - - - - - - (2,940,020) 386,655 - - (2,553,365) (2,553,365)
TOTAL (C) 12,193,308 823,770 1,053 13,018,131 6,349,969 1,046,265 2,189,807 1,135,926 1,173,534 25,739 11,921,240 18,339,908 2,903,890 3,407,634 416,474 25,067,906 50,007,277
SURPLUS / (DEFICIT) (D) = (A)-(B)-(C) 1,570,509 112,507 (779) 1,682,237 1,451,544 - 53,561 - - - 1,505,105 (283,671) 88,411 (24,191) 7,748 (211,703) 2,975,639
APPROPRIATIONS
Transfer to Shareholders' Account 637,697 53,253 327 691,277 1,451,544 - 53,561 - - - 1,505,105 (283,671) 88,411 (24,191) 7,748 (211,703) 1,984,679
Transfer to other reserves - - - - - - - - - - - - - - - - - Funds for future appropriation - Provision for lapsed policies unlikely to be revived (Linked individual) - - - - - - - - - - - - - - - - -
Balance being funds for future appropriations (Participating - Life & Pension) 932,812 59,254 (1,106) 990,960 - - - - - - - - - - - - 990,960
TOTAL (D) 1,570,509 112,507 (779) 1,682,237 1,451,544 - 53,561 - - - 1,505,105 (283,671) 88,411 (24,191) 7,748 (211,703) 2,975,639
The total surplus as mentioned below :
(a) Interim bonuses paid 16,843 3,280 - 20,123 - - - - - - - - - - - - 20,123
(b) Terminal bonuses paid 86,033 28,311 2,940 117,284 - - - - - - - - - - - - 117,284
(c) Allocation of bonus to Policyholders' 5,147,833 422,941 - 5,570,774 - - - - - - - - - - - - 5,570,774
(d) Surplus shown in the Revenue Account 1,570,509 112,507 (779) 1,682,237 1,451,544 - 53,561 - - - 1,505,105 (283,671) 88,411 (24,191) 7,748 (211,703) 2,975,639
(e) Total surplus :[(a)+(b)+(c)+(d)] 6,821,218 567,039 2,161 7,390,418 1,451,544 - 53,561 - - - 1,505,105 (283,671) 88,411 (24,191) 7,748 (211,703) 8,683,820
Name of the Insurer: HDFC Standard Life Insurance Company Ltd
Registration No. and Date of Registration with the IRDAI: 101 dated 23rd October 2000
SEGMENTAL REVENUE ACCOUNT FOR THE QUARTER ENDED MARCH 31, 2016
Participating Funds Non Participating Funds Unit Linked Funds
Total Policyholder
Fund (A + B + C) Particulars
3
L-1-A-RA
Policyholders' Account (Technical Account) (` '000)
ScheduleIndividual &
Group Life
Individual &
Group Pension
Pension
Group Variable
Total (A)Individual &
Group Life
Life
Group Variable
Individual &
Group Pension
Pension
Group
Variable
Annuity Health Total (B) Individual LifeIndividual
PensionGroup Life
Group
PensionTotal (C)
Premiums earned - net
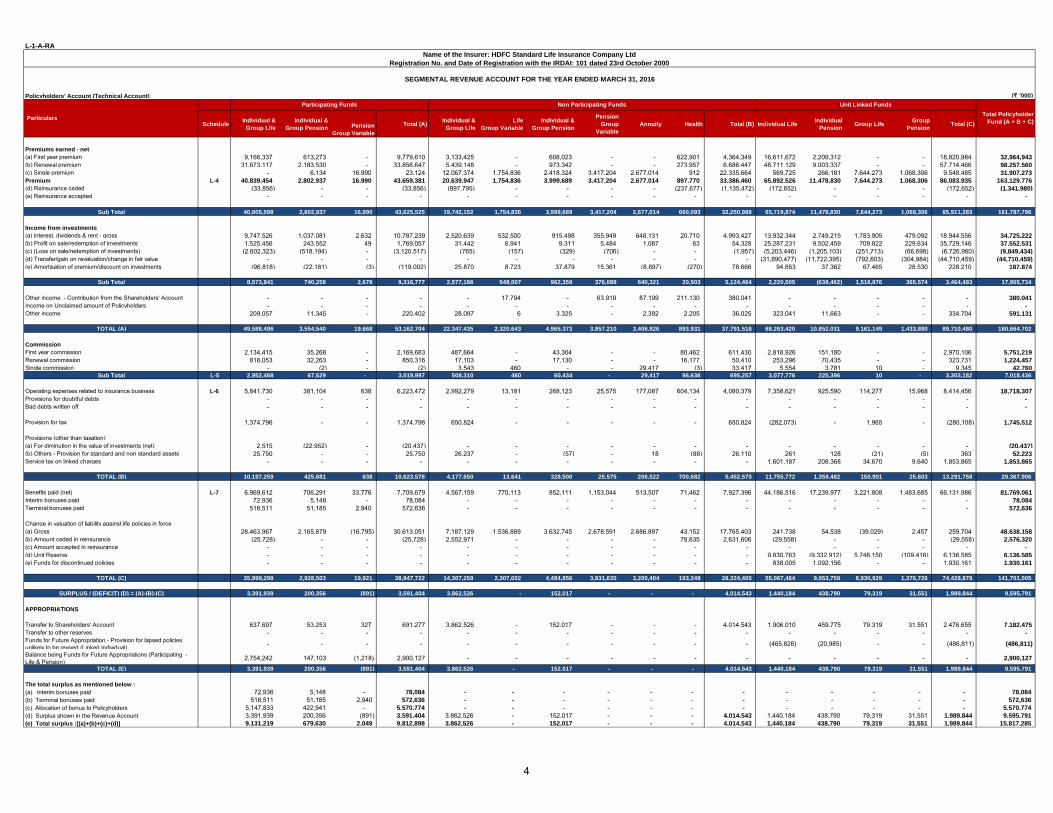
(a) First year premium 9,166,337 613,273 - 9,779,610 3,133,425 - 608,023 - - 622,901 4,364,349 16,611,672 2,209,312 - - 18,820,984 32,964,943
(b) Renewal premium 31,673,117 2,183,530 - 33,856,647 5,439,148 - 973,342 - - 273,957 6,686,447 48,711,129 9,003,337 - - 57,714,466 98,257,560
(c) Single premium - 6,134 16,990 23,124 12,067,374 1,754,836 2,418,324 3,417,204 2,677,014 912 22,335,664 569,725 266,181 7,644,273 1,068,306 9,548,485 31,907,273
Premium L-4 40,839,454 2,802,937 16,990 43,659,381 20,639,947 1,754,836 3,999,689 3,417,204 2,677,014 897,770 33,386,460 65,892,526 11,478,830 7,644,273 1,068,306 86,083,935 163,129,776
(d) Reinsurance ceded (33,856) - - (33,856) (897,795) - - - - (237,677) (1,135,472) (172,652) - - - (172,652) (1,341,980)
(e) Reinsurance accepted - - - - - - - - - - - - - - - - -
Sub Total 40,805,598 2,802,937 16,990 43,625,525 19,742,152 1,754,836 3,999,689 3,417,204 2,677,014 660,093 32,250,988 65,719,874 11,478,830 7,644,273 1,068,306 85,911,283 161,787,796
Income from investments
(a) Interest, dividends & rent - gross 9,747,526 1,037,081 2,632 10,787,239 2,520,639 532,500 915,498 355,949 648,131 20,710 4,993,427 13,932,344 2,749,215 1,783,905 479,092 18,944,556 34,725,222
(b) Profit on sale/redemption of investments 1,525,456 243,552 49 1,769,057 31,442 6,941 9,311 5,484 1,087 63 54,328 25,287,231 9,502,459 709,822 229,634 35,729,146 37,552,531
(c) (Loss on sale/redemption of investments) (2,602,323) (518,194) - (3,120,517) (765) (157) (329) (706) - - (1,957) (5,203,446) (1,205,103) (251,713) (66,698) (6,726,960) (9,849,434)
(d) Transfer/gain on revaluation/change in fair value - - - - - - - - - - - (31,890,477) (11,722,395) (792,603) (304,984) (44,710,459) (44,710,459)
(e) Amortisation of premium/discount on investments (96,818) (22,181) (3) (119,002) 25,870 8,723 37,879 15,361 (8,897) (270) 78,666 94,853 37,362 67,465 28,530 228,210 187,874
Sub Total 8,573,841 740,258 2,678 9,316,777 2,577,186 548,007 962,359 376,088 640,321 20,503 5,124,464 2,220,505 (638,462) 1,516,876 365,574 3,464,493 17,905,734
Other income - Contribution from the Shareholders' Account - - - - - 17,794 - 63,918 87,199 211,130 380,041 - - - - - 380,041
Income on Unclaimed amount of Policyholders - - - - - - - - - - - - - - - - -
Other income 209,057 11,345 - 220,402 28,097 6 3,325 - 2,392 2,205 36,025 323,041 11,663 - - 334,704 591,131
TOTAL (A) 49,588,496 3,554,540 19,668 53,162,704 22,347,435 2,320,643 4,965,373 3,857,210 3,406,926 893,931 37,791,518 68,263,420 10,852,031 9,161,149 1,433,880 89,710,480 180,664,702
Commission
First year commission 2,134,415 35,268 - 2,169,683 487,664 - 43,304 - - 80,462 611,430 2,818,926 151,180 - - 2,970,106 5,751,219
Renewal commission 818,053 32,263 - 850,316 17,103 - 17,130 - - 16,177 50,410 253,296 70,435 - - 323,731 1,224,457
Single commission - (2) - (2) 3,543 460 - - 29,417 (3) 33,417 5,554 3,781 10 - 9,345 42,760 Sub Total L-5 2,952,468 67,529 - 3,019,997 508,310 460 60,434 - 29,417 96,636 695,257 3,077,776 225,396 10 - 3,303,182 7,018,436
Operating expenses related to insurance business L-6 5,841,730 381,104 638 6,223,472 2,992,279 13,181 268,123 25,575 177,087 604,134 4,080,379 7,358,621 925,590 114,277 15,968 8,414,456 18,718,307
Provisions for doubtful debts - - - - - - - - - - - - - - - - -
Bad debts written off - - - - - - - - - - - - - - - - -
Provision for tax 1,374,796 - - 1,374,796 650,824 - - - - - 650,824 (282,073) - 1,965 - (280,108) 1,745,512
Provisions (other than taxation)(a) For diminution in the value of investments (net) 2,515 (22,952) - (20,437) - - - - - - - - - - - - (20,437)
(b) Others - Provision for standard and non standard assets 25,750 - - 25,750 26,237 - (57) - 18 (88) 26,110 261 128 (21) (5) 363 52,223
Service tax on linked charges - - - - - - - - - - - 1,601,187 208,368 34,670 9,640 1,853,865 1,853,865
TOTAL (B) 10,197,259 425,681 638 10,623,578 4,177,650 13,641 328,500 25,575 206,522 700,682 5,452,570 11,755,772 1,359,482 150,901 25,603 13,291,758 29,367,906
Benefits paid (net) L-7 6,969,612 706,291 33,776 7,709,679 4,567,159 770,113 852,111 1,153,044 513,507 71,462 7,927,396 44,186,516 17,239,977 3,221,808 1,483,685 66,131,986 81,769,061
Interim bonuses paid 72,936 5,148 - 78,084 - - - - - - - - - - - - 78,084
Terminal bonuses paid 518,511 51,185 2,940 572,636 - - - - - - - - - - - - 572,636
Change in valuation of liability against life policies in force(a) Gross 28,463,967 2,165,879 (16,795) 30,613,051 7,187,129 1,536,889 3,632,745 2,678,591 2,686,897 43,152 17,765,403 241,738 54,538 (39,029) 2,457 259,704 48,638,158
(b) Amount ceded in reinsurance (25,728) - - (25,728) 2,552,971 - - - - 78,635 2,631,606 (29,558) - - - (29,558) 2,576,320
(c) Amount accepted in reinsurance - - - - - - - - - - - - - - - - -
(d) Unit Reserve - - - - - - - - - - - 9,830,763 (9,332,912) 5,748,150 (109,416) 6,136,585 6,136,585
(e) Funds for discontinued policies - - - - - - - - - - - 838,005 1,092,156 - - 1,930,161 1,930,161
TOTAL (C) 35,999,298 2,928,503 19,921 38,947,722 14,307,259 2,307,002 4,484,856 3,831,635 3,200,404 193,249 28,324,405 55,067,464 9,053,759 8,930,929 1,376,726 74,428,878 141,701,005
SURPLUS / (DEFICIT) (D) = (A)-(B)-(C) 3,391,939 200,356 (891) 3,591,404 3,862,526 - 152,017 - - - 4,014,543 1,440,184 438,790 79,319 31,551 1,989,844 9,595,791
APPROPRIATIONS
Transfer to Shareholders' Account 637,697 53,253 327 691,277 3,862,526 - 152,017 - - - 4,014,543 1,906,010 459,775 79,319 31,551 2,476,655 7,182,475
Transfer to other reserves - - - - - - - - - - - - - - - - - Funds for Future Appropriation - Provision for lapsed policies unlikely to be revived (Linked Individual) - - - - - - - - - - - (465,826) (20,985) - - (486,811) (486,811)
Balance being Funds for Future Appropriations (Participating - Life & Pension) 2,754,242 147,103 (1,218) 2,900,127 - - - - - - - - - - - - 2,900,127
TOTAL (E) 3,391,939 200,356 (891) 3,591,404 3,862,526 - 152,017 - - - 4,014,543 1,440,184 438,790 79,319 31,551 1,989,844 9,595,791
The total surplus as mentioned below :
(a) Interim bonuses paid 72,936 5,148 - 78,084 - - - - - - - - - - - - 78,084
(b) Terminal bonuses paid 518,511 51,185 2,940 572,636 - - - - - - - - - - - - 572,636
(c) Allocation of bonus to Policyholders 5,147,833 422,941 - 5,570,774 - - - - - - - - - - - - 5,570,774
(d) Surplus shown in the Revenue Account 3,391,939 200,356 (891) 3,591,404 3,862,526 - 152,017 - - - 4,014,543 1,440,184 438,790 79,319 31,551 1,989,844 9,595,791
(e) Total surplus :[(a)+(b)+(c)+(d)] 9,131,219 679,630 2,049 9,812,898 3,862,526 - 152,017 - - - 4,014,543 1,440,184 438,790 79,319 31,551 1,989,844 15,817,285
Name of the Insurer: HDFC Standard Life Insurance Company Ltd
Registration No. and Date of Registration with the IRDAI: 101 dated 23rd October 2000
SEGMENTAL REVENUE ACCOUNT FOR THE YEAR ENDED MARCH 31, 2016
Participating Funds Unit Linked Funds
Total Policyholder
Fund (A + B + C)
Non Participating Funds
Particulars
4
FORM L-2-A-PL
(` '000)
Particulars Schedule
For the
quarter ended
March 31, 2017
For the year ended
March 31, 2017
For the
quarter ended
March 31, 2016
For the year ended
March 31, 2016
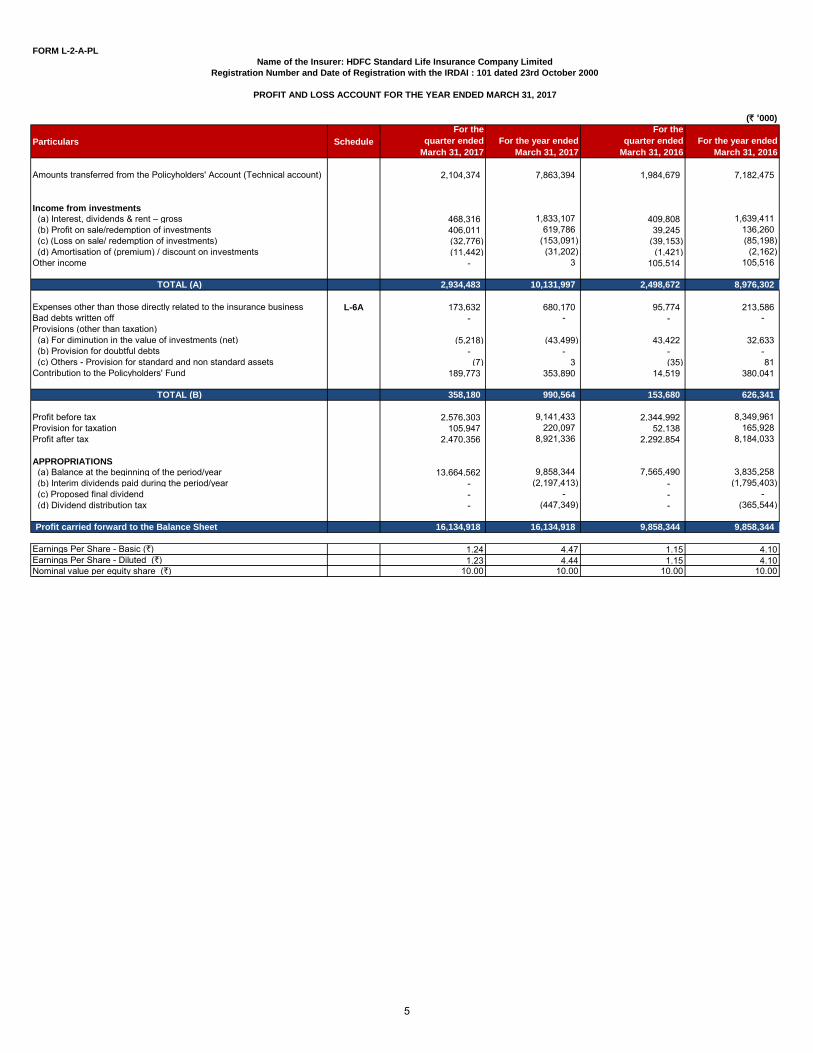
Amounts transferred from the Policyholders' Account (Technical account) 2,104,374 7,863,394 1,984,679 7,182,475
Income from investments
(a) Interest, dividends & rent – gross 468,316 1,833,107 409,808 1,639,411 (b) Profit on sale/redemption of investments 406,011 619,786 39,245 136,260 (c) (Loss on sale/ redemption of investments) (32,776) (153,091) (39,153) (85,198) (d) Amortisation of (premium) / discount on investments (11,442) (31,202) (1,421) (2,162) Other income - 3 105,514 105,516
TOTAL (A) 2,934,483 10,131,997 2,498,672 8,976,302
Expenses other than those directly related to the insurance business L-6A 173,632 680,170 95,774 213,586 Bad debts written off - - - - Provisions (other than taxation) (a) For diminution in the value of investments (net) (5,218) (43,499) 43,422 32,633 (b) Provision for doubtful debts - - - - (c) Others - Provision for standard and non standard assets (7) 3 (35) 81 Contribution to the Policyholders' Fund 189,773 353,890 14,519 380,041
TOTAL (B) 358,180 990,564 153,680 626,341
Profit before tax 2,576,303 9,141,433 2,344,992 8,349,961 Provision for taxation 105,947 220,097 52,138 165,928 Profit after tax 2,470,356 8,921,336 2,292,854 8,184,033
APPROPRIATIONS
(a) Balance at the beginning of the period/year 13,664,562 9,858,344 7,565,490 3,835,258 (b) Interim dividends paid during the period/year - (2,197,413) - (1,795,403) (c) Proposed final dividend - - - - (d) Dividend distribution tax - (447,349) - (365,544)
Profit carried forward to the Balance Sheet 16,134,918 16,134,918 9,858,344 9,858,344
Earnings Per Share - Basic (`) 1.24 4.47 1.15 4.10Earnings Per Share - Diluted (`) 1.23 4.44 1.15 4.10Nominal value per equity share (`) 10.00 10.00 10.00 10.00
Name of the Insurer: HDFC Standard Life Insurance Company Limited
Registration Number and Date of Registration with the IRDAI : 101 dated 23rd October 2000
PROFIT AND LOSS ACCOUNT FOR THE YEAR ENDED MARCH 31, 2017
5
FORM L-3-A-BS
(` '000)
Particulars ScheduleAs at
March 31, 2017
As at
March 31, 2016
SOURCES OF FUNDS
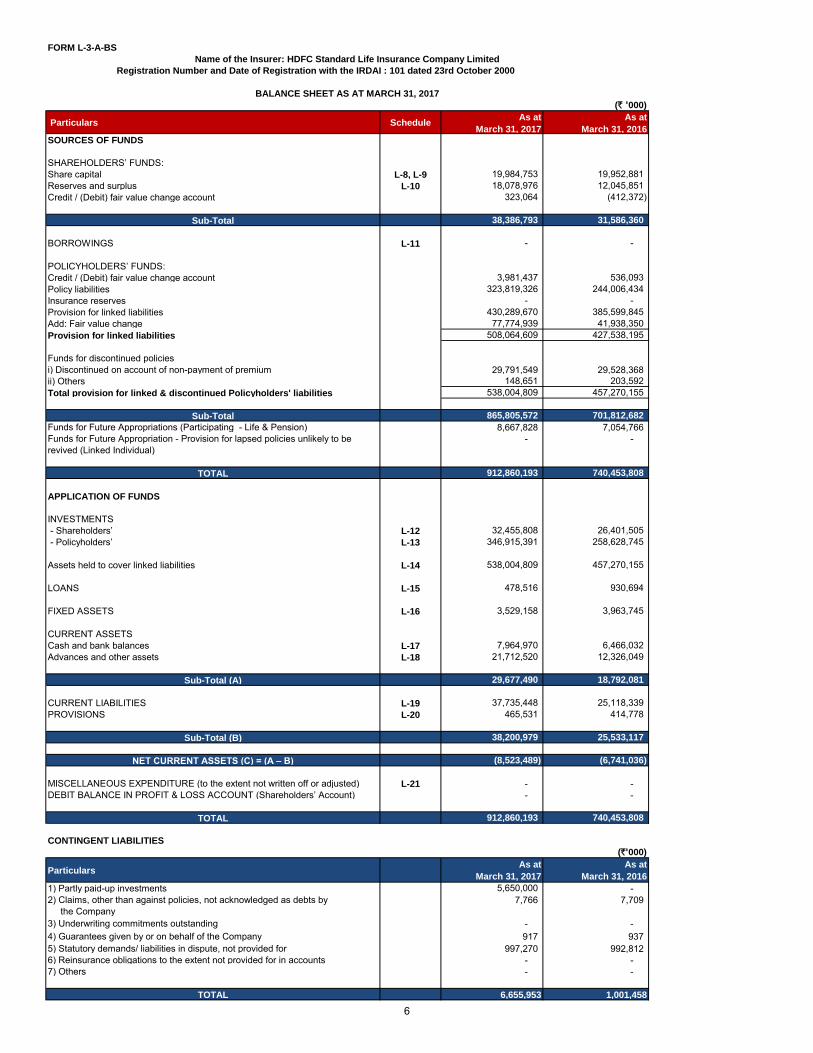
SHAREHOLDERS’ FUNDS:Share capital L-8, L-9 19,984,753 19,952,881 Reserves and surplus L-10 18,078,976 12,045,851 Credit / (Debit) fair value change account 323,064 (412,372)
Sub-Total 38,386,793 31,586,360
BORROWINGS L-11 - -
POLICYHOLDERS’ FUNDS:Credit / (Debit) fair value change account 3,981,437 536,093 Policy liabilities 323,819,326 244,006,434 Insurance reserves - - Provision for linked liabilities 430,289,670 385,599,845 Add: Fair value change 77,774,939 41,938,350 Provision for linked liabilities 508,064,609 427,538,195
Funds for discontinued policiesi) Discontinued on account of non-payment of premium 29,791,549 29,528,368 ii) Others 148,651 203,592 Total provision for linked & discontinued Policyholders' liabilities 538,004,809 457,270,155
Sub-Total 865,805,572 701,812,682
Funds for Future Appropriations (Participating - Life & Pension) 8,667,828 7,054,766 Funds for Future Appropriation - Provision for lapsed policies unlikely to be revived (Linked Individual)
- -
TOTAL 912,860,193 740,453,808
APPLICATION OF FUNDS
INVESTMENTS - Shareholders’ L-12 32,455,808 26,401,505 - Policyholders’ L-13 346,915,391 258,628,745
Assets held to cover linked liabilities L-14 538,004,809 457,270,155
LOANS L-15 478,516 930,694
FIXED ASSETS L-16 3,529,158 3,963,745
CURRENT ASSETSCash and bank balances L-17 7,964,970 6,466,032 Advances and other assets L-18 21,712,520 12,326,049
Sub-Total (A) 29,677,490 18,792,081
CURRENT LIABILITIES L-19 37,735,448 25,118,339 PROVISIONS L-20 465,531 414,778
Sub-Total (B) 38,200,979 25,533,117
NET CURRENT ASSETS (C) = (A – B) (8,523,489) (6,741,036)
MISCELLANEOUS EXPENDITURE (to the extent not written off or adjusted) L-21 - - DEBIT BALANCE IN PROFIT & LOSS ACCOUNT (Shareholders’ Account) - -
TOTAL 912,860,193 740,453,808
CONTINGENT LIABILITIES
(`'000)
ParticularsAs at
March 31, 2017
As at
March 31, 2016
1) Partly paid-up investments 5,650,000 - 2) Claims, other than against policies, not acknowledged as debts by the Company
7,766 7,709
3) Underwriting commitments outstanding - - 4) Guarantees given by or on behalf of the Company 917 937 5) Statutory demands/ liabilities in dispute, not provided for 997,270 992,812 6) Reinsurance obligations to the extent not provided for in accounts - - 7) Others - -
TOTAL 6,655,953 1,001,458
Name of the Insurer: HDFC Standard Life Insurance Company Limited
BALANCE SHEET AS AT MARCH 31, 2017
Registration Number and Date of Registration with the IRDAI : 101 dated 23rd October 2000
6
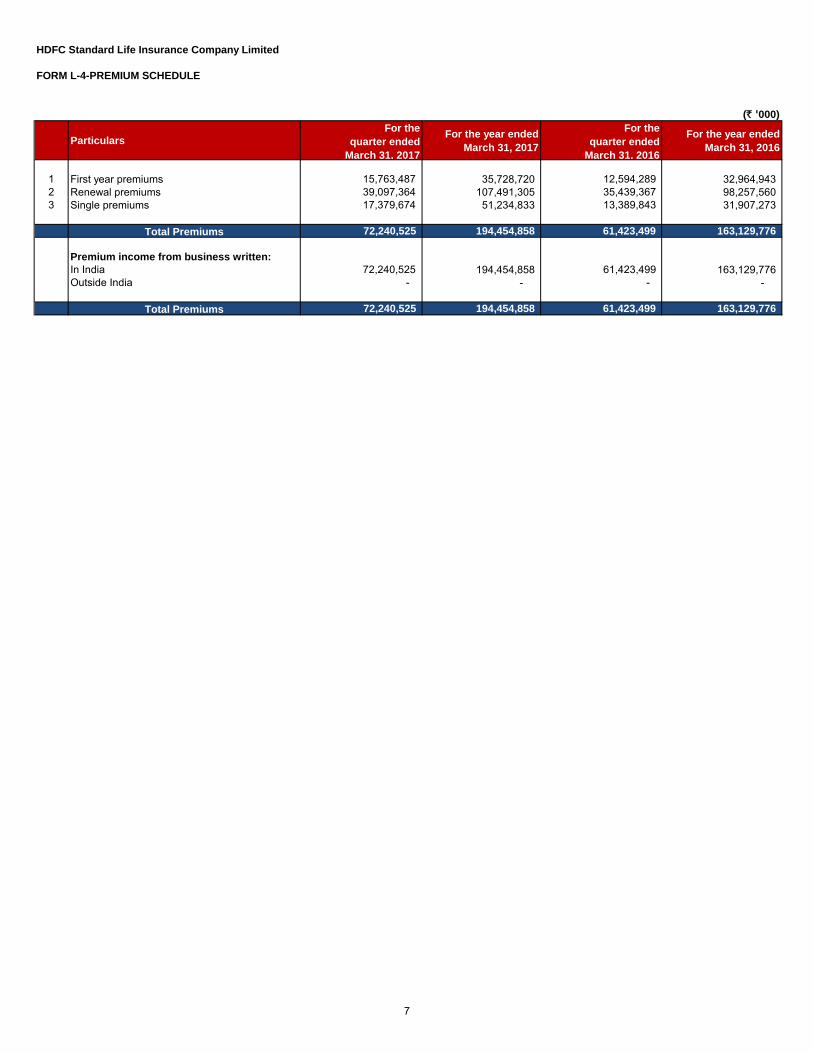
FORM L-4-PREMIUM SCHEDULE
(` '000)
Particulars
For the
quarter ended
March 31, 2017
For the year ended
March 31, 2017
For the
quarter ended
March 31, 2016
For the year ended
March 31, 2016
1 First year premiums 15,763,487 35,728,720 12,594,289 32,964,943 2 Renewal premiums 39,097,364 107,491,305 35,439,367 98,257,560 3 Single premiums 17,379,674 51,234,833 13,389,843 31,907,273
Total Premiums 72,240,525 194,454,858 61,423,499 163,129,776
Premium income from business written:
In India 72,240,525 194,454,858 61,423,499 163,129,776 Outside India - - - -
Total Premiums 72,240,525 194,454,858 61,423,499 163,129,776
HDFC Standard Life Insurance Company Limited
7
HDFC Standard Life Insurance Company Limited
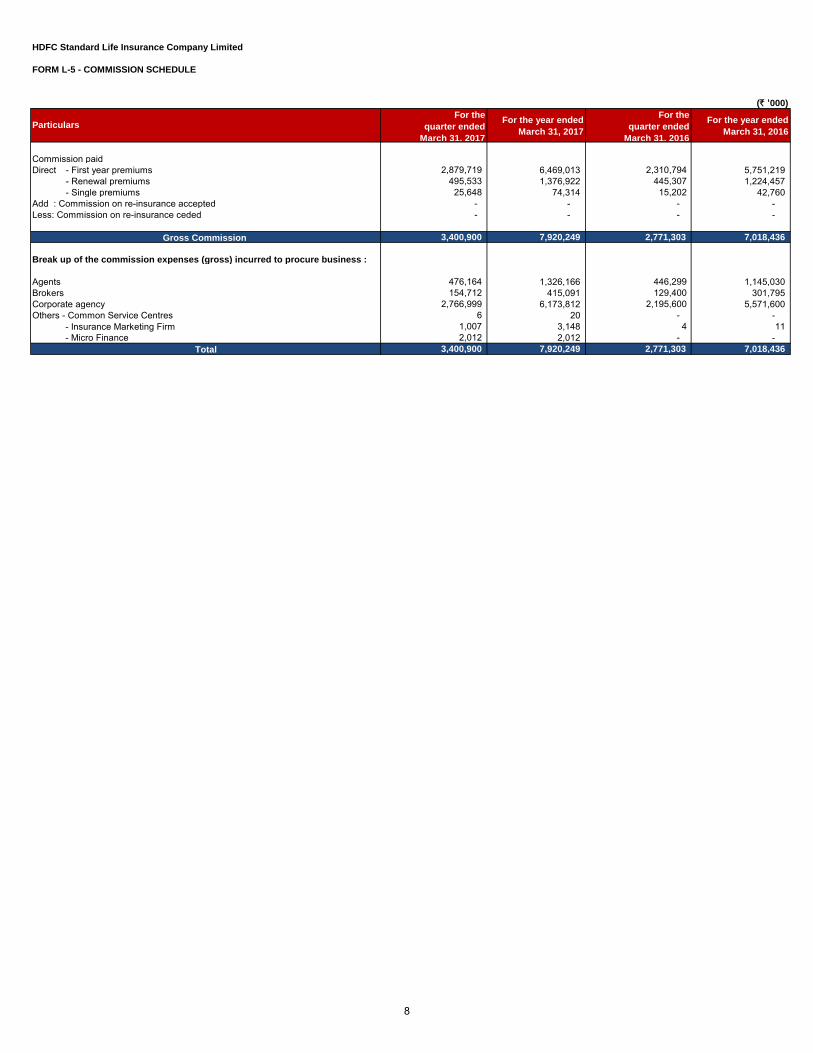
FORM L-5 - COMMISSION SCHEDULE
(` '000)
For the
quarter ended
March 31, 2017
For the year ended
March 31, 2017
For the
quarter ended
March 31, 2016
For the year ended
March 31, 2016
Commission paidDirect - First year premiums 2,879,719 6,469,013 2,310,794 5,751,219
- Renewal premiums 495,533 1,376,922 445,307 1,224,457 - Single premiums 25,648 74,314 15,202 42,760
Add : Commission on re-insurance accepted - - - - Less: Commission on re-insurance ceded - - - -
3,400,900 7,920,249 2,771,303 7,018,436
Break up of the commission expenses (gross) incurred to procure business :
476,164 1,326,166 446,299 1,145,030 154,712 415,091 129,400 301,795 2,766,999 6,173,812 2,195,600 5,571,600 6 20 - - 1,007 3,148 4 11 2,012 2,012 - -
3,400,900 7,920,249 2,771,303 7,018,436
Particulars
Gross Commission
Total
AgentsBrokersCorporate agencyOthers - Common Service Centres - Insurance Marketing Firm - Micro Finance
8
HDFC Standard Life Insurance Company Limited
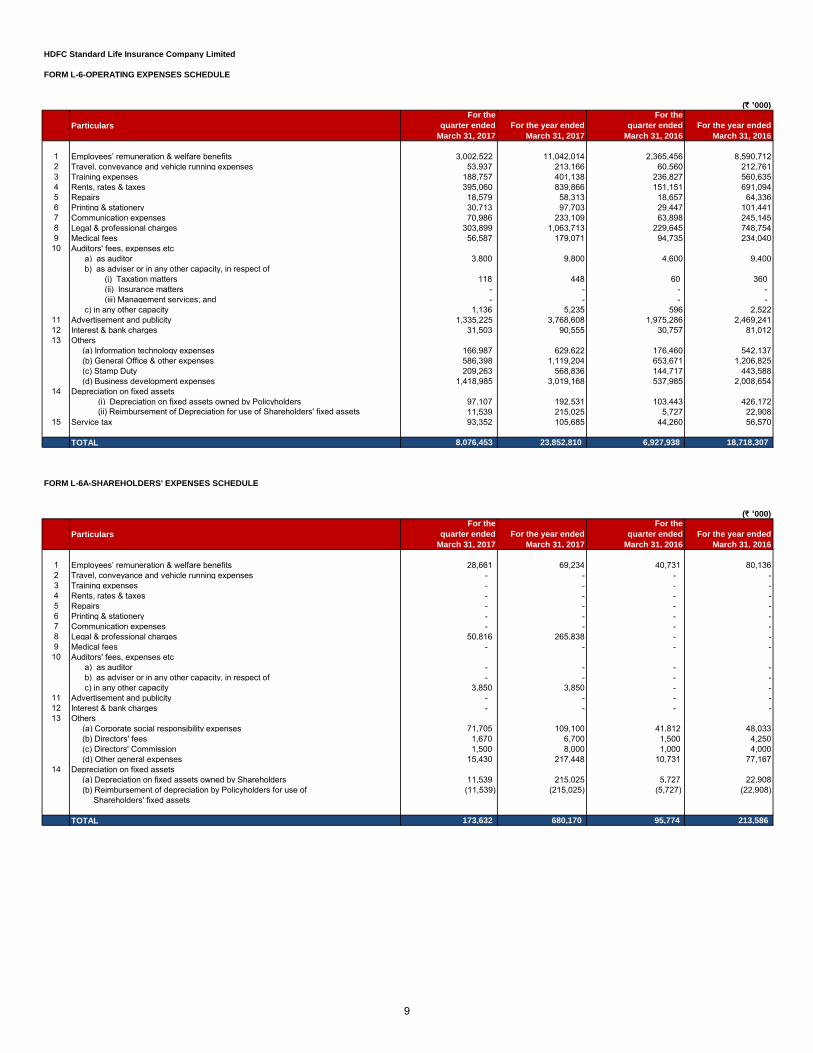
FORM L-6-OPERATING EXPENSES SCHEDULE
(` '000)
Particulars
For the
quarter ended
March 31, 2017
For the year ended
March 31, 2017
For the
quarter ended
March 31, 2016
For the year ended
March 31, 2016
1 Employees’ remuneration & welfare benefits 3,002,522 11,042,014 2,365,456 8,590,712 2 Travel, conveyance and vehicle running expenses 53,937 213,166 60,560 212,761 3 Training expenses 188,757 401,138 236,827 560,635 4 Rents, rates & taxes 395,060 839,866 151,151 691,094 5 Repairs 18,579 58,313 18,657 64,336 6 Printing & stationery 30,713 97,703 29,447 101,441 7 Communication expenses 70,986 233,109 63,898 245,145 8 Legal & professional charges 303,899 1,063,713 229,645 748,754 9 Medical fees 56,587 179,071 94,735 234,040
10 Auditors' fees, expenses etc a) as auditor 3,800 9,800 4,600 9,400 b) as adviser or in any other capacity, in respect of (i) Taxation matters 118 448 60 360 (ii) Insurance matters - - - - (iii) Management services; and - - - - c) in any other capacity 1,136 5,235 596 2,522
11 Advertisement and publicity 1,335,225 3,768,608 1,975,286 2,469,241 12 Interest & bank charges 31,503 90,555 30,757 81,012 13 Others
(a) Information technology expenses 166,987 629,622 176,460 542,137 (b) General Office & other expenses 586,398 1,119,204 653,671 1,206,825 (c) Stamp Duty 209,263 568,836 144,717 443,588 (d) Business development expenses 1,418,985 3,019,168 537,985 2,008,654
14 Depreciation on fixed assets (i) Depreciation on fixed assets owned by Policyholders 97,107 192,531 103,443 426,172 (ii) Reimbursement of Depreciation for use of Shareholders' fixed assets 11,539 215,025 5,727 22,908
15 Service tax 93,352 105,685 44,260 56,570
TOTAL 8,076,453 23,852,810 6,927,938 18,718,307
FORM L-6A-SHAREHOLDERS' EXPENSES SCHEDULE
(` '000)
Particulars
For the
quarter ended
March 31, 2017
For the year ended
March 31, 2017
For the
quarter ended
March 31, 2016
For the year ended
March 31, 2016
1 Employees’ remuneration & welfare benefits 28,661 69,234 40,731 80,136 2 Travel, conveyance and vehicle running expenses - - - - 3 Training expenses - - - - 4 Rents, rates & taxes - - - - 5 Repairs - - - - 6 Printing & stationery - - - - 7 Communication expenses - - - - 8 Legal & professional charges 50,816 265,838 - - 9 Medical fees - - - -
10 Auditors' fees, expenses etc a) as auditor - - - - b) as adviser or in any other capacity, in respect of - - - - c) in any other capacity 3,850 3,850 - -
11 Advertisement and publicity - - - - 12 Interest & bank charges - - - - 13 Others
(a) Corporate social responsibility expenses 71,705 109,100 41,812 48,033 (b) Directors' fees 1,670 6,700 1,500 4,250 (c) Directors' Commission 1,500 8,000 1,000 4,000 (d) Other general expenses 15,430 217,448 10,731 77,167
14 Depreciation on fixed assets (a) Depreciation on fixed assets owned by Shareholders 11,539 215,025 5,727 22,908 (b) Reimbursement of depreciation by Policyholders for use of Shareholders' fixed assets
(11,539) (215,025) (5,727) (22,908)
TOTAL 173,632 680,170 95,774 213,586
9
HDFC Standard Life Insurance Company Limited
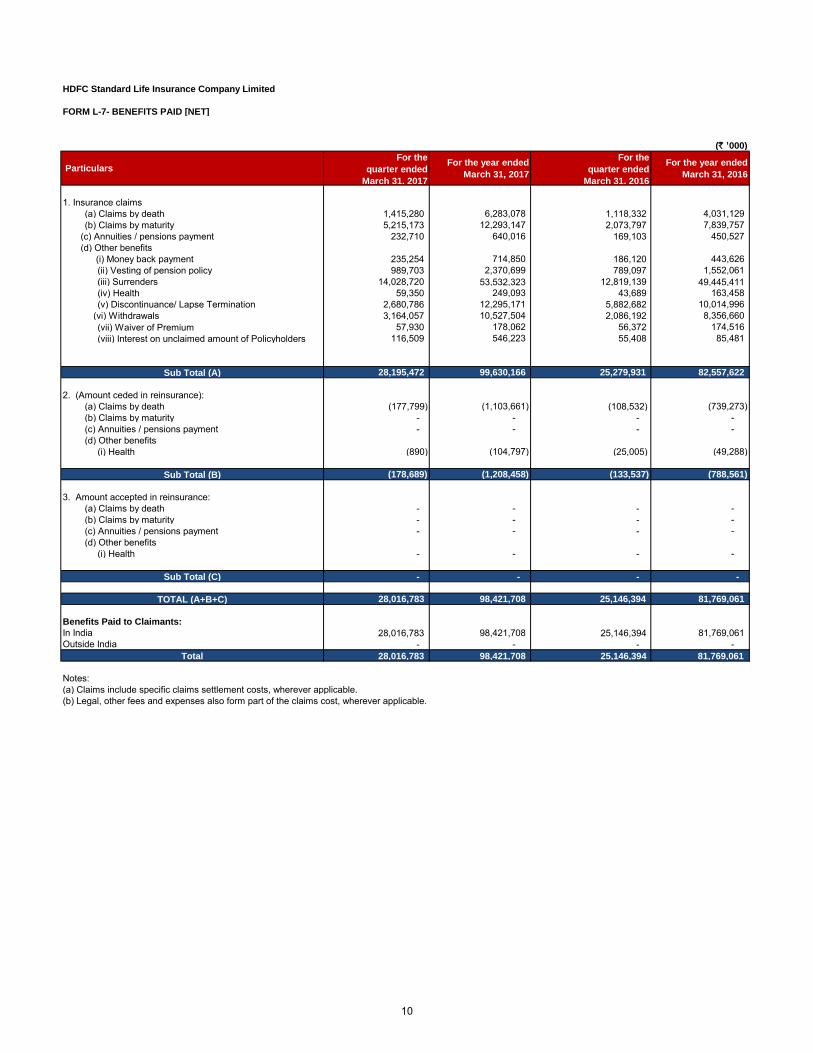
FORM L-7- BENEFITS PAID [NET]
(` '000)
ParticularsFor the
quarter ended
March 31, 2017
For the year ended
March 31, 2017
For the
quarter ended
March 31, 2016
For the year ended
March 31, 2016
1. Insurance claims(a) Claims by death 1,415,280 6,283,078 1,118,332 4,031,129 (b) Claims by maturity 5,215,173 12,293,147 2,073,797 7,839,757
(c) Annuities / pensions payment 232,710 640,016 169,103 450,527 (d) Other benefits (i) Money back payment 235,254 714,850 186,120 443,626
(ii) Vesting of pension policy 989,703 2,370,699 789,097 1,552,061 (iii) Surrenders 14,028,720 53,532,323 12,819,139 49,445,411 (iv) Health 59,350 249,093 43,689 163,458 (v) Discontinuance/ Lapse Termination 2,680,786 12,295,171 5,882,682 10,014,996
(vi) Withdrawals 3,164,057 10,527,504 2,086,192 8,356,660 (vii) Waiver of Premium 57,930 178,062 56,372 174,516 (viii) Interest on unclaimed amount of Policyholders 116,509 546,223 55,408 85,481
Sub Total (A) 28,195,472 99,630,166 25,279,931 82,557,622
2. (Amount ceded in reinsurance):(a) Claims by death (177,799) (1,103,661) (108,532) (739,273) (b) Claims by maturity - - - - (c) Annuities / pensions payment - - - - (d) Other benefits (i) Health (890) (104,797) (25,005) (49,288)
Sub Total (B) (178,689) (1,208,458) (133,537) (788,561)
3. Amount accepted in reinsurance:(a) Claims by death - - - - (b) Claims by maturity - - - - (c) Annuities / pensions payment - - - - (d) Other benefits (i) Health - - - -
Sub Total (C) - - - -
TOTAL (A+B+C) 28,016,783 98,421,708 25,146,394 81,769,061
Benefits Paid to Claimants:
In India 28,016,783 98,421,708 25,146,394 81,769,061 Outside India - - - -
Total 28,016,783 98,421,708 25,146,394 81,769,061
Notes:(a) Claims include specific claims settlement costs, wherever applicable.(b) Legal, other fees and expenses also form part of the claims cost, wherever applicable.
10
HDFC Standard Life Insurance Company Limited
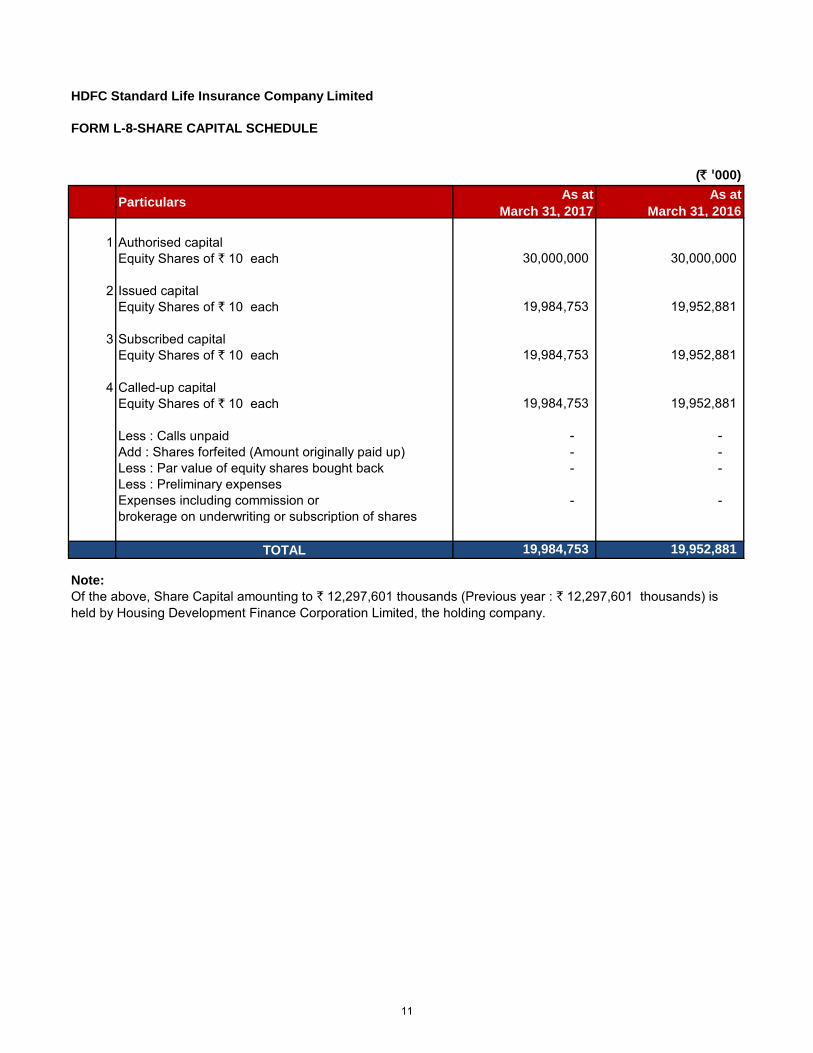
FORM L-8-SHARE CAPITAL SCHEDULE
(` '000)
ParticularsAs at
March 31, 2017
As at
March 31, 2016
1 Authorised capitalEquity Shares of ` 10 each 30,000,000 30,000,000
2 Issued capitalEquity Shares of ` 10 each 19,984,753 19,952,881
3 Subscribed capitalEquity Shares of ` 10 each 19,984,753 19,952,881
4 Called-up capitalEquity Shares of ` 10 each 19,984,753 19,952,881
Less : Calls unpaid - - Add : Shares forfeited (Amount originally paid up) - - Less : Par value of equity shares bought back - - Less : Preliminary expensesExpenses including commission or brokerage on underwriting or subscription of shares
- -
TOTAL 19,984,753 19,952,881
Note:
Of the above, Share Capital amounting to ` 12,297,601 thousands (Previous year : ` 12,297,601 thousands) is held by Housing Development Finance Corporation Limited, the holding company.
11
HDFC Standard Life Insurance Company Limited
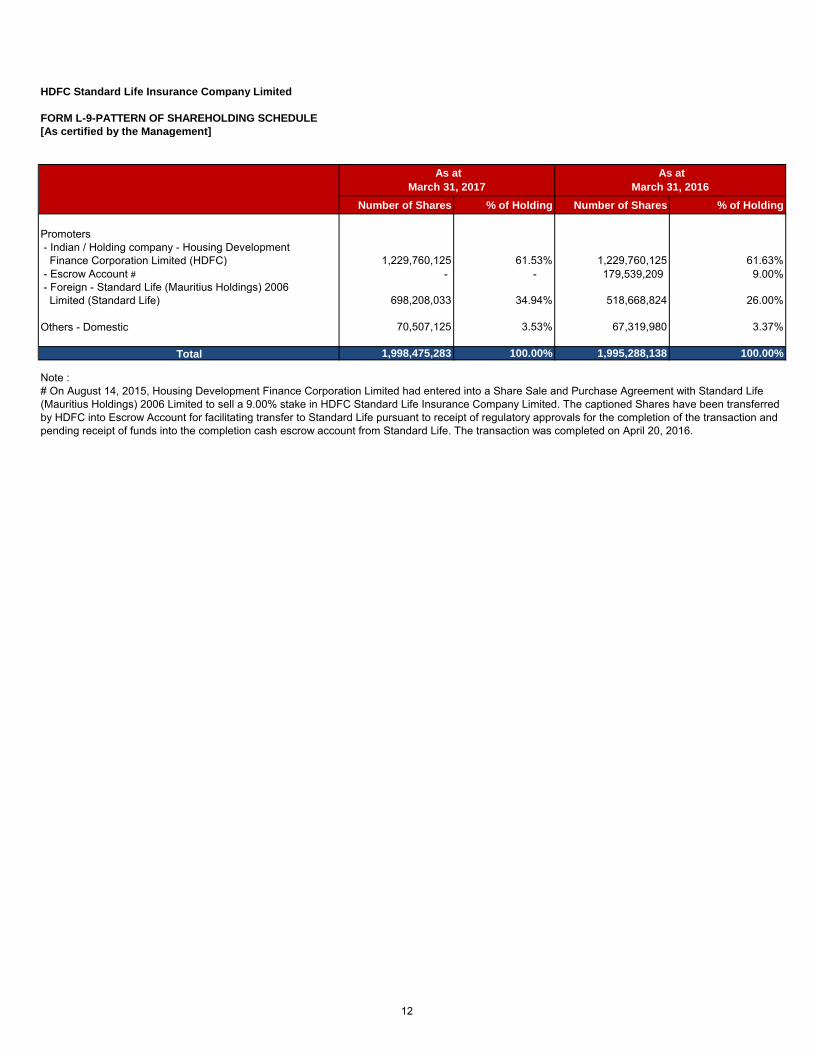
FORM L-9-PATTERN OF SHAREHOLDING SCHEDULE
[As certified by the Management]
Number of Shares % of Holding Number of Shares % of Holding
Promoters - Indian / Holding company - Housing Development Finance Corporation Limited (HDFC) 1,229,760,125 61.53% 1,229,760,125 61.63% - Escrow Account # - - 179,539,209 9.00% - Foreign - Standard Life (Mauritius Holdings) 2006 Limited (Standard Life) 698,208,033 34.94% 518,668,824 26.00%
Others - Domestic 70,507,125 3.53% 67,319,980 3.37%
Total 1,998,475,283 100.00% 1,995,288,138 100.00%
As at
March 31, 2017
As at
March 31, 2016
Note : # On August 14, 2015, Housing Development Finance Corporation Limited had entered into a Share Sale and Purchase Agreement with Standard Life (Mauritius Holdings) 2006 Limited to sell a 9.00% stake in HDFC Standard Life Insurance Company Limited. The captioned Shares have been transferred by HDFC into Escrow Account for facilitating transfer to Standard Life pursuant to receipt of regulatory approvals for the completion of the transaction and pending receipt of funds into the completion cash escrow account from Standard Life. The transaction was completed on April 20, 2016.
12
HDFC Standard Life Insurance Company Limited
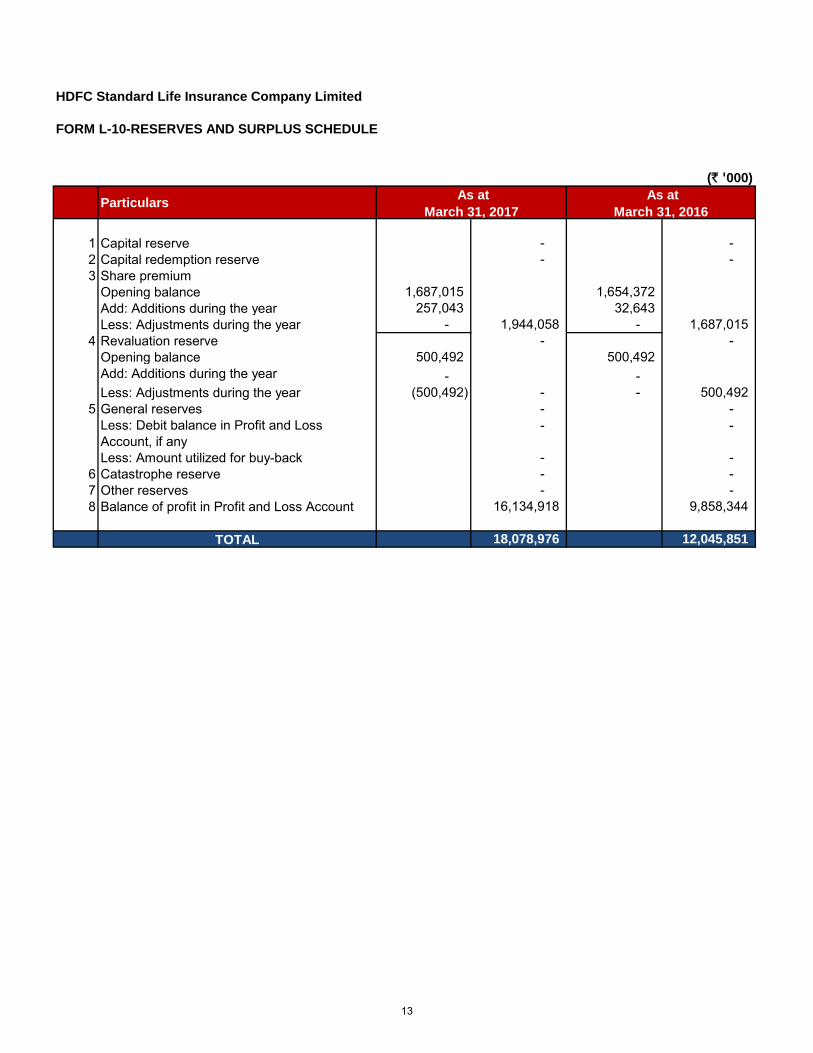
FORM L-10-RESERVES AND SURPLUS SCHEDULE
(` '000)
Particulars
1 Capital reserve - - 2 Capital redemption reserve - - 3 Share premium
Opening balance 1,687,015 1,654,372 Add: Additions during the year 257,043 32,643 Less: Adjustments during the year - 1,944,058 - 1,687,015
4 Revaluation reserve - - Opening balance 500,492 500,492 Add: Additions during the year - - Less: Adjustments during the year (500,492) - - 500,492
5 General reserves - - Less: Debit balance in Profit and Loss Account, if any
- -
Less: Amount utilized for buy-back - - 6 Catastrophe reserve - - 7 Other reserves - - 8 Balance of profit in Profit and Loss Account 16,134,918 9,858,344
TOTAL 18,078,976 12,045,851
As at
March 31, 2017
As at
March 31, 2016
13
HDFC Standard Life Insurance Company Limited
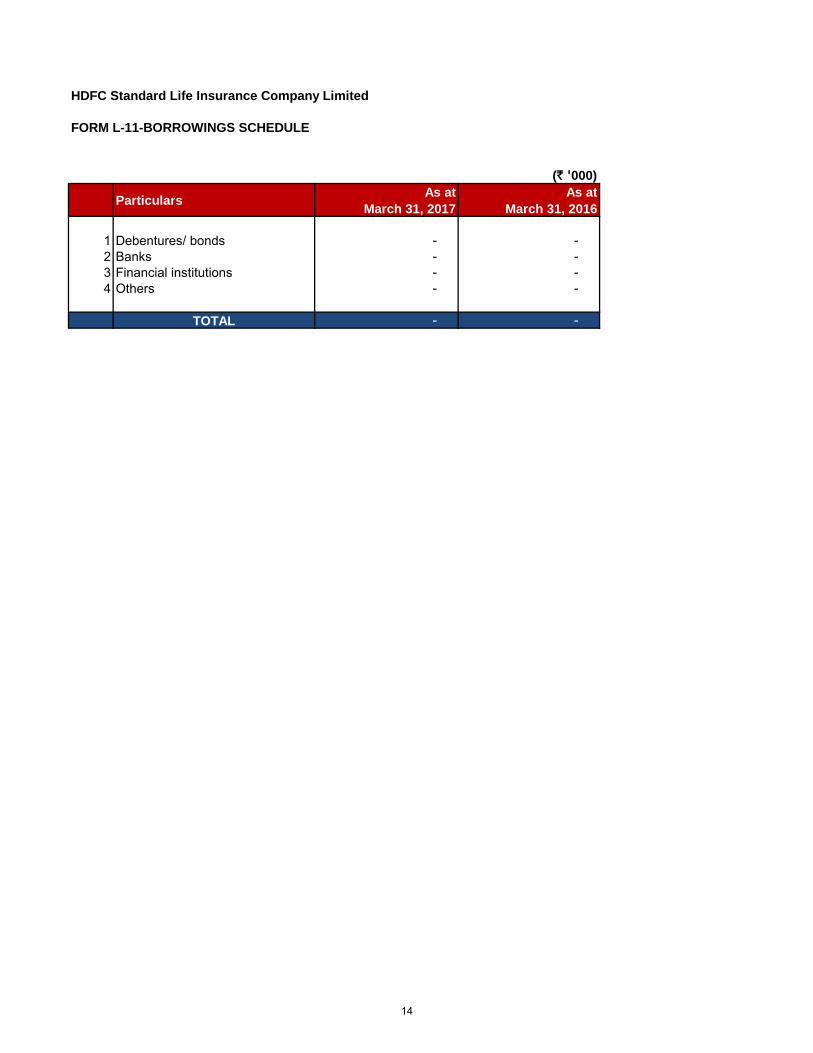
FORM L-11-BORROWINGS SCHEDULE
(` '000)
ParticularsAs at
March 31, 2017
As at
March 31, 2016
1 Debentures/ bonds - - 2 Banks - - 3 Financial institutions - - 4 Others - -
TOTAL - -
14
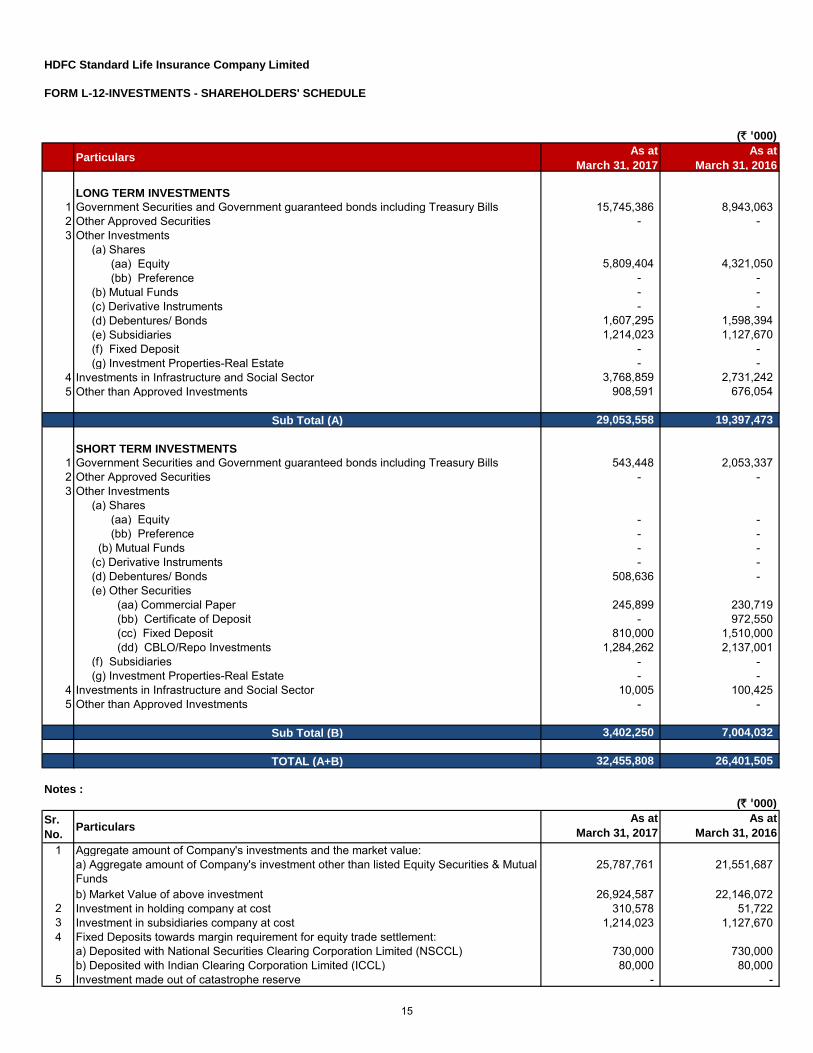
HDFC Standard Life Insurance Company Limited
FORM L-12-INVESTMENTS - SHAREHOLDERS' SCHEDULE
(` '000)
ParticularsAs at
March 31, 2017
As at
March 31, 2016
LONG TERM INVESTMENTS
1 Government Securities and Government guaranteed bonds including Treasury Bills 15,745,386 8,943,063 2 Other Approved Securities - - 3 Other Investments
(a) Shares (aa) Equity 5,809,404 4,321,050 (bb) Preference - - (b) Mutual Funds - - (c) Derivative Instruments - - (d) Debentures/ Bonds 1,607,295 1,598,394 (e) Subsidiaries 1,214,023 1,127,670 (f) Fixed Deposit - - (g) Investment Properties-Real Estate - -
4 Investments in Infrastructure and Social Sector 3,768,859 2,731,242 5 Other than Approved Investments 908,591 676,054
Sub Total (A) 29,053,558 19,397,473
SHORT TERM INVESTMENTS
1 Government Securities and Government guaranteed bonds including Treasury Bills 543,448 2,053,337 2 Other Approved Securities - - 3 Other Investments
(a) Shares (aa) Equity - - (bb) Preference - - (b) Mutual Funds - - (c) Derivative Instruments - - (d) Debentures/ Bonds 508,636 - (e) Other Securities (aa) Commercial Paper 245,899 230,719 (bb) Certificate of Deposit - 972,550 (cc) Fixed Deposit 810,000 1,510,000 (dd) CBLO/Repo Investments 1,284,262 2,137,001 (f) Subsidiaries - - (g) Investment Properties-Real Estate - -
4 Investments in Infrastructure and Social Sector 10,005 100,425 5 Other than Approved Investments - -
Sub Total (B) 3,402,250 7,004,032
TOTAL (A+B) 32,455,808 26,401,505
Notes :
(` '000)
Sr.
No.Particulars
As at
March 31, 2017
As at
March 31, 2016
1 Aggregate amount of Company's investments and the market value:a) Aggregate amount of Company's investment other than listed Equity Securities & MutualFunds
25,787,761 21,551,687
b) Market Value of above investment 26,924,587 22,146,072 2 Investment in holding company at cost 310,578 51,722 3 Investment in subsidiaries company at cost 1,214,023 1,127,670 4 Fixed Deposits towards margin requirement for equity trade settlement:
a) Deposited with National Securities Clearing Corporation Limited (NSCCL) 730,000 730,000 b) Deposited with Indian Clearing Corporation Limited (ICCL) 80,000 80,000
5 Investment made out of catastrophe reserve - -
15
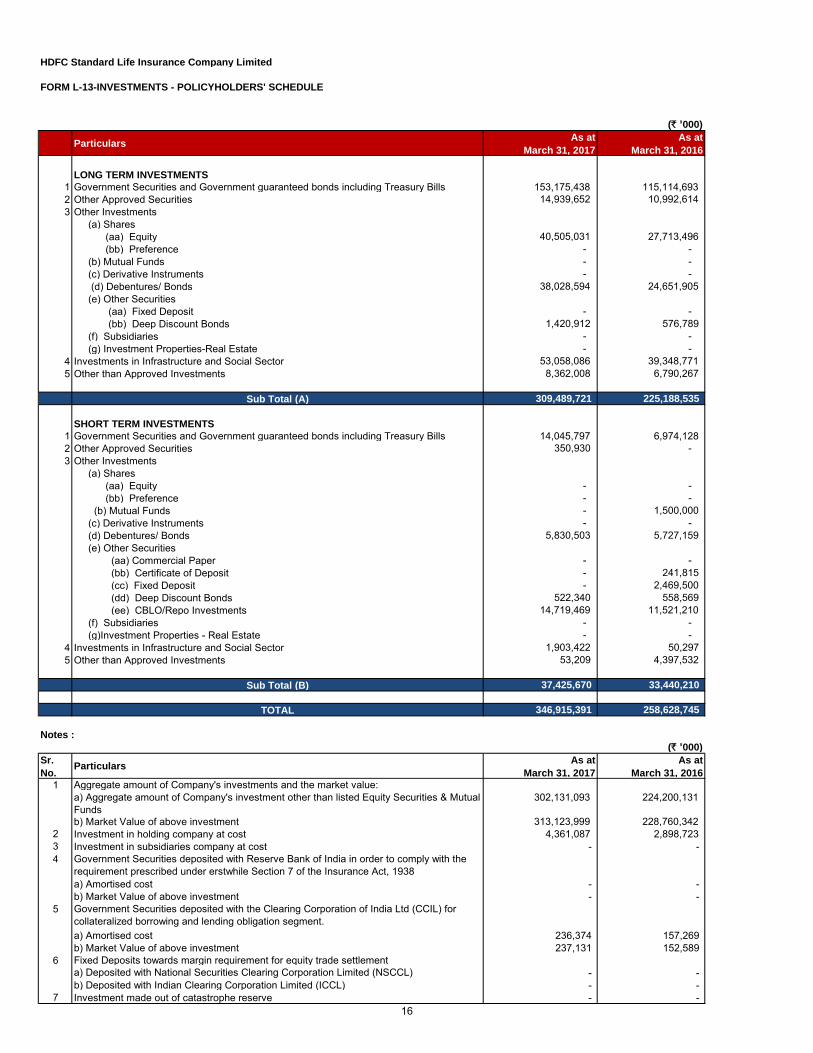
HDFC Standard Life Insurance Company Limited
FORM L-13-INVESTMENTS - POLICYHOLDERS' SCHEDULE
(` '000)
ParticularsAs at
March 31, 2017
As at
March 31, 2016
LONG TERM INVESTMENTS
1 Government Securities and Government guaranteed bonds including Treasury Bills 153,175,438 115,114,693 2 Other Approved Securities 14,939,652 10,992,614 3 Other Investments
(a) Shares (aa) Equity 40,505,031 27,713,496 (bb) Preference - -
(b) Mutual Funds - - (c) Derivative Instruments - - (d) Debentures/ Bonds 38,028,594 24,651,905
(e) Other Securities (aa) Fixed Deposit - - (bb) Deep Discount Bonds 1,420,912 576,789
(f) Subsidiaries - - (g) Investment Properties-Real Estate - -
4 Investments in Infrastructure and Social Sector 53,058,086 39,348,771 5 Other than Approved Investments 8,362,008 6,790,267
Sub Total (A) 309,489,721 225,188,535
SHORT TERM INVESTMENTS
1 Government Securities and Government guaranteed bonds including Treasury Bills 14,045,797 6,974,128 2 Other Approved Securities 350,930 - 3 Other Investments
(a) Shares (aa) Equity - - (bb) Preference - - (b) Mutual Funds - 1,500,000
(c) Derivative Instruments - - (d) Debentures/ Bonds 5,830,503 5,727,159 (e) Other Securities
(aa) Commercial Paper - - (bb) Certificate of Deposit - 241,815 (cc) Fixed Deposit - 2,469,500 (dd) Deep Discount Bonds 522,340 558,569 (ee) CBLO/Repo Investments 14,719,469 11,521,210
(f) Subsidiaries - - (g)Investment Properties - Real Estate - -
4 Investments in Infrastructure and Social Sector 1,903,422 50,297 5 Other than Approved Investments 53,209 4,397,532
Sub Total (B) 37,425,670 33,440,210
TOTAL 346,915,391 258,628,745
Notes :
(` '000)
Sr.
No.Particulars
As at
March 31, 2017
As at
March 31, 2016
1 Aggregate amount of Company's investments and the market value:a) Aggregate amount of Company's investment other than listed Equity Securities & MutualFunds
302,131,093 224,200,131
b) Market Value of above investment 313,123,999 228,760,342 2 Investment in holding company at cost 4,361,087 2,898,723 3 Investment in subsidiaries company at cost - -
Government Securities deposited with Reserve Bank of India in order to comply with the requirement prescribed under erstwhile Section 7 of the Insurance Act, 1938a) Amortised cost - -b) Market Value of above investment - -Government Securities deposited with the Clearing Corporation of India Ltd (CCIL) for collateralized borrowing and lending obligation segment.a) Amortised cost 236,374 157,269 b) Market Value of above investment 237,131 152,589
6 Fixed Deposits towards margin requirement for equity trade settlement a) Deposited with National Securities Clearing Corporation Limited (NSCCL) - -b) Deposited with Indian Clearing Corporation Limited (ICCL) - -
7 Investment made out of catastrophe reserve - -
4
5
16
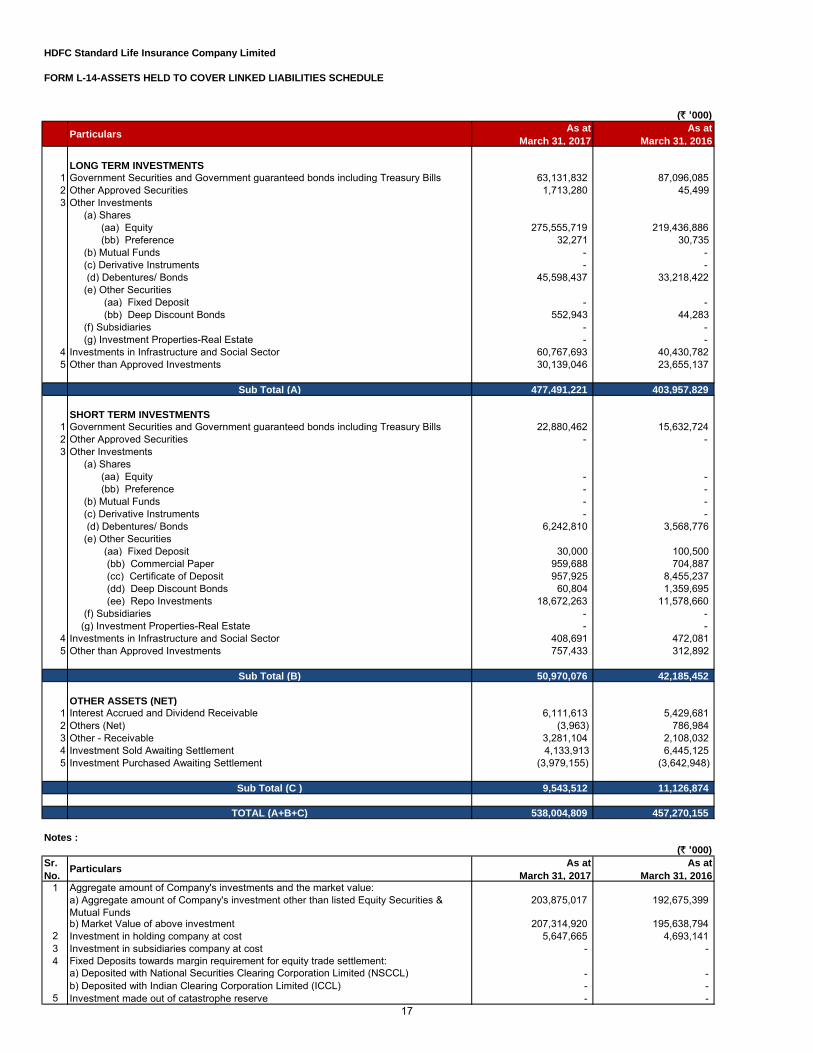
HDFC Standard Life Insurance Company Limited
FORM L-14-ASSETS HELD TO COVER LINKED LIABILITIES SCHEDULE
(` '000)
ParticularsAs at
March 31, 2017
As at
March 31, 2016
LONG TERM INVESTMENTS
1 Government Securities and Government guaranteed bonds including Treasury Bills 63,131,832 87,096,085 2 Other Approved Securities 1,713,280 45,499 3 Other Investments
(a) Shares (aa) Equity 275,555,719 219,436,886 (bb) Preference 32,271 30,735
(b) Mutual Funds - - (c) Derivative Instruments - - (d) Debentures/ Bonds 45,598,437 33,218,422
(e) Other Securities (aa) Fixed Deposit - - (bb) Deep Discount Bonds 552,943 44,283
(f) Subsidiaries - - (g) Investment Properties-Real Estate - -
4 Investments in Infrastructure and Social Sector 60,767,693 40,430,782 5 Other than Approved Investments 30,139,046 23,655,137
Sub Total (A) 477,491,221 403,957,829
SHORT TERM INVESTMENTS
1 Government Securities and Government guaranteed bonds including Treasury Bills 22,880,462 15,632,724 2 Other Approved Securities - - 3 Other Investments
(a) Shares (aa) Equity - - (bb) Preference - -
(b) Mutual Funds - - (c) Derivative Instruments - - (d) Debentures/ Bonds 6,242,810 3,568,776 (e) Other Securities
(aa) Fixed Deposit 30,000 100,500 (bb) Commercial Paper 959,688 704,887 (cc) Certificate of Deposit 957,925 8,455,237 (dd) Deep Discount Bonds 60,804 1,359,695 (ee) Repo Investments 18,672,263 11,578,660
(f) Subsidiaries - - (g) Investment Properties-Real Estate - -
4 Investments in Infrastructure and Social Sector 408,691 472,081 5 Other than Approved Investments 757,433 312,892
Sub Total (B) 50,970,076 42,185,452
OTHER ASSETS (NET)
1 Interest Accrued and Dividend Receivable 6,111,613 5,429,681 2 Others (Net) (3,963) 786,984 3 Other - Receivable 3,281,104 2,108,032 4 Investment Sold Awaiting Settlement 4,133,913 6,445,125 5 Investment Purchased Awaiting Settlement (3,979,155) (3,642,948)
Sub Total (C ) 9,543,512 11,126,874
TOTAL (A+B+C) 538,004,809 457,270,155
Notes :
(` '000)
Sr.
No.Particulars
As at
March 31, 2017
As at
March 31, 2016
1 Aggregate amount of Company's investments and the market value:a) Aggregate amount of Company's investment other than listed Equity Securities &Mutual Funds
203,875,017 192,675,399
b) Market Value of above investment 207,314,920 195,638,794 2 Investment in holding company at cost 5,647,665 4,693,141 3 Investment in subsidiaries company at cost - -4 Fixed Deposits towards margin requirement for equity trade settlement:
a) Deposited with National Securities Clearing Corporation Limited (NSCCL) - -b) Deposited with Indian Clearing Corporation Limited (ICCL) - -
5 Investment made out of catastrophe reserve - -17
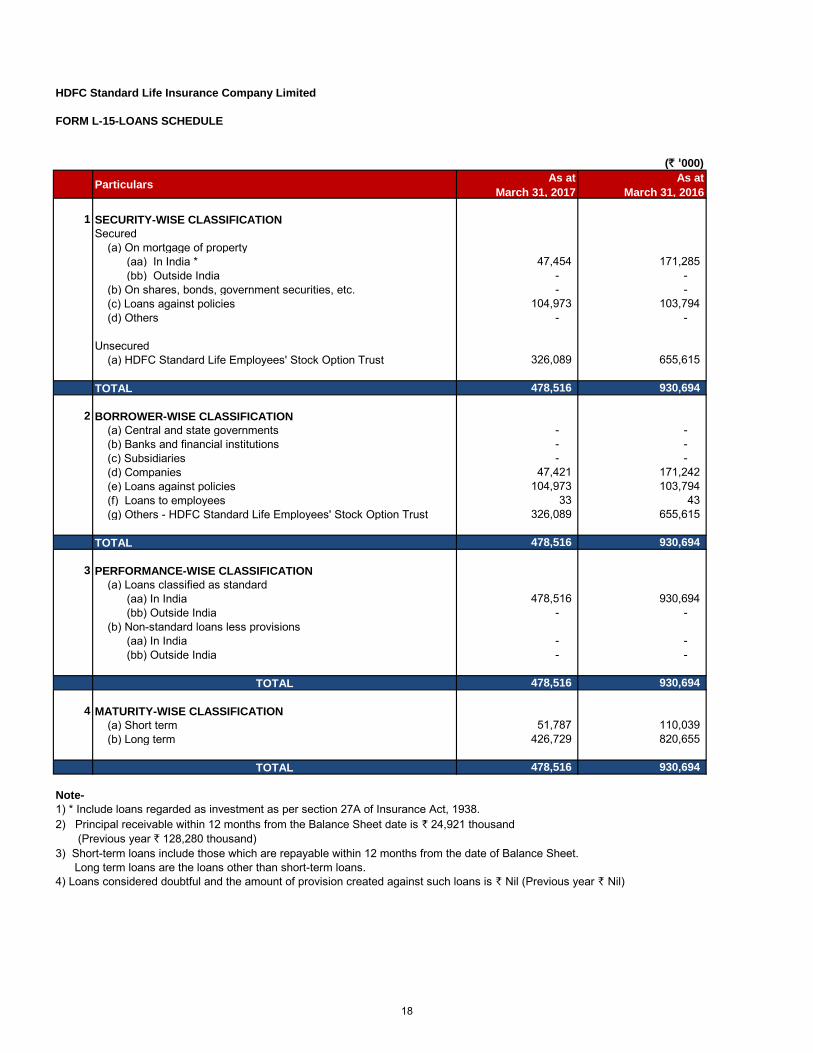
HDFC Standard Life Insurance Company Limited
FORM L-15-LOANS SCHEDULE
(` '000)
ParticularsAs at
March 31, 2017
As at
March 31, 2016
1 SECURITY-WISE CLASSIFICATION
Secured (a) On mortgage of property (aa) In India * 47,454 171,285 (bb) Outside India - - (b) On shares, bonds, government securities, etc. - - (c) Loans against policies 104,973 103,794 (d) Others - -
Unsecured (a) HDFC Standard Life Employees' Stock Option Trust 326,089 655,615
TOTAL 478,516 930,694
2 BORROWER-WISE CLASSIFICATION
(a) Central and state governments - - (b) Banks and financial institutions - - (c) Subsidiaries - - (d) Companies 47,421 171,242 (e) Loans against policies 104,973 103,794 (f) Loans to employees 33 43 (g) Others - HDFC Standard Life Employees' Stock Option Trust 326,089 655,615
TOTAL 478,516 930,694
3 PERFORMANCE-WISE CLASSIFICATION
(a) Loans classified as standard (aa) In India 478,516 930,694 (bb) Outside India - - (b) Non-standard loans less provisions (aa) In India - - (bb) Outside India - -
TOTAL 478,516 930,694
4 MATURITY-WISE CLASSIFICATION
(a) Short term 51,787 110,039 (b) Long term 426,729 820,655
TOTAL 478,516 930,694
Note-
1) * Include loans regarded as investment as per section 27A of Insurance Act, 1938.2) Principal receivable within 12 months from the Balance Sheet date is ` 24,921 thousand (Previous year ` 128,280 thousand)3) Short-term loans include those which are repayable within 12 months from the date of Balance Sheet. Long term loans are the loans other than short-term loans.4) Loans considered doubtful and the amount of provision created against such loans is ` Nil (Previous year ` Nil)
18
HDFC Standard Life Insurance Company Limited
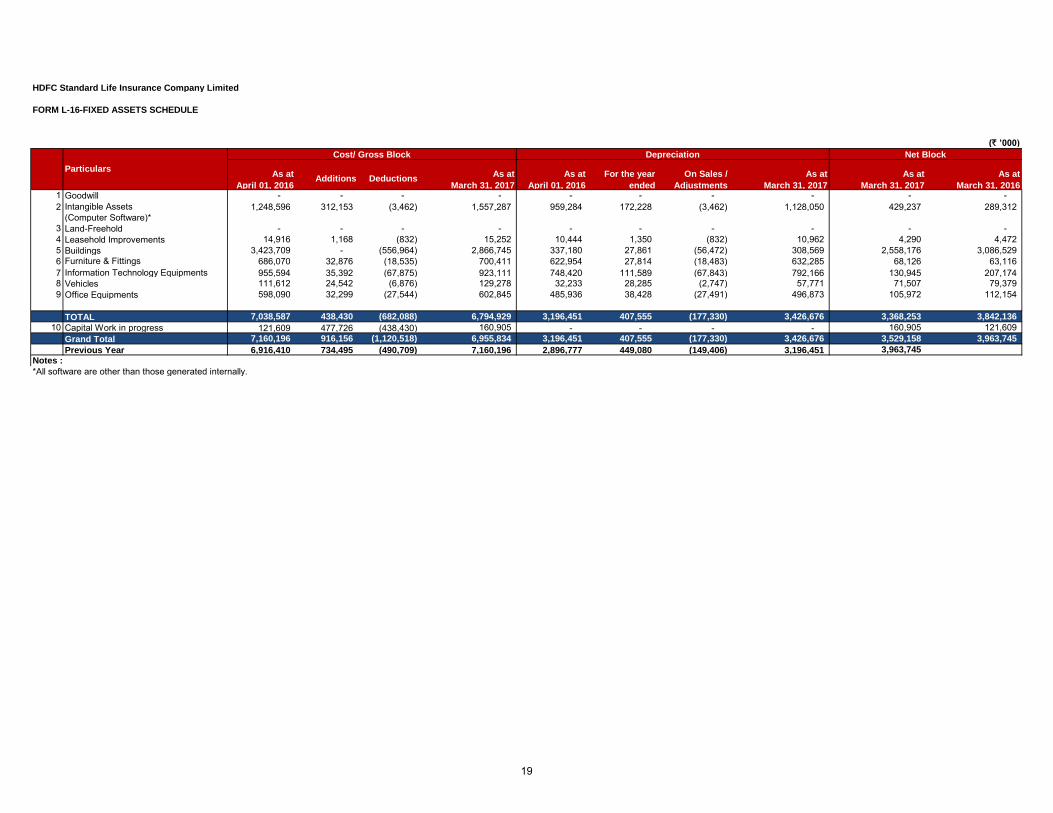
FORM L-16-FIXED ASSETS SCHEDULE
(` ’000)
1 Goodwill - - - - - - - - - - 2 Intangible Assets
(Computer Software)*1,248,596 312,153 (3,462) 1,557,287 959,284 172,228 (3,462) 1,128,050 429,237 289,312
3 Land-Freehold - - - - - - - - - - 4 Leasehold Improvements 14,916 1,168 (832) 15,252 10,444 1,350 (832) 10,962 4,290 4,472 5 Buildings 3,423,709 - (556,964) 2,866,745 337,180 27,861 (56,472) 308,569 2,558,176 3,086,529 6 Furniture & Fittings 686,070 32,876 (18,535) 700,411 622,954 27,814 (18,483) 632,285 68,126 63,116 7 Information Technology Equipments 955,594 35,392 (67,875) 923,111 748,420 111,589 (67,843) 792,166 130,945 207,174 8 Vehicles 111,612 24,542 (6,876) 129,278 32,233 28,285 (2,747) 57,771 71,507 79,379 9 Office Equipments 598,090 32,299 (27,544) 602,845 485,936 38,428 (27,491) 496,873 105,972 112,154
TOTAL 7,038,587 438,430 (682,088) 6,794,929 3,196,451 407,555 (177,330) 3,426,676 3,368,253 3,842,136
10 Capital Work in progress 121,609 477,726 (438,430) 160,905 - - - - 160,905 121,609 Grand Total 7,160,196 916,156 (1,120,518) 6,955,834 3,196,451 407,555 (177,330) 3,426,676 3,529,158 3,963,745
Previous Year 6,916,410 734,495 (490,709) 7,160,196 2,896,777 449,080 (149,406) 3,196,451 3,963,745
Notes :
*All software are other than those generated internally.
As at
March 31, 2017
As at
April 01, 2016
Cost/ Gross Block Depreciation
For the year
ended
As at
March 31, 2017
As at
March 31, 2017
ParticularsAs at
April 01, 2016Additions Deductions
On Sales /
Adjustments
Net Block
As at
March 31, 2016
19
HDFC Standard Life Insurance Company Limited
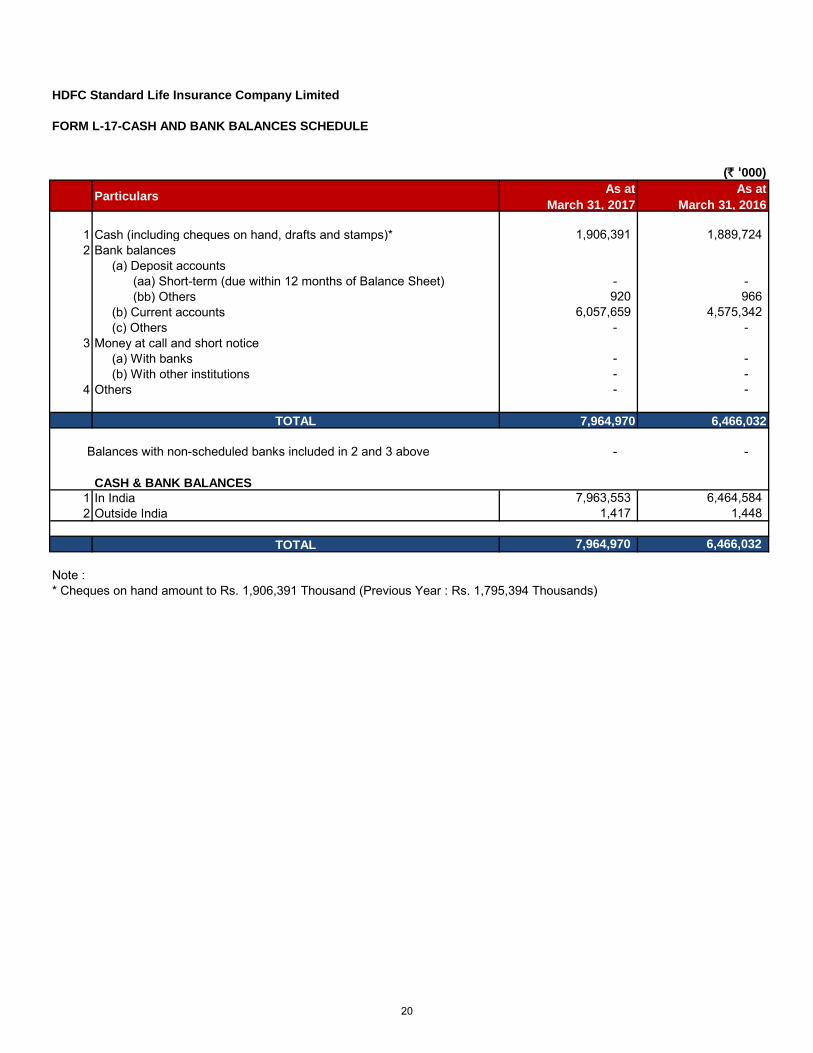
FORM L-17-CASH AND BANK BALANCES SCHEDULE
(` '000)
ParticularsAs at
March 31, 2017
As at
March 31, 2016
1 Cash (including cheques on hand, drafts and stamps)* 1,906,391 1,889,724 2 Bank balances
(a) Deposit accounts (aa) Short-term (due within 12 months of Balance Sheet) - - (bb) Others 920 966 (b) Current accounts 6,057,659 4,575,342 (c) Others - -
3 Money at call and short notice (a) With banks - - (b) With other institutions - -
4 Others - -
TOTAL 7,964,970 6,466,032
Balances with non-scheduled banks included in 2 and 3 above - -
CASH & BANK BALANCES
1 In India 7,963,553 6,464,584 2 Outside India 1,417 1,448
TOTAL 7,964,970 6,466,032
Note :* Cheques on hand amount to Rs. 1,906,391 Thousand (Previous Year : Rs. 1,795,394 Thousands)
20
HDFC Standard Life Insurance Company Limited
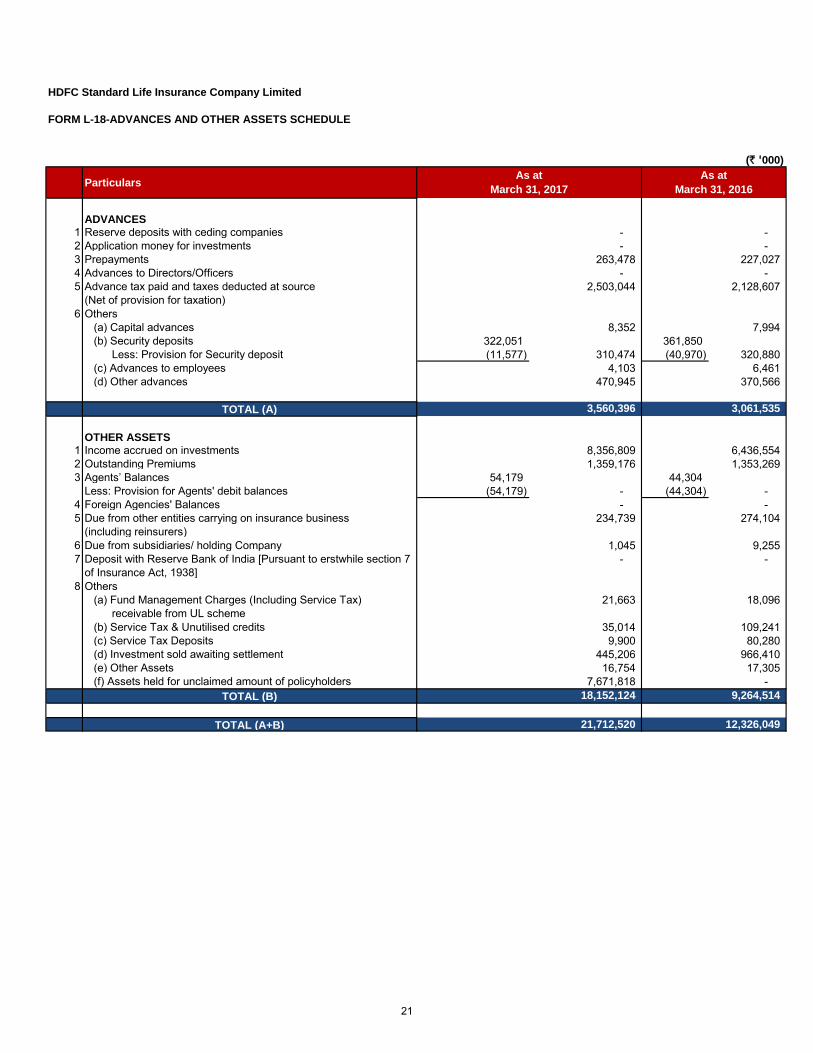
FORM L-18-ADVANCES AND OTHER ASSETS SCHEDULE
(` '000)
Particulars
ADVANCES
1 Reserve deposits with ceding companies - - 2 Application money for investments - - 3 Prepayments 263,478 227,027 4 Advances to Directors/Officers - - 5 Advance tax paid and taxes deducted at source
(Net of provision for taxation) 2,503,044 2,128,607
6 Others (a) Capital advances 8,352 7,994 (b) Security deposits 322,051 361,850 Less: Provision for Security deposit (11,577) 310,474 (40,970) 320,880 (c) Advances to employees 4,103 6,461 (d) Other advances 470,945 370,566
TOTAL (A) 3,560,396 3,061,535
OTHER ASSETS
1 Income accrued on investments 8,356,809 6,436,554 2 Outstanding Premiums 1,359,176 1,353,269 3 Agents’ Balances 54,179 44,304
Less: Provision for Agents' debit balances (54,179) - (44,304) - 4 Foreign Agencies' Balances - - 5 Due from other entities carrying on insurance business
(including reinsurers)234,739 274,104
6 Due from subsidiaries/ holding Company 1,045 9,255 7 Deposit with Reserve Bank of India [Pursuant to erstwhile section 7
of Insurance Act, 1938]- -
8 Others (a) Fund Management Charges (Including Service Tax) receivable from UL scheme
21,663 18,096
(b) Service Tax & Unutilised credits 35,014 109,241 (c) Service Tax Deposits 9,900 80,280 (d) Investment sold awaiting settlement 445,206 966,410 (e) Other Assets 16,754 17,305 (f) Assets held for unclaimed amount of policyholders 7,671,818 -
TOTAL (B) 18,152,124 9,264,514
TOTAL (A+B) 21,712,520 12,326,049
As at
March 31, 2016
As at
March 31, 2017
21
HDFC Standard Life Insurance Company Limited
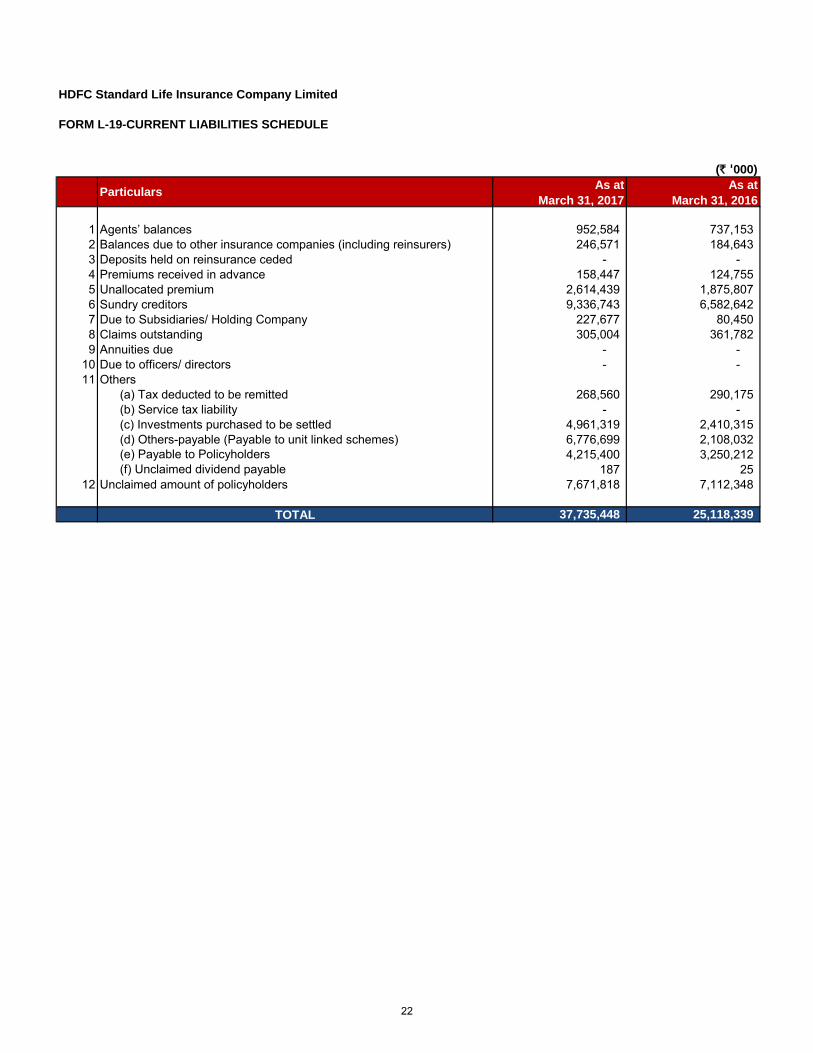
FORM L-19-CURRENT LIABILITIES SCHEDULE
(` '000)
ParticularsAs at
March 31, 2017
As at
March 31, 2016
1 Agents’ balances 952,584 737,153 2 Balances due to other insurance companies (including reinsurers) 246,571 184,643 3 Deposits held on reinsurance ceded - - 4 Premiums received in advance 158,447 124,755 5 Unallocated premium 2,614,439 1,875,807 6 Sundry creditors 9,336,743 6,582,642 7 Due to Subsidiaries/ Holding Company 227,677 80,450 8 Claims outstanding 305,004 361,782 9 Annuities due - -
10 Due to officers/ directors - - 11 Others
(a) Tax deducted to be remitted 268,560 290,175 (b) Service tax liability - - (c) Investments purchased to be settled 4,961,319 2,410,315 (d) Others-payable (Payable to unit linked schemes) 6,776,699 2,108,032 (e) Payable to Policyholders 4,215,400 3,250,212 (f) Unclaimed dividend payable 187 25
12 Unclaimed amount of policyholders 7,671,818 7,112,348
TOTAL 37,735,448 25,118,339
22
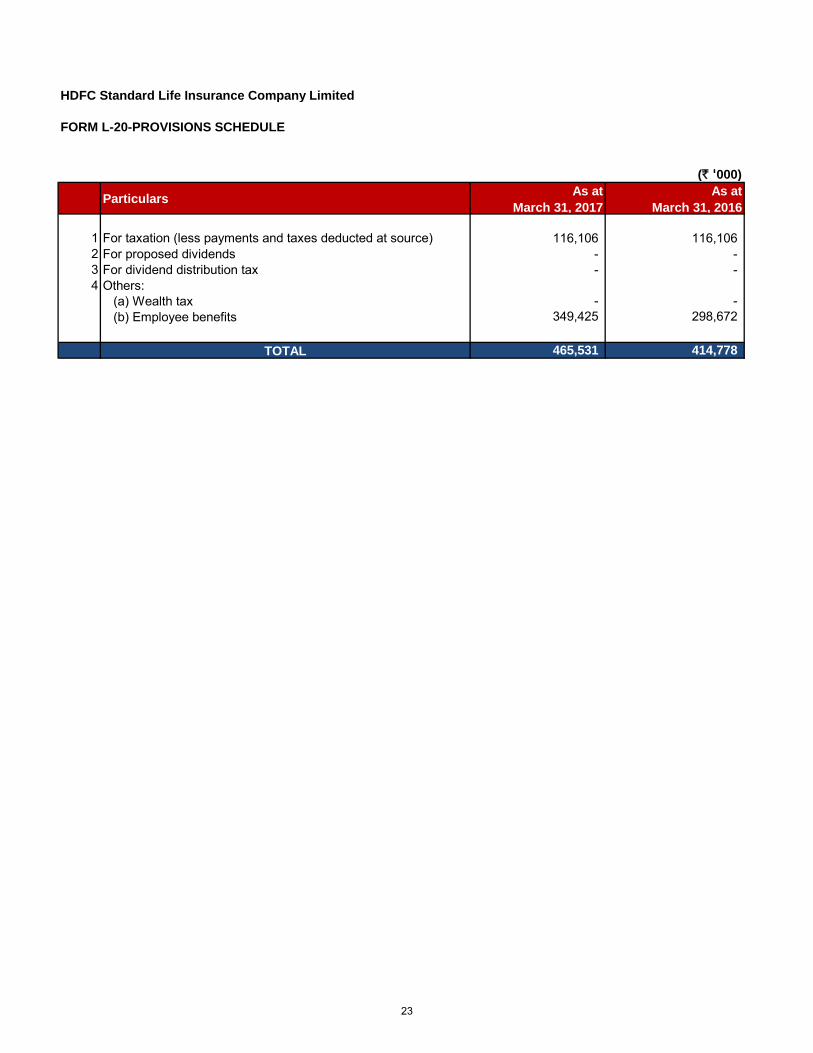
HDFC Standard Life Insurance Company Limited
FORM L-20-PROVISIONS SCHEDULE
(` '000)
ParticularsAs at
March 31, 2017
As at
March 31, 2016
1 For taxation (less payments and taxes deducted at source) 116,106 116,106 2 For proposed dividends - - 3 For dividend distribution tax - - 4 Others:
(a) Wealth tax - - (b) Employee benefits 349,425 298,672
TOTAL 465,531 414,778
23
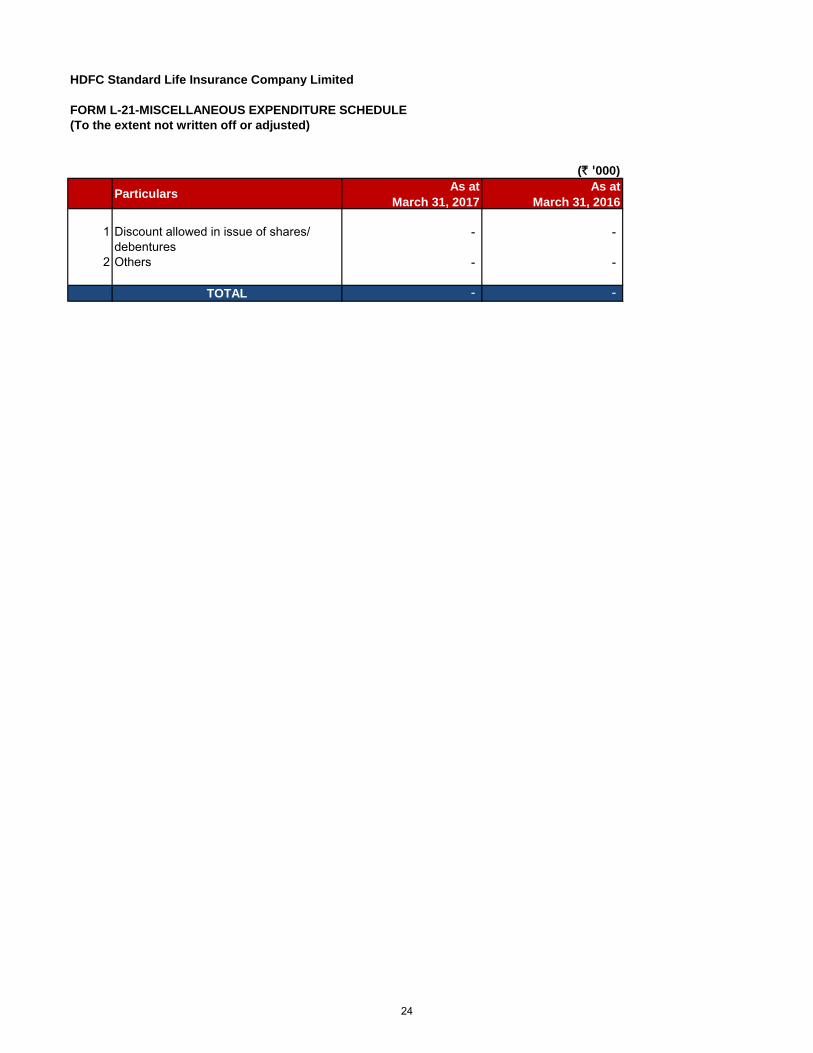
HDFC Standard Life Insurance Company Limited
FORM L-21-MISCELLANEOUS EXPENDITURE SCHEDULE
(To the extent not written off or adjusted)
(` '000)
ParticularsAs at
March 31, 2017
As at
March 31, 2016
1 Discount allowed in issue of shares/ debentures
- -
2 Others - -
TOTAL - -
24
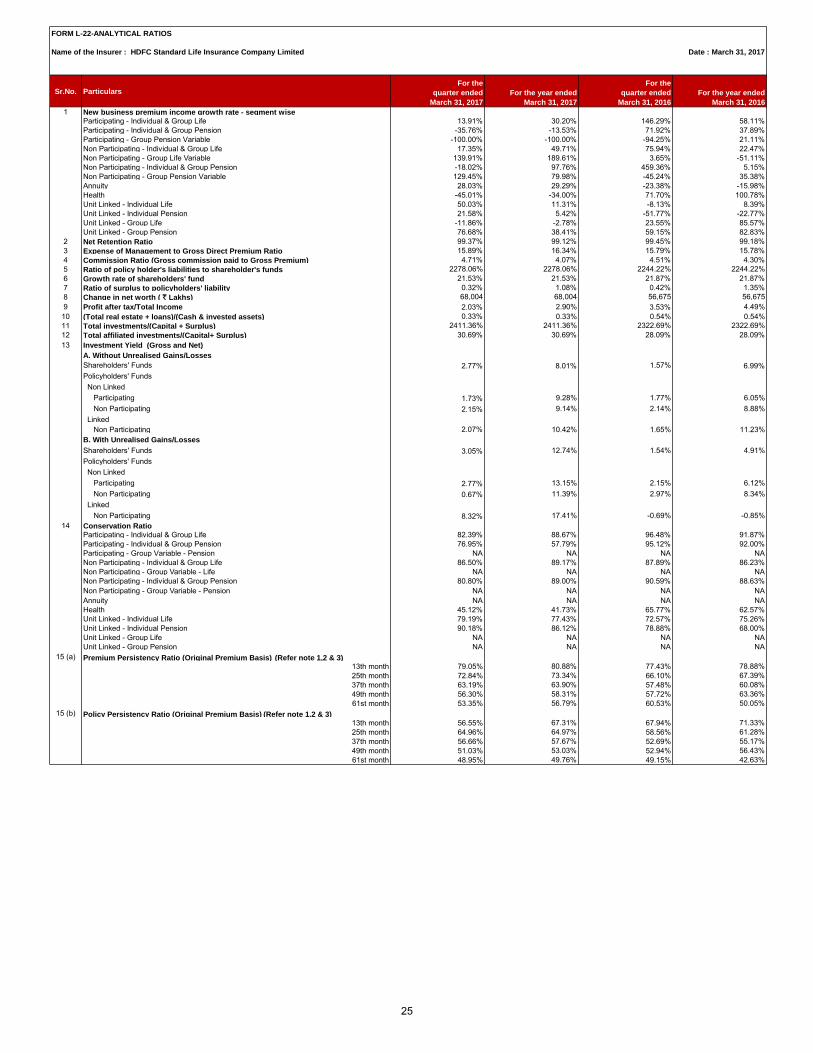
FORM L-22-ANALYTICAL RATIOS
Name of the Insurer : HDFC Standard Life Insurance Company Limited Date : March 31, 2017
Sr.No. ParticularsFor the
quarter ended
March 31, 2017
For the year ended
March 31, 2017
For the
quarter ended
March 31, 2016
For the year ended
March 31, 2016
1 New business premium income growth rate - segment wise
Participating - Individual & Group Life 13.91% 30.20% 146.29% 58.11%Participating - Individual & Group Pension -35.76% -13.53% 71.92% 37.89%Participating - Group Pension Variable -100.00% -100.00% -94.25% 21.11%Non Participating - Individual & Group Life 17.35% 49.71% 75.94% 22.47%Non Participating - Group Life Variable 139.91% 189.61% 3.65% -51.11%Non Participating - Individual & Group Pension -18.02% 97.76% 459.36% 5.15%Non Participating - Group Pension Variable 129.45% 79.98% -45.24% 35.38%Annuity 28.03% 29.29% -23.38% -15.98%Health -45.01% -34.00% 71.70% 100.78%Unit Linked - Individual Life 50.03% 11.31% -8.13% 8.39%Unit Linked - Individual Pension 21.58% 5.42% -51.77% -22.77%Unit Linked - Group Life -11.86% -2.78% 23.55% 85.57%Unit Linked - Group Pension 76.68% 38.41% 59.15% 82.83%
2 Net Retention Ratio 99.37% 99.12% 99.45% 99.18%3 Expense of Management to Gross Direct Premium Ratio 15.89% 16.34% 15.79% 15.78%4 Commission Ratio (Gross commission paid to Gross Premium) 4.71% 4.07% 4.51% 4.30%5 Ratio of policy holder's liabilities to shareholder's funds 2278.06% 2278.06% 2244.22% 2244.22%6 Growth rate of shareholders' fund 21.53% 21.53% 21.87% 21.87%7 Ratio of surplus to policyholders' liability 0.32% 1.08% 0.42% 1.35%8 Change in net worth ( ` Lakhs) 68,004 68,004 56,675 56,675 9 Profit after tax/Total Income 2.03% 2.90% 3.53% 4.49%10 (Total real estate + loans)/(Cash & invested assets) 0.33% 0.33% 0.54% 0.54%11 Total investments/(Capital + Surplus) 2411.36% 2411.36% 2322.69% 2322.69%12 Total affiliated investments/(Capital+ Surplus) 30.69% 30.69% 28.09% 28.09%13 Investment Yield (Gross and Net)
A. Without Unrealised Gains/Losses
Shareholders' Funds 2.77% 8.01% 1.57% 6.99%Policyholders' Funds Non Linked Participating 1.73% 9.28% 1.77% 6.05% Non Participating 2.15% 9.14% 2.14% 8.88% Linked Non Participating 2.07% 10.42% 1.65% 11.23%B. With Unrealised Gains/Losses
Shareholders' Funds 3.05% 12.74% 1.54% 4.91%Policyholders' Funds Non Linked Participating 2.77% 13.15% 2.15% 6.12% Non Participating 0.67% 11.39% 2.97% 8.34% Linked Non Participating 8.32% 17.41% -0.69% -0.85%
14 Conservation RatioParticipating - Individual & Group Life 82.39% 88.67% 96.48% 91.87%Participating - Individual & Group Pension 76.95% 57.79% 95.12% 92.00%Participating - Group Variable - Pension NA NA NA NANon Participating - Individual & Group Life 86.50% 89.17% 87.89% 86.23%Non Participating - Group Variable - Life NA NA NA NANon Participating - Individual & Group Pension 80.80% 89.00% 90.59% 88.63%Non Participating - Group Variable - Pension NA NA NA NAAnnuity NA NA NA NAHealth 45.12% 41.73% 65.77% 62.57%Unit Linked - Individual Life 79.19% 77.43% 72.57% 75.26%Unit Linked - Individual Pension 90.18% 86.12% 78.88% 68.00%Unit Linked - Group Life NA NA NA NAUnit Linked - Group Pension NA NA NA NA
15 (a) Premium Persistency Ratio (Original Premium Basis) (Refer note 1,2 & 3)
13th month 79.05% 80.88% 77.43% 78.88%25th month 72.84% 73.34% 66.10% 67.39%37th month 63.19% 63.90% 57.48% 60.08%49th month 56.30% 58.31% 57.72% 63.36%61st month 53.35% 56.79% 60.53% 50.05%
15 (b) Policy Persistency Ratio (Original Premium Basis) (Refer note 1,2 & 3)
13th month 56.55% 67.31% 67.94% 71.33%25th month 64.96% 64.97% 58.56% 61.28%37th month 56.66% 57.67% 52.69% 55.17%49th month 51.03% 53.03% 52.94% 56.43%61st month 48.95% 49.76% 49.15% 42.63%
25
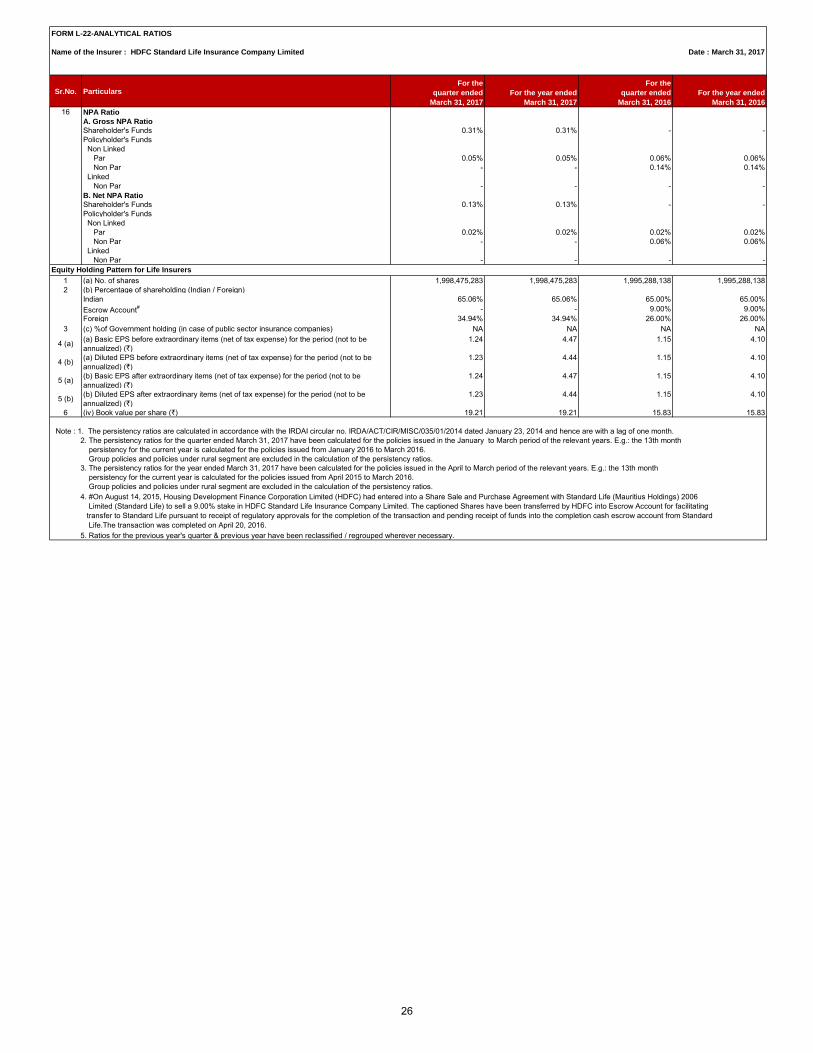
FORM L-22-ANALYTICAL RATIOS
Name of the Insurer : HDFC Standard Life Insurance Company Limited Date : March 31, 2017
Sr.No. ParticularsFor the
quarter ended
March 31, 2017
For the year ended
March 31, 2017
For the
quarter ended
March 31, 2016
For the year ended
March 31, 2016
16 NPA Ratio
A. Gross NPA Ratio
Shareholder's Funds 0.31% 0.31% - -Policyholder's Funds Non Linked Par 0.05% 0.05% 0.06% 0.06% Non Par - - 0.14% 0.14% Linked Non Par - - - - B. Net NPA Ratio
Shareholder's Funds 0.13% 0.13% - -Policyholder's Funds Non Linked Par 0.02% 0.02% 0.02% 0.02% Non Par - - 0.06% 0.06% Linked Non Par - - - -
1 (a) No. of shares 1,998,475,283 1,998,475,283 1,995,288,138 1,995,288,138 2 (b) Percentage of shareholding (Indian / Foreign)
Indian 65.06% 65.06% 65.00% 65.00%Escrow Account# - - 9.00% 9.00%Foreign 34.94% 34.94% 26.00% 26.00%
3 (c) %of Government holding (in case of public sector insurance companies) NA NA NA NA
4 (a) (a) Basic EPS before extraordinary items (net of tax expense) for the period (not to be annualized) (`)
1.24 4.47 1.15 4.10
4 (b) (a) Diluted EPS before extraordinary items (net of tax expense) for the period (not to be annualized) (`)
1.23 4.44 1.15 4.10
5 (a) (b) Basic EPS after extraordinary items (net of tax expense) for the period (not to be annualized) (`)
1.24 4.47 1.15 4.10
5 (b) (b) Diluted EPS after extraordinary items (net of tax expense) for the period (not to be annualized) (`)
1.23 4.44 1.15 4.10
6 (iv) Book value per share (`) 19.21 19.21 15.83 15.83
3. The persistency ratios for the year ended March 31, 2017 have been calculated for the policies issued in the April to March period of the relevant years. E.g.: the 13th month persistency for the current year is calculated for the policies issued from April 2015 to March 2016. Group policies and policies under rural segment are excluded in the calculation of the persistency ratios.
Equity Holding Pattern for Life Insurers
5. Ratios for the previous year's quarter & previous year have been reclassified / regrouped wherever necessary.
Note : 1. The persistency ratios are calculated in accordance with the IRDAI circular no. IRDA/ACT/CIR/MISC/035/01/2014 dated January 23, 2014 and hence are with a lag of one month. 2. The persistency ratios for the quarter ended March 31, 2017 have been calculated for the policies issued in the January to March period of the relevant years. E.g.: the 13th month persistency for the current year is calculated for the policies issued from January 2016 to March 2016. Group policies and policies under rural segment are excluded in the calculation of the persistency ratios.
4. #On August 14, 2015, Housing Development Finance Corporation Limited (HDFC) had entered into a Share Sale and Purchase Agreement with Standard Life (Mauritius Holdings) 2006 Limited (Standard Life) to sell a 9.00% stake in HDFC Standard Life Insurance Company Limited. The captioned Shares have been transferred by HDFC into Escrow Account for facilitating transfer to Standard Life pursuant to receipt of regulatory approvals for the completion of the transaction and pending receipt of funds into the completion cash escrow account from Standard Life.The transaction was completed on April 20, 2016.
26
HDFC Standard Life Insurance Company Limited
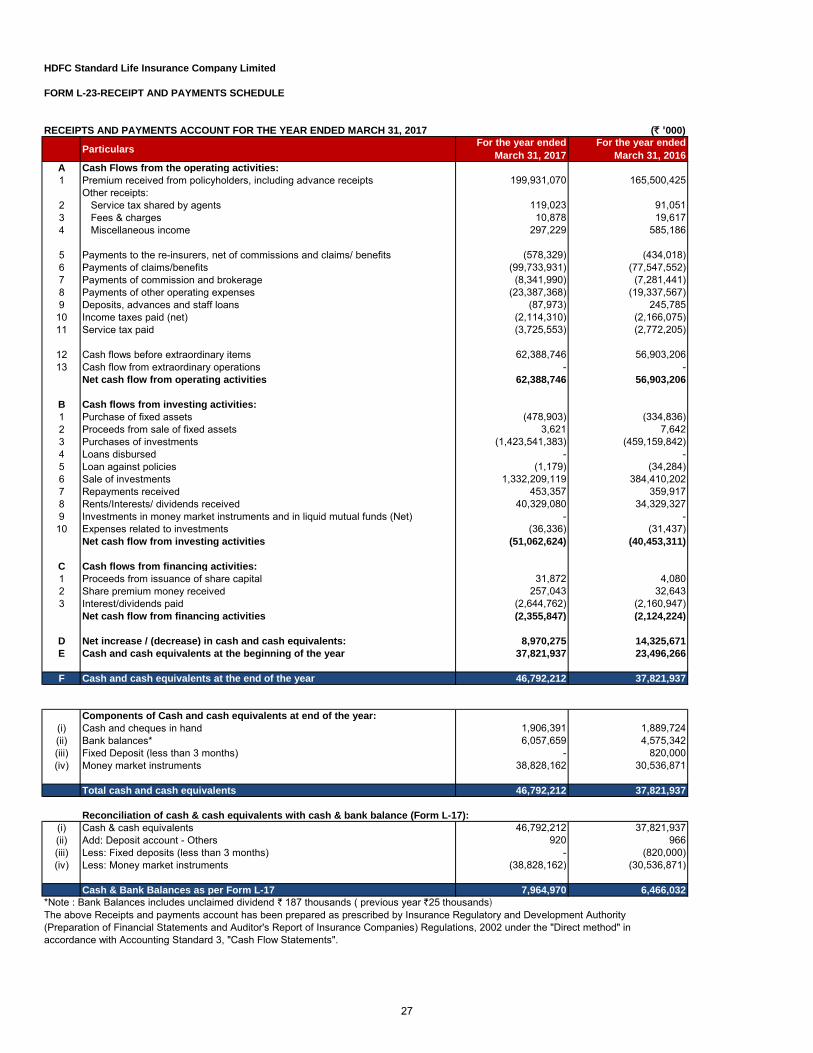
FORM L-23-RECEIPT AND PAYMENTS SCHEDULE
RECEIPTS AND PAYMENTS ACCOUNT FOR THE YEAR ENDED MARCH 31, 2017 (` '000)
ParticularsFor the year ended
March 31, 2017
For the year ended
March 31, 2016
A Cash Flows from the operating activities:
1 Premium received from policyholders, including advance receipts 199,931,070 165,500,425 Other receipts:
2 Service tax shared by agents 119,023 91,051 3 Fees & charges 10,878 19,617 4 Miscellaneous income 297,229 585,186
5 Payments to the re-insurers, net of commissions and claims/ benefits (578,329) (434,018)6 Payments of claims/benefits (99,733,931) (77,547,552)7 Payments of commission and brokerage (8,341,990) (7,281,441)8 Payments of other operating expenses (23,387,368) (19,337,567)9 Deposits, advances and staff loans (87,973) 245,785
10 Income taxes paid (net) (2,114,310) (2,166,075)11 Service tax paid (3,725,553) (2,772,205)
12 Cash flows before extraordinary items 62,388,746 56,903,206 13 Cash flow from extraordinary operations - -
Net cash flow from operating activities 62,388,746 56,903,206
B Cash flows from investing activities:
1 Purchase of fixed assets (478,903) (334,836)2 Proceeds from sale of fixed assets 3,621 7,642 3 Purchases of investments (1,423,541,383) (459,159,842)4 Loans disbursed - - 5 Loan against policies (1,179) (34,284)6 Sale of investments 1,332,209,119 384,410,202 7 Repayments received 453,357 359,917 8 Rents/Interests/ dividends received 40,329,080 34,329,327 9 Investments in money market instruments and in liquid mutual funds (Net) - -
10 Expenses related to investments (36,336) (31,437)Net cash flow from investing activities (51,062,624) (40,453,311)
C Cash flows from financing activities:
1 Proceeds from issuance of share capital 31,872 4,080 2 Share premium money received 257,043 32,643 3 Interest/dividends paid (2,644,762) (2,160,947)
Net cash flow from financing activities (2,355,847) (2,124,224)
D Net increase / (decrease) in cash and cash equivalents: 8,970,275 14,325,671
E Cash and cash equivalents at the beginning of the year 37,821,937 23,496,266
F Cash and cash equivalents at the end of the year 46,792,212 37,821,937
Components of Cash and cash equivalents at end of the year:
(i) Cash and cheques in hand 1,906,391 1,889,724 (ii) Bank balances* 6,057,659 4,575,342 (iii) Fixed Deposit (less than 3 months) - 820,000 (iv) Money market instruments 38,828,162 30,536,871
Total cash and cash equivalents 46,792,212 37,821,937
Reconciliation of cash & cash equivalents with cash & bank balance (Form L-17):
(i) Cash & cash equivalents 46,792,212 37,821,937 (ii) Add: Deposit account - Others 920 966 (iii) Less: Fixed deposits (less than 3 months) - (820,000)(iv) Less: Money market instruments (38,828,162) (30,536,871)
Cash & Bank Balances as per Form L-17 7,964,970 6,466,032
*Note : Bank Balances includes unclaimed dividend ` 187 thousands ( previous year `25 thousands)
The above Receipts and payments account has been prepared as prescribed by Insurance Regulatory and Development Authority(Preparation of Financial Statements and Auditor's Report of Insurance Companies) Regulations, 2002 under the "Direct method" inaccordance with Accounting Standard 3, "Cash Flow Statements".
27
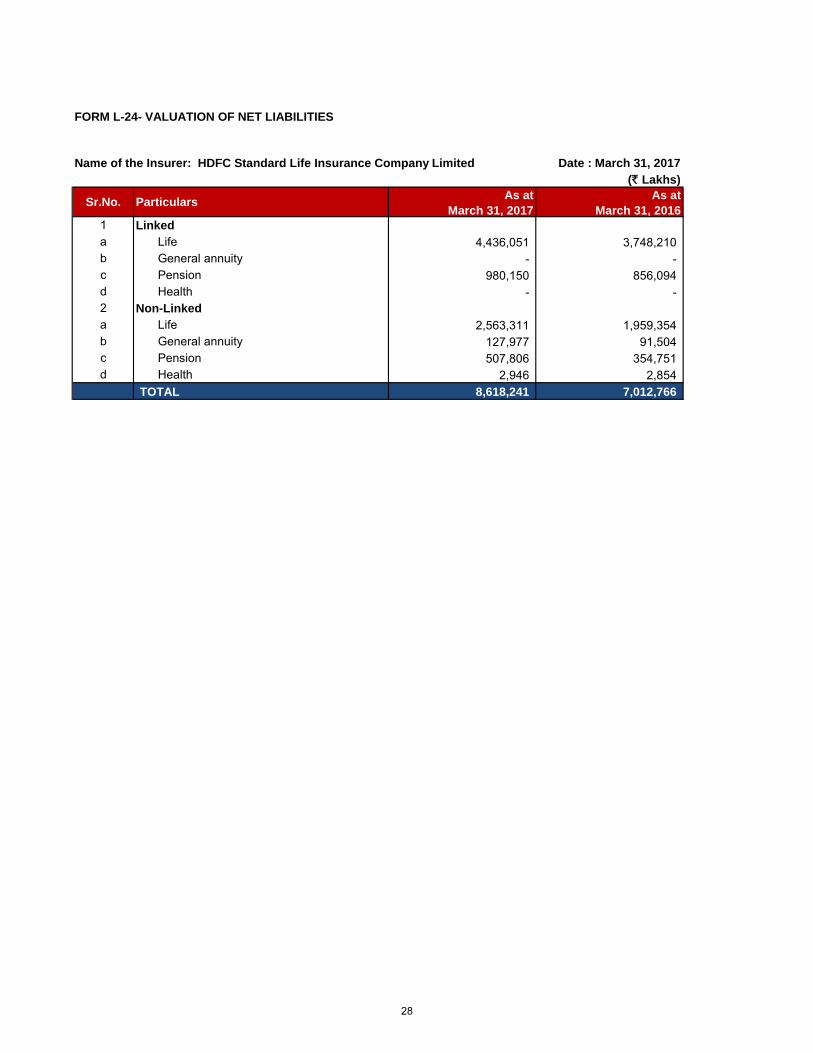
FORM L-24- VALUATION OF NET LIABILITIES
Name of the Insurer: HDFC Standard Life Insurance Company Limited Date : March 31, 2017
(` Lakhs)
Sr.No. ParticularsAs at
March 31, 2017
As at
March 31, 2016
1 Linked
a Life 4,436,051 3,748,210 b General annuity - - c Pension 980,150 856,094 d Health - - 2 Non-Linked
a Life 2,563,311 1,959,354 b General annuity 127,977 91,504 c Pension 507,806 354,751 d Health 2,946 2,854
TOTAL 8,618,241 7,012,766
28
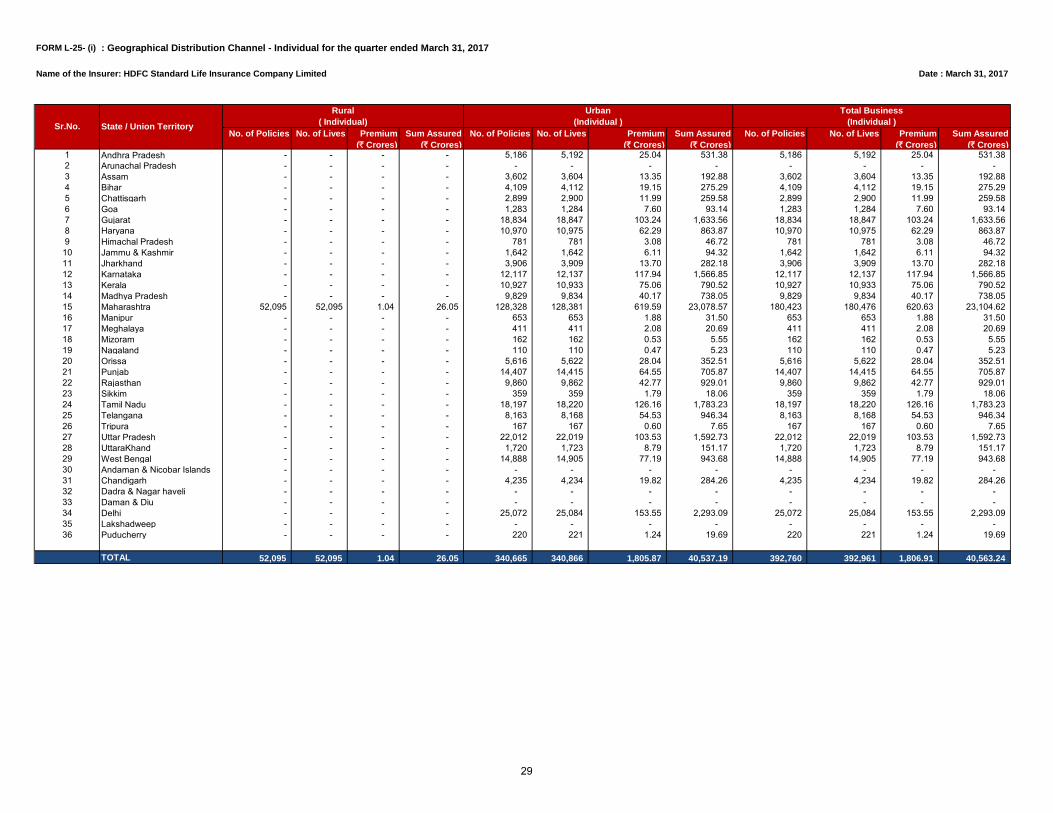
FORM L-25- (i) : Geographical Distribution Channel - Individual for the quarter ended March 31, 2017
Name of the Insurer: HDFC Standard Life Insurance Company Limited Date : March 31, 2017
No. of Policies No. of Lives Premium
(` Crores)
Sum Assured
(` Crores)
No. of Policies No. of Lives Premium
(` Crores)
Sum Assured
(` Crores)
No. of Policies No. of Lives Premium
(` Crores)
Sum Assured
(` Crores)1 Andhra Pradesh - - - - 5,186 5,192 25.04 531.38 5,186 5,192 25.04 531.38 2 Arunachal Pradesh - - - - - - - - - - - - 3 Assam - - - - 3,602 3,604 13.35 192.88 3,602 3,604 13.35 192.88 4 Bihar - - - - 4,109 4,112 19.15 275.29 4,109 4,112 19.15 275.29 5 Chattisgarh - - - - 2,899 2,900 11.99 259.58 2,899 2,900 11.99 259.58 6 Goa - - - - 1,283 1,284 7.60 93.14 1,283 1,284 7.60 93.14 7 Gujarat - - - - 18,834 18,847 103.24 1,633.56 18,834 18,847 103.24 1,633.56 8 Haryana - - - - 10,970 10,975 62.29 863.87 10,970 10,975 62.29 863.87 9 Himachal Pradesh - - - - 781 781 3.08 46.72 781 781 3.08 46.72 10 Jammu & Kashmir - - - - 1,642 1,642 6.11 94.32 1,642 1,642 6.11 94.32 11 Jharkhand - - - - 3,906 3,909 13.70 282.18 3,906 3,909 13.70 282.18 12 Karnataka - - - - 12,117 12,137 117.94 1,566.85 12,117 12,137 117.94 1,566.85 13 Kerala - - - - 10,927 10,933 75.06 790.52 10,927 10,933 75.06 790.52 14 Madhya Pradesh - - - - 9,829 9,834 40.17 738.05 9,829 9,834 40.17 738.05 15 Maharashtra 52,095 52,095 1.04 26.05 128,328 128,381 619.59 23,078.57 180,423 180,476 620.63 23,104.62 16 Manipur - - - - 653 653 1.88 31.50 653 653 1.88 31.50 17 Meghalaya - - - - 411 411 2.08 20.69 411 411 2.08 20.69 18 Mizoram - - - - 162 162 0.53 5.55 162 162 0.53 5.55 19 Nagaland - - - - 110 110 0.47 5.23 110 110 0.47 5.23 20 Orissa - - - - 5,616 5,622 28.04 352.51 5,616 5,622 28.04 352.51 21 Punjab - - - - 14,407 14,415 64.55 705.87 14,407 14,415 64.55 705.87 22 Rajasthan - - - - 9,860 9,862 42.77 929.01 9,860 9,862 42.77 929.01 23 Sikkim - - - - 359 359 1.79 18.06 359 359 1.79 18.06 24 Tamil Nadu - - - - 18,197 18,220 126.16 1,783.23 18,197 18,220 126.16 1,783.23 25 Telangana - - - - 8,163 8,168 54.53 946.34 8,163 8,168 54.53 946.34 26 Tripura - - - - 167 167 0.60 7.65 167 167 0.60 7.65 27 Uttar Pradesh - - - - 22,012 22,019 103.53 1,592.73 22,012 22,019 103.53 1,592.73 28 UttaraKhand - - - - 1,720 1,723 8.79 151.17 1,720 1,723 8.79 151.17 29 West Bengal - - - - 14,888 14,905 77.19 943.68 14,888 14,905 77.19 943.68 30 Andaman & Nicobar Islands - - - - - - - - - - - - 31 Chandigarh - - - - 4,235 4,234 19.82 284.26 4,235 4,234 19.82 284.26 32 Dadra & Nagar haveli - - - - - - - - - - - - 33 Daman & Diu - - - - - - - - - - - - 34 Delhi - - - - 25,072 25,084 153.55 2,293.09 25,072 25,084 153.55 2,293.09 35 Lakshadweep - - - - - - - - - - - - 36 Puducherry - - - - 220 221 1.24 19.69 220 221 1.24 19.69
TOTAL 52,095 52,095 1.04 26.05 340,665 340,866 1,805.87 40,537.19 392,760 392,961 1,806.91 40,563.24
Sr.No. State / Union Territory
Rural
( Individual)
Urban
(Individual )
Total Business
(Individual )
29
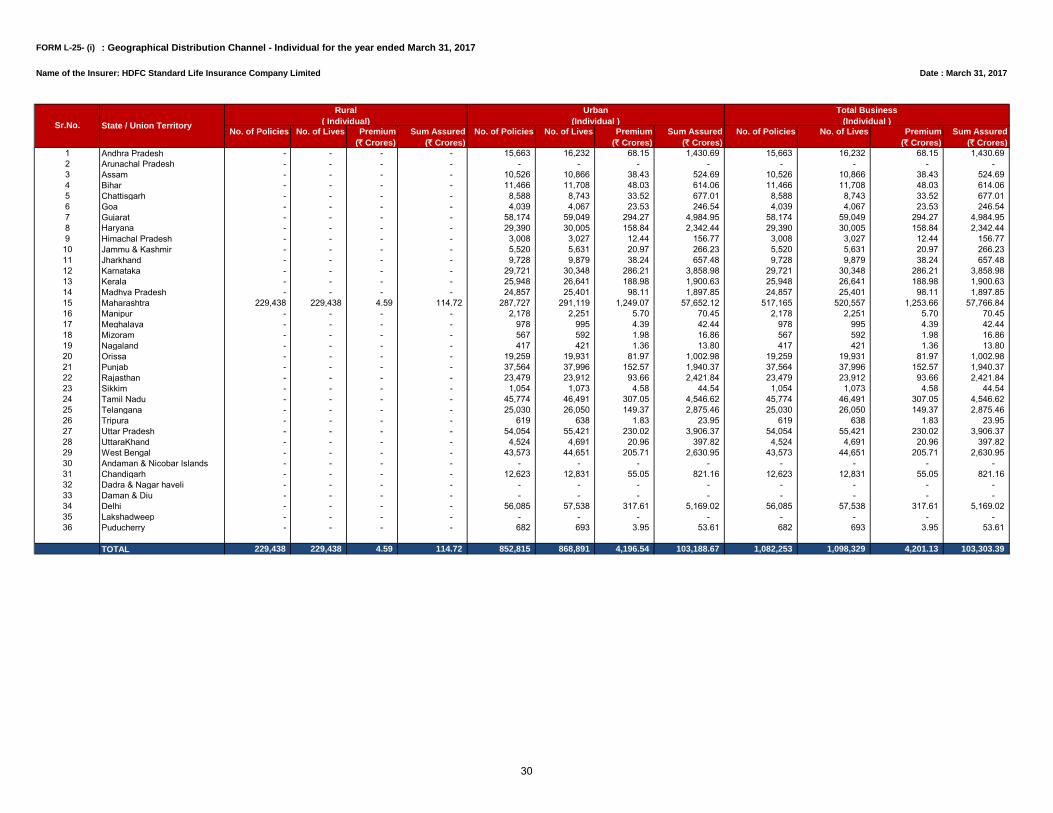
FORM L-25- (i) : Geographical Distribution Channel - Individual for the year ended March 31, 2017
Name of the Insurer: HDFC Standard Life Insurance Company Limited Date : March 31, 2017
No. of Policies No. of Lives Premium
(` Crores)
Sum Assured
(` Crores)
No. of Policies No. of Lives Premium
(` Crores)
Sum Assured
(` Crores)
No. of Policies No. of Lives Premium
(` Crores)
Sum Assured
(` Crores)
1 Andhra Pradesh - - - - 15,663 16,232 68.15 1,430.69 15,663 16,232 68.15 1,430.69 2 Arunachal Pradesh - - - - - - - - - - - - 3 Assam - - - - 10,526 10,866 38.43 524.69 10,526 10,866 38.43 524.69 4 Bihar - - - - 11,466 11,708 48.03 614.06 11,466 11,708 48.03 614.06 5 Chattisgarh - - - - 8,588 8,743 33.52 677.01 8,588 8,743 33.52 677.01 6 Goa - - - - 4,039 4,067 23.53 246.54 4,039 4,067 23.53 246.54 7 Gujarat - - - - 58,174 59,049 294.27 4,984.95 58,174 59,049 294.27 4,984.95 8 Haryana - - - - 29,390 30,005 158.84 2,342.44 29,390 30,005 158.84 2,342.44 9 Himachal Pradesh - - - - 3,008 3,027 12.44 156.77 3,008 3,027 12.44 156.77 10 Jammu & Kashmir - - - - 5,520 5,631 20.97 266.23 5,520 5,631 20.97 266.23 11 Jharkhand - - - - 9,728 9,879 38.24 657.48 9,728 9,879 38.24 657.48 12 Karnataka - - - - 29,721 30,348 286.21 3,858.98 29,721 30,348 286.21 3,858.98 13 Kerala - - - - 25,948 26,641 188.98 1,900.63 25,948 26,641 188.98 1,900.63 14 Madhya Pradesh - - - - 24,857 25,401 98.11 1,897.85 24,857 25,401 98.11 1,897.85 15 Maharashtra 229,438 229,438 4.59 114.72 287,727 291,119 1,249.07 57,652.12 517,165 520,557 1,253.66 57,766.84 16 Manipur - - - - 2,178 2,251 5.70 70.45 2,178 2,251 5.70 70.45 17 Meghalaya - - - - 978 995 4.39 42.44 978 995 4.39 42.44 18 Mizoram - - - - 567 592 1.98 16.86 567 592 1.98 16.86 19 Nagaland - - - - 417 421 1.36 13.80 417 421 1.36 13.80 20 Orissa - - - - 19,259 19,931 81.97 1,002.98 19,259 19,931 81.97 1,002.98 21 Punjab - - - - 37,564 37,996 152.57 1,940.37 37,564 37,996 152.57 1,940.37 22 Rajasthan - - - - 23,479 23,912 93.66 2,421.84 23,479 23,912 93.66 2,421.84 23 Sikkim - - - - 1,054 1,073 4.58 44.54 1,054 1,073 4.58 44.54 24 Tamil Nadu - - - - 45,774 46,491 307.05 4,546.62 45,774 46,491 307.05 4,546.62 25 Telangana - - - - 25,030 26,050 149.37 2,875.46 25,030 26,050 149.37 2,875.46 26 Tripura - - - - 619 638 1.83 23.95 619 638 1.83 23.95 27 Uttar Pradesh - - - - 54,054 55,421 230.02 3,906.37 54,054 55,421 230.02 3,906.37 28 UttaraKhand - - - - 4,524 4,691 20.96 397.82 4,524 4,691 20.96 397.82 29 West Bengal - - - - 43,573 44,651 205.71 2,630.95 43,573 44,651 205.71 2,630.95 30 Andaman & Nicobar Islands - - - - - - - - - - - - 31 Chandigarh - - - - 12,623 12,831 55.05 821.16 12,623 12,831 55.05 821.16 32 Dadra & Nagar haveli - - - - - - - - - - - - 33 Daman & Diu - - - - - - - - - - - - 34 Delhi - - - - 56,085 57,538 317.61 5,169.02 56,085 57,538 317.61 5,169.02 35 Lakshadweep - - - - - - - - - - - - 36 Puducherry - - - - 682 693 3.95 53.61 682 693 3.95 53.61
TOTAL 229,438 229,438 4.59 114.72 852,815 868,891 4,196.54 103,188.67 1,082,253 1,098,329 4,201.13 103,303.39
Sr.No. State / Union Territory
Rural
( Individual)
Urban
(Individual )
Total Business
(Individual )
30
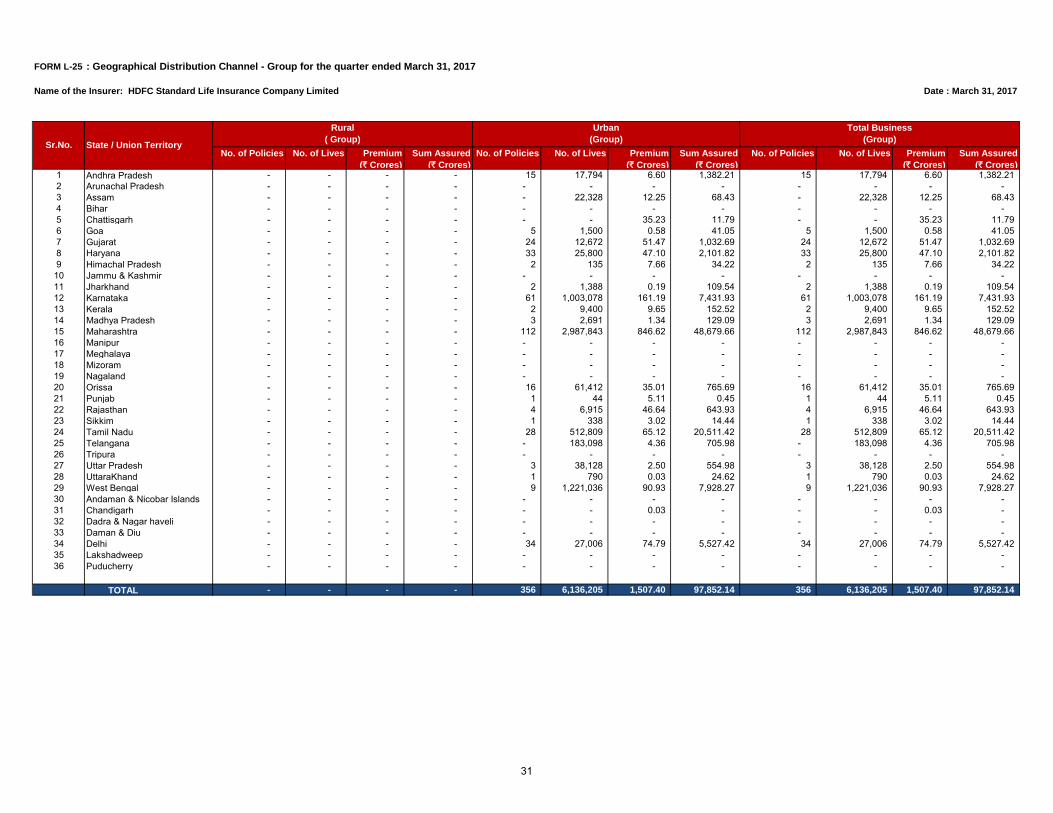
FORM L-25- (ii): Geographical Distribution Channel - Group for the quarter ended March 31, 2017
Name of the Insurer: HDFC Standard Life Insurance Company Limited Date : March 31, 2017
No. of Policies No. of Lives Premium
(` Crores)
Sum Assured
(` Crores)
No. of Policies No. of Lives Premium
(` Crores)
Sum Assured
(` Crores)
No. of Policies No. of Lives Premium
(` Crores)
Sum Assured
(` Crores)1 Andhra Pradesh - - - - 15 17,794 6.60 1,382.21 15 17,794 6.60 1,382.21 2 Arunachal Pradesh - - - - - - - - - - - - 3 Assam - - - - - 22,328 12.25 68.43 - 22,328 12.25 68.43 4 Bihar - - - - - - - - - - - - 5 Chattisgarh - - - - - - 35.23 11.79 - - 35.23 11.79 6 Goa - - - - 5 1,500 0.58 41.05 5 1,500 0.58 41.05 7 Gujarat - - - - 24 12,672 51.47 1,032.69 24 12,672 51.47 1,032.69 8 Haryana - - - - 33 25,800 47.10 2,101.82 33 25,800 47.10 2,101.82 9 Himachal Pradesh - - - - 2 135 7.66 34.22 2 135 7.66 34.22
10 Jammu & Kashmir - - - - - - - - - - - - 11 Jharkhand - - - - 2 1,388 0.19 109.54 2 1,388 0.19 109.54 12 Karnataka - - - - 61 1,003,078 161.19 7,431.93 61 1,003,078 161.19 7,431.93 13 Kerala - - - - 2 9,400 9.65 152.52 2 9,400 9.65 152.52 14 Madhya Pradesh - - - - 3 2,691 1.34 129.09 3 2,691 1.34 129.09 15 Maharashtra - - - - 112 2,987,843 846.62 48,679.66 112 2,987,843 846.62 48,679.66 16 Manipur - - - - - - - - - - - - 17 Meghalaya - - - - - - - - - - - - 18 Mizoram - - - - - - - - - - - - 19 Nagaland - - - - - - - - - - - - 20 Orissa - - - - 16 61,412 35.01 765.69 16 61,412 35.01 765.69 21 Punjab - - - - 1 44 5.11 0.45 1 44 5.11 0.45 22 Rajasthan - - - - 4 6,915 46.64 643.93 4 6,915 46.64 643.93 23 Sikkim - - - - 1 338 3.02 14.44 1 338 3.02 14.44 24 Tamil Nadu - - - - 28 512,809 65.12 20,511.42 28 512,809 65.12 20,511.42 25 Telangana - - - - - 183,098 4.36 705.98 - 183,098 4.36 705.98 26 Tripura - - - - - - - - - - - - 27 Uttar Pradesh - - - - 3 38,128 2.50 554.98 3 38,128 2.50 554.98 28 UttaraKhand - - - - 1 790 0.03 24.62 1 790 0.03 24.62 29 West Bengal - - - - 9 1,221,036 90.93 7,928.27 9 1,221,036 90.93 7,928.27 30 Andaman & Nicobar Islands - - - - - - - - - - - - 31 Chandigarh - - - - - - 0.03 - - - 0.03 - 32 Dadra & Nagar haveli - - - - - - - - - - - - 33 Daman & Diu - - - - - - - - - - - - 34 Delhi - - - - 34 27,006 74.79 5,527.42 34 27,006 74.79 5,527.42 35 Lakshadweep - - - - - - - - - - - - 36 Puducherry - - - - - - - - - - - -
TOTAL - - - - 356 6,136,205 1,507.40 97,852.14 356 6,136,205 1,507.40 97,852.14
Sr.No. State / Union Territory
Rural
( Group)
Urban
(Group)
Total Business
(Group)
31
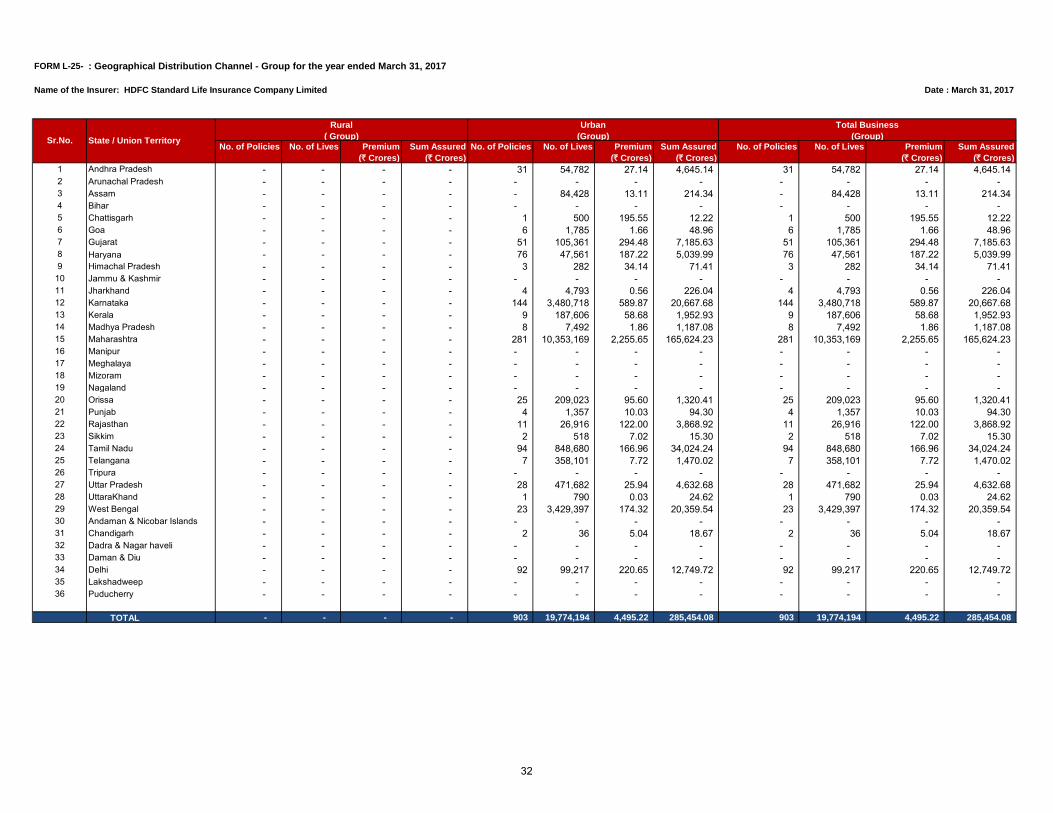
FORM L-25- (ii): Geographical Distribution Channel - Group for the year ended March 31, 2017
Name of the Insurer: HDFC Standard Life Insurance Company Limited Date : March 31, 2017
No. of Policies No. of Lives Premium
(` Crores)
Sum Assured
(` Crores)
No. of Policies No. of Lives Premium
(` Crores)
Sum Assured
(` Crores)
No. of Policies No. of Lives Premium
(` Crores)
Sum Assured
(` Crores)
1 Andhra Pradesh - - - - 31 54,782 27.14 4,645.14 31 54,782 27.14 4,645.14 2 Arunachal Pradesh - - - - - - - - - - - - 3 Assam - - - - - 84,428 13.11 214.34 - 84,428 13.11 214.34 4 Bihar - - - - - - - - - - - - 5 Chattisgarh - - - - 1 500 195.55 12.22 1 500 195.55 12.22 6 Goa - - - - 6 1,785 1.66 48.96 6 1,785 1.66 48.96 7 Gujarat - - - - 51 105,361 294.48 7,185.63 51 105,361 294.48 7,185.63 8 Haryana - - - - 76 47,561 187.22 5,039.99 76 47,561 187.22 5,039.99 9 Himachal Pradesh - - - - 3 282 34.14 71.41 3 282 34.14 71.41
10 Jammu & Kashmir - - - - - - - - - - - - 11 Jharkhand - - - - 4 4,793 0.56 226.04 4 4,793 0.56 226.04 12 Karnataka - - - - 144 3,480,718 589.87 20,667.68 144 3,480,718 589.87 20,667.68 13 Kerala - - - - 9 187,606 58.68 1,952.93 9 187,606 58.68 1,952.93 14 Madhya Pradesh - - - - 8 7,492 1.86 1,187.08 8 7,492 1.86 1,187.08 15 Maharashtra - - - - 281 10,353,169 2,255.65 165,624.23 281 10,353,169 2,255.65 165,624.23 16 Manipur - - - - - - - - - - - - 17 Meghalaya - - - - - - - - - - - - 18 Mizoram - - - - - - - - - - - - 19 Nagaland - - - - - - - - - - - - 20 Orissa - - - - 25 209,023 95.60 1,320.41 25 209,023 95.60 1,320.41 21 Punjab - - - - 4 1,357 10.03 94.30 4 1,357 10.03 94.30 22 Rajasthan - - - - 11 26,916 122.00 3,868.92 11 26,916 122.00 3,868.92 23 Sikkim - - - - 2 518 7.02 15.30 2 518 7.02 15.30 24 Tamil Nadu - - - - 94 848,680 166.96 34,024.24 94 848,680 166.96 34,024.24 25 Telangana - - - - 7 358,101 7.72 1,470.02 7 358,101 7.72 1,470.02 26 Tripura - - - - - - - - - - - - 27 Uttar Pradesh - - - - 28 471,682 25.94 4,632.68 28 471,682 25.94 4,632.68 28 UttaraKhand - - - - 1 790 0.03 24.62 1 790 0.03 24.62 29 West Bengal - - - - 23 3,429,397 174.32 20,359.54 23 3,429,397 174.32 20,359.54 30 Andaman & Nicobar Islands - - - - - - - - - - - - 31 Chandigarh - - - - 2 36 5.04 18.67 2 36 5.04 18.67 32 Dadra & Nagar haveli - - - - - - - - - - - - 33 Daman & Diu - - - - - - - - - - - - 34 Delhi - - - - 92 99,217 220.65 12,749.72 92 99,217 220.65 12,749.72 35 Lakshadweep - - - - - - - - - - - - 36 Puducherry - - - - - - - - - - - -
TOTAL - - - - 903 19,774,194 4,495.22 285,454.08 903 19,774,194 4,495.22 285,454.08
Sr.No. State / Union Territory
Rural
( Group)
Urban
(Group)
Total Business
(Group)
32
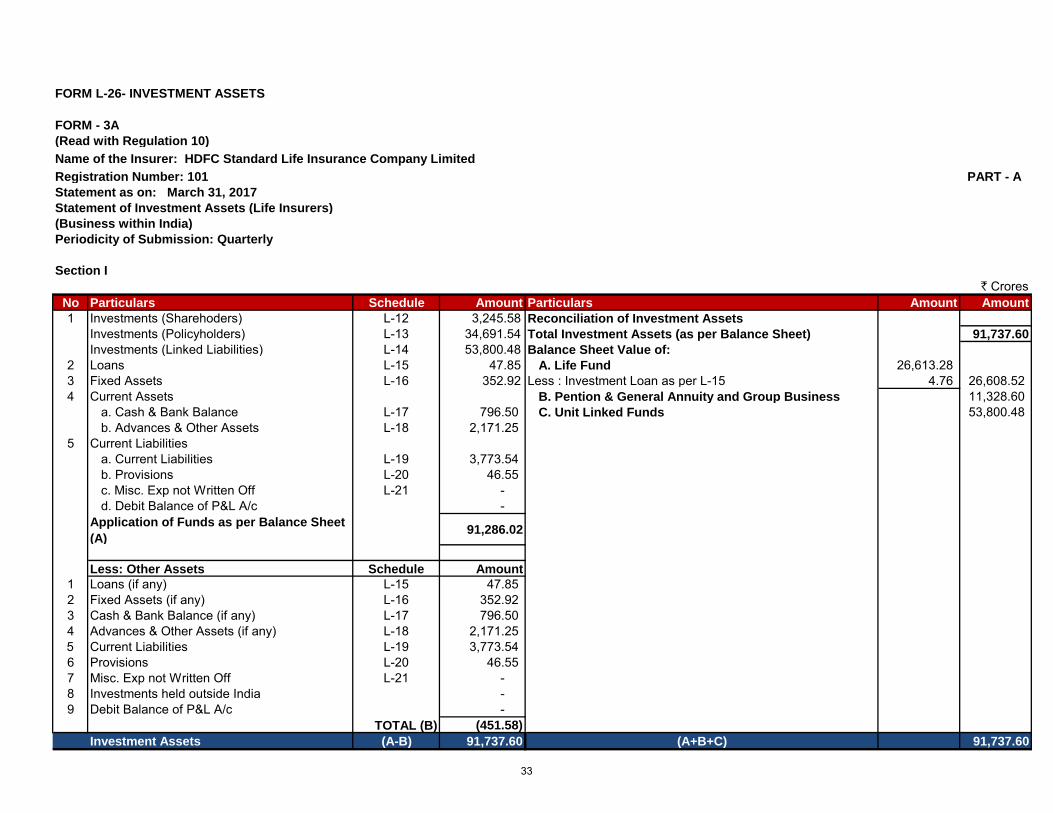
FORM L-26- INVESTMENT ASSETS
FORM - 3A
(Read with Regulation 10)
Name of the Insurer: HDFC Standard Life Insurance Company Limited
Registration Number: 101 PART - A
Statement as on: March 31, 2017
Statement of Investment Assets (Life Insurers)
(Business within India)
Periodicity of Submission: Quarterly
Section I
` CroresNo Particulars Schedule Amount Particulars Amount Amount
1 Investments (Sharehoders) L-12 3,245.58 Reconciliation of Investment Assets
Investments (Policyholders) L-13 34,691.54 Total Investment Assets (as per Balance Sheet) 91,737.60
Investments (Linked Liabilities) L-14 53,800.48 Balance Sheet Value of:
2 Loans L-15 47.85 A. Life Fund 26,613.28 3 Fixed Assets L-16 352.92 Less : Investment Loan as per L-15 4.76 26,608.52 4 Current Assets B. Pention & General Annuity and Group Business 11,328.60
a. Cash & Bank Balance L-17 796.50 C. Unit Linked Funds 53,800.48 b. Advances & Other Assets L-18 2,171.25
5 Current Liabilitiesa. Current Liabilities L-19 3,773.54 b. Provisions L-20 46.55 c. Misc. Exp not Written Off L-21 - d. Debit Balance of P&L A/c -
Application of Funds as per Balance Sheet
(A)91,286.02
Less: Other Assets Schedule Amount
1 Loans (if any) L-15 47.85 2 Fixed Assets (if any) L-16 352.92 3 Cash & Bank Balance (if any) L-17 796.50 4 Advances & Other Assets (if any) L-18 2,171.25 5 Current Liabilities L-19 3,773.54 6 Provisions L-20 46.55 7 Misc. Exp not Written Off L-21 - 8 Investments held outside India - 9 Debit Balance of P&L A/c -
TOTAL (B) (451.58)
Investment Assets (A-B) 91,737.60 91,737.60(A+B+C)
33
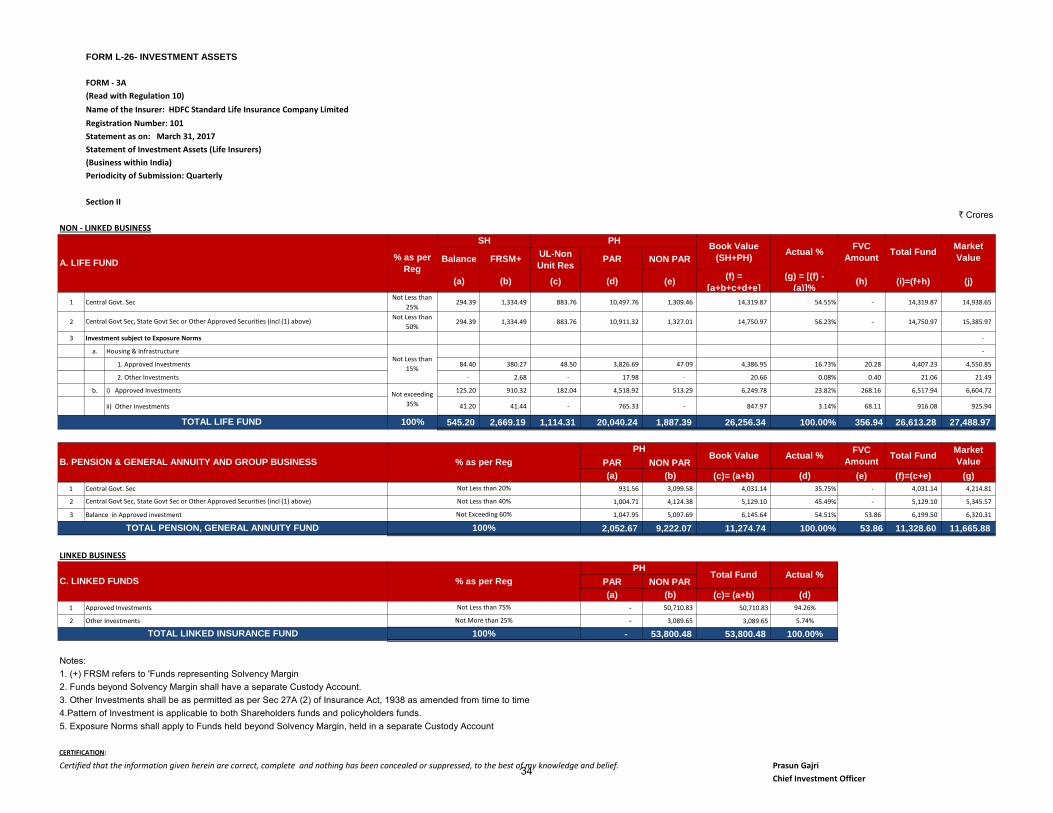
FORM L-26- INVESTMENT ASSETS
FORM - 3A
(Read with Regulation 10)
Name of the Insurer: HDFC Standard Life Insurance Company Limited
Registration Number: 101
Statement as on: March 31, 2017
Statement of Investment Assets (Life Insurers)
(Business within India)
Periodicity of Submission: Quarterly
Section II
` CroresNON - LINKED BUSINESS
Balance FRSM+UL-Non
Unit ResPAR NON PAR
(a) (b) (c) (d) (e)(f) =
[a+b+c+d+e]
(g) = [(f) -
(a)]%(h) (i)=(f+h) (j)
1 Central Govt. SecNot Less than
25%294.39 1,334.49 883.76 10,497.76 1,309.46 14,319.87 54.55% - 14,319.87 14,938.65
2Not Less than
50%294.39 1,334.49 883.76 10,911.32 1,327.01 14,750.97 56.23% - 14,750.97 15,385.97
3 Investment subject to Exposure Norms -
a. Housing & Infrastructure -
1. Approved Investments 84.40 380.27 48.50 3,826.69 47.09 4,386.95 16.73% 20.28 4,407.23 4,550.85
2. Other Investments - 2.68 - 17.98 - 20.66 0.08% 0.40 21.06 21.49
b. i) Approved Investments 125.20 910.32 182.04 4,518.92 513.29 6,249.78 23.82% 268.16 6,517.94 6,604.72
ii) Other Investments 41.20 41.44 - 765.33 - 847.97 3.14% 68.11 916.08 925.94
100% 545.20 2,669.19 1,114.31 20,040.24 1,887.39 26,256.34 100.00% 356.94 26,613.28 27,488.97
PAR NON PAR
(a) (b) (c)= (a+b) (d) (e) (f)=(c+e) (g)
1 Central Govt. Sec 931.56 3,099.58 4,031.14 35.75% - 4,031.14 4,214.81
2 1,004.71 4,124.38 5,129.10 45.49% - 5,129.10 5,345.57
3 Balance in Approved investment 1,047.95 5,097.69 6,145.64 54.51% 53.86 6,199.50 6,320.31
2,052.67 9,222.07 11,274.74 100.00% 53.86 11,328.60 11,665.88
LINKED BUSINESS
PAR NON PAR
(a) (b) (c)= (a+b) (d)
1 Approved Investments - 50,710.83 50,710.83 94.26%
2 Other Investments - 3,089.65 3,089.65 5.74%
- 53,800.48 53,800.48 100.00%
Notes:1. (+) FRSM refers to 'Funds representing Solvency Margin2. Funds beyond Solvency Margin shall have a separate Custody Account.3. Other Investments shall be as permitted as per Sec 27A (2) of Insurance Act, 1938 as amended from time to time4.Pattern of Investment is applicable to both Shareholders funds and policyholders funds. 5. Exposure Norms shall apply to Funds held beyond Solvency Margin, held in a separate Custody Account
CERTIFICATION:
Certified that the information given herein are correct, complete and nothing has been concealed or suppressed, to the best of my knowledge and belief. Prasun Gajri
Chief Investment Officer
A. LIFE FUND% as per
Reg
SH PHBook Value
(SH+PH)Actual %
FVC
AmountTotal Fund
Market
Value
Central Govt Sec, State Govt Sec or Other Approved Securities (incl (1) above)
Not Less than
15%
Not exceeding
35%
TOTAL LIFE FUND
Market
Value
Not Less than 20%
Central Govt Sec, State Govt Sec or Other Approved Securities (incl (1) above) Not Less than 40%
B. PENSION & GENERAL ANNUITY AND GROUP BUSINESS % as per Reg
PHBook Value Actual %
100%
% as per Reg
TOTAL LINKED INSURANCE FUND
FVC
AmountTotal Fund
Actual %
Not Less than 75%
Not Exceeding 60%
100%
PHTotal Fund
TOTAL PENSION, GENERAL ANNUITY FUND
C. LINKED FUNDS
Not More than 25%
34
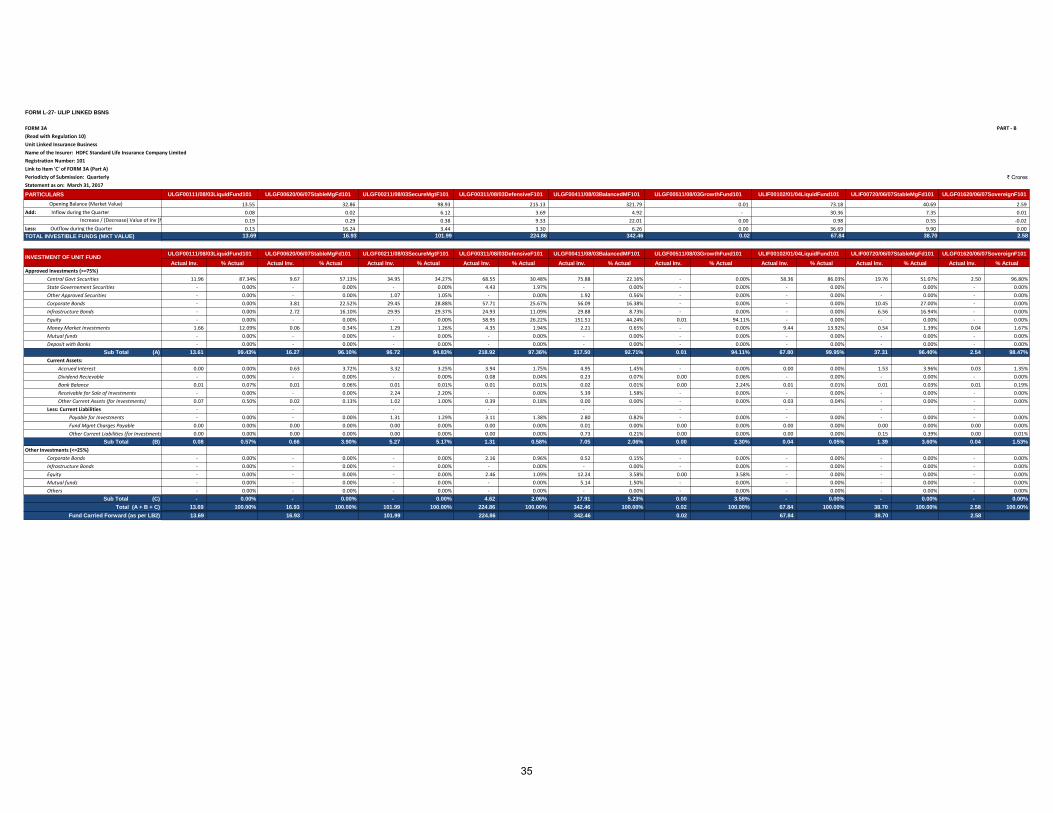
FORM L-27- ULIP LINKED BSNS
FORM 3A PART - B
(Read with Regulation 10)
Unit Linked Insurance Business
Name of the Insurer: HDFC Standard Life Insurance Company Limited
Registration Number: 101
Link to Item 'C' of FORM 3A (Part A)
Periodicty of Submission: Quarterly ` CroresStatement as on: March 31, 2017
PARTICULARS
Opening Balance (Market Value)
Add: Inflow during the Quarter
Increase / (Decrease) Value of Inv [Net]
Less: Outflow during the Quarter
TOTAL INVESTIBLE FUNDS (MKT VALUE)
Actual Inv. % Actual Actual Inv. % Actual Actual Inv. % Actual Actual Inv. % Actual Actual Inv. % Actual Actual Inv. % Actual Actual Inv. % Actual Actual Inv. % Actual Actual Inv. % Actual
Approved Investments (>=75%)
Central Govt Securities 11.96 87.34% 9.67 57.13% 34.95 34.27% 68.55 30.48% 75.88 22.16% - 0.00% 58.36 86.03% 19.76 51.07% 2.50 96.80%
State Governement Securities - 0.00% - 0.00% - 0.00% 4.43 1.97% - 0.00% - 0.00% - 0.00% - 0.00% - 0.00%
Other Approved Securities - 0.00% - 0.00% 1.07 1.05% - 0.00% 1.92 0.56% - 0.00% - 0.00% - 0.00% - 0.00%
Corporate Bonds - 0.00% 3.81 22.52% 29.45 28.88% 57.71 25.67% 56.09 16.38% - 0.00% - 0.00% 10.45 27.00% - 0.00%
Infrastructure Bonds - 0.00% 2.72 16.10% 29.95 29.37% 24.93 11.09% 29.88 8.73% - 0.00% - 0.00% 6.56 16.94% - 0.00%
Equity - 0.00% - 0.00% - 0.00% 58.95 26.22% 151.51 44.24% 0.01 94.11% - 0.00% - 0.00% - 0.00%
Money Market Investments 1.66 12.09% 0.06 0.34% 1.29 1.26% 4.35 1.94% 2.21 0.65% - 0.00% 9.44 13.92% 0.54 1.39% 0.04 1.67%
Mutual funds - 0.00% - 0.00% - 0.00% - 0.00% - 0.00% - 0.00% - 0.00% - 0.00% - 0.00%
Deposit with Banks - 0.00% - 0.00% - 0.00% - 0.00% - 0.00% - 0.00% - 0.00% - 0.00% - 0.00%
Sub Total (A) 13.61 99.43% 16.27 96.10% 96.72 94.83% 218.92 97.36% 317.50 92.71% 0.01 94.11% 67.80 99.95% 37.31 96.40% 2.54 98.47%
Current Assets:
Accrued Interest 0.00 0.00% 0.63 3.72% 3.32 3.25% 3.94 1.75% 4.95 1.45% - 0.00% 0.00 0.00% 1.53 3.96% 0.03 1.35%
Dividend Recievable - 0.00% - 0.00% - 0.00% 0.08 0.04% 0.23 0.07% 0.00 0.06% - 0.00% - 0.00% - 0.00%
Bank Balance 0.01 0.07% 0.01 0.06% 0.01 0.01% 0.01 0.01% 0.02 0.01% 0.00 2.24% 0.01 0.01% 0.01 0.03% 0.01 0.19%
Receivable for Sale of Investments - 0.00% - 0.00% 2.24 2.20% - 0.00% 5.39 1.58% - 0.00% - 0.00% - 0.00% - 0.00%
Other Current Assets (for Investments) 0.07 0.50% 0.02 0.13% 1.02 1.00% 0.39 0.18% 0.00 0.00% - 0.00% 0.03 0.04% - 0.00% - 0.00%
Less: Current Liabilities - - - - - - - - -
Payable for Investments - 0.00% - 0.00% 1.31 1.29% 3.11 1.38% 2.80 0.82% - 0.00% - 0.00% - 0.00% - 0.00%
Fund Mgmt Charges Payable 0.00 0.00% 0.00 0.00% 0.00 0.00% 0.00 0.00% 0.01 0.00% 0.00 0.00% 0.00 0.00% 0.00 0.00% 0.00 0.00%
Other Current Liabilities (for Investments) 0.00 0.00% 0.00 0.00% 0.00 0.00% 0.00 0.00% 0.73 0.21% 0.00 0.00% 0.00 0.00% 0.15 0.39% 0.00 0.01%
Sub Total (B) 0.08 0.57% 0.66 3.90% 5.27 5.17% 1.31 0.58% 7.05 2.06% 0.00 2.30% 0.04 0.05% 1.39 3.60% 0.04 1.53%
Other Investments (<=25%)
Corporate Bonds - 0.00% - 0.00% - 0.00% 2.16 0.96% 0.52 0.15% - 0.00% - 0.00% - 0.00% - 0.00%
Infrastructure Bonds - 0.00% - 0.00% - 0.00% - 0.00% - 0.00% - 0.00% - 0.00% - 0.00% - 0.00%
Equity - 0.00% - 0.00% - 0.00% 2.46 1.09% 12.24 3.58% 0.00 3.58% - 0.00% - 0.00% - 0.00%
Mutual funds - 0.00% - 0.00% - 0.00% - 0.00% 5.14 1.50% - 0.00% - 0.00% - 0.00% - 0.00%
Others - 0.00% - 0.00% - 0.00% - 0.00% - 0.00% - 0.00% - 0.00% - 0.00% - 0.00%
Sub Total (C) - 0.00% - 0.00% - 0.00% 4.62 2.06% 17.91 5.23% 0.00 3.58% - 0.00% - 0.00% - 0.00%
Total (A + B + C) 13.69 100.00% 16.93 100.00% 101.99 100.00% 224.86 100.00% 342.46 100.00% 0.02 100.00% 67.84 100.00% 38.70 100.00% 2.58 100.00%
Fund Carried Forward (as per LB2) 13.69 16.93 101.99 224.86 342.46 0.02 67.84 38.70 2.58
ULIF00102/01/04LiquidFund101 ULIF00720/06/07StableMgFd101 ULGF01620/06/07SovereignF101
13.55 32.86 98.93 215.13 321.79 0.01 73.18
ULGF00111/08/03LiquidFund101 ULGF00620/06/07StableMgFd101 ULGF00211/08/03SecureMgtF101 ULGF00311/08/03DefensiveF101 ULGF00411/08/03BalancedMF101 ULGF00511/08/03GrowthFund101
40.69 2.59
0.08 0.02 6.12 3.69 4.92 - 30.36 7.35 0.01
0.19 0.29 0.38 9.33 22.01 0.55 -0.02
36.69 9.90 0.00 101.99 224.86 342.46
0.00 0.98
0.00 0.13 16.24 3.44 3.30 6.26
ULIF00720/06/07StableMgFd101 ULGF01620/06/07SovereignF101
38.70 2.58
INVESTMENT OF UNIT FUNDULGF00111/08/03LiquidFund101 ULGF00620/06/07StableMgFd101 ULGF00211/08/03SecureMgtF101 ULGF00311/08/03DefensiveF101 ULGF00411/08/03BalancedMF101 ULGF00511/08/03GrowthFund101 ULIF00102/01/04LiquidFund101
0.02 67.8413.69 16.93
35
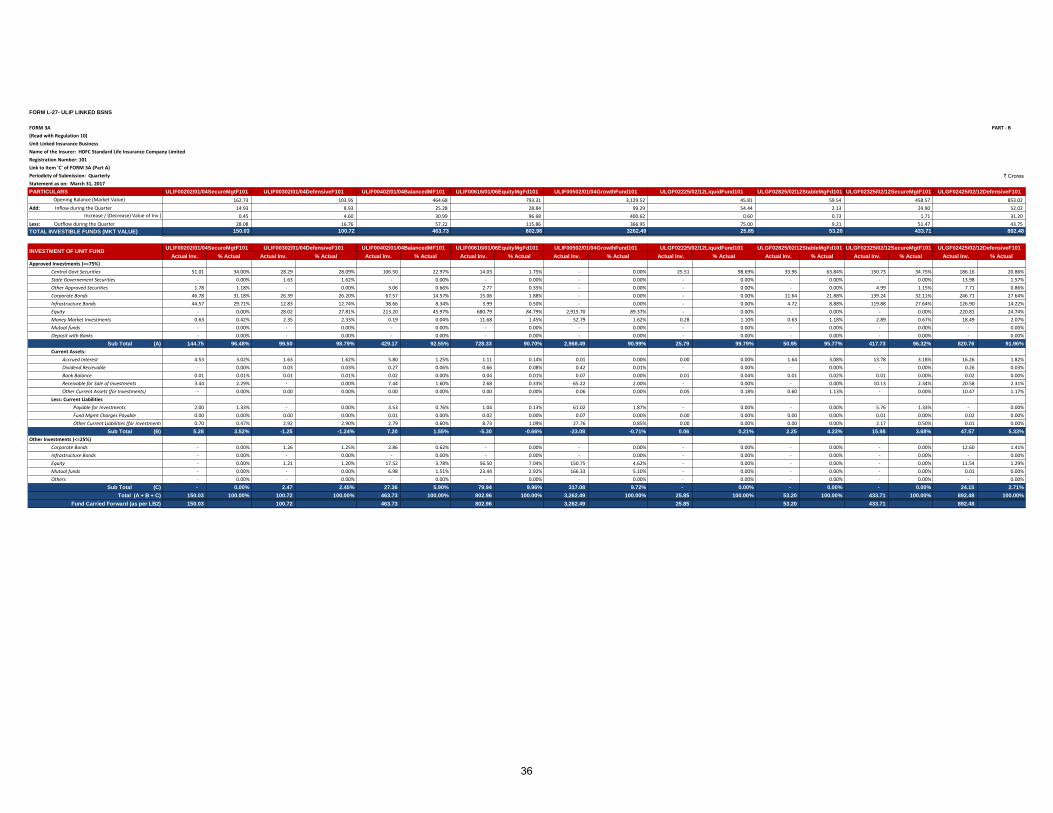
FORM L-27- ULIP LINKED BSNS
FORM 3A PART - B
(Read with Regulation 10)
Unit Linked Insurance Business
Name of the Insurer: HDFC Standard Life Insurance Company Limited
Registration Number: 101
Link to Item 'C' of FORM 3A (Part A)
Periodicty of Submission: Quarterly ` CroresStatement as on: March 31, 2017
PARTICULARS
Opening Balance (Market Value)
Add: Inflow during the Quarter
Increase / (Decrease) Value of Inv [Net]
Less: Outflow during the Quarter
TOTAL INVESTIBLE FUNDS (MKT VALUE)
Actual Inv. % Actual Actual Inv. % Actual Actual Inv. % Actual Actual Inv. % Actual Actual Inv. % Actual Actual Inv. % Actual Actual Inv. % Actual Actual Inv. % Actual Actual Inv. % Actual
Approved Investments (>=75%)
Central Govt Securities 51.01 34.00% 28.29 28.09% 106.50 22.97% 14.03 1.75% - 0.00% 25.51 98.69% 33.96 63.84% 150.73 34.75% 186.16 20.86%
State Governement Securities - 0.00% 1.63 1.62% - 0.00% - 0.00% - 0.00% - 0.00% - 0.00% - 0.00% 13.98 1.57%
Other Approved Securities 1.78 1.18% - 0.00% 3.06 0.66% 2.77 0.35% - 0.00% - 0.00% - 0.00% 4.99 1.15% 7.71 0.86%
Corporate Bonds 46.78 31.18% 26.39 26.20% 67.57 14.57% 15.06 1.88% - 0.00% - 0.00% 11.64 21.88% 139.24 32.11% 246.71 27.64%
Infrastructure Bonds 44.57 29.71% 12.83 12.74% 38.66 8.34% 3.99 0.50% - 0.00% - 0.00% 4.72 8.88% 119.88 27.64% 126.90 14.22%
Equity - 0.00% 28.02 27.81% 213.20 45.97% 680.79 84.79% 2,915.70 89.37% - 0.00% - 0.00% - 0.00% 220.81 24.74%
Money Market Investments 0.63 0.42% 2.35 2.33% 0.19 0.04% 11.68 1.45% 52.79 1.62% 0.28 1.10% 0.63 1.18% 2.89 0.67% 18.49 2.07%
Mutual funds - 0.00% - 0.00% - 0.00% - 0.00% - 0.00% - 0.00% - 0.00% - 0.00% - 0.00%
Deposit with Banks - 0.00% - 0.00% - 0.00% - 0.00% - 0.00% - 0.00% - 0.00% - 0.00% - 0.00%
Sub Total (A) 144.75 96.48% 99.50 98.79% 429.17 92.55% 728.33 90.70% 2,968.49 90.99% 25.79 99.79% 50.95 95.77% 417.73 96.32% 820.76 91.96%
Current Assets:
Accrued Interest 4.53 3.02% 1.63 1.62% 5.80 1.25% 1.11 0.14% 0.01 0.00% 0.00 0.00% 1.64 3.08% 13.78 3.18% 16.26 1.82%
Dividend Recievable - 0.00% 0.03 0.03% 0.27 0.06% 0.66 0.08% 0.42 0.01% - 0.00% - 0.00% - 0.00% 0.26 0.03%
Bank Balance 0.01 0.01% 0.01 0.01% 0.02 0.00% 0.04 0.01% 0.07 0.00% 0.01 0.04% 0.01 0.02% 0.01 0.00% 0.02 0.00%
Receivable for Sale of Investments 3.44 2.29% - 0.00% 7.44 1.60% 2.68 0.33% 65.22 2.00% - 0.00% - 0.00% 10.13 2.34% 20.58 2.31%
Other Current Assets (for Investments) - 0.00% 0.00 0.00% 0.00 0.00% 0.00 0.00% 0.06 0.00% 0.05 0.18% 0.60 1.13% - 0.00% 10.47 1.17%
Less: Current Liabilities
Payable for Investments 2.00 1.33% - 0.00% 3.53 0.76% 1.04 0.13% 61.02 1.87% - 0.00% - 0.00% 5.76 1.33% - 0.00%
Fund Mgmt Charges Payable 0.00 0.00% 0.00 0.00% 0.01 0.00% 0.02 0.00% 0.07 0.00% 0.00 0.00% 0.00 0.00% 0.01 0.00% 0.02 0.00%
Other Current Liabilities (for Investments) 0.70 0.47% 2.92 2.90% 2.79 0.60% 8.73 1.09% 27.76 0.85% 0.00 0.00% 0.00 0.00% 2.17 0.50% 0.01 0.00%
Sub Total (B) 5.28 3.52% -1.25 -1.24% 7.20 1.55% -5.30 -0.66% -23.08 -0.71% 0.06 0.21% 2.25 4.23% 15.98 3.68% 47.57 5.33%
Other Investments (<=25%)
Corporate Bonds - 0.00% 1.26 1.25% 2.86 0.62% - 0.00% - 0.00% - 0.00% - 0.00% - 0.00% 12.60 1.41%
Infrastructure Bonds - 0.00% - 0.00% - 0.00% - 0.00% - 0.00% - 0.00% - 0.00% - 0.00% - 0.00%
Equity - 0.00% 1.21 1.20% 17.52 3.78% 56.50 7.04% 150.75 4.62% - 0.00% - 0.00% - 0.00% 11.54 1.29%
Mutual funds - 0.00% - 0.00% 6.98 1.51% 23.44 2.92% 166.33 5.10% - 0.00% - 0.00% - 0.00% 0.01 0.00%
Others - 0.00% - 0.00% - 0.00% - 0.00% - 0.00% - 0.00% - 0.00% - 0.00% - 0.00%
Sub Total (C) - 0.00% 2.47 2.45% 27.36 5.90% 79.94 9.96% 317.08 9.72% - 0.00% - 0.00% - 0.00% 24.15 2.71%
Total (A + B + C) 150.03 100.00% 100.72 100.00% 463.73 100.00% 802.96 100.00% 3,262.49 100.00% 25.85 100.00% 53.20 100.00% 433.71 100.00% 892.48 100.00%
Fund Carried Forward (as per LB2) 150.03 100.72 463.73 802.96 3,262.49 25.85 53.20 433.71 892.48
ULGF02825/02/12StableMgFd101 ULGF02325/02/12SecureMgtF101 ULGF02425/02/12DefensiveF101
162.73 103.95 464.68 793.31 3,129.52 45.81 59.54
ULIF00202/01/04SecureMgtF101 ULIF00302/01/04DefensiveF101 ULIF00402/01/04BalancedMF101 ULIF00616/01/06EquityMgFd101 ULIF00502/01/04GrowthFund101 ULGF02225/02/12LiquidFund101
458.57 853.02
14.93 8.93 25.28 28.84 99.29 54.44 2.13 24.90 52.02
0.45 4.60 30.99 96.68 400.62 1.71 31.20
9.21 51.47 43.75
463.73 802.96 3262.49
0.60 0.73
75.00 28.08 16.76 57.22 115.86 366.95
ULGF02325/02/12SecureMgtF101 ULGF02425/02/12DefensiveF101
433.71 892.48
INVESTMENT OF UNIT FUNDULIF00202/01/04SecureMgtF101 ULIF00302/01/04DefensiveF101 ULIF00402/01/04BalancedMF101 ULIF00616/01/06EquityMgFd101 ULIF00502/01/04GrowthFund101 ULGF02225/02/12LiquidFund101 ULGF02825/02/12StableMgFd101
25.85 53.20150.03 100.72
36
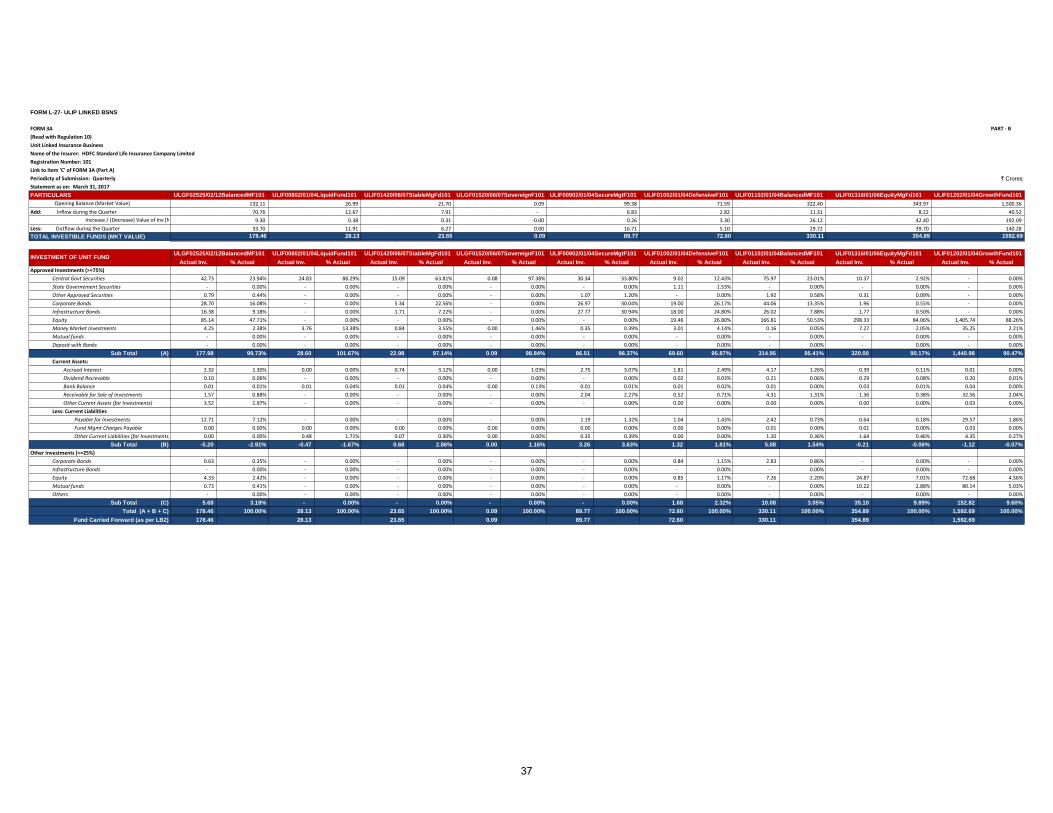
FORM L-27- ULIP LINKED BSNS
FORM 3A PART - B
(Read with Regulation 10)
Unit Linked Insurance Business
Name of the Insurer: HDFC Standard Life Insurance Company Limited
Registration Number: 101
Link to Item 'C' of FORM 3A (Part A)
Periodicty of Submission: Quarterly ` CroresStatement as on: March 31, 2017
PARTICULARS
Opening Balance (Market Value)
Add: Inflow during the Quarter
Increase / (Decrease) Value of Inv [Net]
Less: Outflow during the Quarter
TOTAL INVESTIBLE FUNDS (MKT VALUE)
Actual Inv. % Actual Actual Inv. % Actual Actual Inv. % Actual Actual Inv. % Actual Actual Inv. % Actual Actual Inv. % Actual Actual Inv. % Actual Actual Inv. % Actual Actual Inv. % Actual
Approved Investments (>=75%)
Central Govt Securities 42.73 23.94% 24.83 88.29% 15.09 63.81% 0.08 97.38% 30.34 33.80% 9.02 12.43% 75.97 23.01% 10.37 2.92% - 0.00%
State Governement Securities - 0.00% - 0.00% - 0.00% - 0.00% - 0.00% 1.11 1.53% - 0.00% - 0.00% - 0.00%
Other Approved Securities 0.79 0.44% - 0.00% - 0.00% - 0.00% 1.07 1.20% - 0.00% 1.92 0.58% 0.31 0.09% - 0.00%
Corporate Bonds 28.70 16.08% - 0.00% 5.34 22.56% - 0.00% 26.97 30.04% 19.00 26.17% 44.06 13.35% 1.96 0.55% - 0.00%
Infrastructure Bonds 16.38 9.18% - 0.00% 1.71 7.22% - 0.00% 27.77 30.94% 18.00 24.80% 26.02 7.88% 1.77 0.50% - 0.00%
Equity 85.14 47.71% - 0.00% - 0.00% - 0.00% - 0.00% 19.46 26.80% 166.81 50.53% 298.33 84.06% 1,405.74 88.26%
Money Market Investments 4.25 2.38% 3.76 13.38% 0.84 3.55% 0.00 1.46% 0.35 0.39% 3.01 4.14% 0.16 0.05% 7.27 2.05% 35.25 2.21%
Mutual funds - 0.00% - 0.00% - 0.00% - 0.00% - 0.00% - 0.00% - 0.00% - 0.00% - 0.00%
Deposit with Banks - 0.00% - 0.00% - 0.00% - 0.00% - 0.00% - 0.00% - 0.00% - 0.00% - 0.00%
Sub Total (A) 177.98 99.73% 28.60 101.67% 22.98 97.14% 0.09 98.84% 86.51 96.37% 69.60 95.87% 314.95 95.41% 320.00 90.17% 1,440.98 90.47%
Current Assets:
Accrued Interest 2.32 1.30% 0.00 0.00% 0.74 3.12% 0.00 1.03% 2.75 3.07% 1.81 2.49% 4.17 1.26% 0.39 0.11% 0.01 0.00%
Dividend Recievable 0.10 0.06% - 0.00% - 0.00% - 0.00% - 0.00% 0.02 0.03% 0.21 0.06% 0.29 0.08% 0.20 0.01%
Bank Balance 0.01 0.01% 0.01 0.04% 0.01 0.04% 0.00 0.13% 0.01 0.01% 0.01 0.02% 0.01 0.00% 0.03 0.01% 0.04 0.00%
Receivable for Sale of Investments 1.57 0.88% - 0.00% - 0.00% - 0.00% 2.04 2.27% 0.52 0.71% 4.31 1.31% 1.36 0.38% 32.56 2.04%
Other Current Assets (for Investments) 3.52 1.97% - 0.00% - 0.00% - 0.00% - 0.00% 0.00 0.00% 0.00 0.00% 0.00 0.00% 0.03 0.00%
Less: Current Liabilities
Payable for Investments 12.71 7.12% - 0.00% - 0.00% - 0.00% 1.19 1.32% 1.04 1.43% 2.42 0.73% 0.64 0.18% 29.57 1.86%
Fund Mgmt Charges Payable 0.00 0.00% 0.00 0.00% 0.00 0.00% 0.00 0.00% 0.00 0.00% 0.00 0.00% 0.01 0.00% 0.01 0.00% 0.03 0.00%
Other Current Liabilities (for Investments) 0.00 0.00% 0.48 1.71% 0.07 0.30% 0.00 0.00% 0.35 0.39% 0.00 0.00% 1.20 0.36% 1.64 0.46% 4.35 0.27%
Sub Total (B) -5.20 -2.91% -0.47 -1.67% 0.68 2.86% 0.00 1.16% 3.26 3.63% 1.32 1.81% 5.08 1.54% -0.21 -0.06% -1.12 -0.07%
Other Investments (<=25%)
Corporate Bonds 0.63 0.35% - 0.00% - 0.00% - 0.00% - 0.00% 0.84 1.15% 2.83 0.86% - 0.00% - 0.00%
Infrastructure Bonds - 0.00% - 0.00% - 0.00% - 0.00% - 0.00% - 0.00% - 0.00% - 0.00% - 0.00%
Equity 4.33 2.42% - 0.00% - 0.00% - 0.00% - 0.00% 0.85 1.17% 7.26 2.20% 24.87 7.01% 72.68 4.56%
Mutual funds 0.73 0.41% - 0.00% - 0.00% - 0.00% - 0.00% - 0.00% - 0.00% 10.22 2.88% 80.14 5.03%
Others - 0.00% - 0.00% - 0.00% - 0.00% - 0.00% - 0.00% - 0.00% - 0.00% - 0.00%
Sub Total (C) 5.68 3.18% - 0.00% - 0.00% - 0.00% - 0.00% 1.68 2.32% 10.08 3.05% 35.10 9.89% 152.82 9.60%
Total (A + B + C) 178.46 100.00% 28.13 100.00% 23.65 100.00% 0.09 100.00% 89.77 100.00% 72.60 100.00% 330.11 100.00% 354.89 100.00% 1,592.69 100.00%
Fund Carried Forward (as per LB2) 178.46 28.13 23.65 0.09 89.77 72.60 330.11 354.89 1,592.69
ULIF01102/01/04BalancedMF101 ULIF01316/01/06EquityMgFd101 ULIF01202/01/04GrowthFund101
132.11 26.99 21.70 0.09 99.38 71.59 322.40
ULGF02525/02/12BalancedMF101 ULIF00802/01/04LiquidFund101 ULIF01420/06/07StableMgFd101 ULGF01520/06/07SovereignF101 ULIF00902/01/04SecureMgtF101 ULIF01002/01/04DefensiveF101
343.97 1,500.36
70.76 12.67 7.91 - 6.83 2.82 11.31 8.22 40.52
9.30 0.38 0.31 -0.00 0.26 42.40 192.09
29.72 39.70 140.28
23.65 0.09 89.77
3.30 26.12
5.10 33.70 11.91 6.27 0.00 16.71
ULIF01316/01/06EquityMgFd101 ULIF01202/01/04GrowthFund101
354.89 1592.69
INVESTMENT OF UNIT FUNDULGF02525/02/12BalancedMF101 ULIF00802/01/04LiquidFund101 ULIF01420/06/07StableMgFd101 ULGF01520/06/07SovereignF101 ULIF00902/01/04SecureMgtF101 ULIF01002/01/04DefensiveF101 ULIF01102/01/04BalancedMF101
72.60 330.11178.46 28.13
37
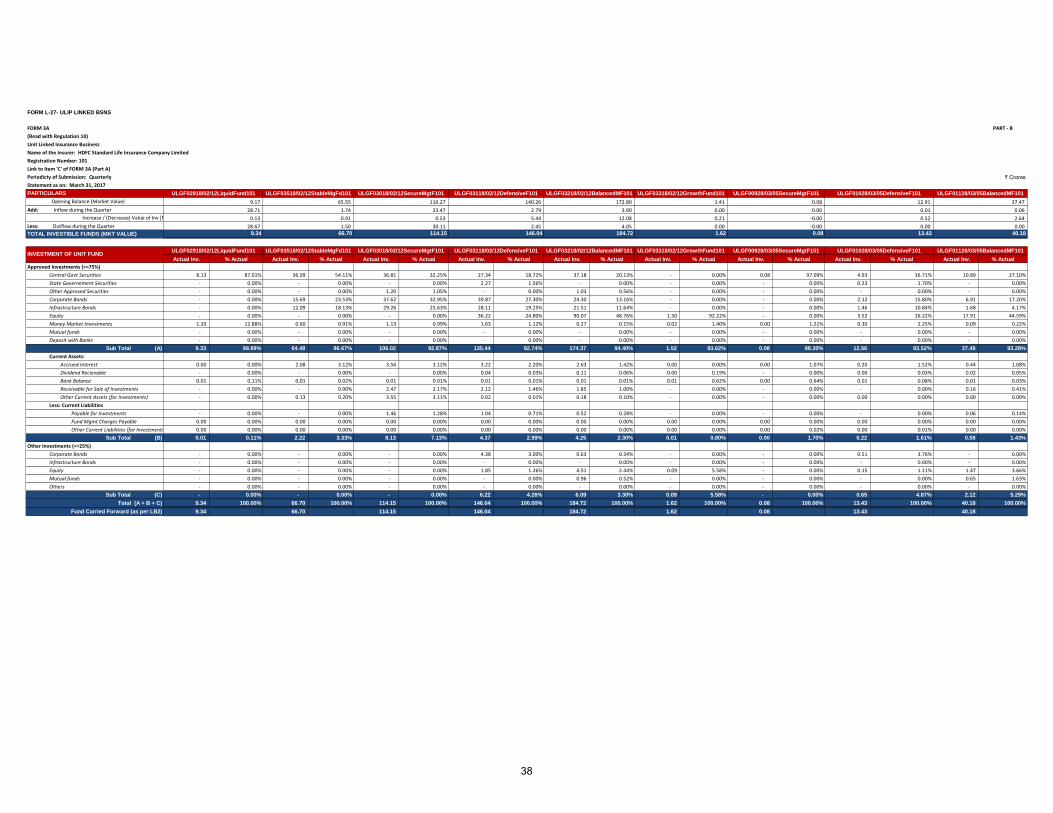
FORM L-27- ULIP LINKED BSNS
FORM 3A PART - B
(Read with Regulation 10)
Unit Linked Insurance Business
Name of the Insurer: HDFC Standard Life Insurance Company Limited
Registration Number: 101
Link to Item 'C' of FORM 3A (Part A)
Periodicty of Submission: Quarterly ` CroresStatement as on: March 31, 2017
PARTICULARS
Opening Balance (Market Value)
Add: Inflow during the Quarter
Increase / (Decrease) Value of Inv [Net]
Less: Outflow during the Quarter
TOTAL INVESTIBLE FUNDS (MKT VALUE)
Actual Inv. % Actual Actual Inv. % Actual Actual Inv. % Actual Actual Inv. % Actual Actual Inv. % Actual Actual Inv. % Actual Actual Inv. % Actual Actual Inv. % Actual Actual Inv. % Actual
Approved Investments (>=75%)
Central Govt Securities 8.13 87.01% 36.09 54.11% 36.81 32.25% 27.34 18.72% 37.18 20.13% - 0.00% 0.08 97.09% 4.93 36.71% 10.89 27.10%
State Governement Securities - 0.00% - 0.00% - 0.00% 2.27 1.56% - 0.00% - 0.00% - 0.00% 0.23 1.70% - 0.00%
Other Approved Securities - 0.00% - 0.00% 1.20 1.05% - 0.00% 1.03 0.56% - 0.00% - 0.00% - 0.00% - 0.00%
Corporate Bonds - 0.00% 15.69 23.53% 37.62 32.95% 39.87 27.30% 24.30 13.16% - 0.00% - 0.00% 2.12 15.80% 6.91 17.20%
Infrastructure Bonds - 0.00% 12.09 18.13% 29.26 25.63% 28.11 19.25% 21.51 11.64% - 0.00% - 0.00% 1.46 10.84% 1.68 4.17%
Equity - 0.00% - 0.00% - 0.00% 36.22 24.80% 90.07 48.76% 1.50 92.22% - 0.00% 3.52 26.22% 17.91 44.59%
Money Market Investments 1.20 12.88% 0.60 0.91% 1.13 0.99% 1.63 1.12% 0.27 0.15% 0.02 1.40% 0.00 1.21% 0.30 2.25% 0.09 0.22%
Mutual funds - 0.00% - 0.00% - 0.00% - 0.00% - 0.00% - 0.00% - 0.00% - 0.00% - 0.00%
Deposit with Banks - 0.00% - 0.00% - 0.00% - 0.00% - 0.00% - 0.00% - 0.00% - 0.00% - 0.00%
Sub Total (A) 9.33 99.89% 64.48 96.67% 106.02 92.87% 135.44 92.74% 174.37 94.40% 1.52 93.62% 0.08 98.30% 12.56 93.52% 37.48 93.28%
Current Assets:
Accrued Interest 0.00 0.00% 2.08 3.12% 3.56 3.12% 3.22 2.20% 2.63 1.42% 0.00 0.00% 0.00 1.07% 0.20 1.52% 0.44 1.08%
Dividend Recievable - 0.00% - 0.00% - 0.00% 0.04 0.03% 0.11 0.06% 0.00 0.19% - 0.00% 0.00 0.03% 0.02 0.05%
Bank Balance 0.01 0.11% 0.01 0.02% 0.01 0.01% 0.01 0.01% 0.01 0.01% 0.01 0.62% 0.00 0.64% 0.01 0.08% 0.01 0.03%
Receivable for Sale of Investments - 0.00% - 0.00% 2.47 2.17% 2.12 1.46% 1.85 1.00% - 0.00% - 0.00% - 0.00% 0.16 0.41%
Other Current Assets (for Investments) - 0.00% 0.13 0.20% 3.55 3.11% 0.02 0.01% 0.18 0.10% - 0.00% - 0.00% 0.00 0.00% 0.00 0.00%
Less: Current Liabilities
Payable for Investments - 0.00% - 0.00% 1.46 1.28% 1.04 0.71% 0.52 0.28% - 0.00% - 0.00% - 0.00% 0.06 0.14%
Fund Mgmt Charges Payable 0.00 0.00% 0.00 0.00% 0.00 0.00% 0.00 0.00% 0.00 0.00% 0.00 0.00% 0.00 0.00% 0.00 0.00% 0.00 0.00%
Other Current Liabilities (for Investments) 0.00 0.00% 0.00 0.00% 0.00 0.00% 0.00 0.00% 0.00 0.00% 0.00 0.00% 0.00 0.02% 0.00 0.01% 0.00 0.00%
Sub Total (B) 0.01 0.11% 2.22 3.33% 8.13 7.13% 4.37 2.99% 4.25 2.30% 0.01 0.80% 0.00 1.70% 0.22 1.61% 0.58 1.43%
Other Investments (<=25%)
Corporate Bonds - 0.00% - 0.00% - 0.00% 4.38 3.00% 0.63 0.34% - 0.00% - 0.00% 0.51 3.76% - 0.00%
Infrastructure Bonds - 0.00% - 0.00% - 0.00% - 0.00% - 0.00% - 0.00% - 0.00% - 0.00% - 0.00%
Equity - 0.00% - 0.00% - 0.00% 1.85 1.26% 4.51 2.44% 0.09 5.58% - 0.00% 0.15 1.11% 1.47 3.66%
Mutual funds - 0.00% - 0.00% - 0.00% - 0.00% 0.96 0.52% - 0.00% - 0.00% - 0.00% 0.65 1.63%
Others - 0.00% - 0.00% - 0.00% - 0.00% - 0.00% - 0.00% - 0.00% - 0.00% - 0.00%
Sub Total (C) - 0.00% - 0.00% - 0.00% 6.22 4.26% 6.09 3.30% 0.09 5.58% - 0.00% 0.65 4.87% 2.12 5.29%
Total (A + B + C) 9.34 100.00% 66.70 100.00% 114.15 100.00% 146.04 100.00% 184.72 100.00% 1.62 100.00% 0.08 100.00% 13.43 100.00% 40.18 100.00%
Fund Carried Forward (as per LB2) 9.34 66.70 114.15 146.04 184.72 1.62 0.08 13.43 40.18
ULGF00928/03/05SecureMgtF101 ULGF01028/03/05DefensiveF101 ULGF01128/03/05BalancedMF101
9.17 65.55 110.27 140.26 172.80 1.41 0.08
ULGF02918/02/12LiquidFund101 ULGF03518/02/12StableMgFd101 ULGF03018/02/12SecureMgtF101 ULGF03118/02/12DefensiveF101 ULGF03218/02/12BalancedMF101 ULGF03318/02/12GrowthFund101
12.91 37.47
28.71 1.74 33.47 2.79 3.90 0.00 0.00 0.01 0.06
0.13 0.91 0.53 5.44 12.08 0.52 2.64
-0.00 0.00 0.00 114.15 146.04 184.72
0.21 -0.00
0.00 28.67 1.50 30.11 2.45 4.05
ULGF01028/03/05DefensiveF101 ULGF01128/03/05BalancedMF101
13.43 40.18
INVESTMENT OF UNIT FUNDULGF02918/02/12LiquidFund101 ULGF03518/02/12StableMgFd101 ULGF03018/02/12SecureMgtF101 ULGF03118/02/12DefensiveF101 ULGF03218/02/12BalancedMF101 ULGF03318/02/12GrowthFund101 ULGF00928/03/05SecureMgtF101
1.62 0.089.34 66.70
38
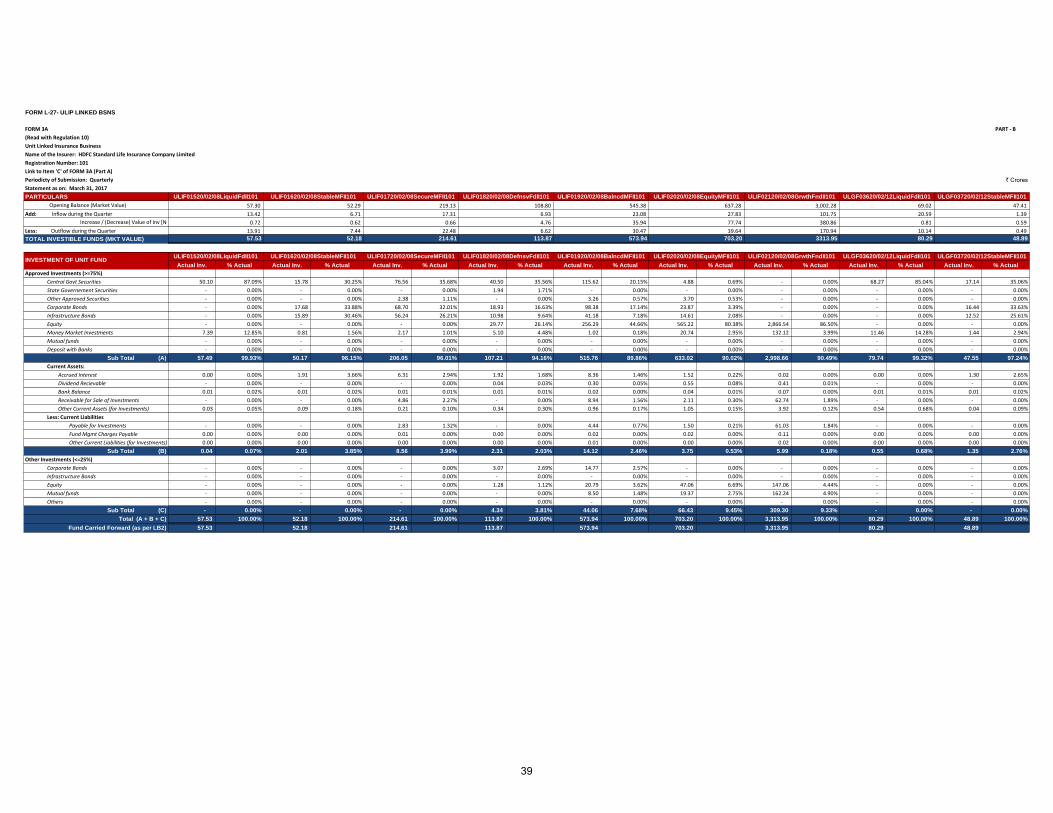
FORM L-27- ULIP LINKED BSNS
FORM 3A PART - B
(Read with Regulation 10)
Unit Linked Insurance Business
Name of the Insurer: HDFC Standard Life Insurance Company Limited
Registration Number: 101
Link to Item 'C' of FORM 3A (Part A)
Periodicty of Submission: Quarterly ` CroresStatement as on: March 31, 2017
PARTICULARS
Opening Balance (Market Value)
Add: Inflow during the Quarter
Increase / (Decrease) Value of Inv [Net]
Less: Outflow during the Quarter
TOTAL INVESTIBLE FUNDS (MKT VALUE)
Actual Inv. % Actual Actual Inv. % Actual Actual Inv. % Actual Actual Inv. % Actual Actual Inv. % Actual Actual Inv. % Actual Actual Inv. % Actual Actual Inv. % Actual Actual Inv. % Actual
Approved Investments (>=75%)
Central Govt Securities 50.10 87.09% 15.78 30.25% 76.56 35.68% 40.50 35.56% 115.62 20.15% 4.88 0.69% - 0.00% 68.27 85.04% 17.14 35.06%
State Governement Securities - 0.00% - 0.00% - 0.00% 1.94 1.71% - 0.00% - 0.00% - 0.00% - 0.00% - 0.00%
Other Approved Securities - 0.00% - 0.00% 2.38 1.11% - 0.00% 3.26 0.57% 3.70 0.53% - 0.00% - 0.00% - 0.00%
Corporate Bonds - 0.00% 17.68 33.88% 68.70 32.01% 18.93 16.63% 98.38 17.14% 23.87 3.39% - 0.00% - 0.00% 16.44 33.63%
Infrastructure Bonds - 0.00% 15.89 30.46% 56.24 26.21% 10.98 9.64% 41.18 7.18% 14.61 2.08% - 0.00% - 0.00% 12.52 25.61%
Equity - 0.00% - 0.00% - 0.00% 29.77 26.14% 256.29 44.66% 565.22 80.38% 2,866.54 86.50% - 0.00% - 0.00%
Money Market Investments 7.39 12.85% 0.81 1.56% 2.17 1.01% 5.10 4.48% 1.02 0.18% 20.74 2.95% 132.12 3.99% 11.46 14.28% 1.44 2.94%
Mutual funds - 0.00% - 0.00% - 0.00% - 0.00% - 0.00% - 0.00% - 0.00% - 0.00% - 0.00%
Deposit with Banks - 0.00% - 0.00% - 0.00% - 0.00% - 0.00% - 0.00% - 0.00% - 0.00% - 0.00%
Sub Total (A) 57.49 99.93% 50.17 96.15% 206.05 96.01% 107.21 94.16% 515.76 89.86% 633.02 90.02% 2,998.66 90.49% 79.74 99.32% 47.55 97.24%
Current Assets:
Accrued Interest 0.00 0.00% 1.91 3.66% 6.31 2.94% 1.92 1.68% 8.36 1.46% 1.52 0.22% 0.02 0.00% 0.00 0.00% 1.30 2.65%
Dividend Recievable - 0.00% - 0.00% - 0.00% 0.04 0.03% 0.30 0.05% 0.55 0.08% 0.41 0.01% - 0.00% - 0.00%
Bank Balance 0.01 0.02% 0.01 0.02% 0.01 0.01% 0.01 0.01% 0.02 0.00% 0.04 0.01% 0.07 0.00% 0.01 0.01% 0.01 0.02%
Receivable for Sale of Investments - 0.00% - 0.00% 4.86 2.27% - 0.00% 8.94 1.56% 2.11 0.30% 62.74 1.89% - 0.00% - 0.00%
Other Current Assets (for Investments) 0.03 0.05% 0.09 0.18% 0.21 0.10% 0.34 0.30% 0.96 0.17% 1.05 0.15% 3.92 0.12% 0.54 0.68% 0.04 0.09%
Less: Current Liabilities
Payable for Investments - 0.00% - 0.00% 2.83 1.32% - 0.00% 4.44 0.77% 1.50 0.21% 61.03 1.84% - 0.00% - 0.00%
Fund Mgmt Charges Payable 0.00 0.00% 0.00 0.00% 0.01 0.00% 0.00 0.00% 0.02 0.00% 0.02 0.00% 0.11 0.00% 0.00 0.00% 0.00 0.00%
Other Current Liabilities (for Investments) 0.00 0.00% 0.00 0.00% 0.00 0.00% 0.00 0.00% 0.01 0.00% 0.00 0.00% 0.02 0.00% 0.00 0.00% 0.00 0.00%
Sub Total (B) 0.04 0.07% 2.01 3.85% 8.56 3.99% 2.31 2.03% 14.12 2.46% 3.75 0.53% 5.99 0.18% 0.55 0.68% 1.35 2.76%
Other Investments (<=25%)
Corporate Bonds - 0.00% - 0.00% - 0.00% 3.07 2.69% 14.77 2.57% - 0.00% - 0.00% - 0.00% - 0.00%
Infrastructure Bonds - 0.00% - 0.00% - 0.00% - 0.00% - 0.00% - 0.00% - 0.00% - 0.00% - 0.00%
Equity - 0.00% - 0.00% - 0.00% 1.28 1.12% 20.79 3.62% 47.06 6.69% 147.06 4.44% - 0.00% - 0.00%
Mutual funds - 0.00% - 0.00% - 0.00% - 0.00% 8.50 1.48% 19.37 2.75% 162.24 4.90% - 0.00% - 0.00%
Others - 0.00% - 0.00% - 0.00% - 0.00% - 0.00% - 0.00% - 0.00% - 0.00% - 0.00%
Sub Total (C) - 0.00% - 0.00% - 0.00% 4.34 3.81% 44.06 7.68% 66.43 9.45% 309.30 9.33% - 0.00% - 0.00%
Total (A + B + C) 57.53 100.00% 52.18 100.00% 214.61 100.00% 113.87 100.00% 573.94 100.00% 703.20 100.00% 3,313.95 100.00% 80.29 100.00% 48.89 100.00%
Fund Carried Forward (as per LB2) 57.53 52.18 214.61 113.87 573.94 703.20 3,313.95 80.29 48.89
ULIF02120/02/08GrwthFndII101 ULGF03620/02/12LiquidFdII101 ULGF03720/02/12StableMFII101
57.30 52.29 219.13 108.80 545.38 637.28 3,002.28
ULIF01520/02/08LiquidFdII101 ULIF01620/02/08StableMFII101 ULIF01720/02/08SecureMFII101 ULIF01820/02/08DefnsvFdII101 ULIF01920/02/08BalncdMFII101 ULIF02020/02/08EquityMFII101
69.02 47.41
13.42 6.71 17.31 6.93 23.08 27.83 101.75 20.59 1.39
0.72 0.62 0.66 4.76 35.94 0.81 0.59
170.94 10.14 0.49
214.61 113.87 573.94
77.74 380.86
39.64 13.91 7.44 22.48 6.62 30.47
ULGF03620/02/12LiquidFdII101 ULGF03720/02/12StableMFII101
80.29 48.89
INVESTMENT OF UNIT FUNDULIF01520/02/08LiquidFdII101 ULIF01620/02/08StableMFII101 ULIF01720/02/08SecureMFII101 ULIF01820/02/08DefnsvFdII101 ULIF01920/02/08BalncdMFII101 ULIF02020/02/08EquityMFII101 ULIF02120/02/08GrwthFndII101
703.20 3313.9557.53 52.18
39
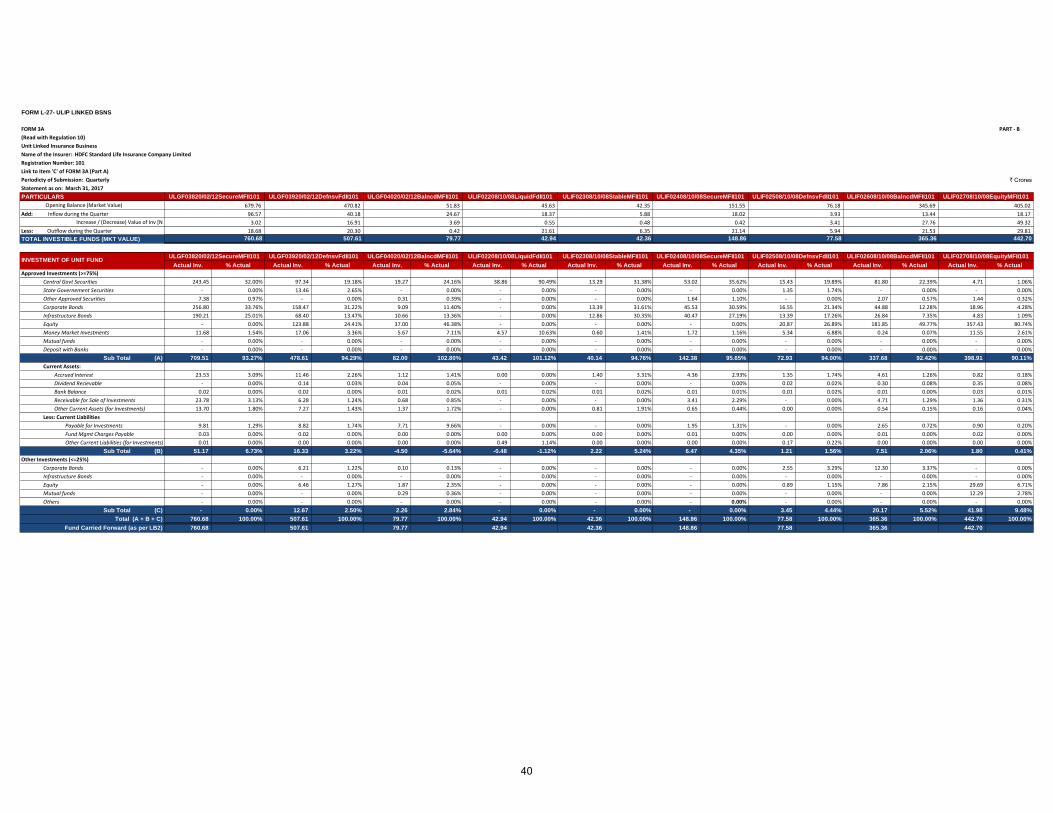
FORM L-27- ULIP LINKED BSNS
FORM 3A PART - B
(Read with Regulation 10)
Unit Linked Insurance Business
Name of the Insurer: HDFC Standard Life Insurance Company Limited
Registration Number: 101
Link to Item 'C' of FORM 3A (Part A)
Periodicty of Submission: Quarterly ` CroresStatement as on: March 31, 2017
PARTICULARS
Opening Balance (Market Value)
Add: Inflow during the Quarter
Increase / (Decrease) Value of Inv [Net]
Less: Outflow during the Quarter
TOTAL INVESTIBLE FUNDS (MKT VALUE)
Actual Inv. % Actual Actual Inv. % Actual Actual Inv. % Actual Actual Inv. % Actual Actual Inv. % Actual Actual Inv. % Actual Actual Inv. % Actual Actual Inv. % Actual Actual Inv. % Actual
Approved Investments (>=75%)
Central Govt Securities 243.45 32.00% 97.34 19.18% 19.27 24.16% 38.86 90.49% 13.29 31.38% 53.02 35.62% 15.43 19.89% 81.80 22.39% 4.71 1.06%
State Governement Securities - 0.00% 13.46 2.65% - 0.00% - 0.00% - 0.00% - 0.00% 1.35 1.74% - 0.00% - 0.00%
Other Approved Securities 7.38 0.97% - 0.00% 0.31 0.39% - 0.00% - 0.00% 1.64 1.10% - 0.00% 2.07 0.57% 1.44 0.32%
Corporate Bonds 256.80 33.76% 158.47 31.22% 9.09 11.40% - 0.00% 13.39 31.61% 45.53 30.59% 16.55 21.34% 44.88 12.28% 18.96 4.28%
Infrastructure Bonds 190.21 25.01% 68.40 13.47% 10.66 13.36% - 0.00% 12.86 30.35% 40.47 27.19% 13.39 17.26% 26.84 7.35% 4.83 1.09%
Equity - 0.00% 123.88 24.41% 37.00 46.38% - 0.00% - 0.00% - 0.00% 20.87 26.89% 181.85 49.77% 357.43 80.74%
Money Market Investments 11.68 1.54% 17.06 3.36% 5.67 7.11% 4.57 10.63% 0.60 1.41% 1.72 1.16% 5.34 6.88% 0.24 0.07% 11.55 2.61%
Mutual funds - 0.00% - 0.00% - 0.00% - 0.00% - 0.00% - 0.00% - 0.00% - 0.00% - 0.00%
Deposit with Banks - 0.00% - 0.00% - 0.00% - 0.00% - 0.00% - 0.00% - 0.00% - 0.00% - 0.00%
Sub Total (A) 709.51 93.27% 478.61 94.29% 82.00 102.80% 43.42 101.12% 40.14 94.76% 142.38 95.65% 72.93 94.00% 337.68 92.42% 398.91 90.11%
Current Assets:
Accrued Interest 23.53 3.09% 11.46 2.26% 1.12 1.41% 0.00 0.00% 1.40 3.31% 4.36 2.93% 1.35 1.74% 4.61 1.26% 0.82 0.18%
Dividend Recievable - 0.00% 0.14 0.03% 0.04 0.05% - 0.00% - 0.00% - 0.00% 0.02 0.02% 0.30 0.08% 0.35 0.08%
Bank Balance 0.02 0.00% 0.02 0.00% 0.01 0.02% 0.01 0.02% 0.01 0.02% 0.01 0.01% 0.01 0.02% 0.01 0.00% 0.03 0.01%
Receivable for Sale of Investments 23.78 3.13% 6.28 1.24% 0.68 0.85% - 0.00% - 0.00% 3.41 2.29% - 0.00% 4.71 1.29% 1.36 0.31%
Other Current Assets (for Investments) 13.70 1.80% 7.27 1.43% 1.37 1.72% - 0.00% 0.81 1.91% 0.65 0.44% 0.00 0.00% 0.54 0.15% 0.16 0.04%
Less: Current Liabilities
Payable for Investments 9.81 1.29% 8.82 1.74% 7.71 9.66% - 0.00% - 0.00% 1.95 1.31% - 0.00% 2.65 0.72% 0.90 0.20%
Fund Mgmt Charges Payable 0.03 0.00% 0.02 0.00% 0.00 0.00% 0.00 0.00% 0.00 0.00% 0.01 0.00% 0.00 0.00% 0.01 0.00% 0.02 0.00%
Other Current Liabilities (for Investments) 0.01 0.00% 0.00 0.00% 0.00 0.00% 0.49 1.14% 0.00 0.00% 0.00 0.00% 0.17 0.22% 0.00 0.00% 0.00 0.00%
Sub Total (B) 51.17 6.73% 16.33 3.22% -4.50 -5.64% -0.48 -1.12% 2.22 5.24% 6.47 4.35% 1.21 1.56% 7.51 2.06% 1.80 0.41%
Other Investments (<=25%)
Corporate Bonds - 0.00% 6.21 1.22% 0.10 0.13% - 0.00% - 0.00% - 0.00% 2.55 3.29% 12.30 3.37% - 0.00%
Infrastructure Bonds - 0.00% - 0.00% - 0.00% - 0.00% - 0.00% - 0.00% - 0.00% - 0.00% - 0.00%
Equity - 0.00% 6.46 1.27% 1.87 2.35% - 0.00% - 0.00% - 0.00% 0.89 1.15% 7.86 2.15% 29.69 6.71%
Mutual funds - 0.00% - 0.00% 0.29 0.36% - 0.00% - 0.00% - 0.00% - 0.00% - 0.00% 12.29 2.78%
Others - 0.00% - 0.00% - 0.00% - 0.00% - 0.00% - 0.00% - 0.00% - 0.00% - 0.00%
Sub Total (C) - 0.00% 12.67 2.50% 2.26 2.84% - 0.00% - 0.00% - 0.00% 3.45 4.44% 20.17 5.52% 41.98 9.48%
Total (A + B + C) 760.68 100.00% 507.61 100.00% 79.77 100.00% 42.94 100.00% 42.36 100.00% 148.86 100.00% 77.58 100.00% 365.36 100.00% 442.70 100.00%
Fund Carried Forward (as per LB2) 760.68 507.61 79.77 42.94 42.36 148.86 77.58 365.36 442.70
ULIF02508/10/08DefnsvFdII101 ULIF02608/10/08BalncdMFII101 ULIF02708/10/08EquityMFII101
679.76 470.82 51.83 45.63 42.35 151.55 76.18
ULGF03820/02/12SecureMFII101 ULGF03920/02/12DefnsvFdII101 ULGF04020/02/12BalncdMFII101 ULIF02208/10/08LiquidFdII101 ULIF02308/10/08StableMFII101 ULIF02408/10/08SecureMFII101
345.69 405.02
96.57 40.18 24.67 18.37 5.88 18.02 3.93 13.44 18.17
3.02 16.91 3.69 0.55 0.48 27.76 49.32
5.94 21.53 29.81
79.77 42.94 42.36
0.42 3.41
21.14 18.68 20.30 0.42 21.61 6.35
ULIF02608/10/08BalncdMFII101 ULIF02708/10/08EquityMFII101
365.36 442.70
INVESTMENT OF UNIT FUNDULGF03820/02/12SecureMFII101 ULGF03920/02/12DefnsvFdII101 ULGF04020/02/12BalncdMFII101 ULIF02208/10/08LiquidFdII101 ULIF02308/10/08StableMFII101 ULIF02408/10/08SecureMFII101 ULIF02508/10/08DefnsvFdII101
148.86 77.58760.68 507.61
40

FORM L-27- ULIP LINKED BSNS
FORM 3A PART - B
(Read with Regulation 10)
Unit Linked Insurance Business
Name of the Insurer: HDFC Standard Life Insurance Company Limited
Registration Number: 101
Link to Item 'C' of FORM 3A (Part A)
Periodicty of Submission: Quarterly ` CroresStatement as on: March 31, 2017
PARTICULARS
Opening Balance (Market Value)
Add: Inflow during the Quarter
Increase / (Decrease) Value of Inv [Net]
Less: Outflow during the Quarter
TOTAL INVESTIBLE FUNDS (MKT VALUE)
Actual Inv. % Actual Actual Inv. % Actual Actual Inv. % Actual Actual Inv. % Actual Actual Inv. % Actual Actual Inv. % Actual Actual Inv. % Actual Actual Inv. % Actual Actual Inv. % Actual
Approved Investments (>=75%)
Central Govt Securities - 0.00% 8.38 91.16% 12.14 50.06% 33.87 32.22% 36.19 17.88% 2.47 24.69% 14.42 92.75% 17.95 52.97% - 0.00%
State Governement Securities - 0.00% - 0.00% - 0.00% - 0.00% 3.06 1.51% - 0.00% - 0.00% 0.50 1.48% - 0.00%
Other Approved Securities - 0.00% - 0.00% - 0.00% 0.97 0.92% - 0.00% 0.09 0.93% - 0.00% 0.00 0.00% - 0.00%
Corporate Bonds - 0.00% - 0.00% 7.84 32.34% 35.67 33.94% 43.22 21.36% 0.43 4.34% - 0.00% 8.47 24.98% - 0.00%
Infrastructure Bonds - 0.00% - 0.00% 3.44 14.19% 28.89 27.49% 46.32 22.89% 1.43 14.27% - 0.00% 1.58 4.67% - 0.00%
Equity 1,742.84 87.15% - 0.00% - 0.00% - 0.00% 51.08 25.24% 4.85 48.44% - 0.00% 0.00 0.00% 58.76 91.56%
Money Market Investments 66.57 3.33% 1.26 13.69% 0.02 0.10% 1.35 1.28% 12.52 6.19% 0.13 1.25% 0.62 3.96% 1.42 4.19% 0.09 0.13%
Mutual funds - 0.00% - 0.00% - 0.00% - 0.00% - 0.00% - 0.00% - 0.00% 0.00 0.00% - 0.00%
Deposit with Banks - 0.00% - 0.00% - 0.00% - 0.00% - 0.00% - 0.00% - 0.00% 3.00 8.85% - 0.00%
Sub Total (A) 1,809.41 90.48% 9.64 104.86% 23.44 96.68% 100.75 95.86% 192.39 95.07% 9.41 93.92% 15.03 96.70% 32.93 97.15% 58.85 91.69%
Current Assets:
Accrued Interest 0.01 0.00% 0.00 0.00% 0.79 3.28% 3.32 3.16% 4.41 2.18% 0.11 1.06% 0.53 3.38% 0.96 2.83% 0.00 0.00%
Dividend Recievable 0.25 0.01% - 0.00% - 0.00% - 0.00% 0.06 0.03% 0.01 0.12% - 0.00% 0.00 0.00% 0.08 0.12%
Bank Balance 0.04 0.00% 0.01 0.11% 0.01 0.04% 0.01 0.01% 0.02 0.01% 0.01 0.10% 0.01 0.07% 0.01 0.03% 0.01 0.02%
Receivable for Sale of Investments 38.06 1.90% - 0.00% - 0.00% 4.56 4.34% 0.83 0.41% 0.13 1.28% - 0.00% 0.00 0.00% 0.43 0.68%
Other Current Assets (for Investments) 0.12 0.01% - 0.00% - 0.00% - 0.00% 0.42 0.21% 0.00 0.00% - 0.00% 0.00 0.00% 0.00 0.00%
Less: Current Liabilities
Payable for Investments 36.97 1.85% - 0.00% - 0.00% 1.41 1.34% 1.56 0.77% 0.02 0.21% - 0.00% 0.00 0.00% - 0.00%
Fund Mgmt Charges Payable 0.07 0.00% 0.00 0.00% 0.00 0.00% 0.00 0.00% 0.01 0.00% 0.00 0.00% 0.00 0.00% 0.00 0.00% 0.00 0.00%
Other Current Liabilities (for Investments) 0.01 0.00% 0.46 4.96% 0.00 0.00% 2.13 2.03% 0.00 0.00% 0.00 0.00% 0.02 0.14% 0.00 0.00% 0.01 0.01%
Sub Total (B) 1.43 0.07% -0.45 -4.86% 0.80 3.32% 4.35 4.14% 4.16 2.05% 0.24 2.35% 0.51 3.30% 0.97 2.85% 0.51 0.80%
Other Investments (<=25%)
Corporate Bonds - 0.00% - 0.00% - 0.00% - 0.00% 3.17 1.57% - 0.00% - 0.00% 0.00 0.00% - 0.00%
Infrastructure Bonds - 0.00% - 0.00% - 0.00% - 0.00% - 0.00% - 0.00% - 0.00% 0.00 0.00% - 0.00%
Equity 89.84 4.49% - 0.00% - 0.00% - 0.00% 2.65 1.31% 0.28 2.77% - 0.00% 0.00 0.00% 4.82 7.51%
Mutual funds 99.13 4.96% - 0.00% - 0.00% - 0.00% - 0.00% 0.10 0.96% - 0.00% 0.00 0.00% - 0.00%
Others - 0.00% - 0.00% - 0.00% - 0.00% - 0.00% - 0.00% - 0.00% 0.00 0.00% - 0.00%
Sub Total (C) 188.97 9.45% - 0.00% - 0.00% - 0.00% 5.82 2.88% 0.37 3.73% - 0.00% 0.00 0.00% 4.82 7.51%
Total (A + B + C) 1,999.81 100.00% 9.19 100.00% 24.24 100.00% 105.10 100.00% 202.37 100.00% 10.02 100.00% 15.55 100.00% 33.90 100.00% 64.18 100.00%
Fund Carried Forward (as per LB2) 1,999.81 9.19 24.24 105.10 202.37 10.02 15.55 3389.61% 64.18
ULIF02904/08/08MoneyPlusF101 ULIF03004/08/08BondOprtFd101 ULIF03204/08/08Large-CapF101
1,839.64 9.62 24.07 89.87 185.36 17.07 17.09
ULIF02808/10/08GrwthFndII101 ULGF04311/02/12LiquidFdII101 ULGF04811/02/12StableMFII101 ULGF04411/02/12SecureMFII101 ULGF04511/02/12DefnsvFdII101 ULGF04611/02/12BalncdMFII101
36.57 59.17
60.14 0.76 0.67 24.90 11.87 4.32 7.39 3.73 8.45
233.15 0.12 0.30 0.56 6.84 -0.19 7.29
9.12 6.21 10.72
24.24 105.10 202.37
1.13 0.19
12.50 133.12 1.30 0.79 10.24 1.70
ULIF03004/08/08BondOprtFd101 ULIF03204/08/08Large-CapF101
33.90 64.18
INVESTMENT OF UNIT FUNDULIF02808/10/08GrwthFndII101 ULGF04311/02/12LiquidFdII101 ULGF04811/02/12StableMFII101 ULGF04411/02/12SecureMFII101 ULGF04511/02/12DefnsvFdII101 ULGF04611/02/12BalncdMFII101 ULIF02904/08/08MoneyPlusF101
10.02 15.551,999.81 9.19
41
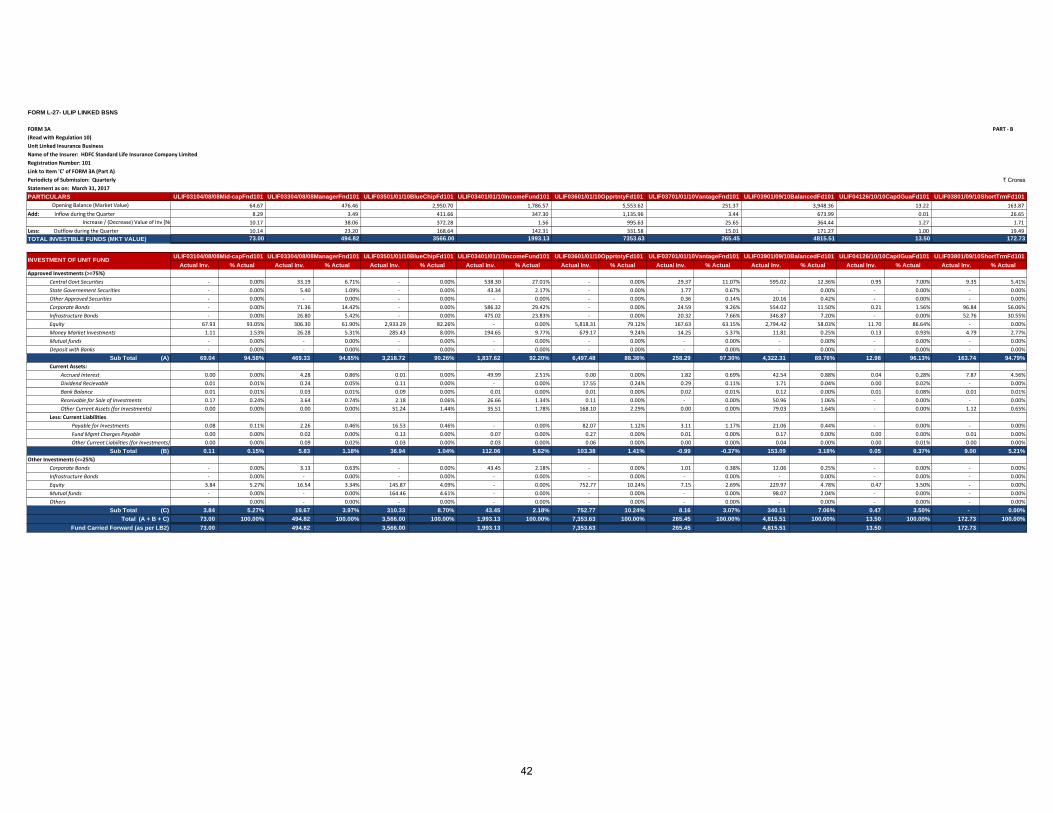
FORM L-27- ULIP LINKED BSNS
FORM 3A PART - B
(Read with Regulation 10)
Unit Linked Insurance Business
Name of the Insurer: HDFC Standard Life Insurance Company Limited
Registration Number: 101
Link to Item 'C' of FORM 3A (Part A)
Periodicty of Submission: Quarterly ` CroresStatement as on: March 31, 2017
PARTICULARS
Opening Balance (Market Value)
Add: Inflow during the Quarter
Increase / (Decrease) Value of Inv [Net]
Less: Outflow during the Quarter
TOTAL INVESTIBLE FUNDS (MKT VALUE)
Actual Inv. % Actual Actual Inv. % Actual Actual Inv. % Actual Actual Inv. % Actual Actual Inv. % Actual Actual Inv. % Actual Actual Inv. % Actual Actual Inv. % Actual Actual Inv. % Actual
Approved Investments (>=75%)
Central Govt Securities - 0.00% 33.19 6.71% - 0.00% 538.30 27.01% - 0.00% 29.37 11.07% 595.02 12.36% 0.95 7.00% 9.35 5.41%
State Governement Securities - 0.00% 5.40 1.09% - 0.00% 43.34 2.17% - 0.00% 1.77 0.67% - 0.00% - 0.00% - 0.00%
Other Approved Securities - 0.00% - 0.00% - 0.00% - 0.00% - 0.00% 0.36 0.14% 20.16 0.42% - 0.00% - 0.00%
Corporate Bonds - 0.00% 71.36 14.42% - 0.00% 586.32 29.42% - 0.00% 24.59 9.26% 554.02 11.50% 0.21 1.56% 96.84 56.06%
Infrastructure Bonds - 0.00% 26.80 5.42% - 0.00% 475.02 23.83% - 0.00% 20.32 7.66% 346.87 7.20% - 0.00% 52.76 30.55%
Equity 67.93 93.05% 306.30 61.90% 2,933.29 82.26% - 0.00% 5,818.31 79.12% 167.63 63.15% 2,794.42 58.03% 11.70 86.64% - 0.00%
Money Market Investments 1.11 1.53% 26.28 5.31% 285.43 8.00% 194.65 9.77% 679.17 9.24% 14.25 5.37% 11.81 0.25% 0.13 0.93% 4.79 2.77%
Mutual funds - 0.00% - 0.00% - 0.00% - 0.00% - 0.00% - 0.00% - 0.00% - 0.00% - 0.00%
Deposit with Banks - 0.00% - 0.00% - 0.00% - 0.00% - 0.00% - 0.00% - 0.00% - 0.00% - 0.00%
Sub Total (A) 69.04 94.58% 469.33 94.85% 3,218.72 90.26% 1,837.62 92.20% 6,497.48 88.36% 258.29 97.30% 4,322.31 89.76% 12.98 96.13% 163.74 94.79%
Current Assets:
Accrued Interest 0.00 0.00% 4.28 0.86% 0.01 0.00% 49.99 2.51% 0.00 0.00% 1.82 0.69% 42.54 0.88% 0.04 0.28% 7.87 4.56%
Dividend Recievable 0.01 0.01% 0.24 0.05% 0.11 0.00% - 0.00% 17.55 0.24% 0.29 0.11% 1.71 0.04% 0.00 0.02% - 0.00%
Bank Balance 0.01 0.01% 0.03 0.01% 0.09 0.00% 0.01 0.00% 0.01 0.00% 0.02 0.01% 0.12 0.00% 0.01 0.08% 0.01 0.01%
Receivable for Sale of Investments 0.17 0.24% 3.64 0.74% 2.18 0.06% 26.66 1.34% 0.11 0.00% - 0.00% 50.96 1.06% - 0.00% - 0.00%
Other Current Assets (for Investments) 0.00 0.00% 0.00 0.00% 51.24 1.44% 35.51 1.78% 168.10 2.29% 0.00 0.00% 79.03 1.64% - 0.00% 1.12 0.65%
Less: Current Liabilities
Payable for Investments 0.08 0.11% 2.26 0.46% 16.53 0.46% - 0.00% 82.07 1.12% 3.11 1.17% 21.06 0.44% - 0.00% - 0.00%
Fund Mgmt Charges Payable 0.00 0.00% 0.02 0.00% 0.13 0.00% 0.07 0.00% 0.27 0.00% 0.01 0.00% 0.17 0.00% 0.00 0.00% 0.01 0.00%
Other Current Liabilities (for Investments) 0.00 0.00% 0.09 0.02% 0.03 0.00% 0.03 0.00% 0.06 0.00% 0.00 0.00% 0.04 0.00% 0.00 0.01% 0.00 0.00%
Sub Total (B) 0.11 0.15% 5.83 1.18% 36.94 1.04% 112.06 5.62% 103.38 1.41% -0.99 -0.37% 153.09 3.18% 0.05 0.37% 9.00 5.21%
Other Investments (<=25%)
Corporate Bonds - 0.00% 3.13 0.63% - 0.00% 43.45 2.18% - 0.00% 1.01 0.38% 12.06 0.25% - 0.00% - 0.00%
Infrastructure Bonds - 0.00% - 0.00% - 0.00% - 0.00% - 0.00% - 0.00% - 0.00% - 0.00% - 0.00%
Equity 3.84 5.27% 16.54 3.34% 145.87 4.09% - 0.00% 752.77 10.24% 7.15 2.69% 229.97 4.78% 0.47 3.50% - 0.00%
Mutual funds - 0.00% - 0.00% 164.46 4.61% - 0.00% - 0.00% - 0.00% 98.07 2.04% - 0.00% - 0.00%
Others - 0.00% - 0.00% - 0.00% - 0.00% - 0.00% - 0.00% - 0.00% - 0.00% - 0.00%
Sub Total (C) 3.84 5.27% 19.67 3.97% 310.33 8.70% 43.45 2.18% 752.77 10.24% 8.16 3.07% 340.11 7.06% 0.47 3.50% - 0.00%
Total (A + B + C) 73.00 100.00% 494.82 100.00% 3,566.00 100.00% 1,993.13 100.00% 7,353.63 100.00% 265.45 100.00% 4,815.51 100.00% 13.50 100.00% 172.73 100.00%
Fund Carried Forward (as per LB2) 73.00 494.82 3,566.00 1,993.13 7,353.63 265.45 4,815.51 13.50 172.73
ULIF03901/09/10BalancedFd101 ULIF04126/10/10CaptlGuaFd101 ULIF03801/09/10ShortTrmFd101
64.67 476.46 2,950.70 1,786.57 5,553.62 251.37 3,948.36
ULIF03104/08/08Mid-capFnd101 ULIF03304/08/08ManagerFnd101 ULIF03501/01/10BlueChipFd101 ULIF03401/01/10IncomeFund101 ULIF03601/01/10OpprtntyFd101 ULIF03701/01/10VantageFnd101
13.22 163.87
8.29 3.49 411.66 347.30 1,135.96 3.44 673.99 0.01 26.65
10.17 38.06 372.28 1.56 995.63 1.27 1.71
171.27 1.00 19.49
3566.00 1993.13 7353.63
25.65 364.44
15.01 10.14 23.20 168.64 142.31 331.58
ULIF04126/10/10CaptlGuaFd101 ULIF03801/09/10ShortTrmFd101
13.50 172.73
INVESTMENT OF UNIT FUNDULIF03104/08/08Mid-capFnd101 ULIF03304/08/08ManagerFnd101 ULIF03501/01/10BlueChipFd101 ULIF03401/01/10IncomeFund101 ULIF03601/01/10OpprtntyFd101 ULIF03701/01/10VantageFnd101 ULIF03901/09/10BalancedFd101
265.45 4815.5173.00 494.82
42
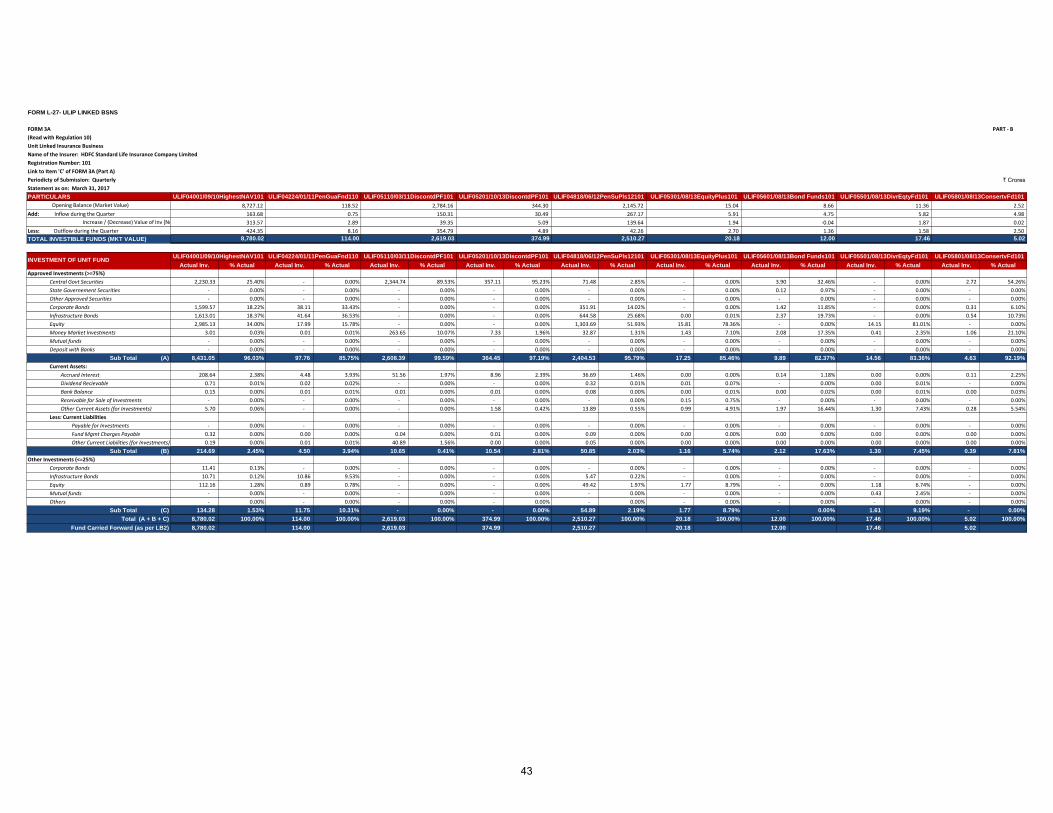
FORM L-27- ULIP LINKED BSNS
FORM 3A PART - B
(Read with Regulation 10)
Unit Linked Insurance Business
Name of the Insurer: HDFC Standard Life Insurance Company Limited
Registration Number: 101
Link to Item 'C' of FORM 3A (Part A)
Periodicty of Submission: Quarterly ` CroresStatement as on: March 31, 2017
PARTICULARS
Opening Balance (Market Value)
Add: Inflow during the Quarter
Increase / (Decrease) Value of Inv [Net]
Less: Outflow during the Quarter
TOTAL INVESTIBLE FUNDS (MKT VALUE)
Actual Inv. % Actual Actual Inv. % Actual Actual Inv. % Actual Actual Inv. % Actual Actual Inv. % Actual Actual Inv. % Actual Actual Inv. % Actual Actual Inv. % Actual Actual Inv. % Actual
Approved Investments (>=75%)
Central Govt Securities 2,230.33 25.40% - 0.00% 2,344.74 89.53% 357.11 95.23% 71.48 2.85% - 0.00% 3.90 32.46% - 0.00% 2.72 54.26%
State Governement Securities - 0.00% - 0.00% - 0.00% - 0.00% - 0.00% - 0.00% 0.12 0.97% - 0.00% - 0.00%
Other Approved Securities - 0.00% - 0.00% - 0.00% - 0.00% - 0.00% - 0.00% - 0.00% - 0.00% - 0.00%
Corporate Bonds 1,599.57 18.22% 38.11 33.43% - 0.00% - 0.00% 351.91 14.02% - 0.00% 1.42 11.85% - 0.00% 0.31 6.10%
Infrastructure Bonds 1,613.01 18.37% 41.64 36.53% - 0.00% - 0.00% 644.58 25.68% 0.00 0.01% 2.37 19.73% - 0.00% 0.54 10.73%
Equity 2,985.13 34.00% 17.99 15.78% - 0.00% - 0.00% 1,303.69 51.93% 15.81 78.36% - 0.00% 14.15 81.01% - 0.00%
Money Market Investments 3.01 0.03% 0.01 0.01% 263.65 10.07% 7.33 1.96% 32.87 1.31% 1.43 7.10% 2.08 17.35% 0.41 2.35% 1.06 21.10%
Mutual funds - 0.00% - 0.00% - 0.00% - 0.00% - 0.00% - 0.00% - 0.00% - 0.00% - 0.00%
Deposit with Banks - 0.00% - 0.00% - 0.00% - 0.00% - 0.00% - 0.00% - 0.00% - 0.00% - 0.00%
Sub Total (A) 8,431.05 96.03% 97.76 85.75% 2,608.39 99.59% 364.45 97.19% 2,404.53 95.79% 17.25 85.46% 9.89 82.37% 14.56 83.36% 4.63 92.19%
Current Assets:
Accrued Interest 208.64 2.38% 4.48 3.93% 51.56 1.97% 8.96 2.39% 36.69 1.46% 0.00 0.00% 0.14 1.18% 0.00 0.00% 0.11 2.25%
Dividend Recievable 0.71 0.01% 0.02 0.02% - 0.00% - 0.00% 0.32 0.01% 0.01 0.07% - 0.00% 0.00 0.01% - 0.00%
Bank Balance 0.15 0.00% 0.01 0.01% 0.01 0.00% 0.01 0.00% 0.08 0.00% 0.00 0.01% 0.00 0.02% 0.00 0.01% 0.00 0.03%
Receivable for Sale of Investments - 0.00% - 0.00% - 0.00% - 0.00% - 0.00% 0.15 0.75% - 0.00% - 0.00% - 0.00%
Other Current Assets (for Investments) 5.70 0.06% - 0.00% - 0.00% 1.58 0.42% 13.89 0.55% 0.99 4.91% 1.97 16.44% 1.30 7.43% 0.28 5.54%
Less: Current Liabilities
Payable for Investments - 0.00% - 0.00% - 0.00% - 0.00% - 0.00% - 0.00% - 0.00% - 0.00% - 0.00%
Fund Mgmt Charges Payable 0.32 0.00% 0.00 0.00% 0.04 0.00% 0.01 0.00% 0.09 0.00% 0.00 0.00% 0.00 0.00% 0.00 0.00% 0.00 0.00%
Other Current Liabilities (for Investments) 0.19 0.00% 0.01 0.01% 40.89 1.56% 0.00 0.00% 0.05 0.00% 0.00 0.00% 0.00 0.00% 0.00 0.00% 0.00 0.00%
Sub Total (B) 214.69 2.45% 4.50 3.94% 10.65 0.41% 10.54 2.81% 50.85 2.03% 1.16 5.74% 2.12 17.63% 1.30 7.45% 0.39 7.81%
Other Investments (<=25%)
Corporate Bonds 11.41 0.13% - 0.00% - 0.00% - 0.00% - 0.00% - 0.00% - 0.00% - 0.00% - 0.00%
Infrastructure Bonds 10.71 0.12% 10.86 9.53% - 0.00% - 0.00% 5.47 0.22% - 0.00% - 0.00% - 0.00% - 0.00%
Equity 112.16 1.28% 0.89 0.78% - 0.00% - 0.00% 49.42 1.97% 1.77 8.79% - 0.00% 1.18 6.74% - 0.00%
Mutual funds - 0.00% - 0.00% - 0.00% - 0.00% - 0.00% - 0.00% - 0.00% 0.43 2.45% - 0.00%
Others - 0.00% - 0.00% - 0.00% - 0.00% - 0.00% - 0.00% - 0.00% - 0.00% - 0.00%
Sub Total (C) 134.28 1.53% 11.75 10.31% - 0.00% - 0.00% 54.89 2.19% 1.77 8.79% - 0.00% 1.61 9.19% - 0.00%
Total (A + B + C) 8,780.02 100.00% 114.00 100.00% 2,619.03 100.00% 374.99 100.00% 2,510.27 100.00% 20.18 100.00% 12.00 100.00% 17.46 100.00% 5.02 100.00%
Fund Carried Forward (as per LB2) 8,780.02 114.00 2,619.03 374.99 2,510.27 20.18 12.00 17.46 5.02
ULIF05601/08/13Bond Funds101 ULIF05501/08/13DivrEqtyFd101 ULIF05801/08/13ConsertvFd101
8,727.12 118.52 2,784.16 344.30 2,145.72 15.04 8.66
ULIF04001/09/10HighestNAV101 ULIF04224/01/11PenGuaFnd110 ULIF05110/03/11DiscontdPF101 ULIF05201/10/13DiscontdPF101 ULIF04818/06/12PenSuPls12101 ULIF05301/08/13EquityPlus101
11.36 2.52
163.68 0.75 150.31 30.49 267.17 5.91 4.75 5.82 4.98
313.57 2.89 39.35 5.09 139.64 1.87 0.02
1.36 1.58 2.50
2,619.03 374.99 2,510.27
1.94 -0.04
2.70 424.35 8.16 354.79 4.89 42.26
ULIF05501/08/13DivrEqtyFd101 ULIF05801/08/13ConsertvFd101
17.46 5.02
INVESTMENT OF UNIT FUNDULIF04001/09/10HighestNAV101 ULIF04224/01/11PenGuaFnd110 ULIF05110/03/11DiscontdPF101 ULIF05201/10/13DiscontdPF101 ULIF04818/06/12PenSuPls12101 ULIF05301/08/13EquityPlus101 ULIF05601/08/13Bond Funds101
20.18 12.008,780.02 114.00
43
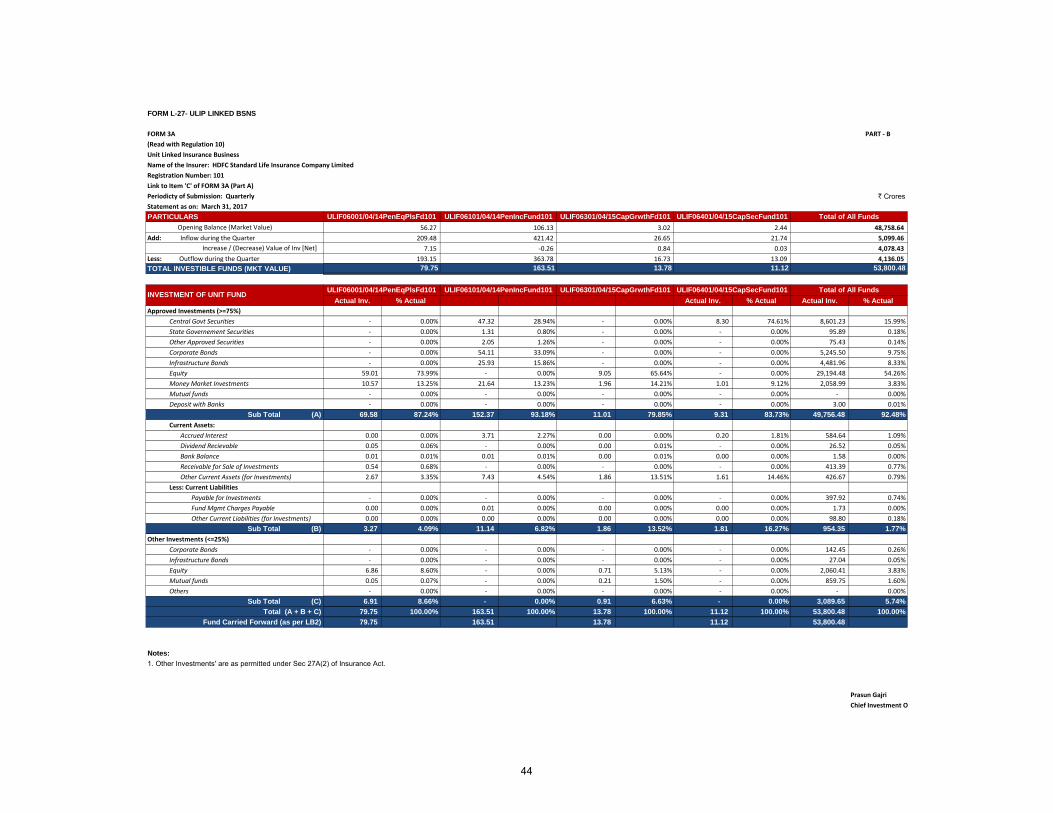
FORM L-27- ULIP LINKED BSNS
FORM 3A PART - B
(Read with Regulation 10)
Unit Linked Insurance Business
Name of the Insurer: HDFC Standard Life Insurance Company Limited
Registration Number: 101
Link to Item 'C' of FORM 3A (Part A)
Periodicty of Submission: Quarterly ` CroresStatement as on: March 31, 2017
PARTICULARS
Opening Balance (Market Value)
Add: Inflow during the Quarter
Increase / (Decrease) Value of Inv [Net]
Less: Outflow during the Quarter
TOTAL INVESTIBLE FUNDS (MKT VALUE)
Actual Inv. % Actual Actual Inv. % Actual Actual Inv. % Actual
Approved Investments (>=75%)
Central Govt Securities - 0.00% 47.32 28.94% - 0.00% 8.30 74.61% 8,601.23 15.99%
State Governement Securities - 0.00% 1.31 0.80% - 0.00% - 0.00% 95.89 0.18%
Other Approved Securities - 0.00% 2.05 1.26% - 0.00% - 0.00% 75.43 0.14%
Corporate Bonds - 0.00% 54.11 33.09% - 0.00% - 0.00% 5,245.50 9.75%
Infrastructure Bonds - 0.00% 25.93 15.86% - 0.00% - 0.00% 4,481.96 8.33%
Equity 59.01 73.99% - 0.00% 9.05 65.64% - 0.00% 29,194.48 54.26%
Money Market Investments 10.57 13.25% 21.64 13.23% 1.96 14.21% 1.01 9.12% 2,058.99 3.83%
Mutual funds - 0.00% - 0.00% - 0.00% - 0.00% - 0.00%
Deposit with Banks - 0.00% - 0.00% - 0.00% - 0.00% 3.00 0.01%
Sub Total (A) 69.58 87.24% 152.37 93.18% 11.01 79.85% 9.31 83.73% 49,756.48 92.48%
Current Assets:
Accrued Interest 0.00 0.00% 3.71 2.27% 0.00 0.00% 0.20 1.81% 584.64 1.09%
Dividend Recievable 0.05 0.06% - 0.00% 0.00 0.01% - 0.00% 26.52 0.05%
Bank Balance 0.01 0.01% 0.01 0.01% 0.00 0.01% 0.00 0.00% 1.58 0.00%
Receivable for Sale of Investments 0.54 0.68% - 0.00% - 0.00% - 0.00% 413.39 0.77%
Other Current Assets (for Investments) 2.67 3.35% 7.43 4.54% 1.86 13.51% 1.61 14.46% 426.67 0.79%
Less: Current Liabilities
Payable for Investments - 0.00% - 0.00% - 0.00% - 0.00% 397.92 0.74%
Fund Mgmt Charges Payable 0.00 0.00% 0.01 0.00% 0.00 0.00% 0.00 0.00% 1.73 0.00%
Other Current Liabilities (for Investments) 0.00 0.00% 0.00 0.00% 0.00 0.00% 0.00 0.00% 98.80 0.18%
Sub Total (B) 3.27 4.09% 11.14 6.82% 1.86 13.52% 1.81 16.27% 954.35 1.77%
Other Investments (<=25%)
Corporate Bonds - 0.00% - 0.00% - 0.00% - 0.00% 142.45 0.26%
Infrastructure Bonds - 0.00% - 0.00% - 0.00% - 0.00% 27.04 0.05%
Equity 6.86 8.60% - 0.00% 0.71 5.13% - 0.00% 2,060.41 3.83%
Mutual funds 0.05 0.07% - 0.00% 0.21 1.50% - 0.00% 859.75 1.60%
Others - 0.00% - 0.00% - 0.00% - 0.00% - 0.00%
Sub Total (C) 6.91 8.66% - 0.00% 0.91 6.63% - 0.00% 3,089.65 5.74%
Total (A + B + C) 79.75 100.00% 163.51 100.00% 13.78 100.00% 11.12 100.00% 53,800.48 100.00%
Fund Carried Forward (as per LB2) 79.75 163.51 13.78 11.12 53,800.48
Notes:
1. Other Investments' are as permitted under Sec 27A(2) of Insurance Act.
Prasun Gajri
Chief Investment Officer
56.27 106.13 3.02 2.44 48,758.64
ULIF06001/04/14PenEqPlsFd101 ULIF06101/04/14PenIncFund101 ULIF06301/04/15CapGrwthFd101 ULIF06401/04/15CapSecFund101 Total of All Funds
7.15 -0.26 0.84 0.03 4,078.43
209.48 421.42 26.65 21.74 5,099.46
Total of All Funds
193.15 363.78 16.73 13.09 4,136.05
79.75 163.51 13.78 11.12 53,800.48
INVESTMENT OF UNIT FUNDULIF06001/04/14PenEqPlsFd101 ULIF06101/04/14PenIncFund101 ULIF06301/04/15CapGrwthFd101 ULIF06401/04/15CapSecFund101
44
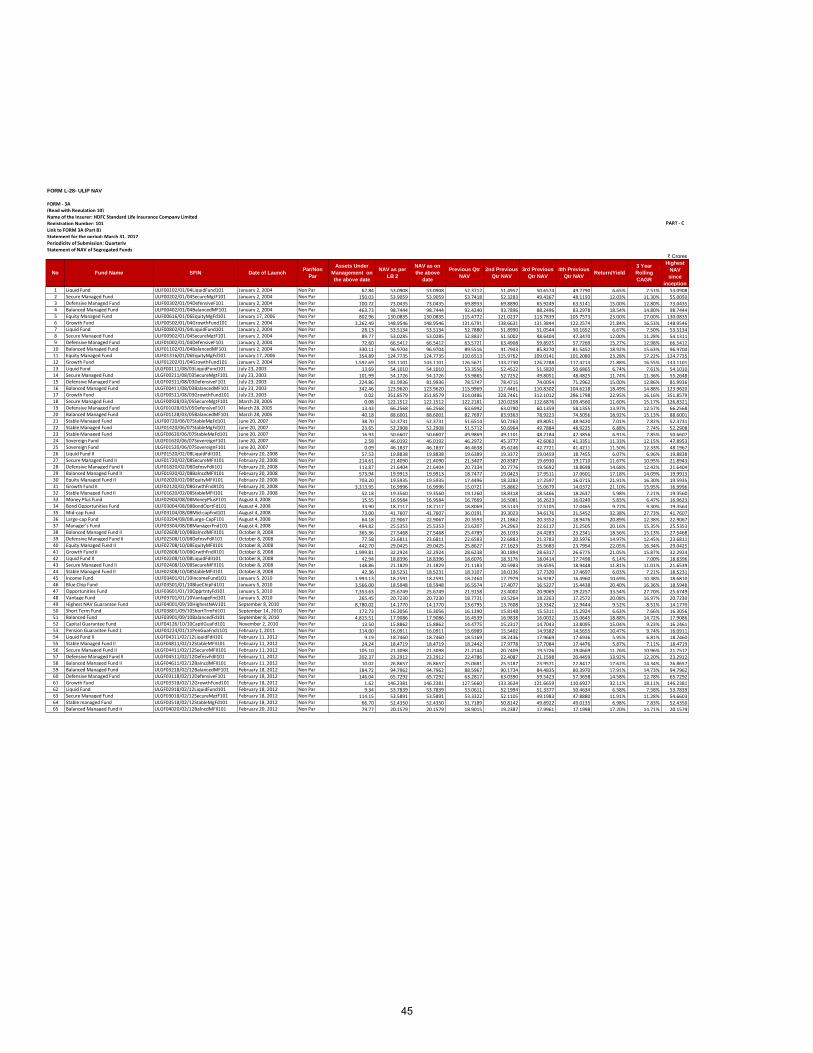
FORM L-28- ULIP NAV
FORM - 3A(Read with Regulation 10)Name of the Insurer: HDFC Standard Life Insurance Company LimitedRegistration Number: 101 PART - C
Link to FORM 3A (Part B)Statement for the period: March 31, 2017Periodicity of Submission: QuarterlyStatement of NAV of Segregated Funds Monday Sunday Sunday Monday Sunday
9/30/2013 6/30/2013 3/31/2013 12/31/2012 9/30/2012 ` Crores
1 Liquid Fund ULIF00102/01/04LiquidFund101 January 2, 2004 Non Par 67.84 53.0908 53.0908 52.3712 51.4957 50.6574 49.7790 6.65% 7.51% 53.09082 Secure Managed Fund ULIF00202/01/04SecureMgtF101 January 2, 2004 Non Par 150.03 53.9059 53.9059 53.7418 52.3283 49.4367 48.1193 12.03% 11.30% 55.00503 Defensive Managed Fund ULIF00302/01/04DefensiveF101 January 2, 2004 Non Par 100.72 73.0435 73.0435 69.8933 69.8890 65.9249 63.5141 15.00% 12.80% 73.04354 Balanced Managed Fund ULIF00402/01/04BalancedMF101 January 2, 2004 Non Par 463.73 98.7444 98.7444 92.4240 93.7896 88.2496 83.2978 18.54% 14.80% 98.74445 Equity Managed Fund ULIF00616/01/06EquityMgFd101 January 17, 2006 Non Par 802.96 130.0835 130.0835 115.4772 121.0237 113.7839 105.7573 23.00% 17.00% 130.08356 Growth Fund ULIF00502/01/04GrowthFund101 January 2, 2004 Non Par 3,262.49 148.9546 148.9546 131.6791 138.6631 131.3844 122.2574 21.84% 16.53% 148.95467 Liquid Fund ULIF00802/01/04LiquidFund101 January 2, 2004 Non Par 28.13 53.5134 53.5134 52.7880 51.8990 51.0544 50.1652 6.67% 7.50% 53.51348 Secure Managed Fund ULIF00902/01/04SecureMgtF101 January 2, 2004 Non Par 89.77 53.0285 53.0285 52.8837 51.5002 48.6404 47.3470 12.00% 11.28% 54.13119 Defensive Managed Fund ULIF01002/01/04DefensiveF101 January 2, 2004 Non Par 72.60 66.5412 66.5412 63.5721 63.4908 59.8925 57.7269 15.27% 12.98% 66.5412
10 Balanced Managed Fund ULIF01102/01/04BalancedMF101 January 2, 2004 Non Par 330.11 96.9704 96.9704 89.5516 91.7943 85.8270 81.5452 18.92% 15.63% 96.970411 Equity Managed Fund ULIF01316/01/06EquityMgFd101 January 17, 2006 Non Par 354.89 124.7735 124.7735 110.6513 115.9762 109.0141 101.2080 23.28% 17.22% 124.773512 Growth Fund ULIF01202/01/04GrowthFund101 January 2, 2004 Non Par 1,592.69 143.1101 143.1101 126.5671 133.2730 126.2288 117.4214 21.88% 16.55% 143.110113 Liquid Fund ULGF00111/08/03LiquidFund101 July 23, 2003 Non Par 13.69 54.1010 54.1010 53.3556 52.4522 51.5820 50.6865 6.74% 7.61% 54.101014 Secure Managed Fund ULGF00211/08/03SecureMgtF101 July 23, 2003 Non Par 101.99 54.1726 54.1726 53.9865 52.7252 49.8051 48.4825 11.74% 11.36% 55.264815 Defensive Managed Fund ULGF00311/08/03DefensiveF101 July 23, 2003 Non Par 224.86 81.9936 81.9936 78.5747 78.4715 74.0054 71.2962 15.00% 12.86% 81.993616 Balanced Managed Fund ULGF00411/08/03BalancedMF101 July 23, 2003 Non Par 342.46 123.9620 123.9620 115.9969 117.4461 110.8302 104.6218 18.49% 14.88% 123.962017 Growth Fund ULGF00511/08/03GrowthFund101 July 23, 2003 Non Par 0.02 351.8579 351.8579 314.0486 328.7461 312.1012 286.1798 22.95% 16.16% 351.857918 Secure Managed Fund ULGF00928/03/05SecureMgtF101 March 28, 2005 Non Par 0.08 122.1512 122.1512 122.2181 120.0258 112.6876 109.4560 11.60% 15.17% 126.832119 Defensive Managed Fund ULGF01028/03/05DefensiveF101 March 28, 2005 Non Par 13.43 66.2568 66.2568 63.6992 63.0790 60.1359 58.1355 13.97% 12.57% 66.256820 Balanced Managed Fund ULGF01128/03/05BalancedMF101 March 28, 2005 Non Par 40.18 88.6001 88.6001 82.7697 83.9363 78.9223 74.5056 18.92% 15.13% 88.600121 Stable Managed Fund ULIF00720/06/07StableMgFd101 June 20, 2007 Non Par 38.70 52.3731 52.3731 51.6514 50.7263 49.8051 48.9420 7.01% 7.82% 52.373122 Stable Managed Fund ULIF01420/06/07StableMgFd101 June 20, 2007 Non Par 23.65 52.2908 52.2908 51.5712 50.6964 49.7884 48.9225 6.88% 7.74% 52.290823 Stable Managed Fund ULGF00620/06/07StableMgFd101 June 20, 2007 Non Par 16.93 50.6607 50.6607 49.9869 49.1101 48.2184 47.3856 6.91% 7.85% 50.660724 Sovereign Fund ULGF01620/06/07SovereignF101 June 20, 2007 Non Par 2.58 46.0192 46.0192 46.2972 45.3777 42.6063 41.3351 11.33% 12.15% 47.895325 Sovereign Fund ULGF01520/06/07SovereignF101 June 20, 2007 Non Par 0.09 46.1837 46.1837 46.4638 45.6246 42.7721 41.4211 11.50% 12.33% 48.196726 Liquid Fund II ULIF01520/02/08LiquidFdII101 February 20, 2008 Non Par 57.53 19.8838 19.8838 19.6389 19.3372 19.0459 18.7455 6.07% 6.96% 19.883827 Secure Managed Fund II ULIF01720/02/08SecureMFII101 February 20, 2008 Non Par 214.61 21.4090 21.4090 21.3407 20.8387 19.6930 19.1710 11.67% 10.95% 21.894328 Defensive Managed Fund II ULIF01820/02/08DefnsvFdII101 February 20, 2008 Non Par 113.87 21.6404 21.6404 20.7334 20.7776 19.5692 18.8698 14.68% 12.42% 21.640429 Balanced Managed Fund II ULIF01920/02/08BalncdMFII101 February 20, 2008 Non Par 573.94 19.9913 19.9913 18.7477 19.0423 17.9511 17.0601 17.18% 14.09% 19.991330 Equity Managed Fund II ULIF02020/02/08EquityMFII101 February 20, 2008 Non Par 703.20 19.5935 19.5935 17.4496 18.3283 17.2597 16.0715 21.91% 16.30% 19.593531 Growth Fund II ULIF02120/02/08GrwthFndII101 February 20, 2008 Non Par 3,313.95 16.9996 16.9996 15.0721 15.8862 15.0679 14.0372 21.10% 15.95% 16.999632 Stable Managed Fund II ULIF01620/02/08StableMFII101 February 20, 2008 Non Par 52.18 19.3560 19.3560 19.1260 18.8318 18.5466 18.2637 5.98% 7.21% 19.356033 Money Plus Fund ULIF02904/08/08MoneyPlusF101 August 4, 2008 Non Par 15.55 16.9584 16.9584 16.7669 16.5081 16.2623 16.0249 5.83% 6.47% 16.962334 Bond Opportunities Fund ULIF03004/08/08BondOprtFd101 August 4, 2008 Non Par 33.90 18.7117 18.7117 18.8069 18.5143 17.5105 17.0465 9.77% 9.30% 19.356435 Mid-cap Fund ULIF03104/08/08Mid-capFnd101 August 4, 2008 Non Par 73.00 41.7607 41.7607 36.0191 39.3023 34.6176 31.5452 32.38% 27.73% 41.760736 Large-cap Fund ULIF03204/08/08Large-CapF101 August 4, 2008 Non Par 64.18 22.9067 22.9067 20.3593 21.1862 20.3352 18.9476 20.89% 12.38% 22.906737 Manager’s Fund ULIF03304/08/08ManagerFnd101 August 4, 2008 Non Par 494.82 25.5353 25.5353 23.6207 24.2963 22.6117 21.2505 20.16% 15.35% 25.535338 Balanced Managed Fund II ULIF02608/10/08BalncdMFII101 October 8, 2008 Non Par 365.36 27.5468 27.5468 25.4789 26.1033 24.4283 23.2341 18.56% 15.13% 27.546839 Defensive Managed Fund II ULIF02508/10/08DefnsvFdII101 October 8, 2008 Non Par 77.58 23.6811 23.6811 22.6583 22.6883 21.3783 20.5976 14.97% 12.45% 23.681140 Equity Managed Fund II ULIF02708/10/08EquityMFII101 October 8, 2008 Non Par 442.70 29.0425 29.0425 25.8627 27.1623 25.5683 23.7954 22.05% 16.34% 29.042541 Growth Fund II ULIF02808/10/08GrwthFndII101 October 8, 2008 Non Par 1,999.81 32.2924 32.2924 28.6238 30.1894 28.6317 26.6775 21.05% 15.87% 32.292442 Liquid Fund II ULIF02208/10/08LiquidFdII101 October 8, 2008 Non Par 42.94 18.8396 18.8396 18.6076 18.3176 18.0414 17.7498 6.14% 7.00% 18.839643 Secure Managed Fund II ULIF02408/10/08SecureMFII101 October 8, 2008 Non Par 148.86 21.1829 21.1829 21.1183 20.5983 19.4595 18.9448 11.81% 11.01% 21.653944 Stable Managed Fund II ULIF02308/10/08StableMFII101 October 8, 2008 Non Par 42.36 18.5231 18.5231 18.3107 18.0136 17.7320 17.4697 6.03% 7.21% 18.523145 Income Fund ULIF03401/01/10IncomeFund101 January 5, 2010 Non Par 1,993.13 18.2591 18.2591 18.2464 17.7979 16.9287 16.4960 10.69% 10.38% 18.681046 Blue Chip Fund ULIF03501/01/10BlueChipFd101 January 5, 2010 Non Par 3,566.00 18.5948 18.5948 16.5574 17.4077 16.5227 15.4438 20.40% 16.36% 18.594847 Opportunities Fund ULIF03601/01/10OpprtntyFd101 January 5, 2010 Non Par 7,353.63 25.6749 25.6749 21.9158 23.4002 20.9069 19.2257 33.54% 27.70% 25.674948 Vantage Fund ULIF03701/01/10VantageFnd101 January 5, 2010 Non Par 265.45 20.7230 20.7230 18.7731 19.5264 18.2263 17.2572 20.08% 16.97% 20.723049 Highest NAV Guarantee Fund ULIF04001/09/10HighestNAV101 September 8, 2010 Non Par 8,780.02 14.1770 14.1770 13.6795 13.7608 13.3342 12.9444 9.52% 8.51% 14.177050 Short Term Fund ULIF03801/09/10ShortTrmFd101 September 14, 2010 Non Par 172.73 16.3056 16.3056 16.1390 15.8148 15.5311 15.2924 6.63% 7.66% 16.305651 Balanced Fund ULIF03901/09/10BalancedFd101 September 8, 2010 Non Par 4,815.51 17.9086 17.9086 16.4539 16.9838 16.0032 15.0645 18.88% 14.72% 17.908652 Capital Guarantee Fund ULIF04126/10/10CaptlGuaFd101 November 2, 2010 Non Par 13.50 15.8862 15.8862 14.4775 15.2317 14.7043 13.8095 15.04% 9.23% 16.246153 Pension Guarantee Fund 1 ULIF04224/01/11PenGuaFnd1101 February 1, 2011 Non Par 114.00 16.0911 16.0911 15.6989 15.5402 14.9382 14.5655 10.47% 9.74% 16.091154 Liquid Fund II ULGF04311/02/12LiquidFdII101 February 11, 2012 Non Par 9.19 18.7460 18.7460 18.5169 18.2436 17.9669 17.6936 5.95% 6.81% 18.746055 Stable Managed Fund II ULGF04811/02/12StableMFII101 February 11, 2012 Non Par 24.24 18.4719 18.4719 18.2442 17.9778 17.7084 17.4476 5.87% 7.11% 18.471956 Secure Managed Fund II ULGF04411/02/12SecureMFII101 February 11, 2012 Non Par 105.10 21.3098 21.3098 21.2144 20.7409 19.5726 19.0669 11.76% 10.96% 21.751757 Defensive Managed Fund II ULGF04511/02/12DefnsvFdII101 February 11, 2012 Non Par 202.37 23.2912 23.2912 22.4786 22.4087 21.1598 20.4459 13.92% 12.20% 23.291258 Balanced Managed Fund II ULGF04611/02/12BalncdMFII101 February 11, 2012 Non Par 10.02 26.8657 26.8657 25.0681 25.5187 23.9571 22.8417 17.62% 14.34% 26.865759 Balanced Managed Fund ULGF03218/02/12BalancedMF101 February 18, 2012 Non Par 184.72 94.7962 94.7962 88.5967 90.1734 84.4835 80.3970 17.91% 14.73% 94.796260 Defensive Managed Fund ULGF03118/02/12DefensiveF101 February 18, 2012 Non Par 146.04 65.7292 65.7292 63.2817 63.0390 59.5423 57.3658 14.58% 12.78% 65.729261 Growth Fund ULGF03318/02/12GrowthFund101 February 18, 2012 Non Par 1.62 146.2381 146.2381 127.5660 133.3634 121.6659 110.6927 32.11% 18.11% 146.238162 Liquid Fund ULGF02918/02/12LiquidFund101 February 18, 2012 Non Par 9.34 53.7839 53.7839 53.0611 52.1994 51.3377 50.4634 6.58% 7.58% 53.783963 Secure Managed Fund ULGF03018/02/12SecureMgtF101 February 18, 2012 Non Par 114.15 53.5891 53.5891 53.3322 52.1105 49.1983 47.8880 11.91% 11.28% 54.660364 Stable managed Fund ULGF03518/02/12StableMgFd101 February 18, 2012 Non Par 66.70 52.4350 52.4350 51.7189 50.8142 49.8922 49.0135 6.98% 7.83% 52.435065 Balanced Managed Fund II ULGF04020/02/12BalncdMFII101 February 20, 2012 Non Par 79.77 20.1579 20.1579 18.9015 19.2387 17.9961 17.1998 17.20% 14.71% 20.1579
Assets Under
Management on
the above date
No Fund Name SFIN Date of LaunchPar/Non
ParReturn/Yield
3 Year
Rolling
CAGR
Highest
NAV
since
inception
NAV as per
LB 2
NAV as on
the above
date
Previous Qtr
NAV
2nd Previous
Qtr NAV
3rd Previous
Qtr NAV
4th Previous
Qtr NAV
45
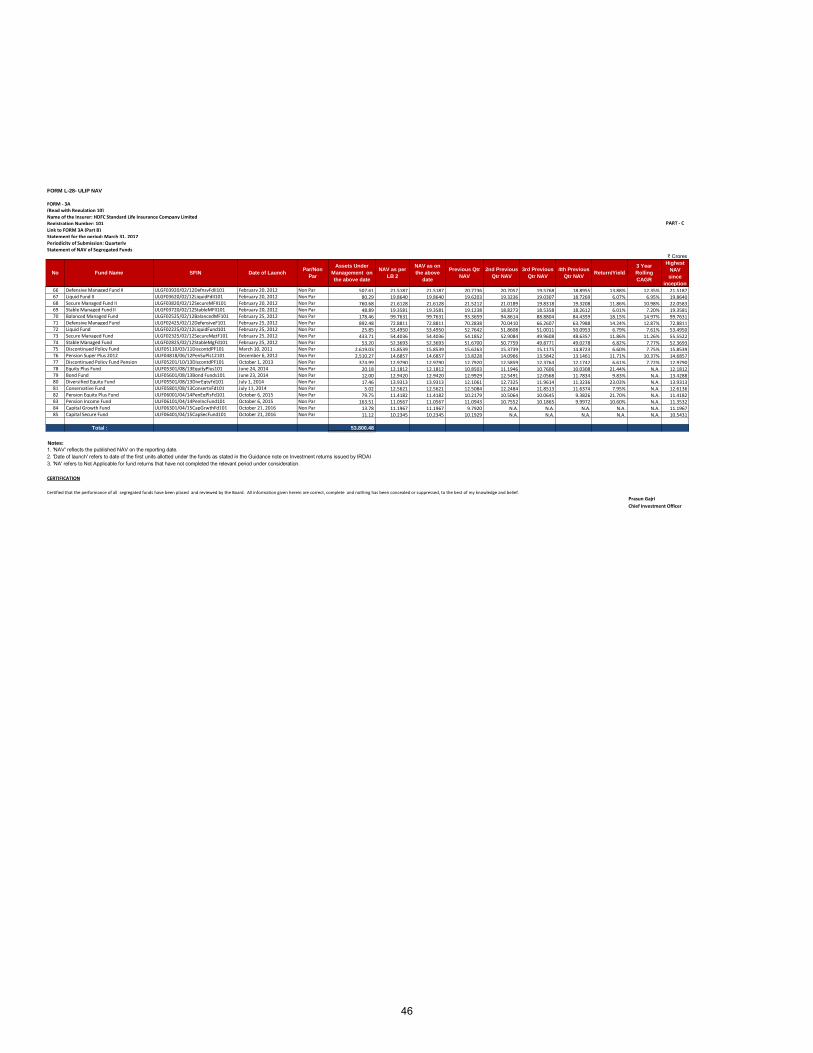
FORM L-28- ULIP NAV
FORM - 3A(Read with Regulation 10)Name of the Insurer: HDFC Standard Life Insurance Company LimitedRegistration Number: 101 PART - C
Link to FORM 3A (Part B)Statement for the period: March 31, 2017Periodicity of Submission: QuarterlyStatement of NAV of Segregated Funds Monday Sunday Sunday Monday Sunday
9/30/2013 6/30/2013 3/31/2013 12/31/2012 9/30/2012 ` Crores
Assets Under
Management on
the above date
No Fund Name SFIN Date of LaunchPar/Non
ParReturn/Yield
3 Year
Rolling
CAGR
Highest
NAV
since
inception
NAV as per
LB 2
NAV as on
the above
date
Previous Qtr
NAV
2nd Previous
Qtr NAV
3rd Previous
Qtr NAV
4th Previous
Qtr NAV
66 Defensive Managed Fund II ULGF03920/02/12DefnsvFdII101 February 20, 2012 Non Par 507.61 21.5187 21.5187 20.7736 20.7057 19.5768 18.8955 13.88% 12.35% 21.518767 Liquid Fund II ULGF03620/02/12LiquidFdII101 February 20, 2012 Non Par 80.29 19.8640 19.8640 19.6203 19.3236 19.0307 18.7269 6.07% 6.95% 19.864068 Secure Managed Fund II ULGF03820/02/12SecureMFII101 February 20, 2012 Non Par 760.68 21.6128 21.6128 21.5212 21.0189 19.8318 19.3208 11.86% 10.98% 22.058369 Stable Managed Fund II ULGF03720/02/12StableMFII101 February 20, 2012 Non Par 48.89 19.3581 19.3581 19.1238 18.8273 18.5358 18.2612 6.01% 7.20% 19.358170 Balanced Managed Fund ULGF02525/02/12BalancedMF101 February 25, 2012 Non Par 178.46 99.7631 99.7631 93.3659 94.8614 88.8804 84.4359 18.15% 14.97% 99.763171 Defensive Managed Fund ULGF02425/02/12DefensiveF101 February 25, 2012 Non Par 892.48 72.8811 72.8811 70.2838 70.0410 66.2607 63.7988 14.24% 12.87% 72.881172 Liquid Fund ULGF02225/02/12LiquidFund101 February 25, 2012 Non Par 25.85 53.4950 53.4950 52.7642 51.8608 51.0011 50.0953 6.79% 7.61% 53.495073 Secure Managed Fund ULGF02325/02/12SecureMgtF101 February 25, 2012 Non Par 433.71 54.4036 54.4036 54.1852 52.9084 49.9608 48.6357 11.86% 11.26% 55.552274 Stable Managed Fund ULGF02825/02/12StableMgFd101 February 25, 2012 Non Par 53.20 52.3693 52.3693 51.6700 50.7759 49.8771 49.0278 6.82% 7.77% 52.369375 Discontinued Policy Fund ULIF05110/03/11DiscontdPF101 March 10, 2011 Non Par 2,619.03 15.8539 15.8539 15.6263 15.3739 15.1175 14.8723 6.60% 7.75% 15.853976 Pension Super Plus 2012 ULIF04818/06/12PenSuPls12101 December 6, 2012 Non Par 2,510.27 14.6857 14.6857 13.8228 14.0966 13.5842 13.1461 11.71% 10.37% 14.685777 Discontinued Policy Fund Pension ULIF05201/10/13DiscontdPF101 October 1, 2013 Non Par 374.99 12.9790 12.9790 12.7920 12.5859 12.3764 12.1742 6.61% 7.72% 12.979078 Equity Plus Fund ULIF05301/08/13EquityPlus101 June 24, 2014 Non Par 20.18 12.1812 12.1812 10.8503 11.1946 10.7606 10.0308 21.44% N.A. 12.181279 Bond Fund ULIF05601/08/13Bond Funds101 June 23, 2014 Non Par 12.00 12.9420 12.9420 12.9929 12.5491 12.0568 11.7834 9.83% N.A. 13.428880 Diversified Equity Fund ULIF05501/08/13DivrEqtyFd101 July 1, 2014 Non Par 17.46 13.9313 13.9313 12.1061 12.7325 11.9614 11.3236 23.03% N.A. 13.931381 Conservative Fund ULIF05801/08/13ConsertvFd101 July 11, 2014 Non Par 5.02 12.5621 12.5621 12.5084 12.2484 11.8513 11.6374 7.95% N.A. 12.613682 Pension Equity Plus Fund ULIF06001/04/14PenEqPlsFd101 October 6, 2015 Non Par 79.75 11.4182 11.4182 10.2179 10.5064 10.0645 9.3826 21.70% N.A. 11.418283 Pension Income Fund ULIF06101/04/14PenIncFund101 October 6, 2015 Non Par 163.51 11.0567 11.0567 11.0943 10.7552 10.1865 9.9972 10.60% N.A. 11.353284 Capital Growth Fund ULIF06301/04/15CapGrwthFd101 October 21, 2016 Non Par 13.78 11.1967 11.1967 9.7920 N.A. N.A. N.A. N.A. N.A. 11.196785 Capital Secure Fund ULIF06401/04/15CapSecFund101 October 21, 2016 Non Par 11.12 10.2345 10.2345 10.1929 N.A. N.A. N.A. N.A. N.A. 10.5431
Total : 53,800.48
Notes:
1. 'NAV' reflects the published NAV on the reporting date.2. 'Date of launch' refers to date of the first units allotted under the funds as stated in the Guidance note on Investment returns issued by IRDAI3. 'NA' refers to Not Applicable for fund returns that have not completed the relevant period under consideration.
CERTIFICATION
Certified that the performance of all segregated funds have been placed and reviewed by the Board. All information given herein are correct, complete and nothing has been concealed or suppressed, to the best of my knowledge and belief.
Prasun Gajri
Chief Investment Officer
46
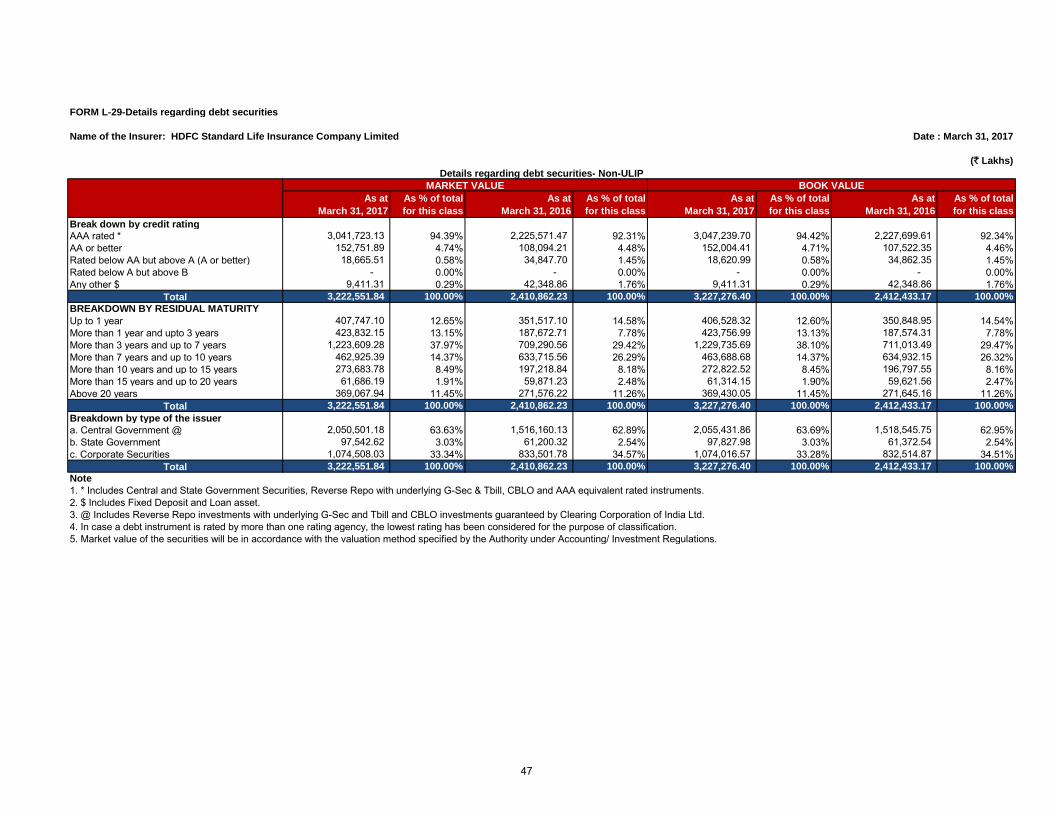
FORM L-29-Details regarding debt securities
Name of the Insurer: HDFC Standard Life Insurance Company Limited Date : March 31, 2017
(` Lakhs)
As at
March 31, 2017
As % of total
for this class
As at
March 31, 2016
As % of total
for this class
As at
March 31, 2017
As % of total
for this class
As at
March 31, 2016
As % of total
for this class
Break down by credit rating
AAA rated * 3,041,723.13 94.39% 2,225,571.47 92.31% 3,047,239.70 94.42% 2,227,699.61 92.34%AA or better 152,751.89 4.74% 108,094.21 4.48% 152,004.41 4.71% 107,522.35 4.46%Rated below AA but above A (A or better) 18,665.51 0.58% 34,847.70 1.45% 18,620.99 0.58% 34,862.35 1.45%Rated below A but above B - 0.00% - 0.00% - 0.00% - 0.00%Any other $ 9,411.31 0.29% 42,348.86 1.76% 9,411.31 0.29% 42,348.86 1.76%
Total 3,222,551.84 100.00% 2,410,862.23 100.00% 3,227,276.40 100.00% 2,412,433.17 100.00%
BREAKDOWN BY RESIDUAL MATURITY
Up to 1 year 407,747.10 12.65% 351,517.10 14.58% 406,528.32 12.60% 350,848.95 14.54%More than 1 year and upto 3 years 423,832.15 13.15% 187,672.71 7.78% 423,756.99 13.13% 187,574.31 7.78%More than 3 years and up to 7 years 1,223,609.28 37.97% 709,290.56 29.42% 1,229,735.69 38.10% 711,013.49 29.47%More than 7 years and up to 10 years 462,925.39 14.37% 633,715.56 26.29% 463,688.68 14.37% 634,932.15 26.32%More than 10 years and up to 15 years 273,683.78 8.49% 197,218.84 8.18% 272,822.52 8.45% 196,797.55 8.16%More than 15 years and up to 20 years 61,686.19 1.91% 59,871.23 2.48% 61,314.15 1.90% 59,621.56 2.47%Above 20 years 369,067.94 11.45% 271,576.22 11.26% 369,430.05 11.45% 271,645.16 11.26%
Total 3,222,551.84 100.00% 2,410,862.23 100.00% 3,227,276.40 100.00% 2,412,433.17 100.00%
Breakdown by type of the issuer
a. Central Government @ 2,050,501.18 63.63% 1,516,160.13 62.89% 2,055,431.86 63.69% 1,518,545.75 62.95%b. State Government 97,542.62 3.03% 61,200.32 2.54% 97,827.98 3.03% 61,372.54 2.54%c. Corporate Securities 1,074,508.03 33.34% 833,501.78 34.57% 1,074,016.57 33.28% 832,514.87 34.51%
Total 3,222,551.84 100.00% 2,410,862.23 100.00% 3,227,276.40 100.00% 2,412,433.17 100.00%
Note
1. * Includes Central and State Government Securities, Reverse Repo with underlying G-Sec & Tbill, CBLO and AAA equivalent rated instruments.2. $ Includes Fixed Deposit and Loan asset.3. @ Includes Reverse Repo investments with underlying G-Sec and Tbill and CBLO investments guaranteed by Clearing Corporation of India Ltd.4. In case a debt instrument is rated by more than one rating agency, the lowest rating has been considered for the purpose of classification.5. Market value of the securities will be in accordance with the valuation method specified by the Authority under Accounting/ Investment Regulations.
Details regarding debt securities- Non-ULIP
MARKET VALUE BOOK VALUE
47
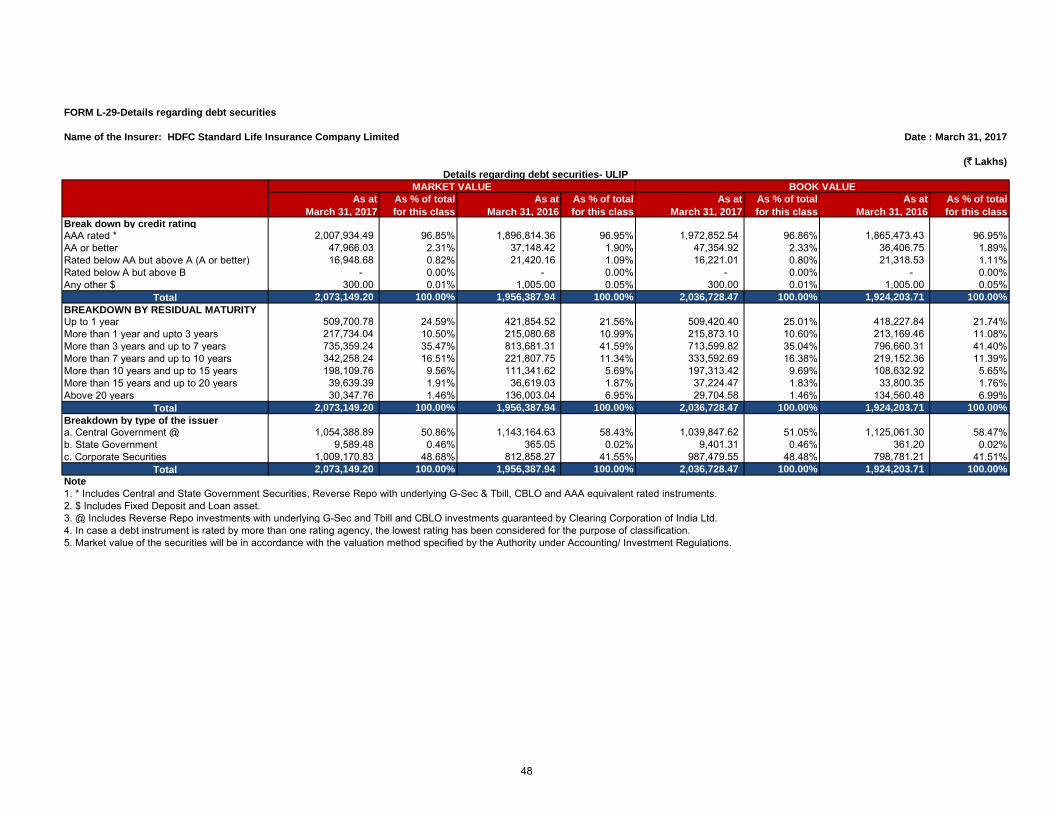
FORM L-29-Details regarding debt securities
Name of the Insurer: HDFC Standard Life Insurance Company Limited Date : March 31, 2017
(` Lakhs)
As at
March 31, 2017
As % of total
for this class
As at
March 31, 2016
As % of total
for this class
As at
March 31, 2017
As % of total
for this class
As at
March 31, 2016
As % of total
for this class
Break down by credit rating
AAA rated * 2,007,934.49 96.85% 1,896,814.36 96.95% 1,972,852.54 96.86% 1,865,473.43 96.95%AA or better 47,966.03 2.31% 37,148.42 1.90% 47,354.92 2.33% 36,406.75 1.89%Rated below AA but above A (A or better) 16,948.68 0.82% 21,420.16 1.09% 16,221.01 0.80% 21,318.53 1.11%Rated below A but above B - 0.00% - 0.00% - 0.00% - 0.00%Any other $ 300.00 0.01% 1,005.00 0.05% 300.00 0.01% 1,005.00 0.05%
Total 2,073,149.20 100.00% 1,956,387.94 100.00% 2,036,728.47 100.00% 1,924,203.71 100.00%
BREAKDOWN BY RESIDUAL MATURITY
Up to 1 year 509,700.78 24.59% 421,854.52 21.56% 509,420.40 25.01% 418,227.84 21.74%More than 1 year and upto 3 years 217,734.04 10.50% 215,080.68 10.99% 215,873.10 10.60% 213,169.46 11.08%More than 3 years and up to 7 years 735,359.24 35.47% 813,681.31 41.59% 713,599.82 35.04% 796,660.31 41.40%More than 7 years and up to 10 years 342,258.24 16.51% 221,807.75 11.34% 333,592.69 16.38% 219,152.36 11.39%More than 10 years and up to 15 years 198,109.76 9.56% 111,341.62 5.69% 197,313.42 9.69% 108,632.92 5.65%More than 15 years and up to 20 years 39,639.39 1.91% 36,619.03 1.87% 37,224.47 1.83% 33,800.35 1.76%Above 20 years 30,347.76 1.46% 136,003.04 6.95% 29,704.58 1.46% 134,560.48 6.99%
Total 2,073,149.20 100.00% 1,956,387.94 100.00% 2,036,728.47 100.00% 1,924,203.71 100.00%
Breakdown by type of the issuer
a. Central Government @ 1,054,388.89 50.86% 1,143,164.63 58.43% 1,039,847.62 51.05% 1,125,061.30 58.47%b. State Government 9,589.48 0.46% 365.05 0.02% 9,401.31 0.46% 361.20 0.02%c. Corporate Securities 1,009,170.83 48.68% 812,858.27 41.55% 987,479.55 48.48% 798,781.21 41.51%
Total 2,073,149.20 100.00% 1,956,387.94 100.00% 2,036,728.47 100.00% 1,924,203.71 100.00%
Note
1. * Includes Central and State Government Securities, Reverse Repo with underlying G-Sec & Tbill, CBLO and AAA equivalent rated instruments.2. $ Includes Fixed Deposit and Loan asset.3. @ Includes Reverse Repo investments with underlying G-Sec and Tbill and CBLO investments guaranteed by Clearing Corporation of India Ltd.4. In case a debt instrument is rated by more than one rating agency, the lowest rating has been considered for the purpose of classification.5. Market value of the securities will be in accordance with the valuation method specified by the Authority under Accounting/ Investment Regulations.
Details regarding debt securities- ULIP
MARKET VALUE BOOK VALUE
48
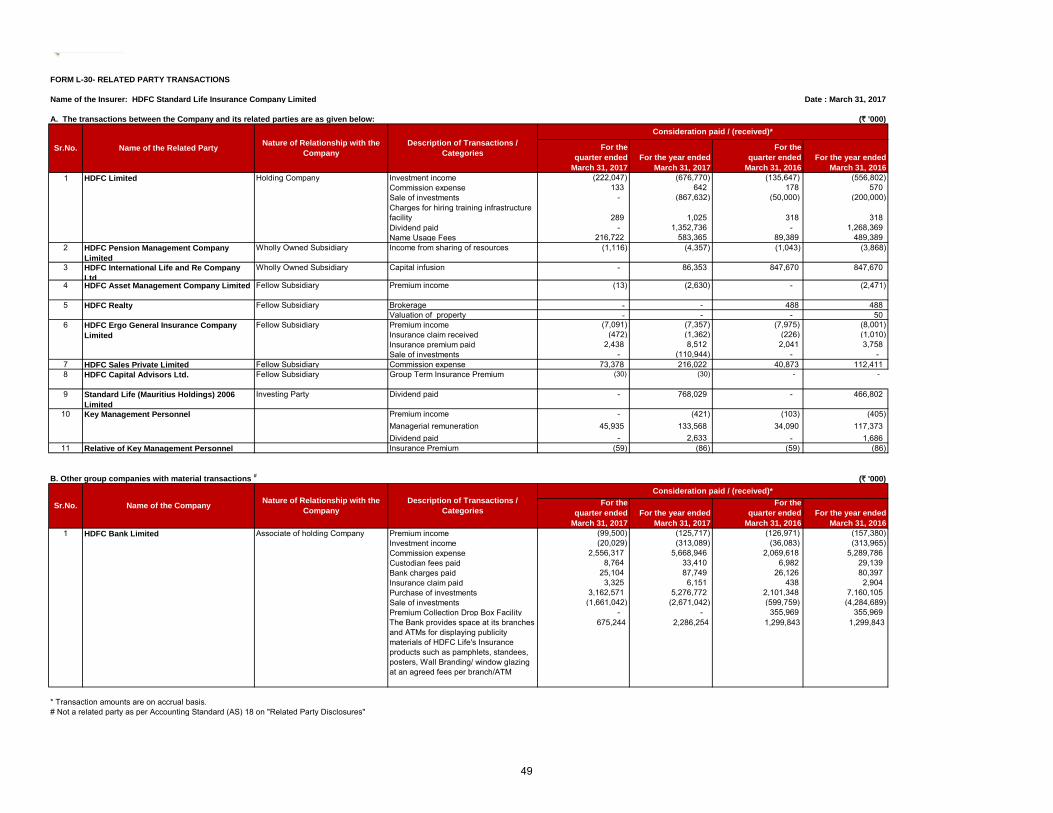
FORM L-30- RELATED PARTY TRANSACTIONS
Name of the Insurer: HDFC Standard Life Insurance Company Limited Date : March 31, 2017
A. The transactions between the Company and its related parties are as given below: (` '000)
For the
quarter ended
March 31, 2017
For the year ended
March 31, 2017
For the
quarter ended
March 31, 2016
For the year ended
March 31, 2016
Investment income (222,047) (676,770) (135,647) (556,802)Commission expense 133 642 178 570 Sale of investments - (867,632) (50,000) (200,000)Charges for hiring training infrastructure facility 289 1,025 318 318 Dividend paid - 1,352,736 - 1,268,369 Name Usage Fees 216,722 583,365 89,389 489,389
4 HDFC Asset Management Company Limited Fellow Subsidiary Premium income (13) (2,630) - (2,471)
Brokerage - - 488 488 Valuation of property - - - 50
6 Premium income (7,091) (7,357) (7,975) (8,001)Insurance claim received (472) (1,362) (226) (1,010)Insurance premium paid 2,438 8,512 2,041 3,758 Sale of investments - (110,944) - -
7 HDFC Sales Private Limited Fellow Subsidiary Commission expense 73,378 216,022 40,873 112,411 8 HDFC Capital Advisors Ltd. Fellow Subsidiary Group Term Insurance Premium (30) (30) - -
9 Standard Life (Mauritius Holdings) 2006
Limited
Investing Party Dividend paid - 768,029 - 466,802
Premium income - (421) (103) (405)Managerial remuneration 45,935 133,568 34,090 117,373 Dividend paid - 2,633 - 1,686
11 Relative of Key Management Personnel Insurance Premium (59) (86) (59) (86)
B. Other group companies with material transactions #
(` '000)
For the
quarter ended
March 31, 2017
For the year ended
March 31, 2017
For the
quarter ended
March 31, 2016
For the year ended
March 31, 2016
Premium income (99,500) (125,717) (126,971) (157,380)Investment income (20,029) (313,089) (36,083) (313,965)Commission expense 2,556,317 5,668,946 2,069,618 5,289,786 Custodian fees paid 8,764 33,410 6,982 29,139 Bank charges paid 25,104 87,749 26,126 80,397 Insurance claim paid 3,325 6,151 438 2,904 Purchase of investments 3,162,571 5,276,772 2,101,348 7,160,105 Sale of investments (1,661,042) (2,671,042) (599,759) (4,284,689)Premium Collection Drop Box Facility - - 355,969 355,969
* Transaction amounts are on accrual basis.# Not a related party as per Accounting Standard (AS) 18 on "Related Party Disclosures"
1,299,843
Wholly Owned Subsidiary Income from sharing of resources (4,357) (3,868)
Wholly Owned Subsidiary Capital infusion 86,353 847,670
Consideration paid / (received)*
Description of Transactions /
Categories
847,670 -
Fellow Subsidiary
1,299,843 The Bank provides space at its branches and ATMs for displaying publicity materials of HDFC Life's Insurance products such as pamphlets, standees, posters, Wall Branding/ window glazing at an agreed fees per branch/ATM
2,286,254
1
Sr.No.
3
675,244
1 HDFC Bank Limited Associate of holding Company
2
5
Sr.No. Name of the CompanyNature of Relationship with the
Company
10 Key Management Personnel
Consideration paid / (received)*
HDFC Limited
Description of Transactions /
Categories Name of the Related Party
Nature of Relationship with the
Company
Holding Company
HDFC Realty
(1,116) (1,043)
Fellow SubsidiaryHDFC Ergo General Insurance Company
Limited
HDFC International Life and Re Company
Ltd
HDFC Pension Management Company
Limited
49
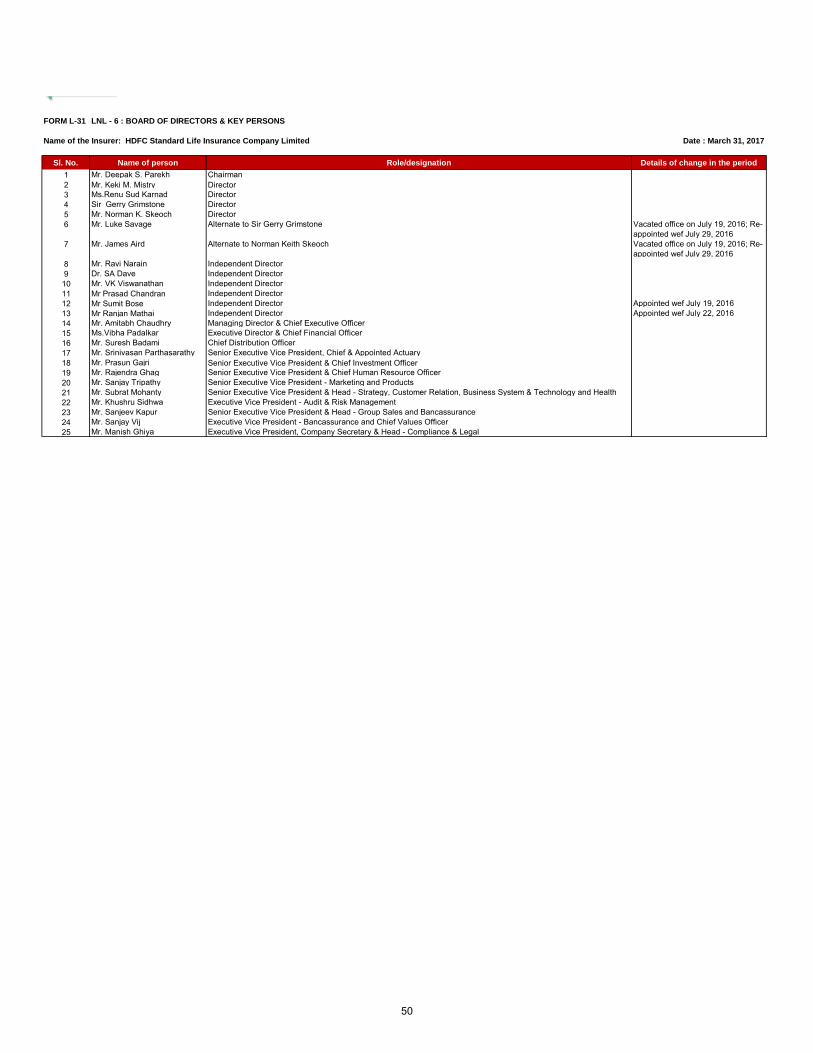
FORM L-31 LNL - 6 : BOARD OF DIRECTORS & KEY PERSONS
Name of the Insurer: HDFC Standard Life Insurance Company Limited Date : March 31, 2017
Sl. No. Name of person Role/designation Details of change in the period
1 Mr. Deepak S. Parekh Chairman2 Mr. Keki M. Mistry Director3 Ms.Renu Sud Karnad Director4 Sir Gerry Grimstone Director5 Mr. Norman K. Skeoch Director6 Mr. Luke Savage Alternate to Sir Gerry Grimstone Vacated office on July 19, 2016; Re-
appointed wef July 29, 20167 Mr. James Aird Alternate to Norman Keith Skeoch Vacated office on July 19, 2016; Re-
appointed wef July 29, 20168 Mr. Ravi Narain Independent Director9 Dr. SA Dave Independent Director
10 Mr. VK Viswanathan Independent Director11 Mr Prasad Chandran Independent Director12 Mr Sumit Bose Independent Director Appointed wef July 19, 201613 Mr Ranjan Mathai Independent Director Appointed wef July 22, 201614 Mr. Amitabh Chaudhry Managing Director & Chief Executive Officer15 Ms.Vibha Padalkar Executive Director & Chief Financial Officer 16 Mr. Suresh Badami Chief Distribution Officer17 Mr. Srinivasan Parthasarathy Senior Executive Vice President, Chief & Appointed Actuary18 Mr. Prasun Gajri Senior Executive Vice President & Chief Investment Officer19 Mr. Rajendra Ghag Senior Executive Vice President & Chief Human Resource Officer20 Mr. Sanjay Tripathy Senior Executive Vice President - Marketing and Products21 Mr. Subrat Mohanty Senior Executive Vice President & Head - Strategy, Customer Relation, Business System & Technology and Health22 Mr. Khushru Sidhwa Executive Vice President - Audit & Risk Management23 Mr. Sanjeev Kapur Senior Executive Vice President & Head - Group Sales and Bancassurance24 Mr. Sanjay Vij Executive Vice President - Bancassurance and Chief Values Officer25 Mr. Manish Ghiya Executive Vice President, Company Secretary & Head - Compliance & Legal
50
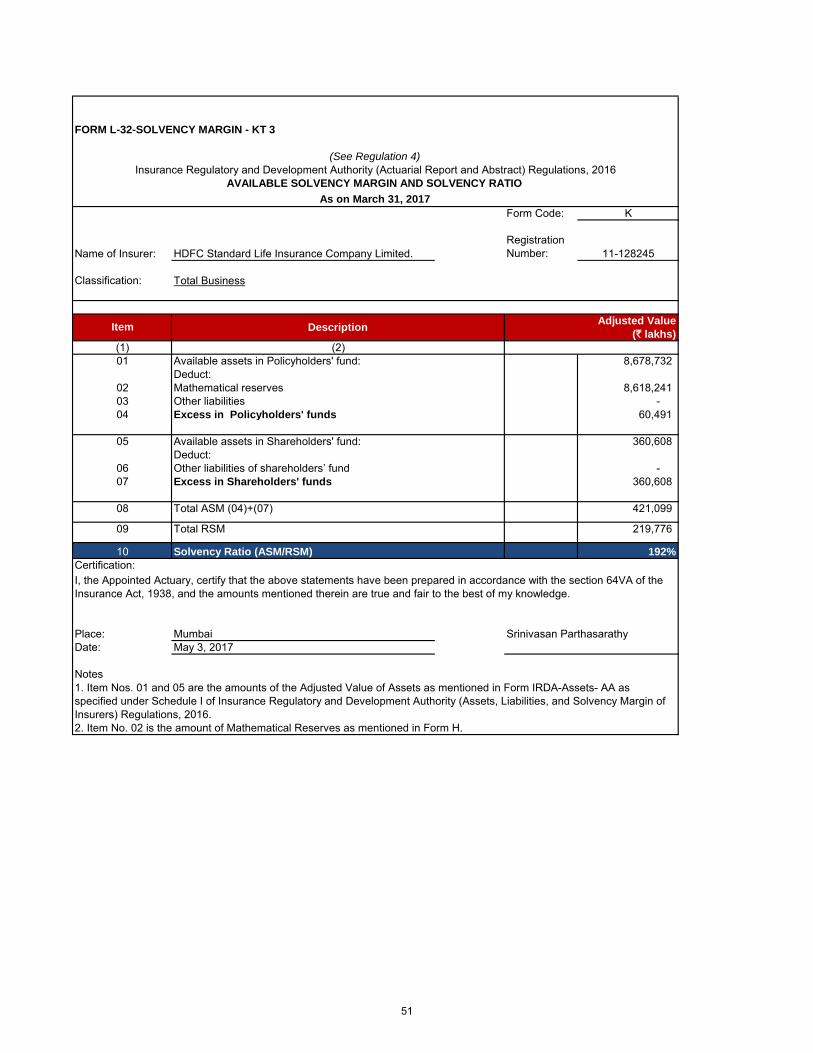
FORM L-32-SOLVENCY MARGIN - KT 3
AVAILABLE SOLVENCY MARGIN AND SOLVENCY RATIO
Form Code: K
Name of Insurer: HDFC Standard Life Insurance Company Limited.Registration Number: 11-128245
Classification: Total Business
(1)01 Available assets in Policyholders' fund: 8,678,732
Deduct:02 Mathematical reserves 8,618,241 03 Other liabilities - 04 Excess in Policyholders' funds 60,491
05 Available assets in Shareholders' fund: 360,608 Deduct:
06 Other liabilities of shareholders’ fund - 07 Excess in Shareholders' funds 360,608
08 Total ASM (04)+(07) 421,099
09 Total RSM 219,776
10 Solvency Ratio (ASM/RSM) 192%
Certification:
Place: Mumbai Srinivasan ParthasarathyDate: May 3, 2017
Notes
2. Item No. 02 is the amount of Mathematical Reserves as mentioned in Form H.
1. Item Nos. 01 and 05 are the amounts of the Adjusted Value of Assets as mentioned in Form IRDA-Assets- AA asspecified under Schedule I of Insurance Regulatory and Development Authority (Assets, Liabilities, and Solvency Margin of Insurers) Regulations, 2016.
I, the Appointed Actuary, certify that the above statements have been prepared in accordance with the section 64VA of the Insurance Act, 1938, and the amounts mentioned therein are true and fair to the best of my knowledge.
(` lakhs)
Adjusted Value
(2)
(See Regulation 4)
Insurance Regulatory and Development Authority (Actuarial Report and Abstract) Regulations, 2016
As on March 31, 2017
Item Description
51
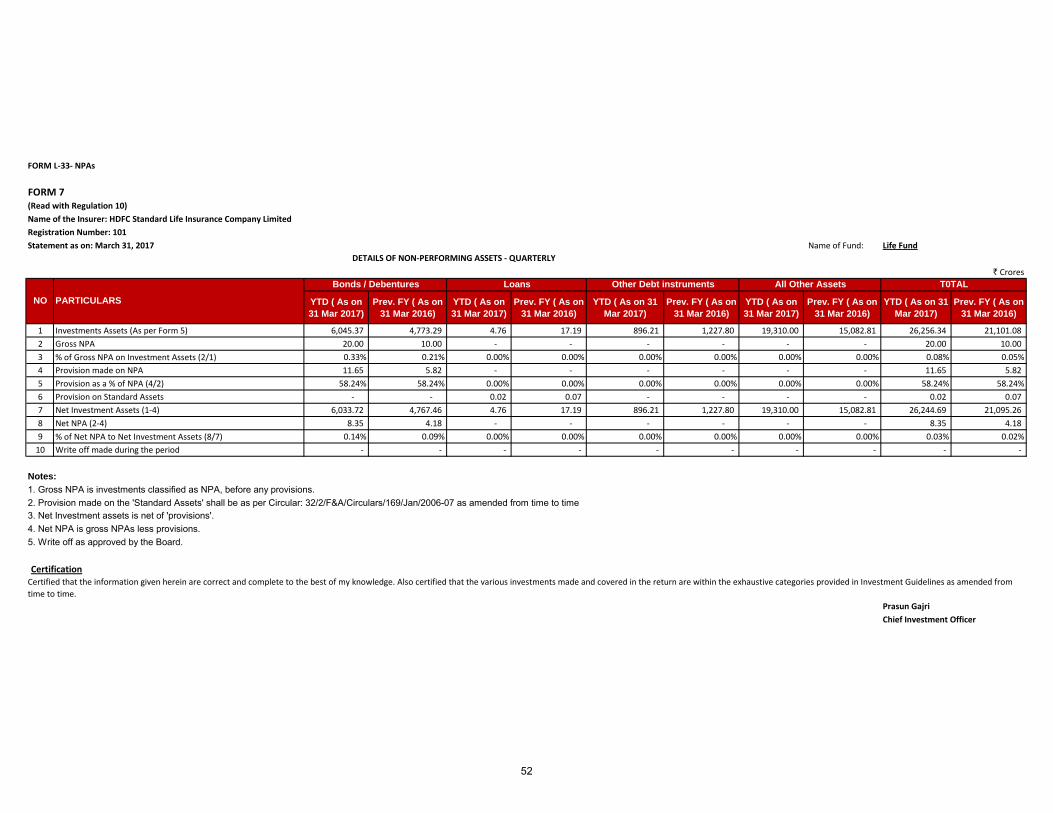
FORM L-33- NPAs
FORM 7(Read with Regulation 10)
Name of the Insurer: HDFC Standard Life Insurance Company Limited
Registration Number: 101
Statement as on: March 31, 2017 Name of Fund: Life Fund
` Crores
YTD ( As on
31 Mar 2017)
Prev. FY ( As on
31 Mar 2016)
YTD ( As on
31 Mar 2017)
Prev. FY ( As on
31 Mar 2016)
YTD ( As on 31
Mar 2017)
Prev. FY ( As on
31 Mar 2016)
YTD ( As on
31 Mar 2017)
Prev. FY ( As on
31 Mar 2016)
YTD ( As on 31
Mar 2017)
Prev. FY ( As on
31 Mar 2016)
1 Investments Assets (As per Form 5) 6,045.37 4,773.29 4.76 17.19 896.21 1,227.80 19,310.00 15,082.81 26,256.34 21,101.08
2 Gross NPA 20.00 10.00 - - - - - - 20.00 10.00
3 % of Gross NPA on Investment Assets (2/1) 0.33% 0.21% 0.00% 0.00% 0.00% 0.00% 0.00% 0.00% 0.08% 0.05%
4 Provision made on NPA 11.65 5.82 - - - - - - 11.65 5.82
5 Provision as a % of NPA (4/2) 58.24% 58.24% 0.00% 0.00% 0.00% 0.00% 0.00% 0.00% 58.24% 58.24%
6 Provision on Standard Assets - - 0.02 0.07 - - - - 0.02 0.07
7 Net Investment Assets (1-4) 6,033.72 4,767.46 4.76 17.19 896.21 1,227.80 19,310.00 15,082.81 26,244.69 21,095.26
8 Net NPA (2-4) 8.35 4.18 - - - - - - 8.35 4.18
9 % of Net NPA to Net Investment Assets (8/7) 0.14% 0.09% 0.00% 0.00% 0.00% 0.00% 0.00% 0.00% 0.03% 0.02%
10 Write off made during the period - - - - - - - - - -
Notes:
1. Gross NPA is investments classified as NPA, before any provisions.2. Provision made on the 'Standard Assets' shall be as per Circular: 32/2/F&A/Circulars/169/Jan/2006-07 as amended from time to time3. Net Investment assets is net of 'provisions'.4. Net NPA is gross NPAs less provisions.5. Write off as approved by the Board.
Certification
Prasun Gajri
Chief Investment Officer
T0TAL
Certified that the information given herein are correct and complete to the best of my knowledge. Also certified that the various investments made and covered in the return are within the exhaustive categories provided in Investment Guidelines as amended from
time to time.
DETAILS OF NON-PERFORMING ASSETS - QUARTERLY
NO PARTICULARS
Bonds / Debentures Loans Other Debt instruments All Other Assets
52
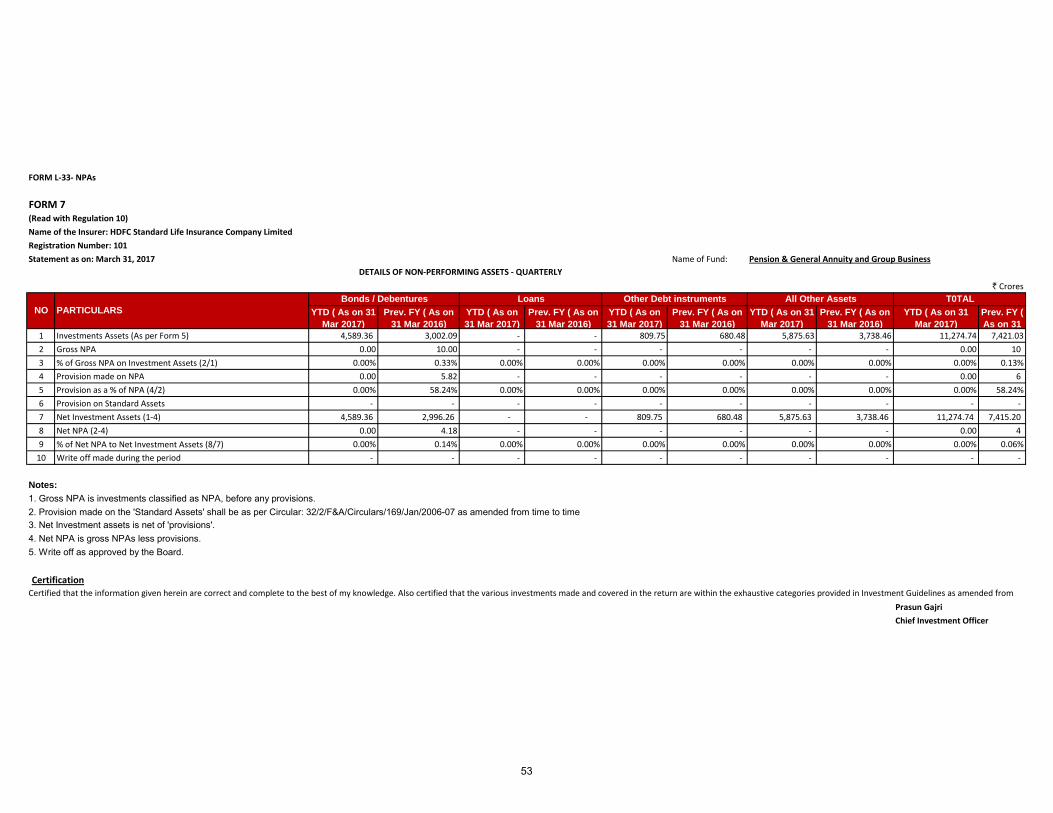
FORM L-33- NPAs
FORM 7(Read with Regulation 10)
Name of the Insurer: HDFC Standard Life Insurance Company Limited
Registration Number: 101
Statement as on: March 31, 2017 Name of Fund: Pension & General Annuity and Group Business
` Crores
YTD ( As on 31
Mar 2017)
Prev. FY ( As on
31 Mar 2016)
YTD ( As on
31 Mar 2017)
Prev. FY ( As on
31 Mar 2016)
YTD ( As on
31 Mar 2017)
Prev. FY ( As on
31 Mar 2016)
YTD ( As on 31
Mar 2017)
Prev. FY ( As on
31 Mar 2016)
YTD ( As on 31
Mar 2017)
Prev. FY (
As on 31
1 Investments Assets (As per Form 5) 4,589.36 3,002.09 - - 809.75 680.48 5,875.63 3,738.46 11,274.74 7,421.03
2 Gross NPA 0.00 10.00 - - - - - - 0.00 10
3 % of Gross NPA on Investment Assets (2/1) 0.00% 0.33% 0.00% 0.00% 0.00% 0.00% 0.00% 0.00% 0.00% 0.13%
4 Provision made on NPA 0.00 5.82 - - - - - - 0.00 6
5 Provision as a % of NPA (4/2) 0.00% 58.24% 0.00% 0.00% 0.00% 0.00% 0.00% 0.00% 0.00% 58.24%
6 Provision on Standard Assets - - - - - - - - - -
7 Net Investment Assets (1-4) 4,589.36 2,996.26 - - 809.75 680.48 5,875.63 3,738.46 11,274.74 7,415.20
8 Net NPA (2-4) 0.00 4.18 - - - - - - 0.00 4
9 % of Net NPA to Net Investment Assets (8/7) 0.00% 0.14% 0.00% 0.00% 0.00% 0.00% 0.00% 0.00% 0.00% 0.06%
10 Write off made during the period - - - - - - - - - -
Notes:
1. Gross NPA is investments classified as NPA, before any provisions.2. Provision made on the 'Standard Assets' shall be as per Circular: 32/2/F&A/Circulars/169/Jan/2006-07 as amended from time to time3. Net Investment assets is net of 'provisions'.4. Net NPA is gross NPAs less provisions.5. Write off as approved by the Board.
Certification
Prasun Gajri
Chief Investment Officer
T0TAL
Certified that the information given herein are correct and complete to the best of my knowledge. Also certified that the various investments made and covered in the return are within the exhaustive categories provided in Investment Guidelines as amended from
time to time.
DETAILS OF NON-PERFORMING ASSETS - QUARTERLY
NO PARTICULARS
Bonds / Debentures Loans Other Debt instruments All Other Assets
53
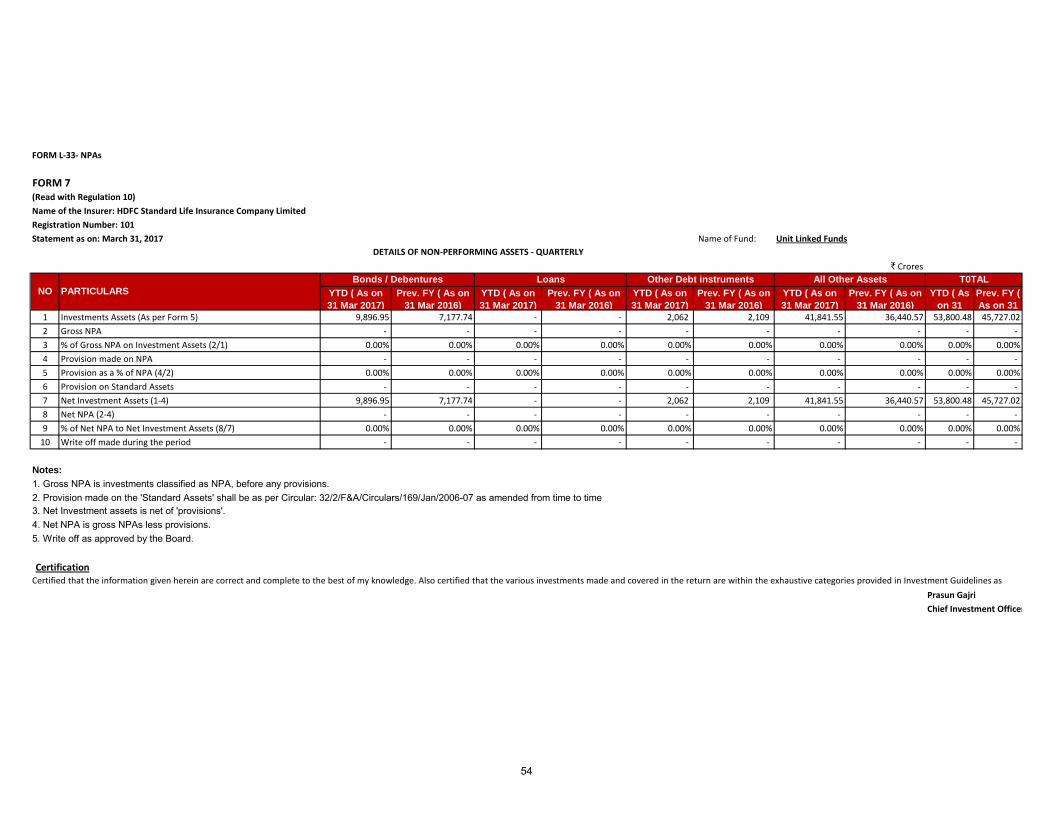
FORM L-33- NPAs
FORM 7(Read with Regulation 10)
Name of the Insurer: HDFC Standard Life Insurance Company Limited
Registration Number: 101
Statement as on: March 31, 2017 Name of Fund: Unit Linked Funds
` Crores
YTD ( As on
31 Mar 2017)
Prev. FY ( As on
31 Mar 2016)
YTD ( As on
31 Mar 2017)
Prev. FY ( As on
31 Mar 2016)
YTD ( As on
31 Mar 2017)
Prev. FY ( As on
31 Mar 2016)
YTD ( As on
31 Mar 2017)
Prev. FY ( As on
31 Mar 2016)
YTD ( As
on 31
Prev. FY (
As on 31
1 Investments Assets (As per Form 5) 9,896.95 7,177.74 - - 2,062 2,109 41,841.55 36,440.57 53,800.48 45,727.02
2 Gross NPA - - - - - - - - - -
3 % of Gross NPA on Investment Assets (2/1) 0.00% 0.00% 0.00% 0.00% 0.00% 0.00% 0.00% 0.00% 0.00% 0.00%
4 Provision made on NPA - - - - - - - - - -
5 Provision as a % of NPA (4/2) 0.00% 0.00% 0.00% 0.00% 0.00% 0.00% 0.00% 0.00% 0.00% 0.00%
6 Provision on Standard Assets - - - - - - - - - -
7 Net Investment Assets (1-4) 9,896.95 7,177.74 - - 2,062 2,109 41,841.55 36,440.57 53,800.48 45,727.02
8 Net NPA (2-4) - - - - - - - - - -
9 % of Net NPA to Net Investment Assets (8/7) 0.00% 0.00% 0.00% 0.00% 0.00% 0.00% 0.00% 0.00% 0.00% 0.00%
10 Write off made during the period - - - - - - - - - -
Notes:
1. Gross NPA is investments classified as NPA, before any provisions.2. Provision made on the 'Standard Assets' shall be as per Circular: 32/2/F&A/Circulars/169/Jan/2006-07 as amended from time to time3. Net Investment assets is net of 'provisions'.4. Net NPA is gross NPAs less provisions.5. Write off as approved by the Board.
Certification
Prasun Gajri
Chief Investment Officer
T0TAL
Certified that the information given herein are correct and complete to the best of my knowledge. Also certified that the various investments made and covered in the return are within the exhaustive categories provided in Investment Guidelines as
amended from time to time.
DETAILS OF NON-PERFORMING ASSETS - QUARTERLY
NO PARTICULARS
Bonds / Debentures Loans Other Debt instruments All Other Assets
54
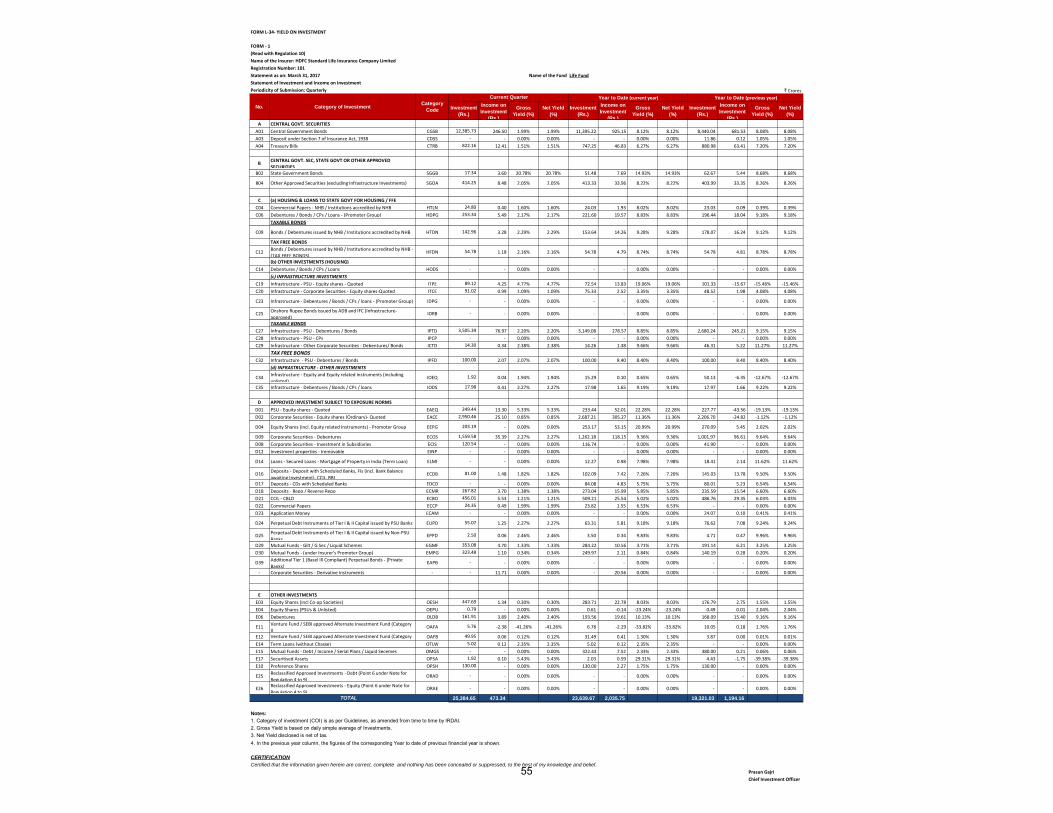
FORM L-34- YIELD ON INVESTMENT
FORM - 1
(Read with Regulation 10)
Name of the Insurer: HDFC Standard Life Insurance Company Limited
Registration Number: 101
Statement as on: March 31, 2017 Name of the Fund Life Fund
Statement of Investment and Income on Investment
Periodicity of Submission: Quarterly ` Crores
Investment
(Rs.)
Income on
Investment
(Rs.)
Gross
Yield (%)
Net Yield
(%)
Investment
(Rs.)
Income on
Investment
(Rs.)
Gross
Yield (%)
Net Yield
(%)
Investment
(Rs.)
Income on
Investment
(Rs.)
Gross
Yield (%)
Net Yield
(%)
A CENTRAL GOVT. SECURITIES
A01 Central Government Bonds CGSB 12,385.73 246.50 1.99% 1.99% 11,395.22 925.15 8.12% 8.12% 8,440.04 681.53 8.08% 8.08%
A03 Deposit under Section 7 of Insurance Act, 1938 CDSS - - 0.00% 0.00% - - 0.00% 0.00% 11.86 0.12 1.05% 1.05%
A04 Treasury Bills CTRB 822.16 12.41 1.51% 1.51% 747.25 46.83 6.27% 6.27% 880.98 63.41 7.20% 7.20%
BCENTRAL GOVT. SEC, STATE GOVT OR OTHER APPROVED
SECURITIESB02 State Government Bonds SGGB 17.34 3.60 20.78% 20.78% 51.48 7.69 14.93% 14.93% 62.67 5.44 8.68% 8.68%
B04 Other Approved Securities (excluding Infrastructure Investments) SGOA 414.25 8.48 2.05% 2.05% 413.33 33.96 8.22% 8.22% 403.99 33.35 8.26% 8.26%
C (a) HOUSING & LOANS TO STATE GOVT FOR HOUSING / FFE
C04 Commercial Papers - NHB / Institutions accredited by NHB HTLN 24.80 0.40 1.60% 1.60% 24.03 1.93 8.02% 8.02% 23.03 0.09 0.39% 0.39%
C06 Debentures / Bonds / CPs / Loans - (Promoter Group) HDPG 253.34 5.49 2.17% 2.17% 221.60 19.57 8.83% 8.83% 196.44 18.04 9.18% 9.18%
TAXABLE BONDS
C09 Bonds / Debentures issued by NHB / Institutions accredited by NHB HTDN 142.96 3.28 2.29% 2.29% 153.64 14.26 9.28% 9.28% 178.07 16.24 9.12% 9.12%
TAX FREE BONDS
C12Bonds / Debentures issued by NHB / Institutions accredited by NHB -
(TAX FREE BONDS)HFDN 54.78 1.18 2.16% 2.16% 54.78 4.79 8.74% 8.74% 54.78 4.81 8.78% 8.78%
(b) OTHER INVESTMENTS (HOUSING)
C14 Debentures / Bonds / CPs / Loans HODS - - 0.00% 0.00% - - 0.00% 0.00% - - 0.00% 0.00%
(c) INFRASTRUCTURE INVESTMENTS
C19 Infrastructure - PSU - Equity shares - Quoted ITPE 89.12 4.25 4.77% 4.77% 72.54 13.83 19.06% 19.06% 101.33 -15.67 -15.46% -15.46%
C20 Infrastructure - Corporate Securities - Equity shares-Quoted ITCE 91.02 0.99 1.09% 1.09% 75.33 2.52 3.35% 3.35% 48.52 1.98 4.08% 4.08%
C23 Infrastructure - Debentures / Bonds / CPs / loans - (Promoter Group) IDPG - - 0.00% 0.00% - - 0.00% 0.00% - - 0.00% 0.00%
C25Onshore Rupee Bonds issued by ADB and IFC (Infrastructure-
approved)IORB - - 0.00% 0.00% - - 0.00% 0.00% - - 0.00% 0.00%
TAXABLE BONDS
C27 Infrastructure - PSU - Debentures / Bonds IPTD 3,505.39 76.97 2.20% 2.20% 3,149.08 278.57 8.85% 8.85% 2,680.24 245.21 9.15% 9.15%
C28 Infrastructure - PSU - CPs IPCP - - 0.00% 0.00% - - 0.00% 0.00% - - 0.00% 0.00%
C29 Infrastructure - Other Corporate Securities - Debentures/ Bonds ICTD 14.30 0.34 2.38% 2.38% 14.26 1.38 9.66% 9.66% 46.31 5.22 11.27% 11.27%
TAX FREE BONDS
C32 Infrastructure - PSU - Debentures / Bonds IPFD 100.00 2.07 2.07% 2.07% 100.00 8.40 8.40% 8.40% 100.00 8.40 8.40% 8.40%
(d) INFRASTRUCTURE - OTHER INVESTMENTS
C34Infrastructure - Equity and Equity related instruments (including
unlisted)IOEQ 1.92 0.04 1.94% 1.94% 15.29 0.10 0.65% 0.65% 50.13 -6.35 -12.67% -12.67%
C35 Infrastructure - Debentures / Bonds / CPs / loans IODS 17.98 0.41 2.27% 2.27% 17.98 1.65 9.19% 9.19% 17.97 1.66 9.22% 9.22%
D APPROVED INVESTMENT SUBJECT TO EXPOSURE NORMS
D01 PSU - Equity shares - Quoted EAEQ 249.44 13.30 5.33% 5.33% 233.44 52.01 22.28% 22.28% 227.77 -43.56 -19.13% -19.13%
D02 Corporate Securities - Equity shares (Ordinary)- Quoted EACE 2,950.46 25.10 0.85% 0.85% 2,687.21 305.27 11.36% 11.36% 2,206.70 -24.82 -1.12% -1.12%
D04 Equity Shares (incl. Equity related Instruments) - Promoter Group EEPG 203.19 - 0.00% 0.00% 253.17 53.15 20.99% 20.99% 270.09 5.45 2.02% 2.02%
D09 Corporate Securities - Debentures ECOS 1,559.58 35.39 2.27% 2.27% 1,262.18 118.15 9.36% 9.36% 1,001.97 96.61 9.64% 9.64%
D08 Corporate Securities - Investment in Subsidiaries ECIS 120.54 - 0.00% 0.00% 116.74 - 0.00% 0.00% 41.90 - 0.00% 0.00%
D12 Investment properties - Immovable EINP - - 0.00% 0.00% - - 0.00% 0.00% - - 0.00% 0.00%
D14 Loans - Secured Loans - Mortgage of Property in India (Term Loan) ELMI - - 0.00% 0.00% 12.27 0.98 7.98% 7.98% 18.41 2.14 11.62% 11.62%
D16Deposits - Deposit with Scheduled Banks, FIs (incl. Bank Balance
awaiting Investment), CCIL, RBIECDB 81.00 1.48 1.82% 1.82% 102.09 7.42 7.26% 7.26% 145.03 13.78 9.50% 9.50%
D17 Deposits - CDs with Scheduled Banks EDCD - - 0.00% 0.00% 84.08 4.83 5.75% 5.75% 80.01 5.23 6.54% 6.54%
D18 Deposits - Repo / Reverse Repo ECMR 267.82 3.70 1.38% 1.38% 273.04 15.99 5.85% 5.85% 235.59 15.54 6.60% 6.60%
D21 CCIL - CBLO ECBO 456.01 5.53 1.21% 1.21% 509.21 25.54 5.02% 5.02% 486.76 29.35 6.03% 6.03%
D22 Commercial Papers ECCP 24.35 0.49 1.99% 1.99% 23.82 1.55 6.53% 6.53% - - 0.00% 0.00%
D23 Application Money ECAM - - 0.00% 0.00% - - 0.00% 0.00% 24.07 0.10 0.41% 0.41%
D24 Perpetual Debt Instruments of Tier I & II Capital issued by PSU Banks EUPD 55.07 1.25 2.27% 2.27% 63.31 5.81 9.18% 9.18% 76.62 7.08 9.24% 9.24%
D25Perpetual Debt Instruments of Tier I & II Capital issued by Non-PSU
BanksEPPD 2.50 0.06 2.46% 2.46% 3.50 0.34 9.83% 9.83% 4.71 0.47 9.96% 9.96%
D29 Mutual Funds - Gilt / G Sec / Liquid Schemes EGMF 353.08 4.70 1.33% 1.33% 284.22 10.56 3.71% 3.71% 191.14 6.21 3.25% 3.25%
D30 Mutual Funds - (under Insurer's Promoter Group) EMPG 323.48 1.10 0.34% 0.34% 249.97 2.11 0.84% 0.84% 140.19 0.28 0.20% 0.20%
D39Additional Tier 1 (Basel III Compliant) Perpetual Bonds - [Private
Banks]EAPB - - 0.00% 0.00% - - 0.00% 0.00% - - 0.00% 0.00%
- Corporate Securities - Derivative Instruments - - 11.71 0.00% 0.00% - 20.56 0.00% 0.00% - - 0.00% 0.00%
E OTHER INVESTMENTS
E03 Equity Shares (incl Co-op Societies) OESH 447.69 1.34 0.30% 0.30% 283.71 22.78 8.03% 8.03% 176.79 2.75 1.55% 1.55%
E04 Equity Shares (PSUs & Unlisted) OEPU 0.79 - 0.00% 0.00% 0.61 -0.14 -23.24% -23.24% 0.49 0.01 2.04% 2.04%
E06 Debentures OLDB 161.91 3.89 2.40% 2.40% 193.56 19.61 10.13% 10.13% 168.09 15.40 9.16% 9.16%
E11Venture Fund / SEBI approved Alternate Investment Fund (Category
I)OAFA 5.76 -2.38 -41.26% -41.26% 6.78 -2.29 -33.82% -33.82% 10.05 0.18 1.76% 1.76%
E12 Venture Fund / SEBI approved Alternate Investment Fund (Category
II)OAFB 49.95 0.06 0.12% 0.12% 31.49 0.41 1.30% 1.30% 3.87 0.00 0.01% 0.01%
E14 Term Loans (without Charge) OTLW 5.02 0.12 2.35% 2.35% 5.02 0.12 2.35% 2.35% - - 0.00% 0.00%
E15 Mutual Funds - Debt / Income / Serial Plans / Liquid Secemes OMGS - - 0.00% 0.00% 322.43 7.52 2.33% 2.33% 380.00 0.21 0.06% 0.06%
E17 Securitised Assets OPSA 1.92 0.10 5.43% 5.43% 2.03 0.59 29.31% 29.31% 4.43 -1.75 -39.38% -39.38%
E10 Preference Shares OPSH 130.00 - 0.00% 0.00% 130.00 2.27 1.75% 1.75% 130.00 - 0.00% 0.00%
E25Reclassified Approved Investments - Debt (Point 6 under Note for
Regulation 4 to 9)ORAD - - 0.00% 0.00% - - 0.00% 0.00% - - 0.00% 0.00%
E26Reclassified Approved Investments - Equity (Point 6 under Note for
Regulation 4 to 9)ORAE - - 0.00% 0.00% - - 0.00% 0.00% - - 0.00% 0.00%
25,384.65 473.34 23,639.67 2,035.75 19,321.03 1,194.16
Notes:
1. Category of investment (COI) is as per Guidelines, as amended from time to time by IRDAI.2. Gross Yield is based on daily simple average of Investments.3. Net Yield disclosed is net of tax.4. In the previous year column, the figures of the corresponding Year to date of previous financial year is shown.
CERTIFICATION
Certified that the information given herein are correct, complete and nothing has been concealed or suppressed, to the best of my knowledge and belief.
Prasun Gajri
Chief Investment Officer
TOTAL
No. Category of InvestmentCategory
Code
Current Quarter Year to Date (current year) Year to Date (previous year)
55
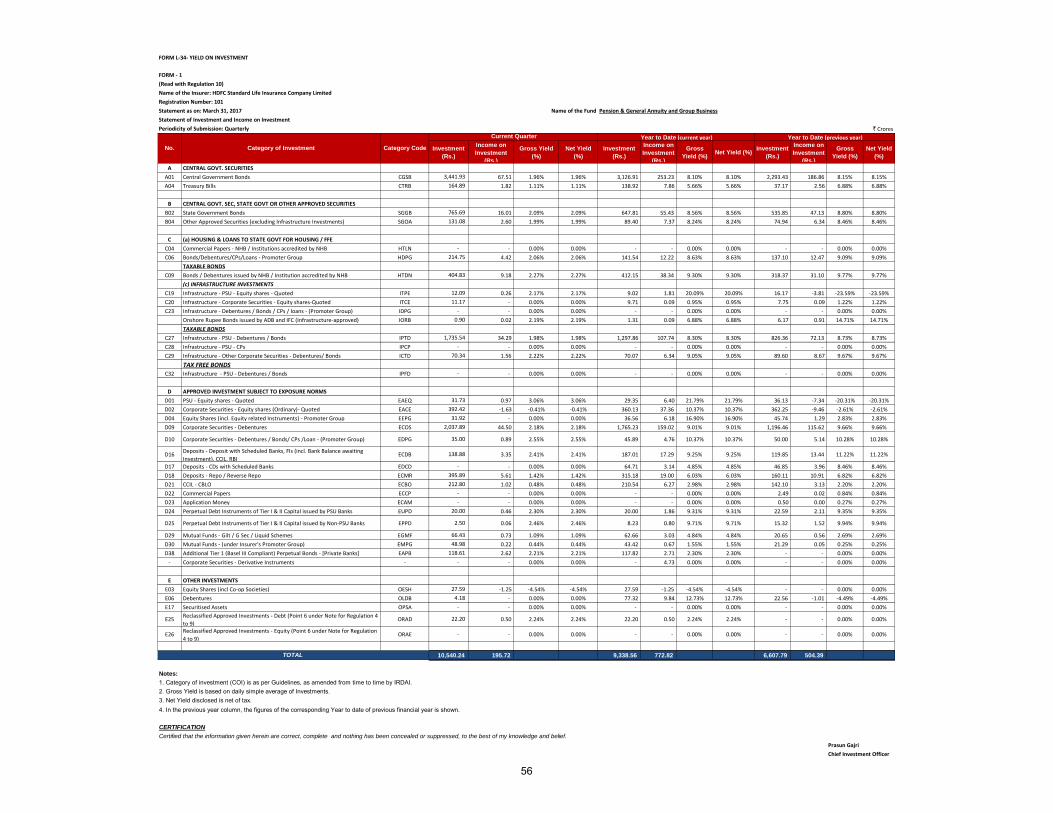
FORM L-34- YIELD ON INVESTMENT
FORM - 1
(Read with Regulation 10)
Name of the Insurer: HDFC Standard Life Insurance Company Limited
Registration Number: 101
Statement as on: March 31, 2017 Name of the Fund Pension & General Annuity and Group Business
Statement of Investment and Income on Investment
Periodicity of Submission: Quarterly ` Crores
Investment
(Rs.)
Income on
Investment
(Rs.)
Gross Yield
(%)
Net Yield
(%)
Investment
(Rs.)
Income on
Investment
(Rs.)
Gross
Yield (%)Net Yield (%)
Investment
(Rs.)
Income on
Investment
(Rs.)
Gross
Yield (%)
Net Yield
(%)
A CENTRAL GOVT. SECURITIES
A01 Central Government Bonds CGSB 3,441.93 67.51 1.96% 1.96% 3,126.91 253.23 8.10% 8.10% 2,293.43 186.86 8.15% 8.15%
A04 Treasury Bills CTRB 164.89 1.82 1.11% 1.11% 138.92 7.86 5.66% 5.66% 37.17 2.56 6.88% 6.88%
B CENTRAL GOVT. SEC, STATE GOVT OR OTHER APPROVED SECURITIES
B02 State Government Bonds SGGB 765.69 16.01 2.09% 2.09% 647.81 55.43 8.56% 8.56% 535.85 47.13 8.80% 8.80%
B04 Other Approved Securities (excluding Infrastructure Investments) SGOA 131.08 2.60 1.99% 1.99% 89.40 7.37 8.24% 8.24% 74.94 6.34 8.46% 8.46%
C (a) HOUSING & LOANS TO STATE GOVT FOR HOUSING / FFE
C04 Commercial Papers - NHB / Institutions accredited by NHB HTLN - - 0.00% 0.00% - - 0.00% 0.00% - - 0.00% 0.00%
C06 Bonds/Debentures/CPs/Loans - Promoter Group HDPG 214.75 4.42 2.06% 2.06% 141.54 12.22 8.63% 8.63% 137.10 12.47 9.09% 9.09%
TAXABLE BONDS
C09 Bonds / Debentures issued by NHB / Institution accredited by NHB HTDN 404.83 9.18 2.27% 2.27% 412.15 38.34 9.30% 9.30% 318.37 31.10 9.77% 9.77%
(c) INFRASTRUCTURE INVESTMENTS
C19 Infrastructure - PSU - Equity shares - Quoted ITPE 12.09 0.26 2.17% 2.17% 9.02 1.81 20.09% 20.09% 16.17 -3.81 -23.59% -23.59%
C20 Infrastructure - Corporate Securities - Equity shares-Quoted ITCE 11.17 - 0.00% 0.00% 9.71 0.09 0.95% 0.95% 7.75 0.09 1.22% 1.22%
C23 Infrastructure - Debentures / Bonds / CPs / loans - (Promoter Group) IDPG - - 0.00% 0.00% - - 0.00% 0.00% - - 0.00% 0.00%
Onshore Rupee Bonds issued by ADB and IFC (Infrastructure-approved) IORB 0.90 0.02 2.19% 2.19% 1.31 0.09 6.88% 6.88% 6.17 0.91 14.71% 14.71%
TAXABLE BONDS
C27 Infrastructure - PSU - Debentures / Bonds IPTD 1,735.54 34.29 1.98% 1.98% 1,297.86 107.74 8.30% 8.30% 826.36 72.13 8.73% 8.73%
C28 Infrastructure - PSU - CPs IPCP - - 0.00% 0.00% - - 0.00% 0.00% - - 0.00% 0.00%
C29 Infrastructure - Other Corporate Securities - Debentures/ Bonds ICTD 70.34 1.56 2.22% 2.22% 70.07 6.34 9.05% 9.05% 89.60 8.67 9.67% 9.67%
TAX FREE BONDS
C32 Infrastructure - PSU - Debentures / Bonds IPFD - - 0.00% 0.00% - - 0.00% 0.00% - - 0.00% 0.00%
D APPROVED INVESTMENT SUBJECT TO EXPOSURE NORMS
D01 PSU - Equity shares - Quoted EAEQ 31.73 0.97 3.06% 3.06% 29.35 6.40 21.79% 21.79% 36.13 -7.34 -20.31% -20.31%
D02 Corporate Securities - Equity shares (Ordinary)- Quoted EACE 392.42 -1.63 -0.41% -0.41% 360.13 37.36 10.37% 10.37% 362.25 -9.46 -2.61% -2.61%
D04 Equity Shares (incl. Equity related Instruments) - Promoter Group EEPG 31.92 - 0.00% 0.00% 36.56 6.18 16.90% 16.90% 45.74 1.29 2.83% 2.83%
D09 Corporate Securities - Debentures ECOS 2,037.89 44.50 2.18% 2.18% 1,765.23 159.02 9.01% 9.01% 1,196.46 115.62 9.66% 9.66%
D10 Corporate Securities - Debentures / Bonds/ CPs /Loan - (Promoter Group) EDPG 35.00 0.89 2.55% 2.55% 45.89 4.76 10.37% 10.37% 50.00 5.14 10.28% 10.28%
D16Deposits - Deposit with Scheduled Banks, FIs (incl. Bank Balance awaiting
Investment), CCIL, RBIECDB 138.88 3.35 2.41% 2.41% 187.01 17.29 9.25% 9.25% 119.85 13.44 11.22% 11.22%
D17 Deposits - CDs with Scheduled Banks EDCD - - 0.00% 0.00% 64.71 3.14 4.85% 4.85% 46.85 3.96 8.46% 8.46%
D18 Deposits - Repo / Reverse Repo ECMR 395.89 5.61 1.42% 1.42% 315.18 19.00 6.03% 6.03% 160.11 10.91 6.82% 6.82%
D21 CCIL - CBLO ECBO 212.80 1.02 0.48% 0.48% 210.54 6.27 2.98% 2.98% 142.10 3.13 2.20% 2.20%
D22 Commercial Papers ECCP - - 0.00% 0.00% - - 0.00% 0.00% 2.49 0.02 0.84% 0.84%
D23 Application Money ECAM - - 0.00% 0.00% - - 0.00% 0.00% 0.50 0.00 0.27% 0.27%
D24 Perpetual Debt Instruments of Tier I & II Capital issued by PSU Banks EUPD 20.00 0.46 2.30% 2.30% 20.00 1.86 9.31% 9.31% 22.59 2.11 9.35% 9.35%
D25 Perpetual Debt Instruments of Tier I & II Capital issued by Non-PSU Banks EPPD 2.50 0.06 2.46% 2.46% 8.23 0.80 9.71% 9.71% 15.32 1.52 9.94% 9.94%
D29 Mutual Funds - Gilt / G Sec / Liquid Schemes EGMF 66.43 0.73 1.09% 1.09% 62.66 3.03 4.84% 4.84% 20.65 0.56 2.69% 2.69%
D30 Mutual Funds - (under Insurer's Promoter Group) EMPG 48.98 0.22 0.44% 0.44% 43.42 0.67 1.55% 1.55% 21.29 0.05 0.25% 0.25%
D38 Additional Tier 1 (Basel III Compliant) Perpetual Bonds - [Private Banks] EAPB 118.61 2.62 2.21% 2.21% 117.82 2.71 2.30% 2.30% - - 0.00% 0.00%
- Corporate Securities - Derivative Instruments - - - 0.00% 0.00% - 4.73 0.00% 0.00% - - 0.00% 0.00%
E OTHER INVESTMENTS
E03 Equity Shares (incl Co-op Societies) OESH 27.59 -1.25 -4.54% -4.54% 27.59 -1.25 -4.54% -4.54% - - 0.00% 0.00%
E06 Debentures OLDB 4.18 - 0.00% 0.00% 77.32 9.84 12.73% 12.73% 22.56 -1.01 -4.49% -4.49%
E17 Securitised Assets OPSA - - 0.00% 0.00% - - 0.00% 0.00% - - 0.00% 0.00%
E25Reclassified Approved Investments - Debt (Point 6 under Note for Regulation 4
to 9)ORAD 22.20 0.50 2.24% 2.24% 22.20 0.50 2.24% 2.24% - - 0.00% 0.00%
E26Reclassified Approved Investments - Equity (Point 6 under Note for Regulation
4 to 9)ORAE - - 0.00% 0.00% - - 0.00% 0.00% - - 0.00% 0.00%
10,540.24 195.72 9,338.56 772.82 6,607.79 504.39
Notes:
1. Category of investment (COI) is as per Guidelines, as amended from time to time by IRDAI.2. Gross Yield is based on daily simple average of Investments.3. Net Yield disclosed is net of tax.4. In the previous year column, the figures of the corresponding Year to date of previous financial year is shown.
CERTIFICATION
Certified that the information given herein are correct, complete and nothing has been concealed or suppressed, to the best of my knowledge and belief.
Prasun Gajri
Chief Investment Officer
TOTAL
No. Category of Investment Category Code
Current Quarter Year to Date (current year) Year to Date (previous year)
56
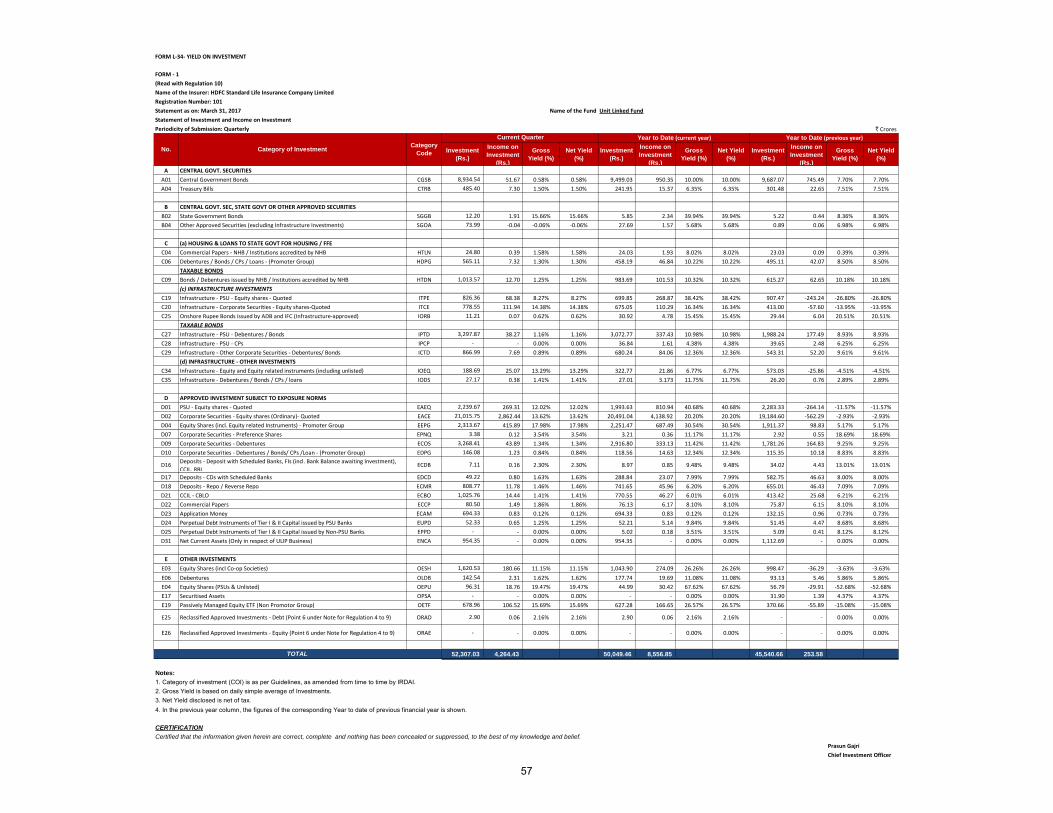
FORM L-34- YIELD ON INVESTMENT
FORM - 1
(Read with Regulation 10)
Name of the Insurer: HDFC Standard Life Insurance Company Limited
Registration Number: 101
Statement as on: March 31, 2017 Name of the Fund Unit Linked Fund
Statement of Investment and Income on Investment
Periodicity of Submission: Quarterly ` Crores
Investment
(Rs.)
Income on
Investment
(Rs.)
Gross
Yield (%)
Net Yield
(%)
Investment
(Rs.)
Income on
Investment
(Rs.)
Gross
Yield (%)
Net Yield
(%)
Investment
(Rs.)
Income on
Investment
(Rs.)
Gross
Yield (%)
Net Yield
(%)
A CENTRAL GOVT. SECURITIES
A01 Central Government Bonds CGSB 8,934.54 51.67 0.58% 0.58% 9,499.03 950.35 10.00% 10.00% 9,687.07 745.49 7.70% 7.70%
A04 Treasury Bills CTRB 485.40 7.30 1.50% 1.50% 241.95 15.37 6.35% 6.35% 301.48 22.65 7.51% 7.51%
B CENTRAL GOVT. SEC, STATE GOVT OR OTHER APPROVED SECURITIES
B02 State Government Bonds SGGB 12.20 1.91 15.66% 15.66% 5.85 2.34 39.94% 39.94% 5.22 0.44 8.36% 8.36%
B04 Other Approved Securities (excluding Infrastructure Investments) SGOA 73.99 -0.04 -0.06% -0.06% 27.69 1.57 5.68% 5.68% 0.89 0.06 6.98% 6.98%
C (a) HOUSING & LOANS TO STATE GOVT FOR HOUSING / FFE
C04 Commercial Papers - NHB / Institutions accredited by NHB HTLN 24.80 0.39 1.58% 1.58% 24.03 1.93 8.02% 8.02% 23.03 0.09 0.39% 0.39%
C06 Debentures / Bonds / CPs / Loans - (Promoter Group) HDPG 565.11 7.32 1.30% 1.30% 458.19 46.84 10.22% 10.22% 495.11 42.07 8.50% 8.50%
TAXABLE BONDS
C09 Bonds / Debentures issued by NHB / Institutions accredited by NHB HTDN 1,013.57 12.70 1.25% 1.25% 983.69 101.53 10.32% 10.32% 615.27 62.65 10.18% 10.18%
(c) INFRASTRUCTURE INVESTMENTS
C19 Infrastructure - PSU - Equity shares - Quoted ITPE 826.36 68.38 8.27% 8.27% 699.85 268.87 38.42% 38.42% 907.47 -243.24 -26.80% -26.80%
C20 Infrastructure - Corporate Securities - Equity shares-Quoted ITCE 778.55 111.94 14.38% 14.38% 675.05 110.29 16.34% 16.34% 413.00 -57.60 -13.95% -13.95%
C25 Onshore Rupee Bonds issued by ADB and IFC (Infrastructure-approved) IORB 11.21 0.07 0.62% 0.62% 30.92 4.78 15.45% 15.45% 29.44 6.04 20.51% 20.51%
TAXABLE BONDS
C27 Infrastructure - PSU - Debentures / Bonds IPTD 3,297.87 38.27 1.16% 1.16% 3,072.77 337.43 10.98% 10.98% 1,988.24 177.49 8.93% 8.93%
C28 Infrastructure - PSU - CPs IPCP - - 0.00% 0.00% 36.84 1.61 4.38% 4.38% 39.65 2.48 6.25% 6.25%
C29 Infrastructure - Other Corporate Securities - Debentures/ Bonds ICTD 866.99 7.69 0.89% 0.89% 680.24 84.06 12.36% 12.36% 543.31 52.20 9.61% 9.61%
(d) INFRASTRUCTURE - OTHER INVESTMENTS
C34 Infrastructure - Equity and Equity related instruments (including unlisted) IOEQ 188.69 25.07 13.29% 13.29% 322.77 21.86 6.77% 6.77% 573.03 -25.86 -4.51% -4.51%
C35 Infrastructure - Debentures / Bonds / CPs / loans IODS 27.17 0.38 1.41% 1.41% 27.01 3.173 11.75% 11.75% 26.20 0.76 2.89% 2.89%
D APPROVED INVESTMENT SUBJECT TO EXPOSURE NORMS
D01 PSU - Equity shares - Quoted EAEQ 2,239.67 269.31 12.02% 12.02% 1,993.63 810.94 40.68% 40.68% 2,283.33 -264.14 -11.57% -11.57%
D02 Corporate Securities - Equity shares (Ordinary)- Quoted EACE 21,015.75 2,862.44 13.62% 13.62% 20,491.04 4,138.92 20.20% 20.20% 19,184.60 -562.29 -2.93% -2.93%
D04 Equity Shares (incl. Equity related Instruments) - Promoter Group EEPG 2,313.67 415.89 17.98% 17.98% 2,251.47 687.49 30.54% 30.54% 1,911.37 98.83 5.17% 5.17%
D07 Corporate Securities - Preference Shares EPNQ 3.38 0.12 3.54% 3.54% 3.21 0.36 11.17% 11.17% 2.92 0.55 18.69% 18.69%
D09 Corporate Securities - Debentures ECOS 3,268.41 43.89 1.34% 1.34% 2,916.80 333.13 11.42% 11.42% 1,781.26 164.83 9.25% 9.25%
D10 Corporate Securities - Debentures / Bonds/ CPs /Loan - (Promoter Group) EDPG 146.08 1.23 0.84% 0.84% 118.56 14.63 12.34% 12.34% 115.35 10.18 8.83% 8.83%
D16Deposits - Deposit with Scheduled Banks, FIs (incl. Bank Balance awaiting Investment),
CCIL, RBIECDB 7.11 0.16 2.30% 2.30% 8.97 0.85 9.48% 9.48% 34.02 4.43 13.01% 13.01%
D17 Deposits - CDs with Scheduled Banks EDCD 49.22 0.80 1.63% 1.63% 288.84 23.07 7.99% 7.99% 582.75 46.63 8.00% 8.00%
D18 Deposits - Repo / Reverse Repo ECMR 808.77 11.78 1.46% 1.46% 741.65 45.96 6.20% 6.20% 655.01 46.43 7.09% 7.09%
D21 CCIL - CBLO ECBO 1,025.76 14.44 1.41% 1.41% 770.55 46.27 6.01% 6.01% 413.42 25.68 6.21% 6.21%
D22 Commercial Papers ECCP 80.50 1.49 1.86% 1.86% 76.13 6.17 8.10% 8.10% 75.87 6.15 8.10% 8.10%
D23 Application Money ECAM 694.33 0.83 0.12% 0.12% 694.33 0.83 0.12% 0.12% 132.15 0.96 0.73% 0.73%
D24 Perpetual Debt Instruments of Tier I & II Capital issued by PSU Banks EUPD 52.33 0.65 1.25% 1.25% 52.21 5.14 9.84% 9.84% 51.45 4.47 8.68% 8.68%
D25 Perpetual Debt Instruments of Tier I & II Capital issued by Non-PSU Banks EPPD - - 0.00% 0.00% 5.02 0.18 3.51% 3.51% 5.09 0.41 8.12% 8.12%
D31 Net Current Assets (Only in respect of ULIP Business) ENCA 954.35 - 0.00% 0.00% 954.35 - 0.00% 0.00% 1,112.69 - 0.00% 0.00%
E OTHER INVESTMENTS
E03 Equity Shares (incl Co-op Societies) OESH 1,620.53 180.66 11.15% 11.15% 1,043.90 274.09 26.26% 26.26% 998.47 -36.29 -3.63% -3.63%
E06 Debentures OLDB 142.54 2.31 1.62% 1.62% 177.74 19.69 11.08% 11.08% 93.13 5.46 5.86% 5.86%
E04 Equity Shares (PSUs & Unlisted) OEPU 96.31 18.76 19.47% 19.47% 44.99 30.42 67.62% 67.62% 56.79 -29.91 -52.68% -52.68%
E17 Securitised Assets OPSA - - 0.00% 0.00% - - 0.00% 0.00% 31.90 1.39 4.37% 4.37%
E19 Passively Managed Equity ETF (Non Promotor Group) OETF 678.96 106.52 15.69% 15.69% 627.28 166.65 26.57% 26.57% 370.66 -55.89 -15.08% -15.08%
E25 Reclassified Approved Investments - Debt (Point 6 under Note for Regulation 4 to 9) ORAD 2.90 0.06 2.16% 2.16% 2.90 0.06 2.16% 2.16% - - 0.00% 0.00%
E26 Reclassified Approved Investments - Equity (Point 6 under Note for Regulation 4 to 9) ORAE - - 0.00% 0.00% - - 0.00% 0.00% - - 0.00% 0.00%
52,307.03 4,264.43 50,049.46 8,556.85 45,540.66 253.58
Notes:
1. Category of investment (COI) is as per Guidelines, as amended from time to time by IRDAI.2. Gross Yield is based on daily simple average of Investments.3. Net Yield disclosed is net of tax.4. In the previous year column, the figures of the corresponding Year to date of previous financial year is shown.
CERTIFICATION
Certified that the information given herein are correct, complete and nothing has been concealed or suppressed, to the best of my knowledge and belief.
Prasun Gajri
Chief Investment Officer
TOTAL
No. Category of InvestmentCategory
Code
Current Quarter Year to Date (current year) Year to Date (previous year)
57
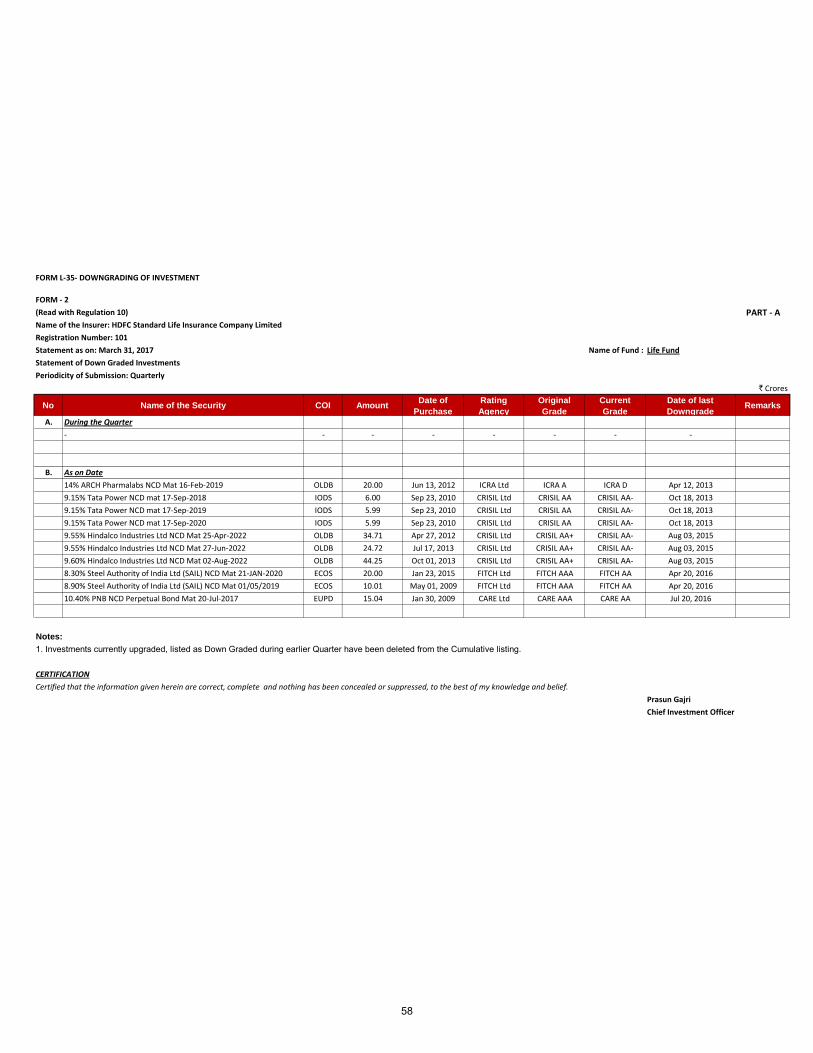
FORM L-35- DOWNGRADING OF INVESTMENT
FORM - 2
(Read with Regulation 10) PART - A
Name of the Insurer: HDFC Standard Life Insurance Company Limited
Registration Number: 101
Statement as on: March 31, 2017 Name of Fund : Life Fund
Statement of Down Graded Investments
Periodicity of Submission: Quarterly
` Crores
No Name of the Security COI AmountDate of
Purchase
Rating
Agency
Original
Grade
Current
Grade
Date of last
DowngradeRemarks
A. During the Quarter
- - - - - - - -
B. As on Date
14% ARCH Pharmalabs NCD Mat 16-Feb-2019 OLDB 20.00 Jun 13, 2012 ICRA Ltd ICRA A ICRA D Apr 12, 2013
9.15% Tata Power NCD mat 17-Sep-2018 IODS 6.00 Sep 23, 2010 CRISIL Ltd CRISIL AA CRISIL AA- Oct 18, 2013
9.15% Tata Power NCD mat 17-Sep-2019 IODS 5.99 Sep 23, 2010 CRISIL Ltd CRISIL AA CRISIL AA- Oct 18, 2013
9.15% Tata Power NCD mat 17-Sep-2020 IODS 5.99 Sep 23, 2010 CRISIL Ltd CRISIL AA CRISIL AA- Oct 18, 2013
9.55% Hindalco Industries Ltd NCD Mat 25-Apr-2022 OLDB 34.71 Apr 27, 2012 CRISIL Ltd CRISIL AA+ CRISIL AA- Aug 03, 2015
9.55% Hindalco Industries Ltd NCD Mat 27-Jun-2022 OLDB 24.72 Jul 17, 2013 CRISIL Ltd CRISIL AA+ CRISIL AA- Aug 03, 2015
9.60% Hindalco Industries Ltd NCD Mat 02-Aug-2022 OLDB 44.25 Oct 01, 2013 CRISIL Ltd CRISIL AA+ CRISIL AA- Aug 03, 2015
8.30% Steel Authority of India Ltd (SAIL) NCD Mat 21-JAN-2020 ECOS 20.00 Jan 23, 2015 FITCH Ltd FITCH AAA FITCH AA Apr 20, 2016
8.90% Steel Authority of India Ltd (SAIL) NCD Mat 01/05/2019 ECOS 10.01 May 01, 2009 FITCH Ltd FITCH AAA FITCH AA Apr 20, 2016
10.40% PNB NCD Perpetual Bond Mat 20-Jul-2017 EUPD 15.04 Jan 30, 2009 CARE Ltd CARE AAA CARE AA Jul 20, 2016
Notes:
1. Investments currently upgraded, listed as Down Graded during earlier Quarter have been deleted from the Cumulative listing.
CERTIFICATION
Certified that the information given herein are correct, complete and nothing has been concealed or suppressed, to the best of my knowledge and belief.
Prasun Gajri
Chief Investment Officer
58
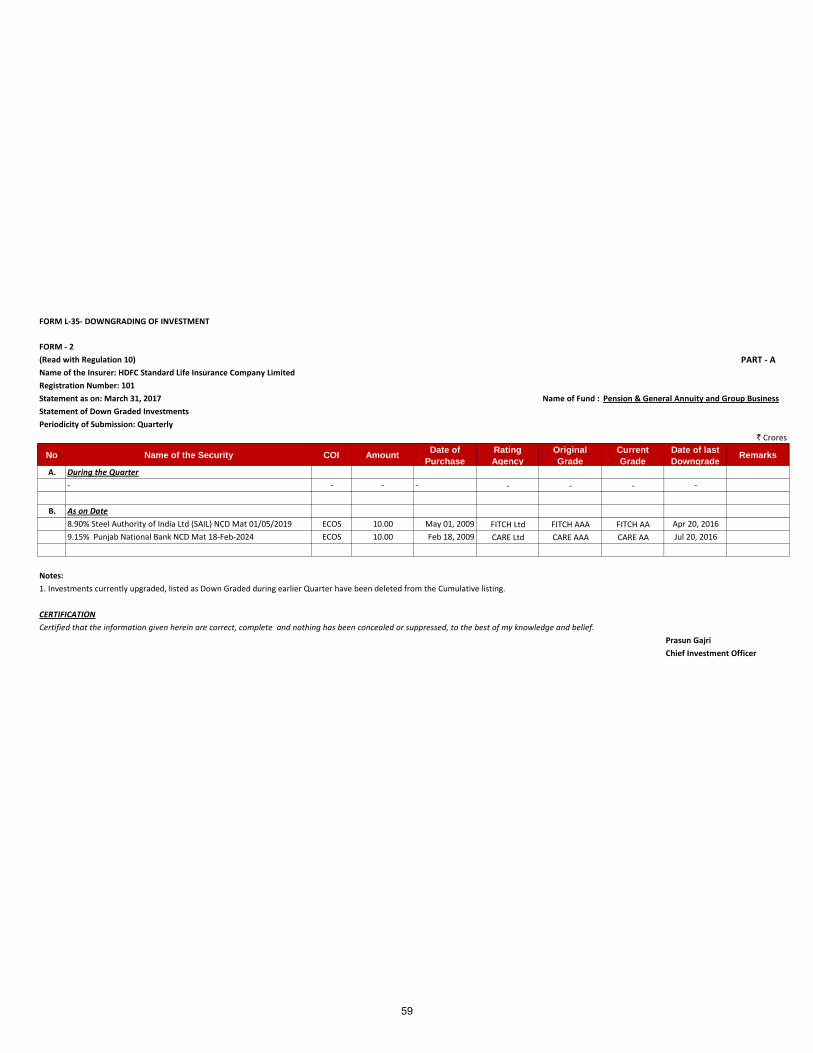
FORM L-35- DOWNGRADING OF INVESTMENT
FORM - 2
(Read with Regulation 10) PART - A
Name of the Insurer: HDFC Standard Life Insurance Company Limited
Registration Number: 101
Statement as on: March 31, 2017 Name of Fund : Pension & General Annuity and Group Business
Statement of Down Graded Investments
Periodicity of Submission: Quarterly
` Crores
No Name of the Security COI AmountDate of
Purchase
Rating
Agency
Original
Grade
Current
Grade
Date of last
DowngradeRemarks
A. During the Quarter
- - - - - - - -
B. As on Date
8.90% Steel Authority of India Ltd (SAIL) NCD Mat 01/05/2019 ECOS 10.00 May 01, 2009 FITCH Ltd FITCH AAA FITCH AA Apr 20, 2016
9.15% Punjab National Bank NCD Mat 18-Feb-2024 ECOS 10.00 Feb 18, 2009 CARE Ltd CARE AAA CARE AA Jul 20, 2016
Notes:
1. Investments currently upgraded, listed as Down Graded during earlier Quarter have been deleted from the Cumulative listing.
CERTIFICATION
Certified that the information given herein are correct, complete and nothing has been concealed or suppressed, to the best of my knowledge and belief.
Prasun Gajri
Chief Investment Officer
59
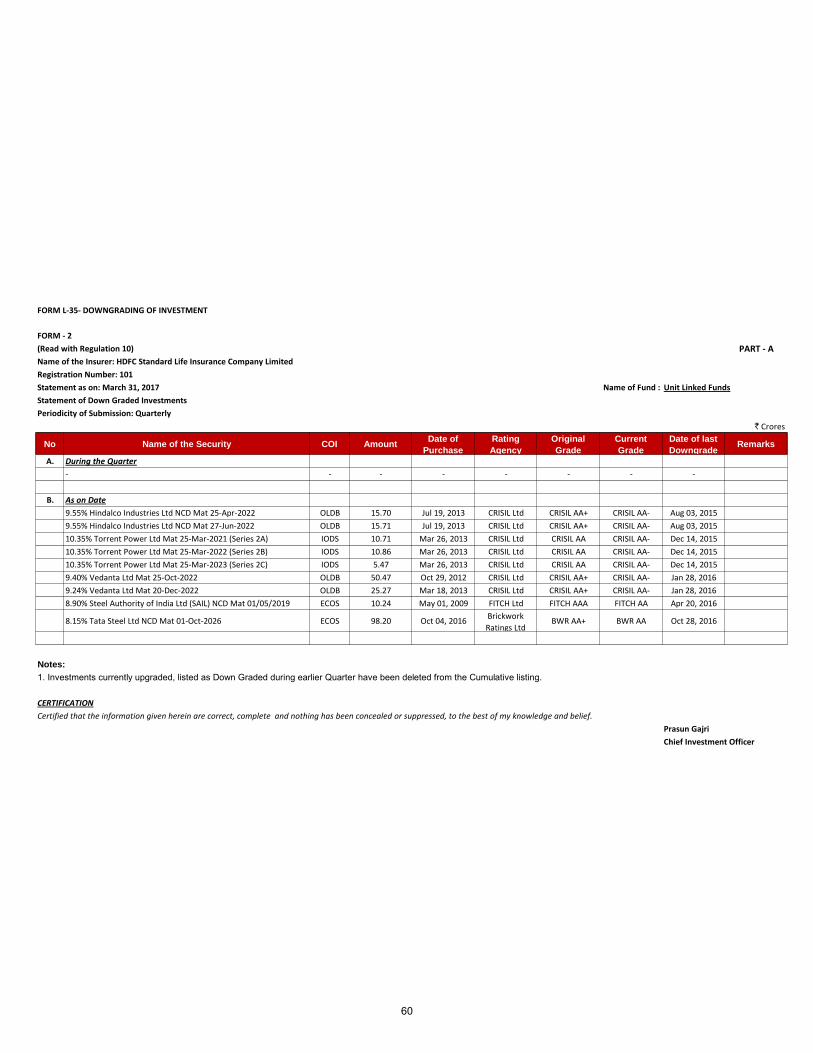
FORM L-35- DOWNGRADING OF INVESTMENT
FORM - 2
(Read with Regulation 10) PART - A
Name of the Insurer: HDFC Standard Life Insurance Company Limited
Registration Number: 101
Statement as on: March 31, 2017 Name of Fund : Unit Linked Funds
Statement of Down Graded Investments
Periodicity of Submission: Quarterly
` Crores
No Name of the Security COI AmountDate of
Purchase
Rating
Agency
Original
Grade
Current
Grade
Date of last
DowngradeRemarks
A. During the Quarter
- - - - - - - -
B. As on Date
9.55% Hindalco Industries Ltd NCD Mat 25-Apr-2022 OLDB 15.70 Jul 19, 2013 CRISIL Ltd CRISIL AA+ CRISIL AA- Aug 03, 2015
9.55% Hindalco Industries Ltd NCD Mat 27-Jun-2022 OLDB 15.71 Jul 19, 2013 CRISIL Ltd CRISIL AA+ CRISIL AA- Aug 03, 2015
10.35% Torrent Power Ltd Mat 25-Mar-2021 (Series 2A) IODS 10.71 Mar 26, 2013 CRISIL Ltd CRISIL AA CRISIL AA- Dec 14, 2015
10.35% Torrent Power Ltd Mat 25-Mar-2022 (Series 2B) IODS 10.86 Mar 26, 2013 CRISIL Ltd CRISIL AA CRISIL AA- Dec 14, 2015
10.35% Torrent Power Ltd Mat 25-Mar-2023 (Series 2C) IODS 5.47 Mar 26, 2013 CRISIL Ltd CRISIL AA CRISIL AA- Dec 14, 2015
9.40% Vedanta Ltd Mat 25-Oct-2022 OLDB 50.47 Oct 29, 2012 CRISIL Ltd CRISIL AA+ CRISIL AA- Jan 28, 2016
9.24% Vedanta Ltd Mat 20-Dec-2022 OLDB 25.27 Mar 18, 2013 CRISIL Ltd CRISIL AA+ CRISIL AA- Jan 28, 2016
8.90% Steel Authority of India Ltd (SAIL) NCD Mat 01/05/2019 ECOS 10.24 May 01, 2009 FITCH Ltd FITCH AAA FITCH AA Apr 20, 2016
8.15% Tata Steel Ltd NCD Mat 01-Oct-2026 ECOS 98.20 Oct 04, 2016Brickwork
Ratings LtdBWR AA+ BWR AA Oct 28, 2016
Notes:
1. Investments currently upgraded, listed as Down Graded during earlier Quarter have been deleted from the Cumulative listing.
CERTIFICATION
Certified that the information given herein are correct, complete and nothing has been concealed or suppressed, to the best of my knowledge and belief.
Prasun Gajri
Chief Investment Officer
60
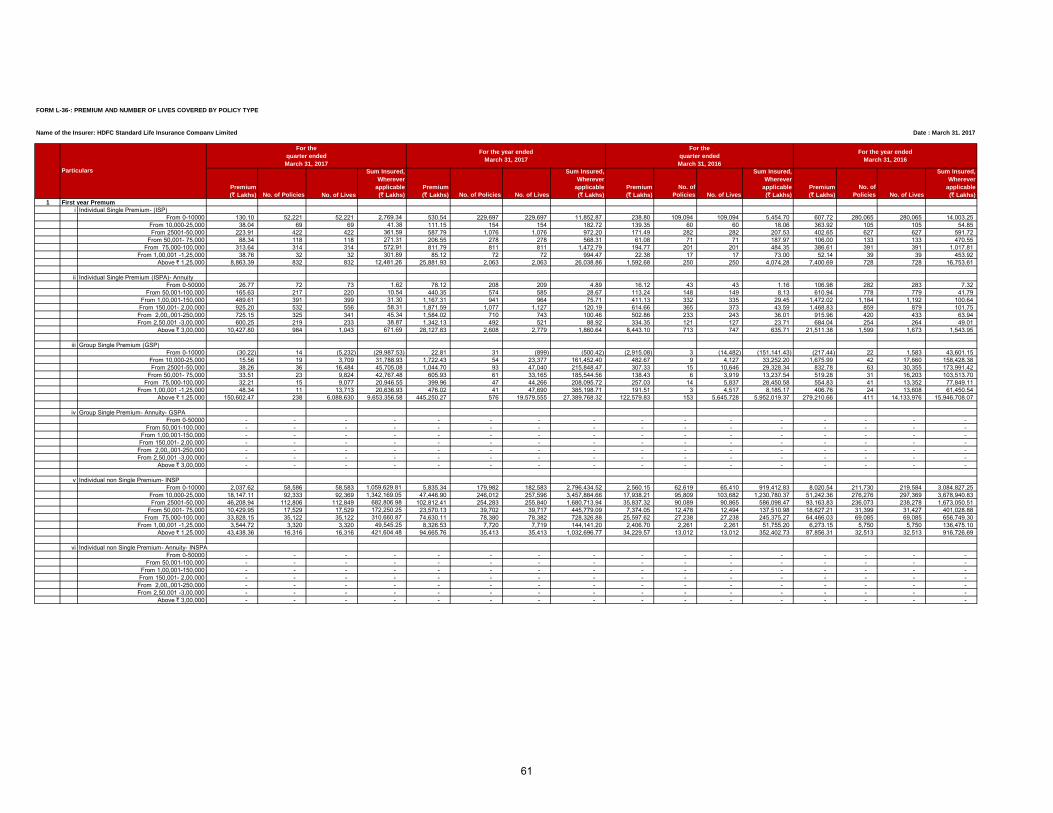
FORM L-36-: PREMIUM AND NUMBER OF LIVES COVERED BY POLICY TYPE
Name of the Insurer: HDFC Standard Life Insurance Company Limited Date : March 31, 2017
Premium
(` Lakhs) No. of Policies No. of Lives
Sum Insured,
Wherever
applicable
(` Lakhs)
Premium
(` Lakhs) No. of Policies No. of Lives
Sum Insured,
Wherever
applicable
(` Lakhs)
Premium
(` Lakhs)
No. of
Policies No. of Lives
Sum Insured,
Wherever
applicable
(` Lakhs)
Premium
(` Lakhs)
No. of
Policies No. of Lives
Sum Insured,
Wherever
applicable
(` Lakhs)
1 First year Premum
i Individual Single Premium- (ISP)From 0-10000 130.10 52,221 52,221 2,769.34 530.54 229,697 229,697 11,852.87 238.80 109,094 109,094 5,454.70 607.72 280,065 280,065 14,003.25
From 10,000-25,000 38.04 69 69 41.38 111.15 154 154 182.72 139.35 60 60 18.06 363.92 105 105 54.85 From 25001-50,000 223.91 422 422 361.59 587.79 1,076 1,076 972.20 171.49 282 282 207.53 402.65 627 627 591.72
From 50,001- 75,000 88.34 118 118 271.31 206.55 278 278 568.31 61.08 71 71 187.97 106.00 133 133 470.55 From 75,000-100,000 313.64 314 314 572.91 811.79 811 811 1,472.79 194.77 201 201 484.35 386.61 391 391 1,017.81
From 1,00,001 -1,25,000 38.76 32 32 301.89 85.12 72 72 994.47 22.38 17 17 73.00 52.14 39 39 453.92 Above ` 1,25,000 8,863.39 832 832 12,481.26 25,881.93 2,063 2,063 26,038.86 1,592.68 250 250 4,074.28 7,400.69 728 728 16,753.61
ii Individual Single Premium (ISPA)- AnnuityFrom 0-50000 26.77 72 73 1.62 78.12 208 209 4.89 16.12 43 43 1.16 106.98 282 283 7.32
From 50,001-100,000 165.63 217 220 10.54 440.35 574 585 28.67 113.24 148 149 8.13 610.94 778 779 41.79 From 1,00,001-150,000 489.61 391 399 31.30 1,167.31 941 964 75.71 411.13 332 335 29.45 1,472.02 1,184 1,192 100.64
From 150,001- 2,00,000 925.20 532 556 58.31 1,871.59 1,077 1,127 120.19 614.66 365 373 43.59 1,468.83 859 879 101.75 From 2,00,,001-250,000 725.15 325 341 45.34 1,584.02 710 743 100.46 502.86 233 243 36.01 915.96 420 433 63.94 From 2,50,001 -3,00,000 600.25 219 233 38.87 1,342.13 492 521 88.92 334.35 121 127 23.71 684.04 254 264 49.01
Above ` 3,00,000 10,427.80 984 1,043 671.69 28,127.83 2,608 2,779 1,860.64 8,443.10 713 747 635.71 21,511.38 1,599 1,673 1,543.95
iii Group Single Premium (GSP)From 0-10000 (30.22) 14 (5,232) (29,987.53) 22.81 31 (899) (500.42) (2,915.08) 3 (14,482) (151,141.43) (217.44) 22 1,583 43,601.15
From 10,000-25,000 15.56 19 3,709 31,788.93 1,722.43 54 23,377 161,452.40 482.67 9 4,127 33,252.20 1,675.99 42 17,660 158,428.38 From 25001-50,000 38.26 36 16,484 45,705.08 1,044.70 93 47,040 215,848.47 307.33 15 10,646 29,328.34 832.78 63 30,355 173,991.42
From 50,001- 75,000 33.51 23 9,824 42,767.48 605.93 61 33,165 185,544.56 138.43 6 3,919 13,237.54 519.28 31 16,203 103,513.70 From 75,000-100,000 32.21 15 9,077 20,946.55 399.96 47 44,266 208,095.72 257.03 14 5,837 28,450.58 554.83 41 13,352 77,849.11
From 1,00,001 -1,25,000 48.34 11 13,713 20,636.93 476.02 41 47,690 385,198.71 191.51 3 4,517 8,185.17 406.76 24 13,608 61,450.54 Above ` 1,25,000 150,602.47 238 6,088,630 9,653,356.58 445,250.27 576 19,579,555 27,389,768.32 122,579.83 153 5,645,728 5,952,019.37 279,210.66 411 14,133,976 15,946,708.07
iv Group Single Premium- Annuity- GSPAFrom 0-50000 - - - - - - - - - - - - - - - -
From 50,001-100,000 - - - - - - - - - - - - - - - - From 1,00,001-150,000 - - - - - - - - - - - - - - - -
From 150,001- 2,00,000 - - - - - - - - - - - - - - - - From 2,00,,001-250,000 - - - - - - - - - - - - - - - - From 2,50,001 -3,00,000 - - - - - - - - - - - - - - - -
Above ` 3,00,000 - - - - - - - - - - - - - - - -
v Individual non Single Premium- INSPFrom 0-10000 2,037.62 58,586 58,583 1,059,629.81 5,835.34 179,982 182,583 2,796,434.52 2,560.15 62,619 65,410 919,412.83 8,020.54 211,730 219,584 3,084,827.25
From 10,000-25,000 18,147.11 92,333 92,369 1,342,169.05 47,446.90 246,012 257,596 3,457,884.66 17,938.21 95,809 103,682 1,230,780.37 51,242.36 276,276 297,369 3,678,940.83 From 25001-50,000 46,208.94 112,806 112,849 682,806.98 102,812.41 254,283 255,840 1,680,713.94 35,837.32 90,089 90,865 586,098.47 93,163.83 236,073 238,278 1,673,050.51
From 50,001- 75,000 10,429.95 17,529 17,529 172,250.25 23,570.13 39,702 39,717 445,779.09 7,374.05 12,478 12,494 137,510.98 18,627.21 31,399 31,427 401,028.88 From 75,000-100,000 33,828.15 35,122 35,122 310,660.87 74,630.11 78,380 78,382 728,326.88 25,597.62 27,238 27,238 245,375.27 64,466.03 69,085 69,085 656,749.30
From 1,00,001 -1,25,000 3,544.72 3,320 3,320 49,545.25 8,326.53 7,720 7,719 144,141.20 2,406.70 2,261 2,261 51,755.20 6,273.15 5,750 5,750 136,475.10 Above ` 1,25,000 43,438.36 16,316 16,316 421,604.48 94,665.76 35,413 35,413 1,032,696.77 34,229.57 13,012 13,012 352,402.73 87,856.31 32,513 32,513 916,726.69
vi Individual non Single Premium- Annuity- INSPAFrom 0-50000 - - - - - - - - - - - - - - - -
From 50,001-100,000 - - - - - - - - - - - - - - - - From 1,00,001-150,000 - - - - - - - - - - - - - - - -
From 150,001- 2,00,000 - - - - - - - - - - - - - - - - From 2,00,,001-250,000 - - - - - - - - - - - - - - - - From 2,50,001 -3,00,000 - - - - - - - - - - - - - - - -
Above ` 3,00,000 - - - - - - - - - - - - - - - -
For the
quarter ended
March 31, 2017
For the
quarter ended
March 31, 2016Particulars
For the year ended
March 31, 2017
For the year ended
March 31, 2016
61
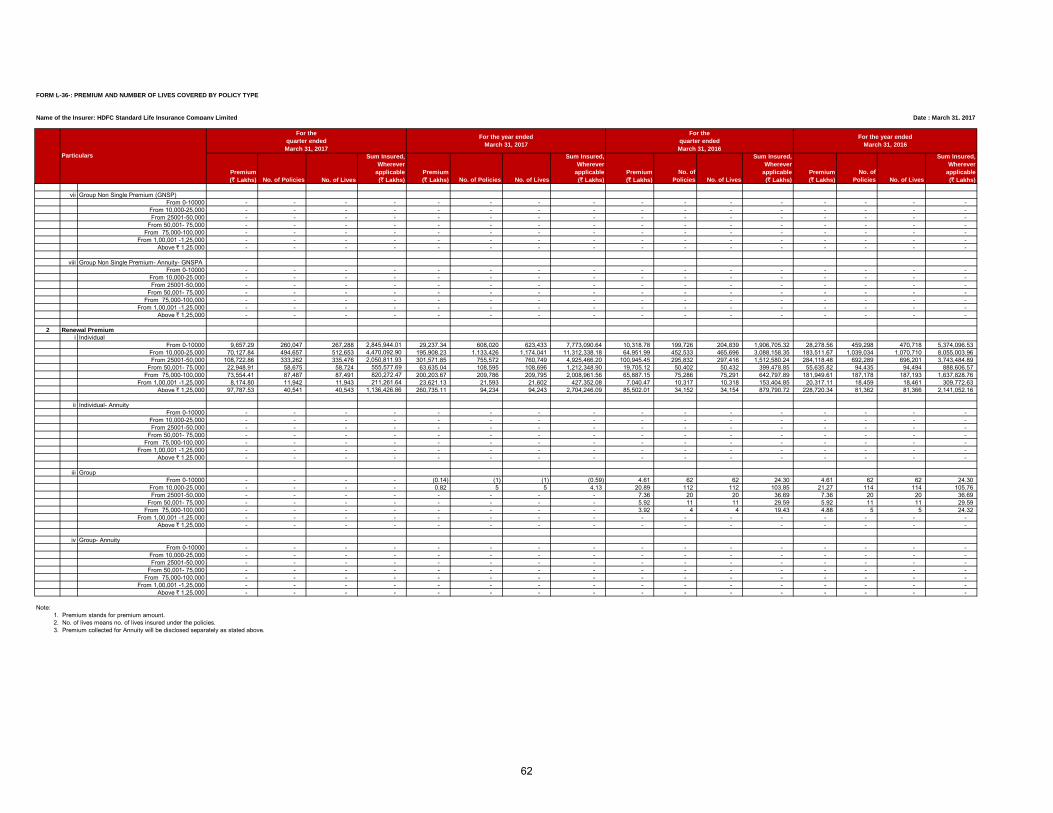
FORM L-36-: PREMIUM AND NUMBER OF LIVES COVERED BY POLICY TYPE
Name of the Insurer: HDFC Standard Life Insurance Company Limited Date : March 31, 2017
Premium
(` Lakhs) No. of Policies No. of Lives
Sum Insured,
Wherever
applicable
(` Lakhs)
Premium
(` Lakhs) No. of Policies No. of Lives
Sum Insured,
Wherever
applicable
(` Lakhs)
Premium
(` Lakhs)
No. of
Policies No. of Lives
Sum Insured,
Wherever
applicable
(` Lakhs)
Premium
(` Lakhs)
No. of
Policies No. of Lives
Sum Insured,
Wherever
applicable
(` Lakhs)
For the
quarter ended
March 31, 2017
For the
quarter ended
March 31, 2016Particulars
For the year ended
March 31, 2017
For the year ended
March 31, 2016
vii Group Non Single Premium (GNSP)From 0-10000 - - - - - - - - - - - - - - - -
From 10,000-25,000 - - - - - - - - - - - - - - - - From 25001-50,000 - - - - - - - - - - - - - - - -
From 50,001- 75,000 - - - - - - - - - - - - - - - - From 75,000-100,000 - - - - - - - - - - - - - - - -
From 1,00,001 -1,25,000 - - - - - - - - - - - - - - - - Above ` 1,25,000 - - - - - - - - - - - - - - - -
viii Group Non Single Premium- Annuity- GNSPAFrom 0-10000 - - - - - - - - - - - - - - - -
From 10,000-25,000 - - - - - - - - - - - - - - - - From 25001-50,000 - - - - - - - - - - - - - - - -
From 50,001- 75,000 - - - - - - - - - - - - - - - - From 75,000-100,000 - - - - - - - - - - - - - - - -
From 1,00,001 -1,25,000 - - - - - - - - - - - - - - - - Above ` 1,25,000 - - - - - - - - - - - - - - - -
2 Renewal Premium
i Individual From 0-10000 9,657.29 260,047 267,288 2,845,944.01 29,237.34 608,020 623,433 7,773,090.64 10,318.78 199,726 204,839 1,906,705.32 28,278.56 459,298 470,718 5,374,096.53
From 10,000-25,000 70,127.84 494,657 512,653 4,470,092.90 195,908.23 1,133,426 1,174,041 11,312,338.18 64,951.99 452,533 465,696 3,088,158.35 183,511.67 1,039,034 1,070,710 8,055,003.96 From 25001-50,000 108,722.86 333,262 335,476 2,050,811.93 301,571.85 755,572 760,749 4,925,466.20 100,945.45 295,832 297,416 1,512,580.24 284,118.48 692,289 696,201 3,743,484.89
From 50,001- 75,000 22,948.91 58,675 58,724 555,577.69 63,635.04 108,595 108,696 1,212,348.90 19,705.12 50,402 50,432 399,478.85 55,635.82 94,435 94,494 888,606.57 From 75,000-100,000 73,554.41 87,487 87,491 820,272.47 200,203.67 209,786 209,795 2,008,961.56 65,887.15 75,286 75,291 642,797.89 181,949.61 187,178 187,193 1,637,828.76
From 1,00,001 -1,25,000 8,174.80 11,942 11,943 211,261.64 23,621.13 21,593 21,602 427,352.08 7,040.47 10,317 10,318 153,404.85 20,317.11 18,459 18,461 309,772.63 Above ` 1,25,000 97,787.53 40,541 40,543 1,136,426.86 260,735.11 94,234 94,243 2,704,246.09 85,502.01 34,152 34,154 879,790.72 228,720.34 81,362 81,366 2,141,052.16
ii Individual- AnnuityFrom 0-10000 - - - - - - - - - - - - - - - -
From 10,000-25,000 - - - - - - - - - - - - - - - - From 25001-50,000 - - - - - - - - - - - - - - - -
From 50,001- 75,000 - - - - - - - - - - - - - - - - From 75,000-100,000 - - - - - - - - - - - - - - - -
From 1,00,001 -1,25,000 - - - - - - - - - - - - - - - - Above ` 1,25,000 - - - - - - - - - - - - - - - -
iii GroupFrom 0-10000 - - - - (0.14) (1) (1) (0.59) 4.61 62 62 24.30 4.61 62 62 24.30
From 10,000-25,000 - - - - 0.82 5 5 4.13 20.89 112 112 103.85 21.27 114 114 105.76 From 25001-50,000 - - - - - - - - 7.36 20 20 36.69 7.36 20 20 36.69
From 50,001- 75,000 - - - - - - - - 5.92 11 11 29.59 5.92 11 11 29.59 From 75,000-100,000 - - - - - - - - 3.92 4 4 19.43 4.88 5 5 24.32
From 1,00,001 -1,25,000 - - - - - - - - - - - - - - - - Above ` 1,25,000 - - - - - - - - - - - - - - - -
iv Group- AnnuityFrom 0-10000 - - - - - - - - - - - - - - - -
From 10,000-25,000 - - - - - - - - - - - - - - - - From 25001-50,000 - - - - - - - - - - - - - - - -
From 50,001- 75,000 - - - - - - - - - - - - - - - - From 75,000-100,000 - - - - - - - - - - - - - - - -
From 1,00,001 -1,25,000 - - - - - - - - - - - - - - - - Above ` 1,25,000 - - - - - - - - - - - - - - - -
Note:1. Premium stands for premium amount.2. No. of lives means no. of lives insured under the policies.3. Premium collected for Annuity will be disclosed separately as stated above.
62
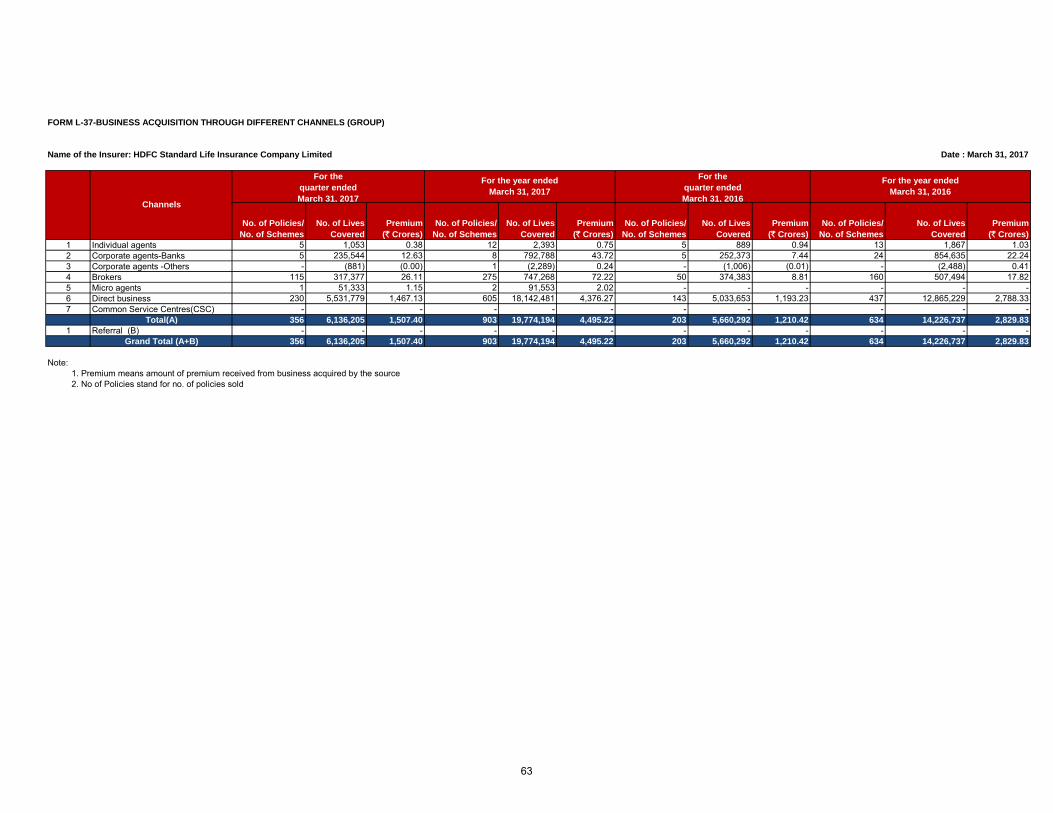
FORM L-37-BUSINESS ACQUISITION THROUGH DIFFERENT CHANNELS (GROUP)
Name of the Insurer: HDFC Standard Life Insurance Company Limited Date : March 31, 2017
1 Individual agents 5 1,053 0.38 12 2,393 0.75 5 889 0.94 13 1,867 1.03 2 Corporate agents-Banks 5 235,544 12.63 8 792,788 43.72 5 252,373 7.44 24 854,635 22.24 3 Corporate agents -Others - (881) (0.00) 1 (2,289) 0.24 - (1,006) (0.01) - (2,488) 0.41 4 Brokers 115 317,377 26.11 275 747,268 72.22 50 374,383 8.81 160 507,494 17.82 5 Micro agents 1 51,333 1.15 2 91,553 2.02 - - - - - - 6 Direct business 230 5,531,779 1,467.13 605 18,142,481 4,376.27 143 5,033,653 1,193.23 437 12,865,229 2,788.33 7 Common Service Centres(CSC) - - - - - - - - - -
Total(A) 356 6,136,205 1,507.40 903 19,774,194 4,495.22 203 5,660,292 1,210.42 634 14,226,737 2,829.83
1 Referral (B) - - - - - - - - - - - - Grand Total (A+B) 356 6,136,205 1,507.40 903 19,774,194 4,495.22 203 5,660,292 1,210.42 634 14,226,737 2,829.83
Note:1. Premium means amount of premium received from business acquired by the source2. No of Policies stand for no. of policies sold
For the year ended
March 31, 2016
No. of Policies/
No. of Schemes
No. of Lives
Covered
No. of Policies/
No. of Schemes
Channels
For the
quarter ended
March 31, 2017
Premium
(` Crores)
For the year ended
March 31, 2017
No. of Policies/
No. of Schemes
Premium
(` Crores)
Premium
(` Crores)
No. of Lives
Covered
No. of Policies/
No. of Schemes
For the
quarter ended
March 31, 2016
No. of Lives
Covered
No. of Lives
Covered
Premium
(` Crores)
63
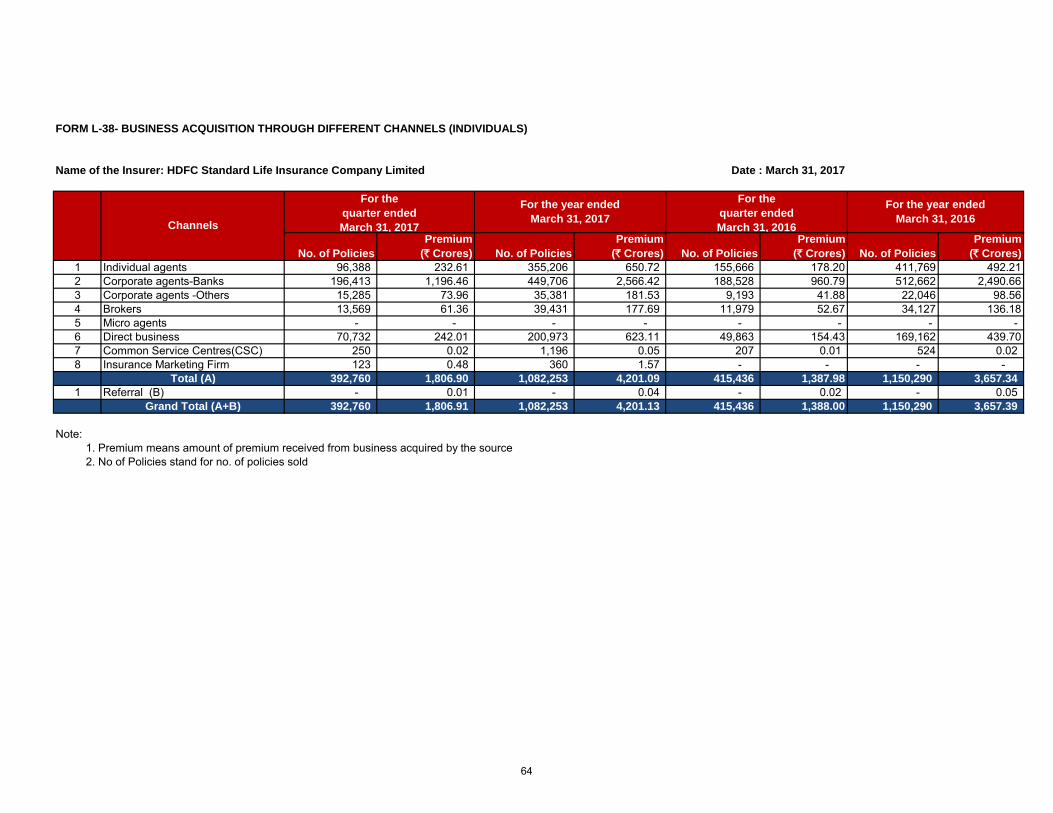
FORM L-38- BUSINESS ACQUISITION THROUGH DIFFERENT CHANNELS (INDIVIDUALS)
Name of the Insurer: HDFC Standard Life Insurance Company Limited Date : March 31, 2017
1 Individual agents 96,388 232.61 355,206 650.72 155,666 178.20 411,769 492.212 Corporate agents-Banks 196,413 1,196.46 449,706 2,566.42 188,528 960.79 512,662 2,490.663 Corporate agents -Others 15,285 73.96 35,381 181.53 9,193 41.88 22,046 98.564 Brokers 13,569 61.36 39,431 177.69 11,979 52.67 34,127 136.185 Micro agents - - - - - - - - 6 Direct business 70,732 242.01 200,973 623.11 49,863 154.43 169,162 439.707 Common Service Centres(CSC) 250 0.02 1,196 0.05 207 0.01 524 0.02 8 Insurance Marketing Firm 123 0.48 360 1.57 - - - -
Total (A) 392,760 1,806.90 1,082,253 4,201.09 415,436 1,387.98 1,150,290 3,657.34
1 Referral (B) - 0.01 - 0.04 - 0.02 - 0.05 Grand Total (A+B) 392,760 1,806.91 1,082,253 4,201.13 415,436 1,388.00 1,150,290 3,657.39
Note:1. Premium means amount of premium received from business acquired by the source2. No of Policies stand for no. of policies sold
For the year ended
March 31, 2016Channels
For the
quarter ended
March 31, 2017
For the
quarter ended
March 31, 2016
For the year ended
March 31, 2017
No. of Policies
Premium
(` Crores) No. of Policies
Premium
(` Crores)No. of Policies
Premium
(` Crores) No. of Policies
Premium
(` Crores)
64
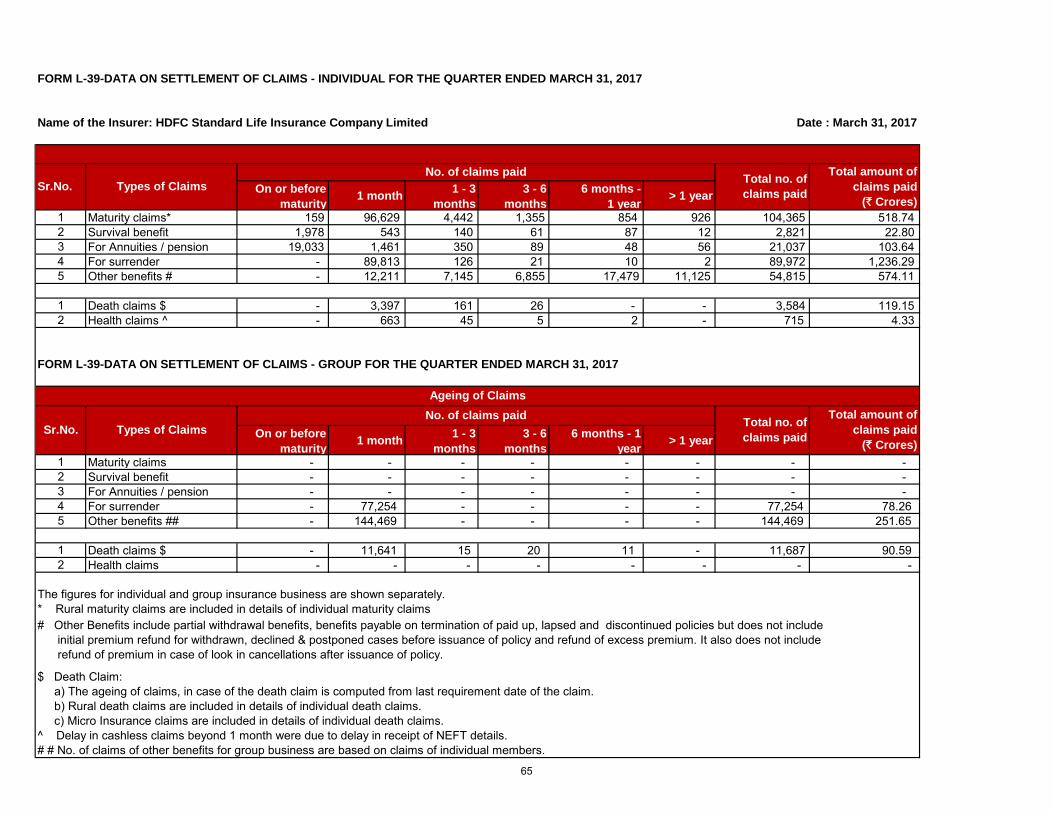
FORM L-39-DATA ON SETTLEMENT OF CLAIMS - INDIVIDUAL FOR THE QUARTER ENDED MARCH 31, 2017
Name of the Insurer: HDFC Standard Life Insurance Company Limited Date : March 31, 2017
On or before
maturity1 month
1 - 3
months
3 - 6
months
6 months -
1 year> 1 year
1 Maturity claims* 159 96,629 4,442 1,355 854 926 104,365 518.74 2 Survival benefit 1,978 543 140 61 87 12 2,821 22.80 3 For Annuities / pension 19,033 1,461 350 89 48 56 21,037 103.64 4 For surrender - 89,813 126 21 10 2 89,972 1,236.29 5 Other benefits # - 12,211 7,145 6,855 17,479 11,125 54,815 574.11
1 Death claims $ - 3,397 161 26 - - 3,584 119.15 2 Health claims ^ - 663 45 5 2 - 715 4.33
FORM L-39-DATA ON SETTLEMENT OF CLAIMS - GROUP FOR THE QUARTER ENDED MARCH 31, 2017
On or before
maturity1 month
1 - 3
months
3 - 6
months
6 months - 1
year> 1 year
1 Maturity claims - - - - - - - - 2 Survival benefit - - - - - - - - 3 For Annuities / pension - - - - - - - - 4 For surrender - 77,254 - - - - 77,254 78.26 5 Other benefits ## - 144,469 - - - - 144,469 251.65
1 Death claims $ - 11,641 15 20 11 - 11,687 90.59 2 Health claims - - - - - - - -
* Rural maturity claims are included in details of individual maturity claims
$ Death Claim:a) The ageing of claims, in case of the death claim is computed from last requirement date of the claim.b) Rural death claims are included in details of individual death claims.c) Micro Insurance claims are included in details of individual death claims.
^ Delay in cashless claims beyond 1 month were due to delay in receipt of NEFT details.# # No. of claims of other benefits for group business are based on claims of individual members.
The figures for individual and group insurance business are shown separately.
# Other Benefits include partial withdrawal benefits, benefits payable on termination of paid up, lapsed and discontinued policies but does not include initial premium refund for withdrawn, declined & postponed cases before issuance of policy and refund of excess premium. It also does not include
refund of premium in case of look in cancellations after issuance of policy.
Ageing of Claims
Sr.No. Types of Claims
No. of claims paidTotal no. of
claims paid
Total amount of
claims paid
(` Crores)
Sr.No. Types of ClaimsTotal no. of
claims paid
Total amount of
claims paid
(` Crores)
No. of claims paid
65
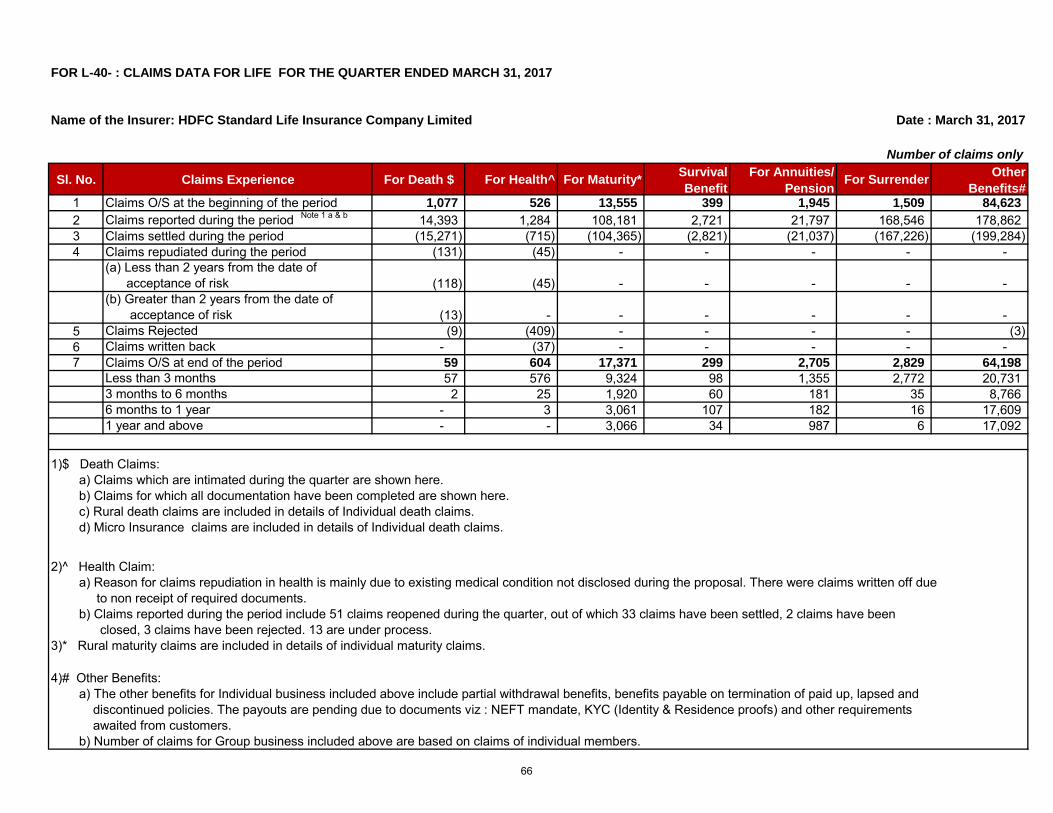
FOR L-40- : CLAIMS DATA FOR LIFE FOR THE QUARTER ENDED MARCH 31, 2017
Name of the Insurer: HDFC Standard Life Insurance Company Limited Date : March 31, 2017
Sl. No. Claims Experience For Death $ For Health^ For Maturity*Survival
Benefit
For Annuities/
PensionFor Surrender
Other
Benefits#1 Claims O/S at the beginning of the period 1,077 526 13,555 399 1,945 1,509 84,623
2 Claims reported during the period Note 1 a & b 14,393 1,284 108,181 2,721 21,797 168,546 178,862 3 Claims settled during the period (15,271) (715) (104,365) (2,821) (21,037) (167,226) (199,284) 4 Claims repudiated during the period (131) (45) - - - - -
(a) Less than 2 years from the date of acceptance of risk (118) (45) - - - - -
(b) Greater than 2 years from the date of acceptance of risk (13) - - - - - -
5 Claims Rejected (9) (409) - - - - (3) 6 Claims written back - (37) - - - - - 7 Claims O/S at end of the period 59 604 17,371 299 2,705 2,829 64,198
Less than 3 months 57 576 9,324 98 1,355 2,772 20,731 3 months to 6 months 2 25 1,920 60 181 35 8,766 6 months to 1 year - 3 3,061 107 182 16 17,609 1 year and above - - 3,066 34 987 6 17,092
Number of claims only
3)* Rural maturity claims are included in details of individual maturity claims.
4)# Other Benefits:a) The other benefits for Individual business included above include partial withdrawal benefits, benefits payable on termination of paid up, lapsed and
discontinued policies. The payouts are pending due to documents viz : NEFT mandate, KYC (Identity & Residence proofs) and other requirements awaited from customers.
b) Number of claims for Group business included above are based on claims of individual members.
1)$ Death Claims:a) Claims which are intimated during the quarter are shown here.b) Claims for which all documentation have been completed are shown here.c) Rural death claims are included in details of Individual death claims.d) Micro Insurance claims are included in details of Individual death claims.
2)^ Health Claim:a) Reason for claims repudiation in health is mainly due to existing medical condition not disclosed during the proposal. There were claims written off due
to non receipt of required documents.b) Claims reported during the period include 51 claims reopened during the quarter, out of which 33 claims have been settled, 2 claims have been
closed, 3 claims have been rejected. 13 are under process.
66
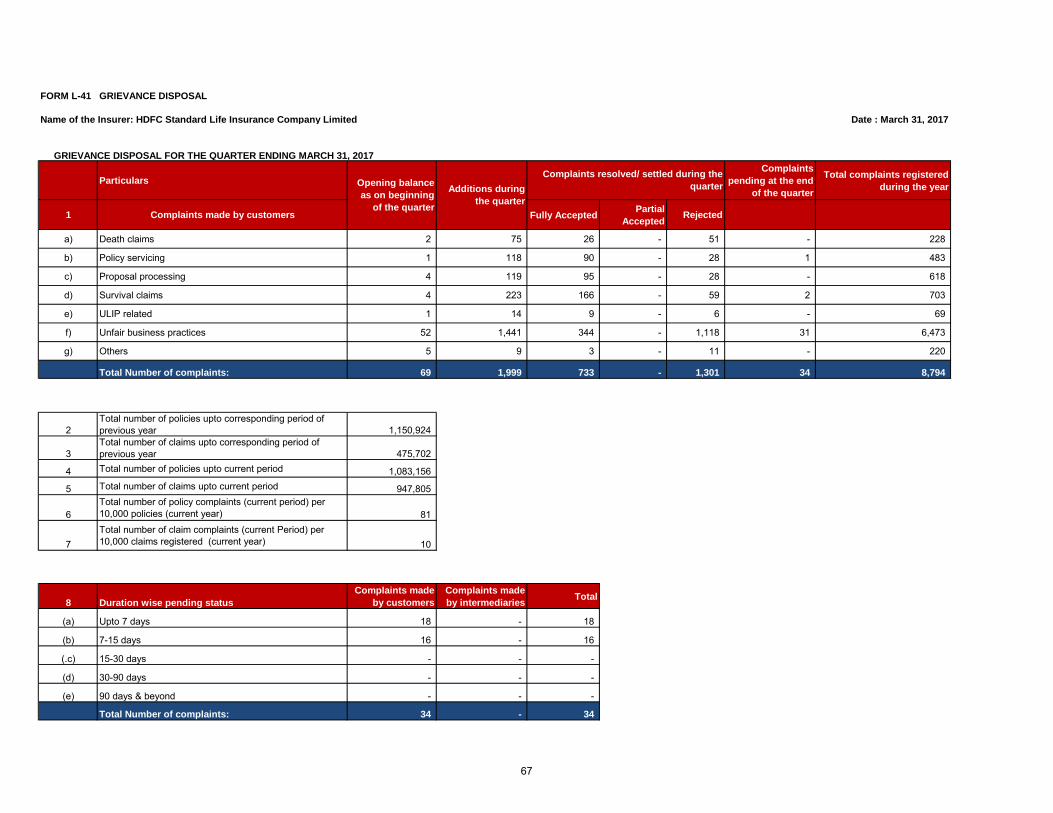
FORM L-41 GRIEVANCE DISPOSAL
Name of the Insurer: HDFC Standard Life Insurance Company Limited Date : March 31, 2017
GRIEVANCE DISPOSAL FOR THE QUARTER ENDING MARCH 31, 2017
Particulars
Complaints
pending at the end
of the quarter
Total complaints registered
during the year
1 Complaints made by customers Fully AcceptedPartial
AcceptedRejected
a) Death claims 2 75 26 - 51 - 228
b) Policy servicing 1 118 90 - 28 1 483
c) Proposal processing 4 119 95 - 28 - 618
d) Survival claims 4 223 166 - 59 2 703
e) ULIP related 1 14 9 - 6 - 69
f) Unfair business practices 52 1,441 344 - 1,118 31 6,473
g) Others 5 9 3 - 11 - 220
Total Number of complaints: 69 1,999 733 - 1,301 34 8,794
2Total number of policies upto corresponding period of previous year 1,150,924
3Total number of claims upto corresponding period of previous year 475,702
4 Total number of policies upto current period 1,083,156
5 Total number of claims upto current period 947,805
6Total number of policy complaints (current period) per 10,000 policies (current year) 81
7Total number of claim complaints (current Period) per 10,000 claims registered (current year) 10
8 Duration wise pending status
Complaints made
by customers
Complaints made
by intermediariesTotal
(a) Upto 7 days 18 - 18
(b) 7-15 days 16 - 16
(.c) 15-30 days - - -
(d) 30-90 days - - -
(e) 90 days & beyond - - -
Total Number of complaints: 34 - 34
Opening balance
as on beginning
of the quarter
Additions during
the quarter
Complaints resolved/ settled during the
quarter
67
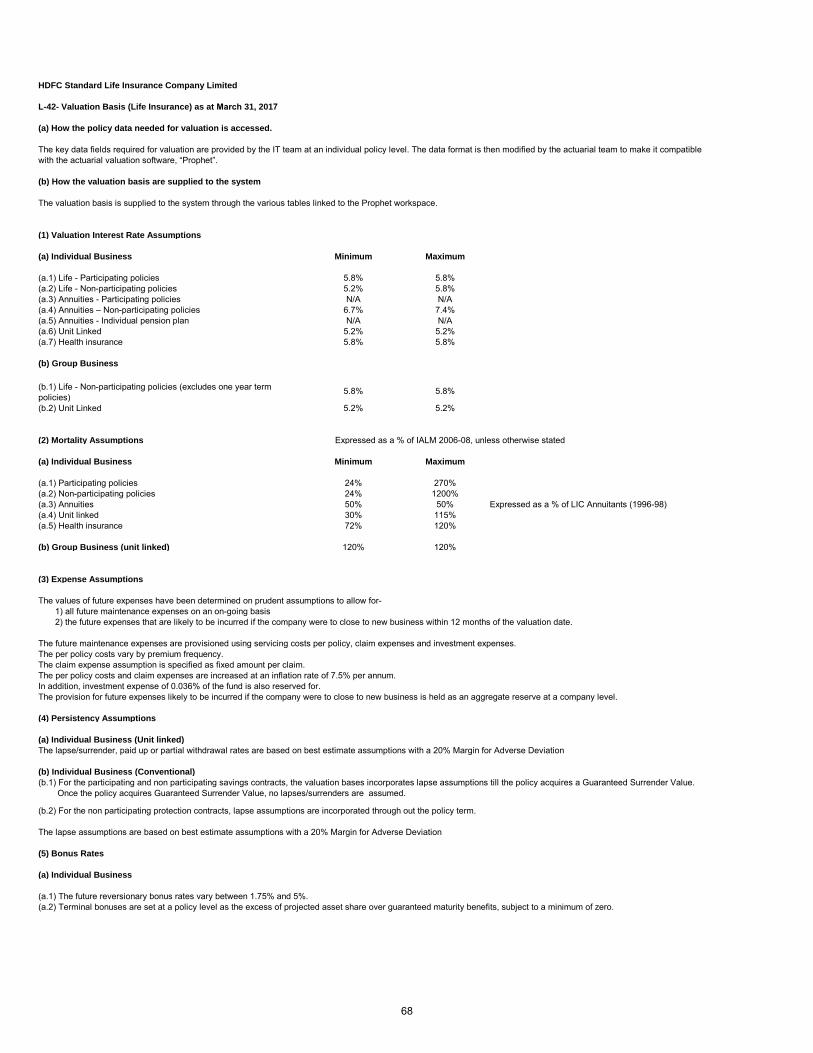
HDFC Standard Life Insurance Company Limited
L-42- Valuation Basis (Life Insurance) as at March 31, 2017
(a) How the policy data needed for valuation is accessed.
The key data fields required for valuation are provided by the IT team at an individual policy level. The data format is then modified by the actuarial team to make it compatible with the actuarial valuation software, “Prophet”.
(b) How the valuation basis are supplied to the system
The valuation basis is supplied to the system through the various tables linked to the Prophet workspace.
(1) Valuation Interest Rate Assumptions
(a) Individual Business Minimum Maximum
(a.1) Life - Participating policies 5.8% 5.8%(a.2) Life - Non-participating policies 5.2% 5.8%(a.3) Annuities - Participating policies N/A N/A(a.4) Annuities – Non-participating policies 6.7% 7.4%(a.5) Annuities - Individual pension plan N/A N/A(a.6) Unit Linked 5.2% 5.2%(a.7) Health insurance 5.8% 5.8%
(b) Group Business
5.8% 5.8%
(b.2) Unit Linked 5.2% 5.2%
(2) Mortality Assumptions Expressed as a % of IALM 2006-08, unless otherwise stated
(a) Individual Business Minimum Maximum
(a.1) Participating policies 24% 270%(a.2) Non-participating policies 24% 1200%(a.3) Annuities 50% 50% Expressed as a % of LIC Annuitants (1996-98)(a.4) Unit linked 30% 115%(a.5) Health insurance 72% 120%
(b) Group Business (unit linked) 120% 120%
(3) Expense Assumptions
The values of future expenses have been determined on prudent assumptions to allow for-1) all future maintenance expenses on an on-going basis2) the future expenses that are likely to be incurred if the company were to close to new business within 12 months of the valuation date.
The future maintenance expenses are provisioned using servicing costs per policy, claim expenses and investment expenses.The per policy costs vary by premium frequency.The claim expense assumption is specified as fixed amount per claim.The per policy costs and claim expenses are increased at an inflation rate of 7.5% per annum. In addition, investment expense of 0.036% of the fund is also reserved for.The provision for future expenses likely to be incurred if the company were to close to new business is held as an aggregate reserve at a company level.
(4) Persistency Assumptions
(a) Individual Business (Unit linked)
The lapse/surrender, paid up or partial withdrawal rates are based on best estimate assumptions with a 20% Margin for Adverse Deviation
(b) Individual Business (Conventional)
(b.1) For the participating and non participating savings contracts, the valuation bases incorporates lapse assumptions till the policy acquires a Guaranteed Surrender Value. Once the policy acquires Guaranteed Surrender Value, no lapses/surrenders are assumed.
(b.2) For the non participating protection contracts, lapse assumptions are incorporated through out the policy term.
The lapse assumptions are based on best estimate assumptions with a 20% Margin for Adverse Deviation
(5) Bonus Rates
(a) Individual Business
(a.1) The future reversionary bonus rates vary between 1.75% and 5%.(a.2) Terminal bonuses are set at a policy level as the excess of projected asset share over guaranteed maturity benefits, subject to a minimum of zero.
(b.1) Life - Non-participating policies (excludes one year term policies)
68
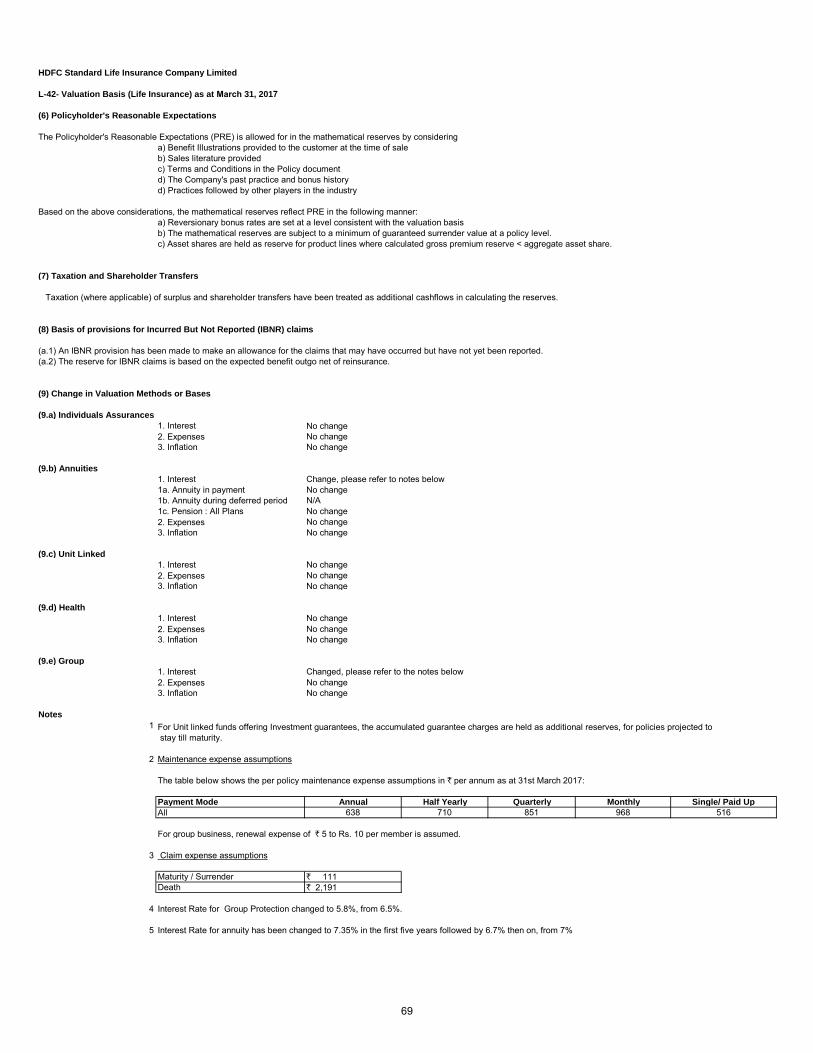
HDFC Standard Life Insurance Company Limited
L-42- Valuation Basis (Life Insurance) as at March 31, 2017
(6) Policyholder's Reasonable Expectations
The Policyholder's Reasonable Expectations (PRE) is allowed for in the mathematical reserves by consideringa) Benefit Illustrations provided to the customer at the time of saleb) Sales literature providedc) Terms and Conditions in the Policy documentd) The Company's past practice and bonus historyd) Practices followed by other players in the industry
Based on the above considerations, the mathematical reserves reflect PRE in the following manner:a) Reversionary bonus rates are set at a level consistent with the valuation basisb) The mathematical reserves are subject to a minimum of guaranteed surrender value at a policy level.c) Asset shares are held as reserve for product lines where calculated gross premium reserve < aggregate asset share.
(7) Taxation and Shareholder Transfers
Taxation (where applicable) of surplus and shareholder transfers have been treated as additional cashflows in calculating the reserves.
(8) Basis of provisions for Incurred But Not Reported (IBNR) claims
(a.2) The reserve for IBNR claims is based on the expected benefit outgo net of reinsurance.
(9) Change in Valuation Methods or Bases
(9.a) Individuals Assurances
1. Interest2. Expenses3. Inflation No change
(9.b) Annuities
1. Interest Change, please refer to notes below1a. Annuity in payment No change1b. Annuity during deferred period N/A1c. Pension : All Plans No change2. Expenses No change3. Inflation No change
(9.c) Unit Linked
1. Interest No change2. Expenses No change3. Inflation No change
(9.d) Health
1. Interest No change2. Expenses3. Inflation No change
(9.e) Group
1. Interest Changed, please refer to the notes below2. Expenses3. Inflation No change
Notes
1
2 Maintenance expense assumptions
The table below shows the per policy maintenance expense assumptions in ` per annum as at 31st March 2017:
Payment Mode Annual Half Yearly Quarterly Monthly Single/ Paid Up
All 638 710 851 968 516
For group business, renewal expense of ` 5 to Rs. 10 per member is assumed.
3 Claim expense assumptions
Maturity / Surrender ` 111Death ` 2,191
4 Interest Rate for Group Protection changed to 5.8%, from 6.5%.
5 Interest Rate for annuity has been changed to 7.35% in the first five years followed by 6.7% then on, from 7%
For Unit linked funds offering Investment guarantees, the accumulated guarantee charges are held as additional reserves, for policies projected to stay till maturity.
(a.1) An IBNR provision has been made to make an allowance for the claims that may have occurred but have not yet been reported.
No changeNo change
No change
No change
69