ipd index guide - european commissionec.europa.eu/finance/consultations/2012/benchmarks/docs/... ·...
TRANSCRIPT
IPD Index GuideEdition Eight
2012
1 IPD.com/IndexSchedule
IPD SERVICES IN DEVELOPMENTBotswana and Brazil
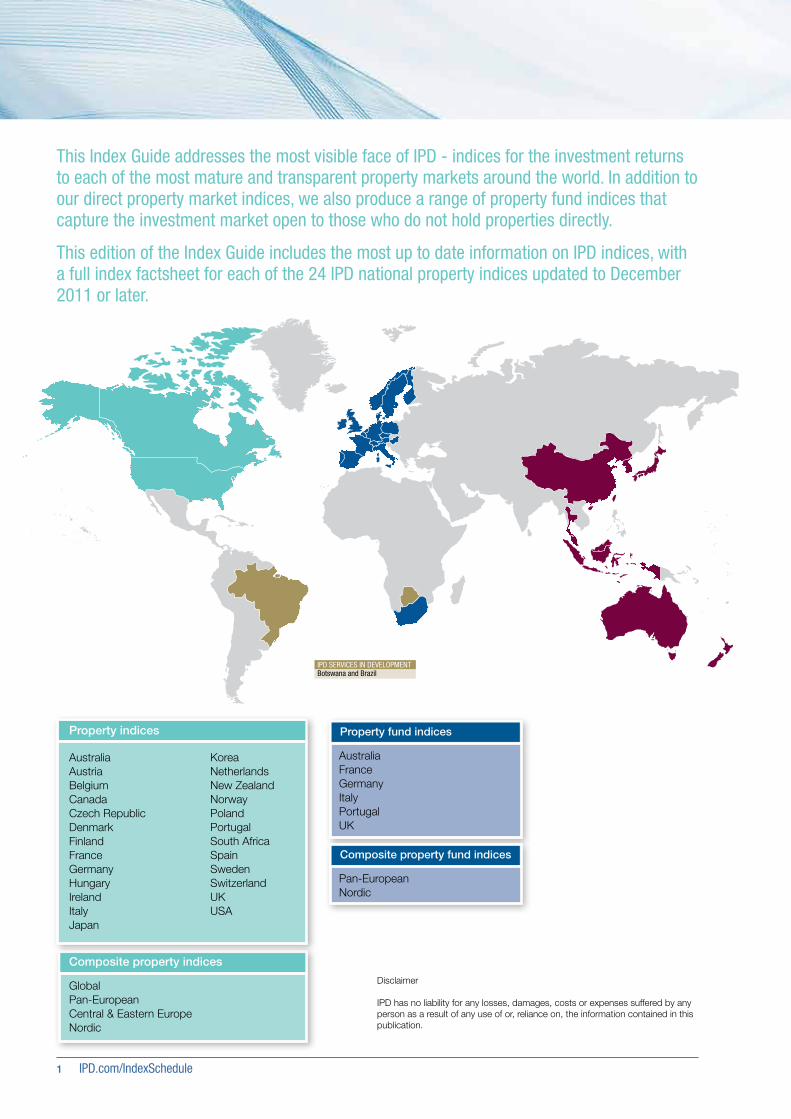
This Index Guide addresses the most visible face of IPD - indices for the investment returns to each of the most mature and transparent property markets around the world. In addition to our direct property market indices, we also produce a range of property fund indices that capture the investment market open to those who do not hold properties directly.
This edition of the Index Guide includes the most up to date information on IPD indices, with a full index factsheet for each of the 24 IPD national property indices updated to December 2011 or later.
Property fund indices
Composite property fund indices
AustraliaFranceGermanyItalyPortugalUK
Pan-EuropeanNordic
GlobalPan-EuropeanCentral & Eastern EuropeNordic
Property indices
Composite property indices
AustraliaAustriaBelgiumCanadaCzech RepublicDenmarkFinlandFranceGermanyHungaryIrelandItalyJapan
KoreaNetherlandsNew ZealandNorwayPolandPortugalSouth AfricaSpainSwedenSwitzerlandUKUSA
Disclaimer
IPD has no liability for any losses, damages, costs or expenses suffered by any person as a result of any use of or, reliance on, the information contained in this publication.
IPD.com/IndexGuide 2
IPD Index Guide 2012
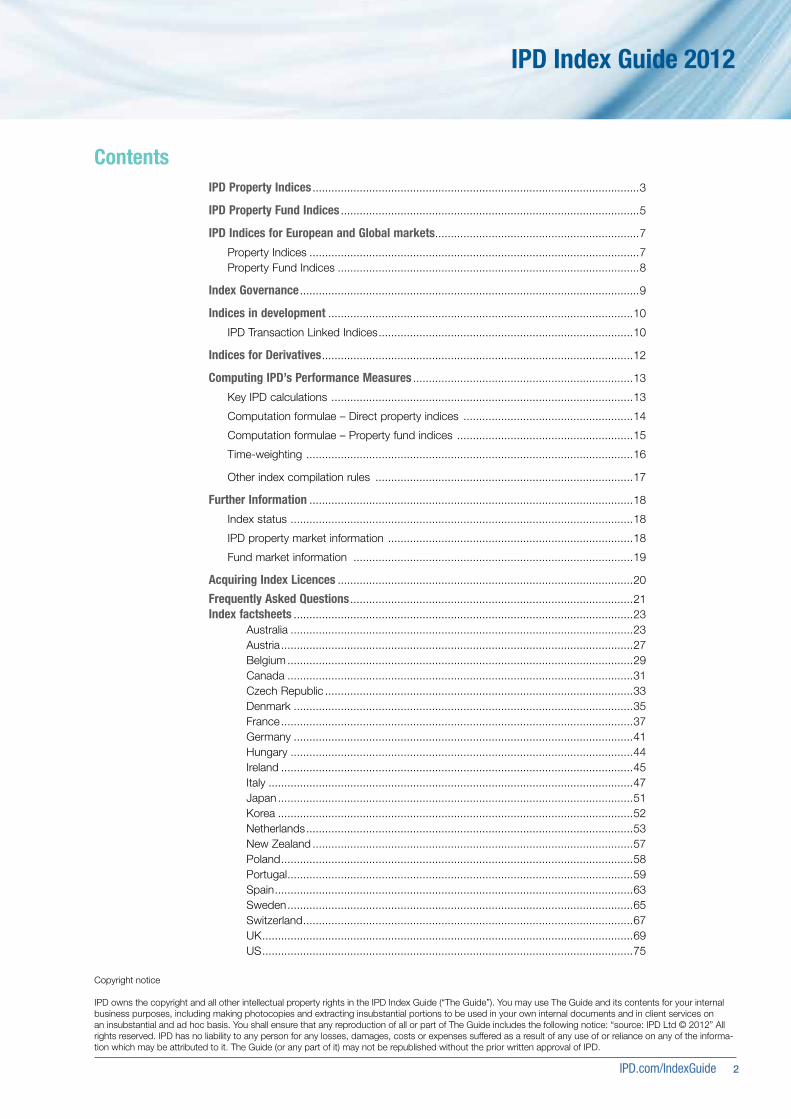
ContentsIPD Property Indices ........................................................................................................3
IPD Property Fund Indices ...............................................................................................5
IPD Indices for European and Global markets .................................................................7
Property Indices .........................................................................................................7Property Fund Indices ................................................................................................8
Index Governance ............................................................................................................9
Indices in development .................................................................................................10
IPD Transaction Linked Indices .................................................................................10
Indices for Derivatives ...................................................................................................12
Computing IPD’s Performance Measures ......................................................................13
Key IPD calculations ................................................................................................13
Computation formulae – Direct property indices ......................................................14
Computation formulae – Property fund indices ........................................................15
Time-weighting ........................................................................................................16
Other index compilation rules ..................................................................................17
Further Information .......................................................................................................18
Index status .............................................................................................................18
IPD property market information ..............................................................................18
Fund market information .........................................................................................19
Acquiring Index Licences ..............................................................................................20
Frequently Asked Questions ..........................................................................................21Index factsheets ............................................................................................................23
Australia .............................................................................................................23Austria ................................................................................................................27Belgium ..............................................................................................................29Canada ..............................................................................................................31Czech Republic ..................................................................................................33Denmark ............................................................................................................35France ................................................................................................................37Germany ............................................................................................................41Hungary .............................................................................................................44Ireland ................................................................................................................45Italy ....................................................................................................................47Japan .................................................................................................................51Korea .................................................................................................................52Netherlands ........................................................................................................53New Zealand ......................................................................................................57Poland ................................................................................................................58Portugal ..............................................................................................................59Spain ..................................................................................................................63Sweden ..............................................................................................................65Switzerland .........................................................................................................67UK ......................................................................................................................69US ......................................................................................................................75
Copyright notice
IPD owns the copyright and all other intellectual property rights in the IPD Index Guide (“The Guide”). You may use The Guide and its contents for your internal business purposes, including making photocopies and extracting insubstantial portions to be used in your own internal documents and in client services on an insubstantial and ad hoc basis. You shall ensure that any reproduction of all or part of The Guide includes the following notice: “source: IPD Ltd © 2012” All rights reserved. IPD has no liability to any person for any losses, damages, costs or expenses suffered as a result of any use of or reliance on any of the informa-tion which may be attributed to it. The Guide (or any part of it) may not be republished without the prior written approval of IPD.
3 IPD.com/IndexSchedule
IPD property indices are calculated at the property level, excluding the impact of debt, fund management fees, taxation and cash on property portfolios.
Our aim is to assemble and maintain consistent, comprehensive financial and descriptive records of real estate assets held in each market. This ensures that property returns can be fairly and precisely reported, and compared across asset classes and national boundaries.
We provide a large number of standard and bespoke benchmarks, as well as research, to support the real estate fund management strategies of property investors worldwide. These are not covered in this Index Guide.
Our main endeavour is to strip away the fund level overlays of cash and debt management, providing a fair and all inclusive comparison of the underlying direct property markets, reporting the undistorted total returns.
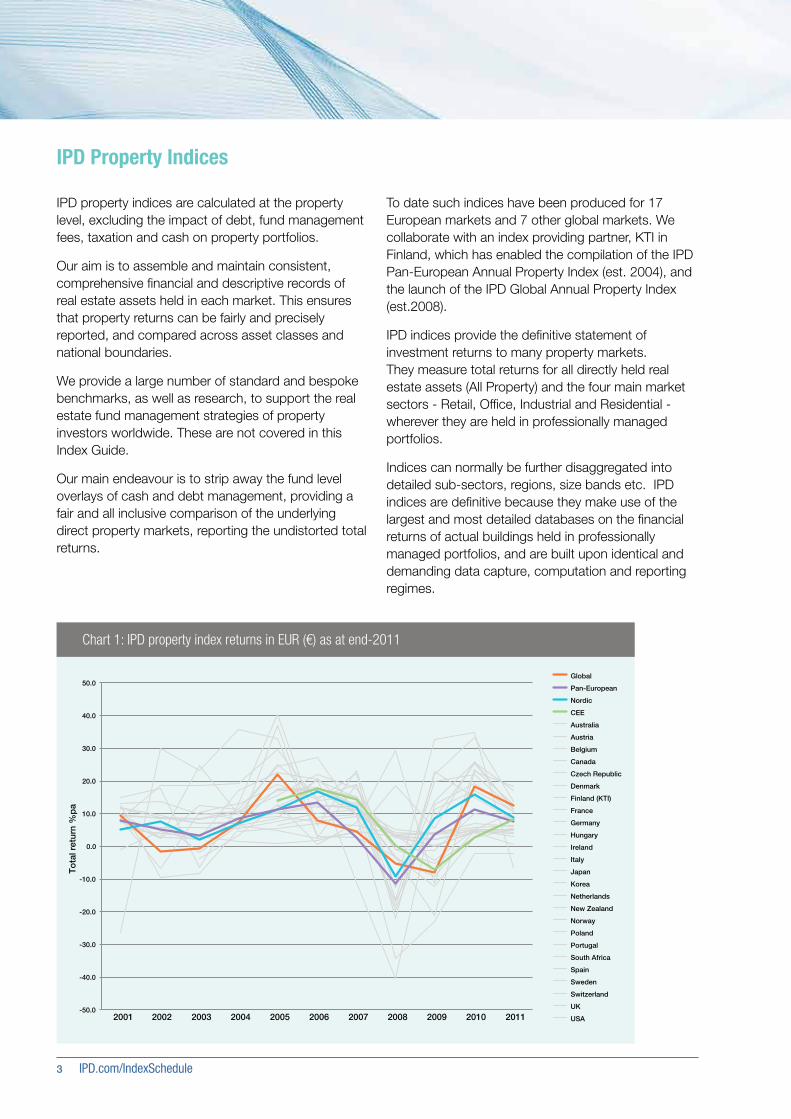
To date such indices have been produced for 17 European markets and 7 other global markets. We collaborate with an index providing partner, KTI in Finland, which has enabled the compilation of the IPD Pan-European Annual Property Index (est. 2004), and the launch of the IPD Global Annual Property Index (est.2008).
IPD indices provide the definitive statement of investment returns to many property markets. They measure total returns for all directly held real estate assets (All Property) and the four main market sectors - Retail, Office, Industrial and Residential - wherever they are held in professionally managed portfolios.
Indices can normally be further disaggregated into detailed sub-sectors, regions, size bands etc. IPD indices are definitive because they make use of the largest and most detailed databases on the financial returns of actual buildings held in professionally managed portfolios, and are built upon identical and demanding data capture, computation and reporting regimes.
Chart 1: IPD property index returns in EUR (€) as at end-2011
-50.0
-40.0
-30.0
-20.0
-10.0
0.0
10.0
20.0
30.0
40.0
50.0
2001 2002 2003 2004 2005 2006 2007 2008 2009 2010 2011
To
tal r
etur
n %
pa
Global
Pan-European
Nordic
CEE
Australia
Austria
Belgium
Canada
Czech Republic
Denmark
Finland (KTI)
France
Germany
Hungary
Ireland
Italy
Japan
Korea
Netherlands
New Zealand
Norway
Poland
Portugal
South Africa
Spain
Sweden
Switzerland
UK
USA
IPD Property Indices

IPD.com/IndexGuide 4
IPD Index Guide 2012
Comparability with other major asset classes, identifying trends in key market sectors and assessing property performance in different countries. For this reason, IPD indices have been specifically developed to be as consistent as possible with those used in mainstream investment analysis.
Frequency of annual results, with some countries also having biannual, quarterly and monthly indices, dependent upon the frequency of local market valuation practices.
Long term reporting with IPD data time series of a significant length. IPD indices can be used as a basis for risk analysis, forecasting and financial derivatives. They are published as soon as possible after the end of each reporting period using monthly time weighted returns.
Availability of headline results freely available from ipd.com, reflecting our objective to bring transparency and better information to the world’s property investment markets.
Standardised performance measures for each national and composite market, supplemented by further measures specifically applicable to that market.
All growth and index calculations are value weighted, i.e. each property contributes to the result in proportion to its capital value, and compounded monthly to report time weighted measures for quarterly, biannual and longer periods.
All IPD index performance measures are nominal, i.e. they do not take inflation into account. However, it is possible to calculate real total return, income return and capital growth by deflating these measures by inflation.
Open market valuations to provide the most comprehensive and authoritative coverage possible. All valuations used in IPD indices have been produced by property professionals for investment purposes, to a standard definition of capital value in each national market.
Property market returns covering ‘standing investments’, i.e. completed and letable properties, excluding properties that are purchased, sold or in the course of development during the measurement period. This ensures that IPD indices only reflect market returns and are not influenced by abnormal profits or losses which may be generated through active management. Exclusive use of standing investments also ensures consistency with indices available for other types of investment assets.
Directly owned properties from the organisations that contribute data to IPD, and not those that are held indirectly through investment vehicles, such as Property Unit Trusts. This ensures IPD indices reflect the underlying performance of assets, independent of any borrowing or financial management regime. They do not include any bonds, cash or derivative, or REIT share holdings.
Full transparency making it possible to conduct extensive analysis of the properties and mechanisms driving the underlying published return figures.IPD indices are compiled from records of individual properties; they are completely transparent in terms of samples used and calculations applied. Reporting confidentiality procedures are strictly governed so that no individual fund/property results are inadvertently divulged. Minimum requirements for release of any aggregated data is five assets across three ownerships.
5 IPD.com/IndexSchedule
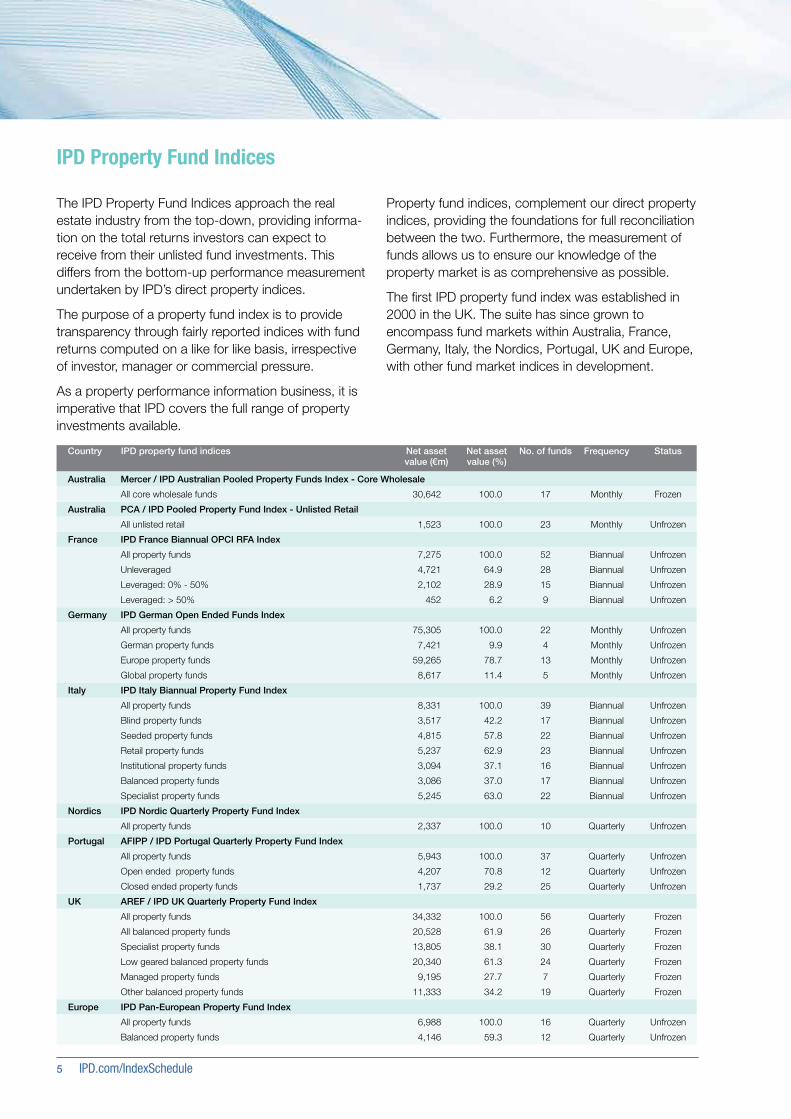
The IPD Property Fund Indices approach the real estate industry from the top-down, providing informa-tion on the total returns investors can expect to receive from their unlisted fund investments. This differs from the bottom-up performance measurement undertaken by IPD’s direct property indices.
The purpose of a property fund index is to provide transparency through fairly reported indices with fund returns computed on a like for like basis, irrespective of investor, manager or commercial pressure.
As a property performance information business, it is imperative that IPD covers the full range of property investments available.
Country IPD property fund indices Net asset value (€m)
Net asset value (%)
No. of funds Frequency Status
Australia Mercer / IPD Australian Pooled Property Funds Index - Core Wholesale
All core wholesale funds 30,642 100.0 17 Monthly Frozen
Australia PCA / IPD Pooled Property Fund Index - Unlisted Retail
All unlisted retail 1,523 100.0 23 Monthly Unfrozen
France IPD France Biannual OPCI RFA Index
All property funds 7,275 100.0 52 Biannual Unfrozen
Unleveraged 4,721 64.9 28 Biannual Unfrozen
Leveraged: 0% - 50% 2,102 28.9 15 Biannual Unfrozen
Leveraged: > 50% 452 6.2 9 Biannual Unfrozen
Germany IPD German Open Ended Funds Index
All property funds 75,305 100.0 22 Monthly Unfrozen
German property funds 7,421 9.9 4 Monthly Unfrozen
Europe property funds 59,265 78.7 13 Monthly Unfrozen
Global property funds 8,617 11.4 5 Monthly Unfrozen
Italy IPD Italy Biannual Property Fund Index
All property funds 8,331 100.0 39 Biannual Unfrozen
Blind property funds 3,517 42.2 17 Biannual Unfrozen
Seeded property funds 4,815 57.8 22 Biannual Unfrozen
Retail property funds 5,237 62.9 23 Biannual Unfrozen
Institutional property funds 3,094 37.1 16 Biannual Unfrozen
Balanced property funds 3,086 37.0 17 Biannual Unfrozen
Specialist property funds 5,245 63.0 22 Biannual Unfrozen
Nordics IPD Nordic Quarterly Property Fund Index
All property funds 2,337 100.0 10 Quarterly Unfrozen
Portugal AFIPP / IPD Portugal Quarterly Property Fund Index
All property funds 5,943 100.0 37 Quarterly Unfrozen
Open ended property funds 4,207 70.8 12 Quarterly Unfrozen
Closed ended property funds 1,737 29.2 25 Quarterly Unfrozen
UK AREF / IPD UK Quarterly Property Fund Index
All property funds 34,332 100.0 56 Quarterly Frozen
All balanced property funds 20,528 61.9 26 Quarterly Frozen
Specialist property funds 13,805 38.1 30 Quarterly Frozen
Low geared balanced property funds 20,340 61.3 24 Quarterly Frozen
Managed property funds 9,195 27.7 7 Quarterly Frozen
Other balanced property funds 11,333 34.2 19 Quarterly Frozen
Europe IPD Pan-European Property Fund Index
All property funds 6,988 100.0 16 Quarterly Unfrozen
Balanced property funds 4,146 59.3 12 Quarterly Unfrozen
Property fund indices, complement our direct property indices, providing the foundations for full reconciliation between the two. Furthermore, the measurement of funds allows us to ensure our knowledge of the property market is as comprehensive as possible.
The first IPD property fund index was established in 2000 in the UK. The suite has since grown to encompass fund markets within Australia, France, Germany, Italy, the Nordics, Portugal, UK and Europe, with other fund market indices in development.
IPD Property Fund Indices
IPD.com/IndexGuide 6
IPD Index Guide 2012
Performance is tracked as close to local market reporting timeframes as possible, with index publication frequencies of monthly, quarterly, biannual and annual.
Property fund indices provide funds with the opportunity to demonstrate their transparency and manager expertise as their fund information is published alongside their peers. Where fund specific returns are unavailable, IPD lists those managers that have contributed, in an effort to stimulate transparency. It should be noted that not all markets allow for the disclosure of fund specific returns, at which point only headline aggregate results are published.
Availability of headline results on ipd.com, with additional data freely available to data contributors. Bespoke requests can also be accommodated.
Data usage in reports and presentations, provided results are correctly sourced to the IPD index. Index contributors are entitled to use property fund indices for benchmarking, however, non-contributors must obtain prior agreement from IPD in the form of a license.
IPD property funds database contains descriptive and financial information for each fund. Data is standardised to allow comparability and gathered directly from the funds and third party industry bodies.
Index qualification is based on a fund being, or intending to be, open to third parties. Further inclusion criteria and rules are applied in accordance with local market specifics. A fund must provide consistent and continuous data, to an acceptable standard and in accordance with local index rules.
Sub indices follow a standard headline index of All Funds, and can be broken into sub indices in relation to local market specifics such as sector investment (balanced or specialist funds), structure (open-ended or closed-ended funds) and leverage (low or high geared funds). Samples may also be divided by region.
Currency outputs allow the user to monitor the effect of currency fluctuations. Fund data is collected in the fund’s local reporting currency. Once in the system, all figures are then converted into GBP, based on that month’s exchange rate, and then converted again into EUR, USD, JPY and Local (today’s exchange rate applied historically to all data).
Alternatively, local currency allows the user to see fund performance without the impact of currency movements.

7 IPD.com/IndexSchedule
Property Indices
IPD publishes indices in 17 European markets, and 7 non-European markets. Most IPD indices are annual, with quarterly indices available for Ireland, Netherlands, UK and the US. Annual indices are reported quarterly in Australia, New Zealand and Canada. Biannual indices and indicators are available for France, Italy and South Africa. Monthly indices are available for the UK and Japan.
IPD Indices for European and Global markets
No. of funds
No. of properties
Capital value
Total market size estimate
IPD coverage
Status Frequency
(€bn) ($bn) (€bn) ($bn) (%)
Australia 70 1,670 103.8 134.8 182.5 236.9 56.9 Unfrozen Quarterly
Austria 16 595 6.7 8.6 22.8 29.6 29.2 Unfrozen Annual
Belgium 35 376 8.2 10.7 47.6 61.8 17.3 Consultative Annual
Canada 42 2,141 72.0 93.5 139.8 181.5 51.5 Unfrozen Quarterly
Czech Republic 22 120 2.9 3.7 11.2 14.5 25.9 Consultative Annual
Denmark 20 1,033 14.7 19.0 34.4 44.7 42.6 Unfrozen Annual
Finland (KTI) 21 2,272 21.3 27.6 42.9 55.7 49.6 Unfrozen Annual
France 112 6,932 109.5 142.1 236.3 306.8 46.3 Frozen Annual, Biannual
Germany 97 4,364 50.0 65.0 270.3 350.9 18.5 Unfrozen Annual
Hungary 20 107 2.2 2.8 9.1 11.9 23.7 Consultative Annual
Ireland 12 328 2.3 3.0 2.5 3.3 90.1 Unfrozen Quarterly
Italy 67 1,998 28.3 36.7 79.5 103.2 35.6 Unfrozen Annual, Biannual
Japan 57 2,131 90.7 117.7 595.7 773.3 15.2 Unfrozen Monthly
Korea 27 120 9.4 12.2 38.1 49.5 24.7 Consultative Annual
Netherlands 59 4,620 38.9 50.5 117.2 152.2 33.2 Frozen Annual, Quarterly
New Zealand 26 585 6.4 8.3 9.6 12.5 66.1 Unfrozen Quarterly
Norway 14 569 16.2 21.0 40.2 52.2 40.2 Unfrozen Annual
Poland 27 232 5.4 7.1 16.2 21.1 33.5 Consultative Annual
Portugal 41 998 9.9 12.8 15.1 19.6 65.5 Unfrozen Annual
South Africa 22 2,017 19.5 25.4 30.9 40.1 63.3 Unfrozen Annual, Biannual Indicator
Spain 50 523 17.8 23.1 41.0 53.2 43.4 Unfrozen Annual
Sweden 27 1,401 29.3 38.0 107.3 139.3 27.3 Unfrozen Annual
Switzerland 39 4,172 58.6 76.0 140.2 182.0 41.8 Unfrozen Annual
UK 304 20,456 177.4 230.3 284.1 368.8 62.5 Frozen Annual, Quarterly, Monthly
United States 44 3,193 104.1 135.1 1,516.2 1,968.2 6.9 Unfrozen Annual, Quarterly
IPD CEE 35 558 13.9 18.0 79.4 103.1 17.5 Unfrozen Annual
IPD Nordic 82 5,275 83.4 108.3 224.0 290.8 36.2 Unfrozen Annual
IPD Eurozone 510 23,006 292.7 380.0 875.2 1,136.1 33.4 Unfrozen Annual
IPD Pan-European 983 51,096 599.3 778.0 1,518.1 1,970.7 39.5 Unfrozen Annual
IPD Global 1,245 62,368 998.9 1,296.7 4,021.4 5,220.2 24.8 Unfrozen Annual
Databank profiles and estimated market sizes as at December 2011
The table below summarises the IPD index sizes and coverage ratios as at December 2011.
In addition to single country property indices, IPD also collates composite indices. These are formed by taking all properties located across the specific countries. The most well known composite property indices are our Pan-European and Global indices. We also produce indices for the Nordics and Central and Eastern Europe.
IPD.com/IndexGuide 8
IPD Index Guide 2012
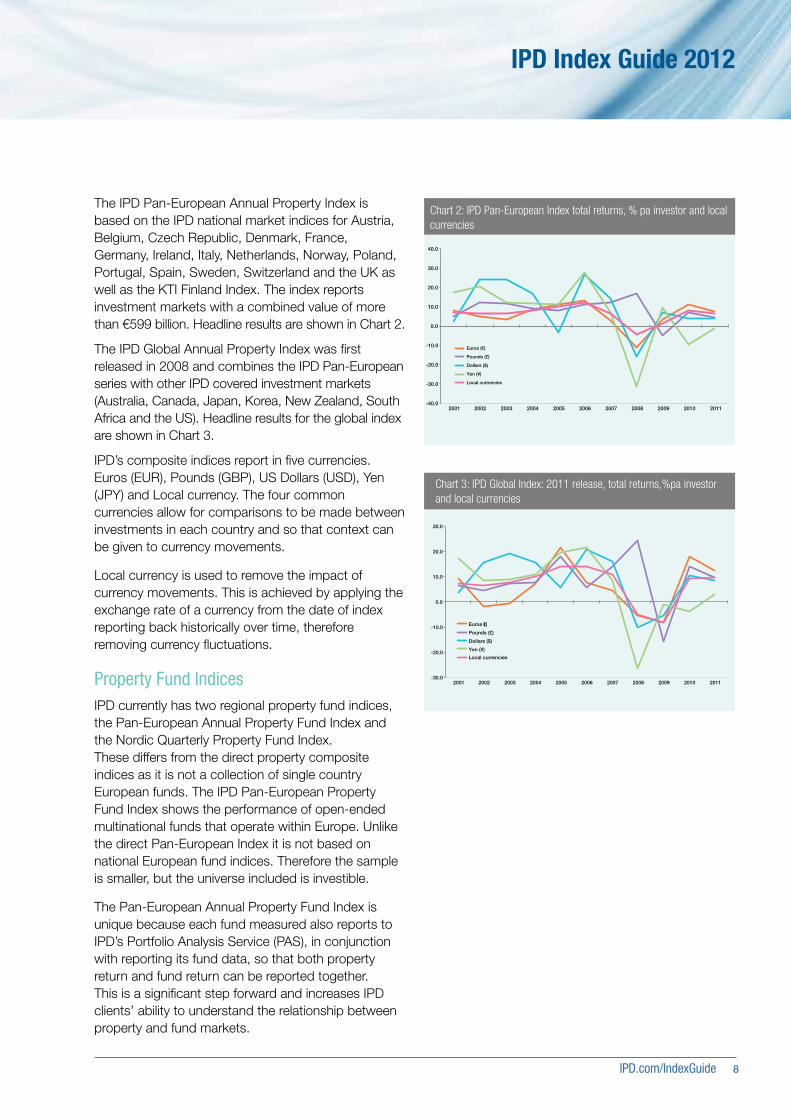
The IPD Pan-European Annual Property Index is based on the IPD national market indices for Austria, Belgium, Czech Republic, Denmark, France, Germany, Ireland, Italy, Netherlands, Norway, Poland, Portugal, Spain, Sweden, Switzerland and the UK as well as the KTI Finland Index. The index reports investment markets with a combined value of more than €599 billion. Headline results are shown in Chart 2.
The IPD Global Annual Property Index was first released in 2008 and combines the IPD Pan-European series with other IPD covered investment markets (Australia, Canada, Japan, Korea, New Zealand, South Africa and the US). Headline results for the global index are shown in Chart 3.
IPD’s composite indices report in five currencies. Euros (EUR), Pounds (GBP), US Dollars (USD), Yen (JPY) and Local currency. The four common currencies allow for comparisons to be made between investments in each country and so that context can be given to currency movements.
Local currency is used to remove the impact of currency movements. This is achieved by applying the exchange rate of a currency from the date of index reporting back historically over time, therefore removing currency fluctuations.
Property Fund IndicesIPD currently has two regional property fund indices, the Pan-European Annual Property Fund Index and the Nordic Quarterly Property Fund Index. These differs from the direct property composite indices as it is not a collection of single country European funds. The IPD Pan-European Property Fund Index shows the performance of open-ended multinational funds that operate within Europe. Unlike the direct Pan-European Index it is not based on national European fund indices. Therefore the sample is smaller, but the universe included is investible.
The Pan-European Annual Property Fund Index is unique because each fund measured also reports to IPD’s Portfolio Analysis Service (PAS), in conjunction with reporting its fund data, so that both property return and fund return can be reported together. This is a significant step forward and increases IPD clients’ ability to understand the relationship between property and fund markets.
Chart 2: IPD Pan-European Index total returns, % pa investor and local currencies
-40.0
-30.0
-20.0
-10.0
0.0
10.0
20.0
30.0
40.0
2001 2002 2003 2004 2005 2006 2007 2008 2009 2010 2011
Euros (€)
Pounds (£)
Dollars ($)
Yen (¥)
Local currencies
Chart 3: IPD Global Index: 2011 release, total returns,%pa investor and local currencies
-30.0
-20.0
-10.0
0.0
10.0
20.0
30.0
2001 2002 2003 2004 2005 2006 2007 2008 2009 2010 2011
Euros (€)
Pounds (£)
Dollars ($)
Yen (¥)
Local currencies
9 IPD.com/IndexSchedule
IPD’s Index Rules cover composition, calculation, content and presentation.
More specific extensions or elaborations are in place for some indices where circumstances require, e.g. UK monthly, Pan-European, Global and Fund indices.
New indices for national markets are titled ‘Consultative’ in their initial releases to highlight the immature nature of their development.
Indicators exist where IPD is able to release mid-year performance data for a market on a sample which is not comparable with that of the annual index.
The composition and construction rules for IPD indices are reviewed regularly by independent, non-executive bodies, referred to as Index Consultative Groups.
Members are drawn from the property investment industry, major universities, research and property consultants, trade associations and investment consulting organisations. These groups exist at national and global levels and meet two or three times each year in most regions.
Data quality, data capture and computation control processes are overseen by IPD’s Business Assurance Unit. The mandate for the unit, which reports directly to an independent Business Audit Committee, is to define quality procedures, audit dataflow and reporting operations for all IPD services. This regime is a result of a major external audit in 2001.
Since 2006, the UK data process audit was extended to encompass client data origination, with randomly selected funds audited on their primary data generation and supply procedures.
Assets are only included in an IPD database if the portfolios within which they are held are reported to IPD in their entirety – including (for benchmarking purposes) all transactions, developments and indirect interests in real estate. Samples from investment portfolios are not accepted.
Index Governance
IPD’s validation process checks each fund for client data errors, errors from data entry and/or data processes. Types of validation issues include:
• Responses outside specified ranges,
• Logical validity of responses in relation to each other (cross checks),
• Missing financial records, or data in essential fields
• Exceptional growth/performance.
IPD.com/IndexGuide 10
IPD Index Guide 2012
Indices in Development
IPD Transaction Linked Indices
Over the last few years IPD has been developing a hybrid index methodology which incorporates transaction information with standard IPD valuation data to give a more robust measure of the volatility in property markets.
To date this work extends across a number of European markets. The methodology and draft reports are included below. IPD welcomes consultation on the reporting of this new set of indicators.
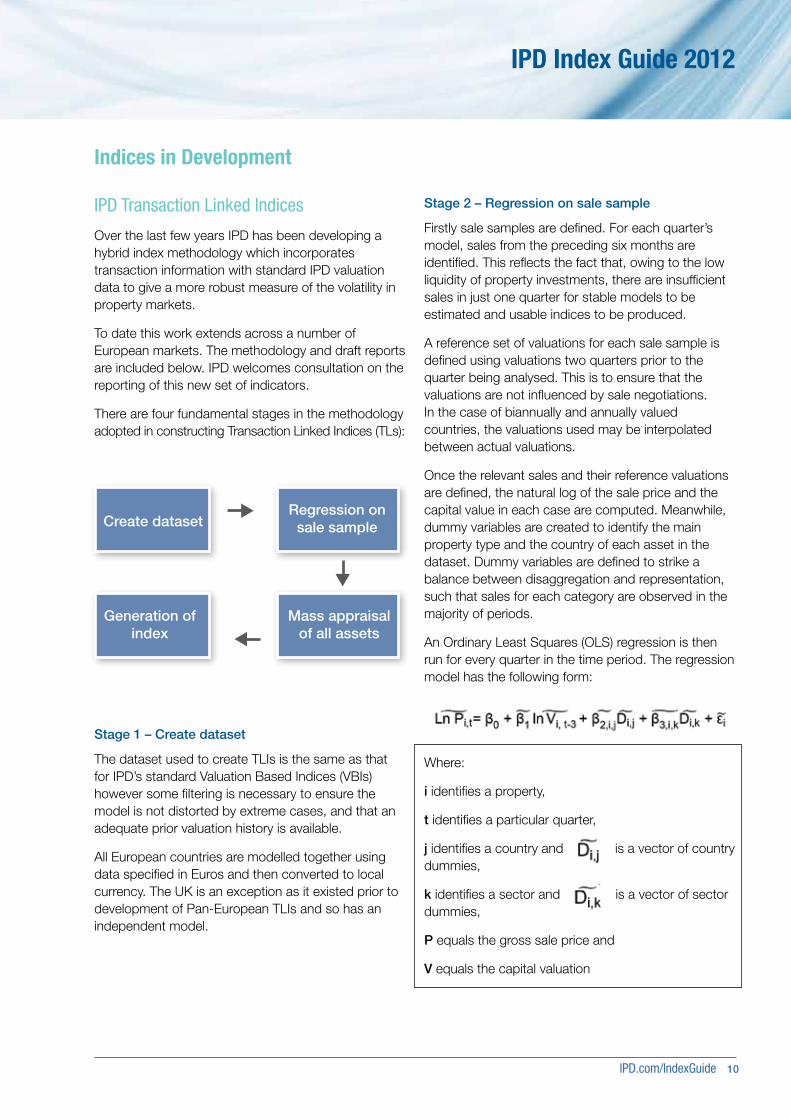
There are four fundamental stages in the methodology adopted in constructing Transaction Linked Indices (TLs):
Stage 1 – Create dataset
The dataset used to create TLIs is the same as that for IPD’s standard Valuation Based Indices (VBIs) however some filtering is necessary to ensure the model is not distorted by extreme cases, and that an adequate prior valuation history is available.
All European countries are modelled together using data specified in Euros and then converted to local currency. The UK is an exception as it existed prior to development of Pan-European TLIs and so has an independent model.
Stage 2 – Regression on sale sample
Firstly sale samples are defined. For each quarter’s model, sales from the preceding six months are identified. This reflects the fact that, owing to the low liquidity of property investments, there are insufficient sales in just one quarter for stable models to be estimated and usable indices to be produced.
A reference set of valuations for each sale sample is defined using valuations two quarters prior to the quarter being analysed. This is to ensure that the valuations are not influenced by sale negotiations. In the case of biannually and annually valued countries, the valuations used may be interpolated between actual valuations.
Once the relevant sales and their reference valuations are defined, the natural log of the sale price and the capital value in each case are computed. Meanwhile, dummy variables are created to identify the main property type and the country of each asset in the dataset. Dummy variables are defined to strike a balance between disaggregation and representation, such that sales for each category are observed in the majority of periods.
An Ordinary Least Squares (OLS) regression is then run for every quarter in the time period. The regression model has the following form:
Where:
i identifies a property,
t identifies a particular quarter,
j identifies a country and is a vector of country dummies,
k identifies a sector and is a vector of sector dummies,
P equals the gross sale price and
V equals the capital valuation
e
s
Create datasetRegression on
sale sample
Generation ofindex
Mass appraisalof all assets

11 IPD.com/IndexSchedule
Stage 3 – Mass appraisal of all assets
The coefficients from regressions can be used to predict sale prices for assets that were not traded. Two predictions are made for properties held in each quarter.
First, a start price is predicted using coefficients from the regression on the sale sample for the preceding period.
Second, an end price is predicted from output for the regression on the sale sample for the current period.
So, for Q4, predicted start prices are derived from the regression on Q2-Q3 sales and predicted end prices are derived using the regression on Q3-Q4 sales.
These predicted prices are in log form rather than cash terms and it is the latter that is required for generating indices. The predicted log prices are transformed in the following manner to correct for bias:
Where: O2 is the mean squared error of the regression generating the predicted price
Stage 4 – Generation of index
The transformed start and end prices can then each be summed for all assets within a particular country or sector. The change between these two totals (in % terms) will represent a value-weighted capital return figure derived from transaction evidence. These rates of change can be chain-linked with those from the surrounding quarters in order to form a time-series for that country or sector.
IPD.com/IndexGuide 12
IPD Index Guide 2012
Indices for Derivatives
IPD indices are used as the basis of real estate derivative contracts. For investors looking to trade in commercial property indices, there are three main types of instruments:
• Total return swaps
• Futures
• Structured notes
The main differences between these instruments concern the exchange of principal and the need for ISDA documentation.
Property derivatives come with a number of advantages over conventional real estate assets:
• Lower transaction costs (0.5% compared to 6.0%)
• Rapid liquidity
• Diversification
• Current sentiment pricing
• The ability to facilitate benefit from a falling market.
When property derivatives were launched in 2004, there was a steady build up in interest as a buoyant market looked for new ways of exploiting their property sector knowledge. Interest primarily took the form of total return swaps on IPD UK indices, with later interest building in both the French and German indices.
Soon thereafter, a series of test trades were executed on Italian, Swiss, Japanese, Spanish, Canadian and Australian IPD indices. The majority of UK trades have been on the All Property Index, but there have been a significant number of trades on selected sector and sub-sector indices.
Since February 2009, it has been possible to trade futures based on the IPD UK Total Return Index on the Eurex international derivatives exchange. Futures are standardised contracts, each traded for a set value and term. Eurex nets derivatives exposure and provides central counterparty clearing, significantly mitigating counter-party risk.
In Q2 2011 sector futures contracts were launched, and sub-sector contracts are planned. The volume of open-interest is available from Eurex.
The emergence of the property derivatives market not only aids managers, with potentially more efficient portfolio management techniques, but also opens up a new range of strategies.
Perhaps the most obvious use of derivatives for property portfolio managers is the hedging of risk and the fast, efficient rebalancing of portfolios. This concept can be used by both managers of multi-asset portfolios and managers of property portfolios.
Total return swaps allow investors to leverage their position to property by holding less cash than the notional size of the contract, whilst structured notes can also be structured with embedded leverage. This is especially attractive in market conditions, such as those currently being experienced, where debt can be expensive and difficult to obtain from banks.
The ability to short property exposure through a derivative allows managers to hedge risk in their portfolios. All Property swaps can be used to hedge market risk on a portfolio of assets, or just some part of that risk for specific assets. Sector (Retail, Office and Industrial) or subsector (e.g. shopping centres, retail warehouses etc) swaps can be sold to hedge out more specific market risks.
The ability to exit or enter at specific times in the direct property market depends upon often difficult and illiquid market circumstances. Derivatives can offer a means of bridging periods in which direct transactions cannot be speedily completed - for instance, when there are no available purchasers or there is a lack of available stock in a certain sector.
Portfolio managers can also use derivatives to offset market sector performance and risk (beta), and concentrate on asset outperformance and risk (alpha). They can then focus on delivering excess performance from the directly held assets.
13 IPD.com/IndexSchedule
Computing IPD’s Performance Measures
IPD indices use monthly time-weighted returns, including the KTI Finland Annual Index which is approved as fully compliant with IPD standards.
A number of IPD indices are frozen historically, meaning that published returns are never restated. Therefore the addition of new funds to these databases does not involve retrospective restatement, even where historical data for those funds is available.
In all other IPD indices, historical restatement is undertaken whenever it gives a more comprehensive and accurate report of past market performance.
Indices currently frozen historically are:
• IPD France Annual Property Index
• IPD Netherlands Annual Property Index
• IPD UK Annual Property Index
• IPD UK Quarterly Property Index
• AREF / IPD UK Pooled Property Fund Index
• IPD UK Monthly Property Index
This position is continuously under review. As indices grow in size and coverage, the possibility of index freezing is reconsidered.
Key IPD calculations
All IPD performance measures, including indices, are value-weighted within a single measurement period (i.e. one month) based on open market valuations of each of the real estate assets directly held within contributing portfolios. Capital employed is defined as the value of assets held at the beginning of the computation period plus purchase, development and other capital expenditure during the period. Capital employed is the denominator of the total return equation.
Calculation of principal single period measures
Total return is calculated as the change in capital value, less any capital expenditure incurred, plus net income, expressed as a percentage of capital employed over the period concerned.
Income return is calculated as net income expressed as a percentage of capital employed over the period concerned.
Capital growth is calculated as the change in capital value, less any capital expenditure incurred, expressed as a percentage of capital employed over the period concerned.
Standard Property Fund Index measures:
• Total return
• Leverage ratio
• Distribution yield
• Net asset value
Subject to index maturity, the above measures are also available for each fund within the index. Each fund’s contribution to the index, longer term performance and current asset allocation is detailed in the publication.

IPD.com/IndexGuide 14
IPD Index Guide 2012
The basis for IPD’s annual and quarterly performance measures is time-weighted. Annual measures are the result of compounding 12-month’s figures and annual figures are shown only when 12-month’s figures are available. The measure gives an equal weight to each month.
To calculate quarterly and annual returns, it is necessary first to construct an index from the monthly values.
The 12-month return, for example, is then calculated as the percentage change in the index (Xt) over the relevant 12 months.
12-month Total Return = [ (X (t + 12) / Xt ) -1 ] * 100
Note: Multi-period capital growth and income return may not sum perfectly to total return due to the cross product that occurs when capital and income returns are combined within compounded total returns.
Computation formulae – Direct property indices
Total return
With respect to a single month total return is defined as:
Income return
Capital growth
Where:
TRt is the total return in month t
CVt is the capital value at the end of month t
CExpt is the capital expenditure (includes purchases & developments) in month t
CRptt is the capital receipts (includes sales) in month t
Nlt is the day-dated rent receivable during month t, net of property management costs, ground rent and other irrecoverable expenditure
15 IPD.com/IndexSchedule
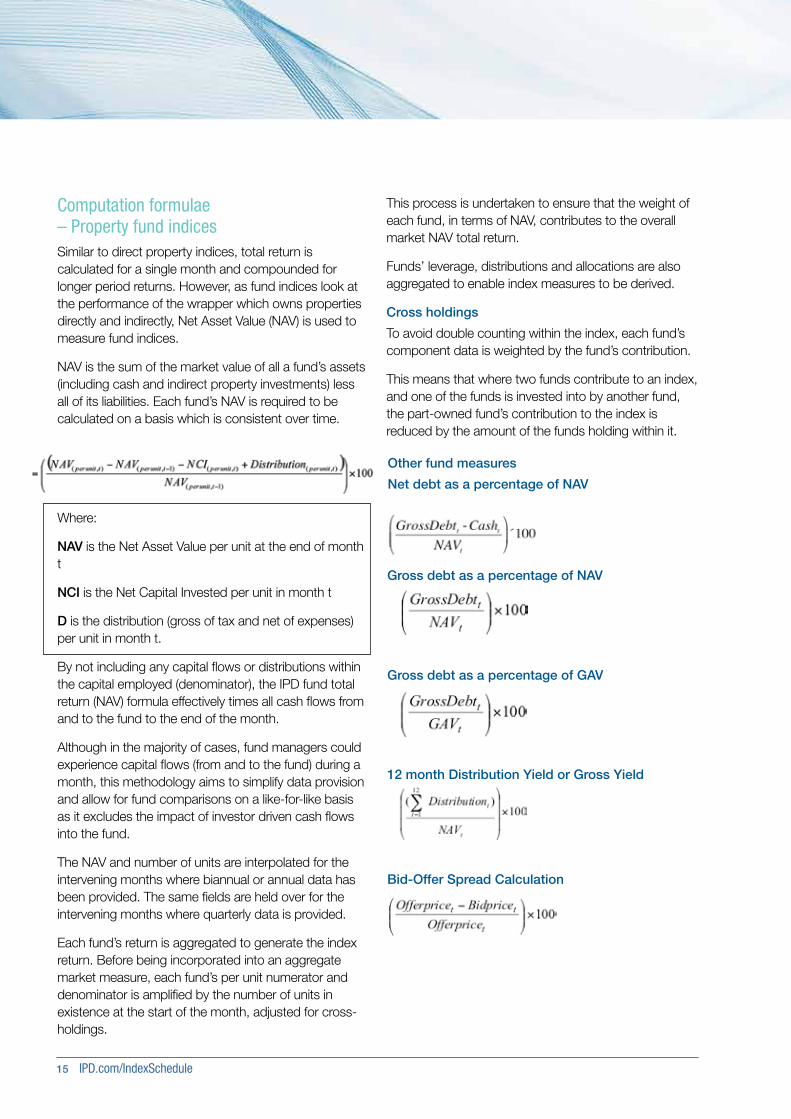
Computation formulae – Property fund indicesSimilar to direct property indices, total return is calculated for a single month and compounded for longer period returns. However, as fund indices look at the performance of the wrapper which owns properties directly and indirectly, Net Asset Value (NAV) is used to measure fund indices.
NAV is the sum of the market value of all a fund’s assets (including cash and indirect property investments) less all of its liabilities. Each fund’s NAV is required to be calculated on a basis which is consistent over time.
Where:
NAV is the Net Asset Value per unit at the end of month t
NCI is the Net Capital Invested per unit in month t
D is the distribution (gross of tax and net of expenses) per unit in month t.
By not including any capital flows or distributions within the capital employed (denominator), the IPD fund total return (NAV) formula effectively times all cash flows from and to the fund to the end of the month.
Although in the majority of cases, fund managers could experience capital flows (from and to the fund) during a month, this methodology aims to simplify data provision and allow for fund comparisons on a like-for-like basis as it excludes the impact of investor driven cash flows into the fund.
The NAV and number of units are interpolated for the intervening months where biannual or annual data has been provided. The same fields are held over for the intervening months where quarterly data is provided.
Each fund’s return is aggregated to generate the index return. Before being incorporated into an aggregate market measure, each fund’s per unit numerator and denominator is amplified by the number of units in existence at the start of the month, adjusted for cross-holdings.
Other fund measures
Net debt as a percentage of NAV
Gross debt as a percentage of NAV
Gross debt as a percentage of GAV
12 month Distribution Yield or Gross Yield
Bid-Offer Spread Calculation
This process is undertaken to ensure that the weight of each fund, in terms of NAV, contributes to the overall market NAV total return.
Funds’ leverage, distributions and allocations are also aggregated to enable index measures to be derived.
Cross holdings
To avoid double counting within the index, each fund’s component data is weighted by the fund’s contribution.
This means that where two funds contribute to an index, and one of the funds is invested into by another fund, the part-owned fund’s contribution to the index is reduced by the amount of the funds holding within it.

IPD.com/IndexGuide 16
IPD Index Guide 2012
Time-weighting
Monthly computation of IPD performance measures
The return calculation period and minimum measurement period for IPD performance measures, including all indices, is one calendar month. Returns for longer periods, such as quarters and years, are calculated by chain-linking individual monthly returns. All IPD annual, biannual and quarterly indices worldwide are calculated using this time-weighted basis, ensuring consistency of methodology from country to country.
Within each monthly measurement period, the total return is the sum of the capital and income components, although it should be noted that multi-period capital growth and income return do not sum perfectly to total return. This is due to the cross product that occurs when capital and income returns are combined within compounded total returns.
Converting local currency indices into common currencies
The start and end month capital values, monthly net income, capital expenditure and receipt figures used in these time weighted calculations are all converted into common currencies at the month end.
Currency conversion has an impact on local market returns as changes in values from one month to the next are partly the result of fluctuations in currency exchange rates in addition to local property market factors.
The composite IPD Pan-European Property Index return, when computed and reported in local currencies, is calculated by converting all markets to the same currency, but at a fixed rate over time to remove the impact of exchange rate movement.
Constructing monthly data
Valuation data
If monthly valuations are available, as is the case for the IPD UK Monthly Property Index, these are used for calculating total return, capital growth and income return indices.
Where monthly valuations are not available, but the valuation dates of contributing properties are synchronised to a common date, IPD inserts estimated monthly valuations which are derived by interpolating between actual values. In services where the valuation dates of contributing properties are spread throughout the year, IPD can apply one of two methodologies.
• The first is to simply hold values flat from one valuation date to the next. While this introduces an inertial tendency into published results, it avoids the need for regular restatement that would otherwise result.
• The second is to interpolate historically between true valuations and use evidence in most recent measurement periods to mix adjust across the entire sample. While avoiding the inertial tendency in reported figures, this does introduce systematic restatement of previously published returns.
While IPD would prefer indices to be built on services with a common valuation date, this is not always possible. In Canada the first methodology is currently used, whilst in Australia and New Zealand, the second methodology is now employed.
Use of monthly and quarterly data for estimation in countries where IPD publishes a monthly index, the majority of properties are interpolated non-linearly between successive actual valuations, shaping the intervening notional values to match the known movements of the market over the period for that particular property type and region. Valuations are indexed between the two known end values on the basis of the capital and rental value movements within the market.
Cashflow items
Monthly cashflows, if available, are recorded in the actual months in which they occur. If cashflow data can only be provided on a quarterly or annual basis, it is apportioned equally over the period to which it relates.
Interpolation process in detail
To calculate annual returns from monthly data, it is necessary to have valuations at the end of each month. Where properties are valued less frequently, IPD computes estimated capital and rental values.

17 IPD.com/IndexSchedule
Other index compilation rules
Frozen index series
Property indices in France, Netherlands and the UK are frozen historically. This means the historical time series is not restated with new information after publication. The frozen history does not apply to all performance measures or sub-sectors however.
Total return, income return and capital growth series are frozen at sector and All Property level. New portfolios are added from time to time, but without their histories. The histories of any funds that are sold off, or otherwise cease to contribute their data to IPD, remain in the indices historically. If portfolios are either split or merged, the history remains in the indices in the original form and continues in their new split or merged versions.
At present, all other IPD indices are unfrozen and subject to historical restatement, if and when additional portfolios are added to their constituent databanks. Indices are not frozen historically if it is felt that additional information from additional portfolios would create a more accurate picture of the market.
Alterations to frozen index historical results
If, in consultation with international partners, consultative groups and other relevant organisations / individuals, IPD decides that a change in computation method will be beneficial these will normally be restated historically for the sake of presenting a consistent, continuous series.
Likewise, if it is agreed after consultation that a change to the method of computation or composition of the series would be beneficial to the users of an index, a restatement of historic index returns may result.
The frozen index series may also be restated if a significant error in data recording or computation is discovered. IPD makes every effort to avoid this situation, and these indices are frozen against minor data amendments.
Frozen fund index series
The AREF/IPD UK Pooled Property Fund Index and Mercer/IPD Australian Pooled Property Fund Index - Core Wholesale are frozen. By frozen, IPD means that the aggregate index series derived from the fund data are frozen after each release. Any retrospective fund data amendments do not affect the frozen time series. This includes the index medians and descriptive data.
However, where individual fund returns are published these are always live. Required data amendments are accommodated so that the IPD fund returns match the fund returns made available elsewhere.
Review of index composition
A review of index composition occurs when the contribution from a single firm of valuers rises above 25% by value of the capital employed in an index. Similarly, such a review occurs when any one investor contributes in excess of 50% by value to either the overall index or any of the published sectors therein. This review must include consultation with the investor in question, and seek written permission to publish results in which they dominate.
Portfolio types permitted in indices
Properties from all fund and portfolio types are eligible for inclusion in IPD indices, irrespective of their liabilities and investment disciplines. This includes unitised, securitised and partnership vehicles, as long as they meet required valuation standards and provide full asset level information in accordance with IPD internal rules and data definitions.
Joint ventures and private investments are not permitted for inclusion within a fund index.
Addition of new portfolios
New portfolios or funds will be added to index samples once the index is considered stable. All additions and withdrawals are communicated, provided they have a material impact on size and structure of the index. For example, if a fund were to leave the IPD UK Annual Property Index, communication would be made available on IPD’s website at least of three months in advance.

IPD.com/IndexGuide 18
IPD Index Guide 2012
Minimum market coverage
The publication of new IPD indices will be delayed if the total value of capital employed is less than 20% of the best available estimate of the total value of the market they are intended to track.
This estimate will reflect the ungeared value of all directly held properties in each of the professionally managed portfolios whose mandate is primarily focused on the market in question. Where relevant, the interests of known multinational investors will be included.
The exception to this is when the national market is so large that a robust sample is attained with less than 20% of the market covered.
Delays to publication of indices
As the compiler of the index, IPD retains the right to delay the calculation and publication of index results, or to suspend or discontinue the publication of index results, if it believes that there are circumstances preventing the correct and consistent calculation of an index.
Further InformationIndex status
Consultative index
An index is given ‘Consultative’ status during the early stages of its development. This highlights to users that the index is likely to grow in size over time and thus historical results are likely to be restated to a greater extent than established indices. Consultative status is used to encourage users, contributors and potential contributors to engage with IPD about the future of the index.
Indicator
An indicator is a guide to market performance that is released between two annual index releases. These indicator results are produced on a smaller sample than index results and have no history. Once the latest annual index is published, the interim period indicator results are no longer valid as they have been replaced with robust full annual index results.
IPD property market informationDatabases for detailed analysis
In addition to property indices for each country in which it operates, IPD also produces a range of publications and research reports investigating market investment performance in detail. IPD indices are transparent because the databases make it possible to analyse these markets using more detailed breakdowns of property type and location, and many additional measures of capital and income performance - all on a completely consistent basis.
This consistent ‘market performance’ approach is used in:
• IPD Annual Indices
• IPD Biannual Indices
• IPD Quarterly Indices
• IPD Monthly Indices
• IPD Market Digests - in depth market reports
• IPD Key Centres Publications - standard local market publications.
Inclusion of standing investment properties
Index results and all IPD standard research publications are based on standing investment properties. These must be revalued at least once during the reporting period, and exclude the effect of buying, selling and development. In the time-weighted methodology, standing investments are not only properties with a valuation at the start and finish of the measurement period; other properties may contribute to standing investment returns for a part of the period if they have a valuation after (or before) an excluding event. A property will qualify for inclusion between any pair of actual valuations.
Other exclusions from market measures
Index figures exclude properties where terms of ownership, or specific events such as major capital expenditure, mean that changes in value throughout the year may have been influenced by non-market factors.
19 IPD.com/IndexSchedule
These rules are designed to make an index a measure of the return to be expected from held investments without active management, and therefore a fair basis for comparison across asset classes and between markets.
Some properties, such as occupational properties, are excluded from market measures in all periods. Others, such as those affected by refurbishment or improvement spending, are excluded only for those months in which the spending has occurred. A property is excluded from market measures where:
• monthly net expenditure amounts to 10% or more of capital value
• it has a zero or negative capital value
• it is predominantly owner occupied
• there is a change of ownership share
• it is held on a short leasehold with less than 25 years term remaining
• it is a fixed rent property where market rental value is more than five times the current rent
• it has been subject to unique events such as fire damage or flooding.
Fund market information
The aim of a fund index is to report the status of the market to the industry. Further breakdowns and analysis of the national and multinational fund indices are available and bespoke requests can be explored.
The status of properties is not of concern for a fund index. A fund can contribute for any time period while it meets the inclusion criteria. However, as with the inclusion of standing investments, a fund can only contribute to the medians of an index where it has provided a return for that reporting period.
IPD.com/IndexGuide 20
IPD Index Guide 2012
Acquiring index licences
Requirements for trading derivatives
No derivative or other financial product may be linked to IPD data for the purpose of determining the product’s capital value, income yield or any other material outcome without acquiring a licence from IPD. The licence will be based on a standard IPD licence template and will detail precisely what data will be used, for what commercial or other purpose, and on what terms. Licences are available to any party willing to accept the terms of licence.
Since February 2009, Europe’s first property futures are tradable at Eurex. The property futures are annual contracts based on the All Property total returns of the IPD UK Annual Property Index for individual calendar years.
Requirements for redistributing IPD statistics
No sale, resale, distribution, transmission or other form of re-publication of IPD data may be made without IPD’s prior written consent. No commercial use may be made of IPD data or any of its published statistics other than:
• internally within an organisation
• in specifically pre-agreed published research reports whose content has been submitted to IPD for prior approval
• in advice to clients which draws selectively on IPD data.
In each such case, any quotation of IPD figures should be clearly attributed. All IPD data is the exclusive property of IPD or its licensors, and is protected by copyright, database rights and other intellectual property laws.
Requirements for using IPD data for portfolio benchmarking
IPD’s benchmarks and other related statistics are the intellectual property of IPD and may be used by subscribers without a licence for internal research purposes only. Companies wishing to use IPD statistics to report performance publicly must apply for a licence to utilise the information in any formal documentation or to publish the figures within widely circulated reports.
An IPD licence can be obtained in one of two ways:
• If a fund subscribes to the Portfolio Analysis Service it gains the right to publish the portfolio’s result and its benchmark in any medium. A licence to use and republish IPD statistics is implicit for subscribers of this service.
• If a client wishes to remain outside the Portfolio Analysis Service, then IPD may grant a licence to use a relevant IPD series as a benchmark. The cost of a license will depend on the size of the portfolio, but will be no less than the cost of being measured and fully benchmarked by IPD.
Fund index licenses
If a fund wishes to use an IPD Property Fund Index as a benchmark, but is not a contributor to that index, a license must be obtained. Licenses are issued on a fund by fund basis. Contributing funds may access and view the content but may not otherwise - without limitation - copy, distribute, sell, publish, or commercially exploit any of the content included within a Property Fund Index without IPD’s prior written permission.
21 IPD.com/IndexSchedule
Frequently Asked Questions
1. Is there a minimum size for a property to be included in IPD indices and benchmarks, in terms of either value or lettable area?
There is no minimum size, as all assets held within client portfolios are included in IPD outputs.
2. Is there a minimum frequency with which included properties must be valued?
In order to be included in a monthly, quarterly or biannual index, properties must be valued on a monthly, quarterly or biannual basis respectively.To be included in an annual index, properties must be valued at least once a year, although not necessarily at year end.
3. Who is allowed to carry out valuations which contribute to IPD indices?
IPD requests that external valuations are provided wherever possible. However, internal valuations are also permitted, but must meet the definition of market value which is applied by IPD in each national market, e.g. in accordance with the RICS Red Book.
4. Is there a technical committee that monitors the credibility of IPD indices?
In the UK, IPD is advised by its Index Consultative Group, which meets twice a year. This reviews the composition and construction rules for UK monthly, quarterly and annual indices on a regular basis. It is an independent, non-executive body whose members are drawn from the property investment industry, universities, major research and chartered surveying firms and index publication and investment measurement organisations. A parallel Portfolio Analysis Service Consultative Group advises on the benchmarking techniques and measurement procedures used by IPD.
Similar groups advise on IPD’s indices in other national markets, although the distinction between Index and Portfolio Analysis is not usually made due to a typically smaller client pool from which to draw membership.
5. What stage of development completion must a building reach before it is included in an IPD index?
No developments are included in IPD indices, due to their potentially idiosyncratic performance.
IPD considers that a building ceases to be a development either six months after practical completion, or when it is 75% let, whichever is sooner. However, these properties are recorded by IPD and appear in the owner’s PAS reports and benchmark results.
6. Does IPD query unusual data supplied by its participants, such as large losses or gains?
Any extreme changes in data inputs from period to period are queried with participating clients. Clients are required to sign off their reports before their data is included in indices and benchmarks.
7. How are refurbishments, partial sales and vacancies dealt with?
Significant refurbishment and partial sales are not reflected in the indices, from which they are excluded. Minor refurbishments are treated as normal expenditure. Vacant properties are included in indices, with their valuation and income stream (likely to be zero) reflecting that vacancy.
8. How do actual transaction prices affect the indices?
Properties which are bought into or sold from contributing portfolios do not contribute to IPD indices in the period when they are transacted. They are however included in benchmarks.
9. Why are time-weighted returns used rather than money-weighted? That is to say, chain-linked monthly returns even for quarterly, biannual and annual indices?
Time-weighted returns are comparable with other assets where time-weighted return calculations are the norm, and conform with international standards, in particular the Global Investment Performance Standard (GIPS). The trend towards more frequent valuations requires IPD to be able to provide measurement over almost any period on a comparable basis. This can only be achieved by using a consistent building block of monthly cashflows.
This also means that IPD uses identical calculation methods for all outputs worldwide, greatly expanding the potential for international comparison.

IPD.com/IndexGuide 22
IPD Index Guide 2012
10. IPD often refers to sectors and segments within an index. What is the difference?
The IPD standard sectors are broad types of property use - Retail, Office, Industrial, Residential and Other. Segments, also referred to as sub-sectors, are any further disaggregation of these sectors into more specific property types or regions, eg. shopping centre is a segment of All Retail, distribution warehouse is a segment of All Industrial etc.
11. Why is residential property included in some indices, but not others?
Property types included within an index are dependent on the assets held by the Portfolio Analysis Service clients in that country. Therefore, if residential property is favoured by institutional investors in a given market, it will be represented within that country’s index in the same proportion to the value of residential properties held within the constituent portfolios.
12. Does IPD hold data beyond that published in their indices?
Yes. The base date of an index is set at the point where the majority of funds are able to provide data, or where the minimum market coverage has been reached. If funds have submitted data prior to the index base date, and or there is additional market data considered unsuitable for an index, IPD can make this available. However, before this data is made available, IPD will ensure the user is aware of its boundaries.
13. What is a property fund?
Broadly speaking a pooled fund is a professionally managed fund that allows third party access to direct and indirect property (including derivatives and fund of funds). The majority of the fund must be held in physical property. The fund must have been, currently be, or intending to be open for third party investment.
14. How can a fund join a property fund index?
A fund must complete a Data Collection Form, which will determine if the fund is eligible and ensure all necessary data fields are provided. A newly completed Data Collection Form must be submitted one month prior to the end of the reporting period and then again at the update time.
15. How should net asset value (NAV) be calculated and provided to IPD?
A fund’s NAV is the sum of the value of all its assets (including cash, derivatives and indirect property investments) less all its liabilities.
Providing they are calculated on a consistent basis over time, funds are, at present, asked to submit NAVs drawn up under whichever accounting convention they use to prepare their annual accounts (or the equivalent). In practice this usually means either local Generally Accepted Accounting Principles (Local GAAP) or International Financial Reporting Standards (IFRS). NAVs calculated under IFRS are reported after marking fixed rate debt to market value: those calculated under local GAAP are not.
16. Are the property fund index returns net or gross of fees?
The returns are net of fees and management costs. Where fee information is provided to IPD we do have the capability to produce returns gross of fees.
17. What is the value of being a property fund index contributor?
Funds contributing to a property fund index may use the index return as a benchmark, free of charge. Headline data, historic time series and fund specific returns are available to all contributors.
Fund indices are the second most downloaded index of the 100+ IPD Indices; therefore each fund receives a considerable amount of exposure. This exposure can be utilised by prospective investors, while current investors benefit from transparency.
23 IPD.com/IndexSchedule
Australia
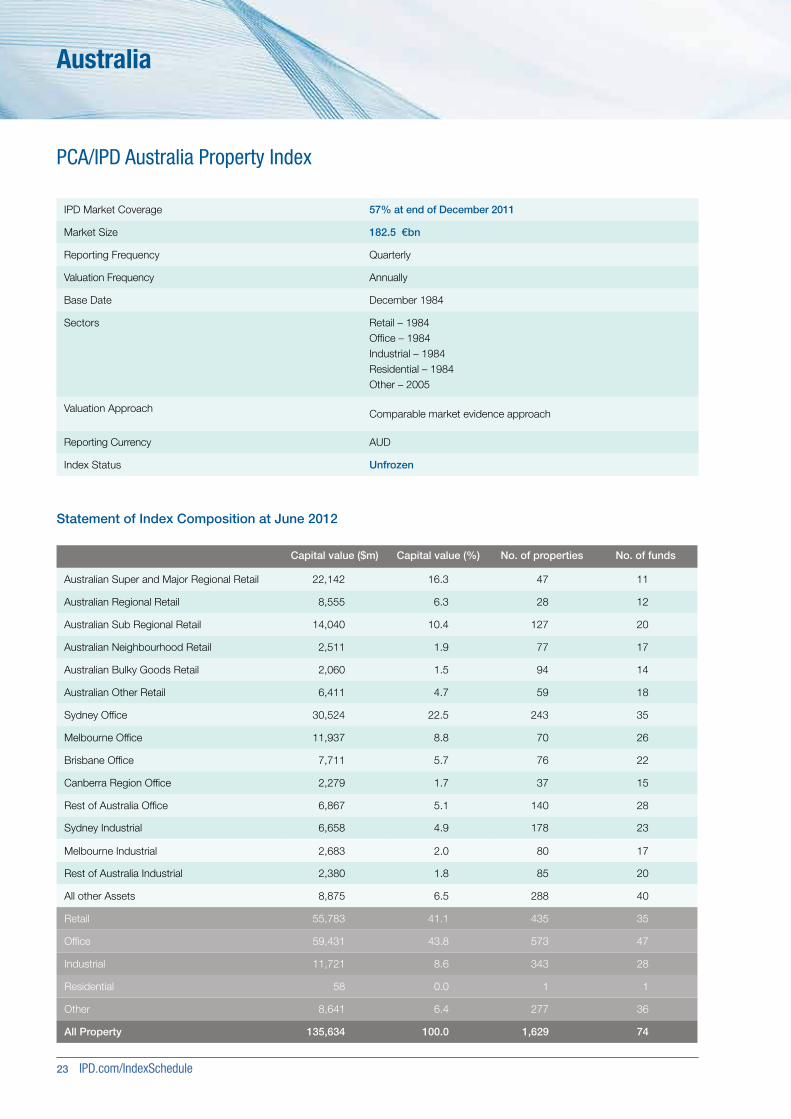
PCA/IPD Australia Property Index
Capital value ($m) Capital value (%) No. of properties No. of funds
Australian Super and Major Regional Retail 22,142 16.3 47 11
Australian Regional Retail 8,555 6.3 28 12
Australian Sub Regional Retail 14,040 10.4 127 20
Australian Neighbourhood Retail 2,511 1.9 77 17
Australian Bulky Goods Retail 2,060 1.5 94 14
Australian Other Retail 6,411 4.7 59 18
Sydney Office 30,524 22.5 243 35
Melbourne Office 11,937 8.8 70 26
Brisbane Office 7,711 5.7 76 22
Canberra Region Office 2,279 1.7 37 15
Rest of Australia Office 6,867 5.1 140 28
Sydney Industrial 6,658 4.9 178 23
Melbourne Industrial 2,683 2.0 80 17
Rest of Australia Industrial 2,380 1.8 85 20
All other Assets 8,875 6.5 288 40
Retail 55,783 41.1 435 35
Office 59,431 43.8 573 47
Industrial 11,721 8.6 343 28
Residential 58 0.0 1 1
Other 8,641 6.4 277 36
All Property 135,634 100.0 1,629 74
Statement of Index Composition at June 2012
IPD Market Coverage 57% at end of December 2011
Market Size 182.5 €bn
Reporting Frequency Quarterly
Valuation Frequency Annually
Base Date December 1984
Sectors Retail – 1984Office – 1984Industrial – 1984Residential – 1984Other – 2005
Valuation Approach Comparable market evidence approach
Reporting Currency AUD
Index Status Unfrozen
IPD.com/IndexGuide 24
IPD Index Guide 2012
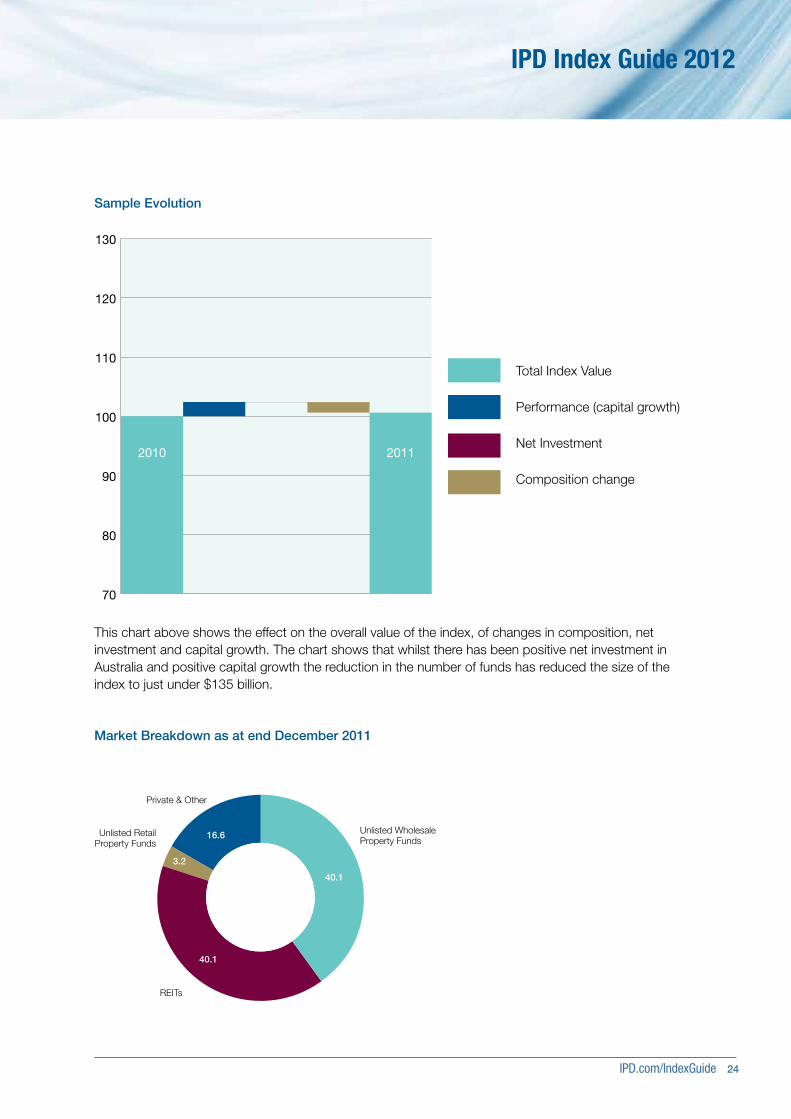
Market Breakdown as at end December 2011
40.1
40.1
3.2
16.6
REITs
Unlisted Retail Property Funds
Private & Other
Unlisted Wholesale Property Funds
70
80
90
100
110
120
130
2010 2011
Sample Evolution
This chart above shows the effect on the overall value of the index, of changes in composition, net investment and capital growth. The chart shows that whilst there has been positive net investment in Australia and positive capital growth the reduction in the number of funds has reduced the size of the index to just under $135 billion.
Total Index Value
Performance (capital growth)
Net Investment
Composition change
25 IPD.com/IndexSchedule
Australia
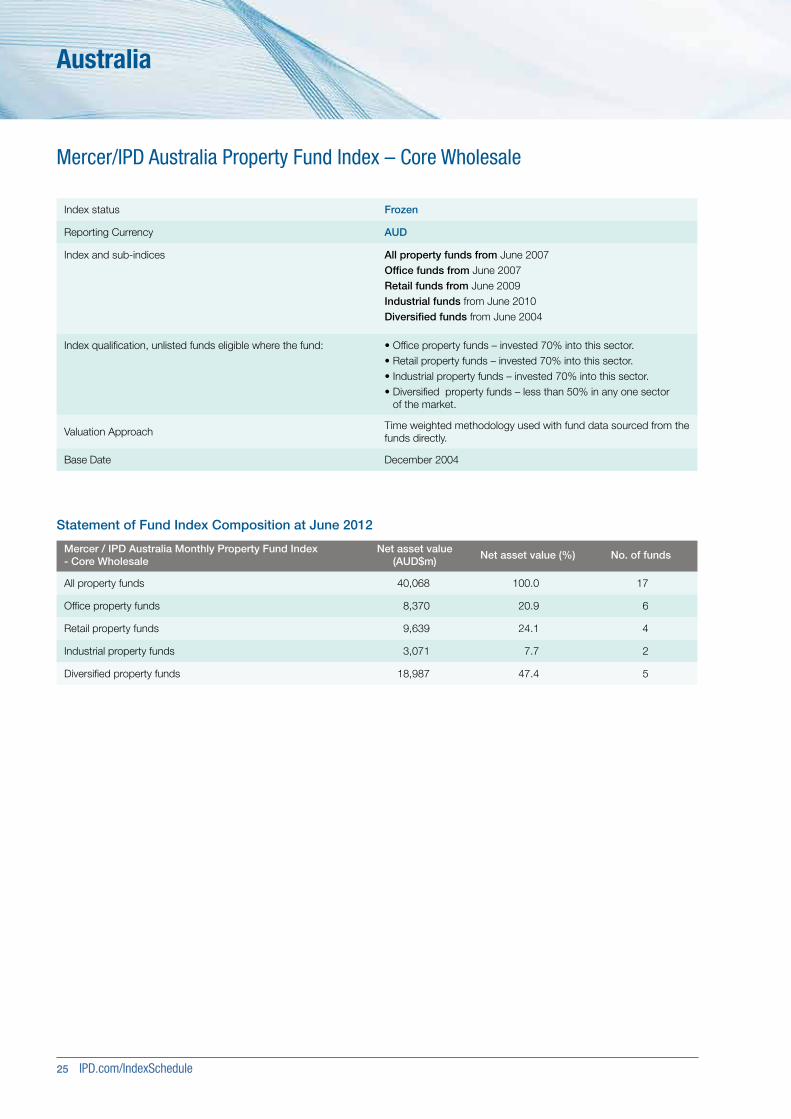
Mercer/IPD Australia Property Fund Index – Core Wholesale
Statement of Fund Index Composition at June 2012
Mercer / IPD Australia Monthly Property Fund Index - Core Wholesale
Net asset value (AUD$m)
Net asset value (%) No. of funds
All property funds 40,068 100.0 17
Office property funds 8,370 20.9 6
Retail property funds 9,639 24.1 4
Industrial property funds 3,071 7.7 2
Diversified property funds 18,987 47.4 5
Index status Frozen
Reporting Currency AUD
Index and sub-indices All property funds from June 2007Office funds from June 2007Retail funds from June 2009Industrial funds from June 2010Diversified funds from June 2004
Index qualification, unlisted funds eligible where the fund: • Office property funds – invested 70% into this sector.• Retail property funds – invested 70% into this sector.• Industrial property funds – invested 70% into this sector.• Diversified property funds – less than 50% in any one sector
of the market.
Valuation ApproachTime weighted methodology used with fund data sourced from the funds directly.
Base Date December 2004
IPD.com/IndexGuide 26
IPD Index Guide 2012
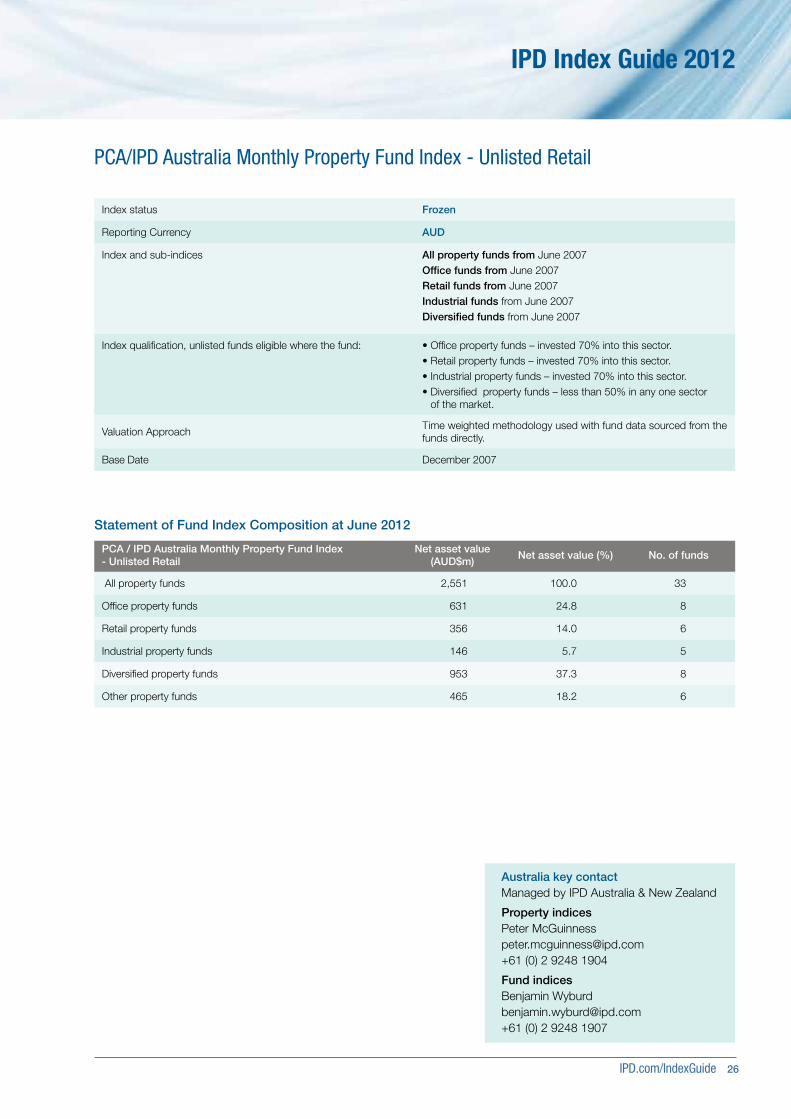
PCA/IPD Australia Monthly Property Fund Index - Unlisted Retail
Statement of Fund Index Composition at June 2012
PCA / IPD Australia Monthly Property Fund Index - Unlisted Retail
Net asset value (AUD$m)
Net asset value (%) No. of funds
All property funds 2,551 100.0 33
Office property funds 631 24.8 8
Retail property funds 356 14.0 6
Industrial property funds 146 5.7 5
Diversified property funds 953 37.3 8
Other property funds 465 18.2 6
Index status Frozen
Reporting Currency AUD
Index and sub-indices All property funds from June 2007Office funds from June 2007Retail funds from June 2007Industrial funds from June 2007Diversified funds from June 2007
Index qualification, unlisted funds eligible where the fund: • Office property funds – invested 70% into this sector.• Retail property funds – invested 70% into this sector.• Industrial property funds – invested 70% into this sector.• Diversified property funds – less than 50% in any one sector
of the market.
Valuation ApproachTime weighted methodology used with fund data sourced from the funds directly.
Base Date December 2007
Australia key contactManaged by IPD Australia & New Zealand
Property indicesPeter McGuinness [email protected] +61 (0) 2 9248 1904
Fund indices Benjamin Wyburd [email protected] +61 (0) 2 9248 1907
27 IPD.com/IndexSchedule
Austria
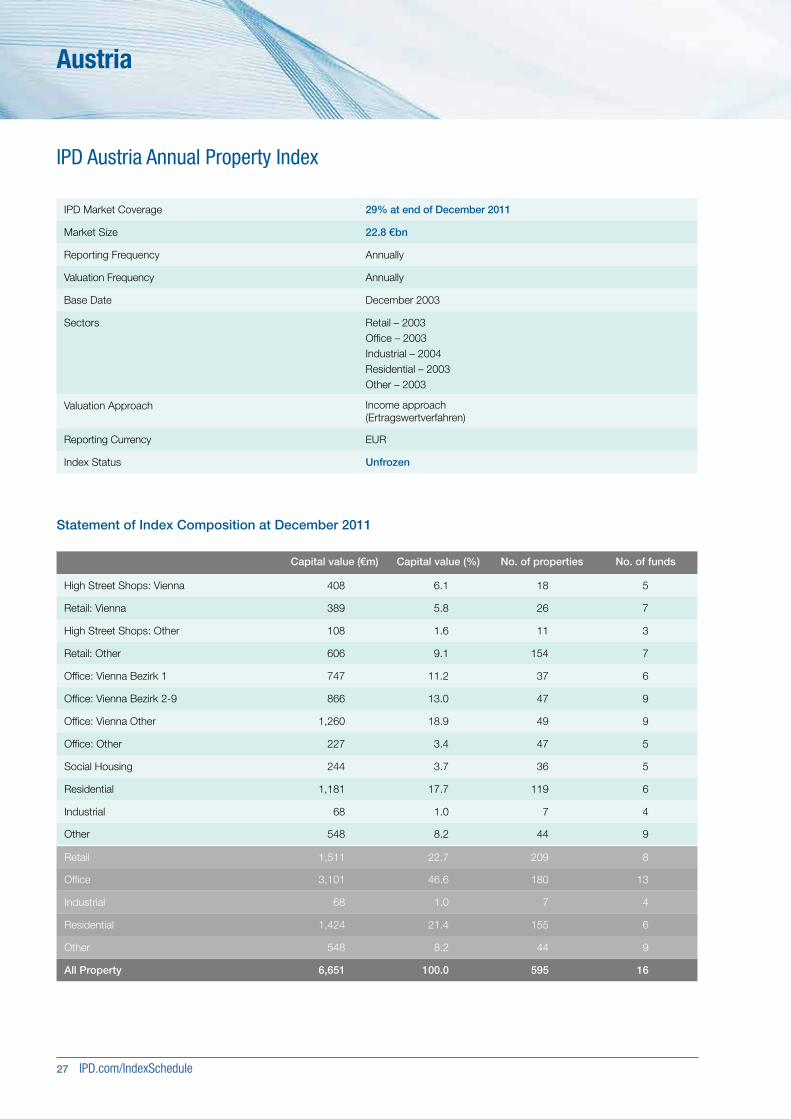
IPD Austria Annual Property Index
Capital value (€m) Capital value (%) No. of properties No. of funds
High Street Shops: Vienna 408 6.1 18 5
Retail: Vienna 389 5.8 26 7
High Street Shops: Other 108 1.6 11 3
Retail: Other 606 9.1 154 7
Office: Vienna Bezirk 1 747 11.2 37 6
Office: Vienna Bezirk 2-9 866 13.0 47 9
Office: Vienna Other 1,260 18.9 49 9
Office: Other 227 3.4 47 5
Social Housing 244 3.7 36 5
Residential 1,181 17.7 119 6
Industrial 68 1.0 7 4
Other 548 8.2 44 9
Retail 1,511 22.7 209 8
Office 3,101 46.6 180 13
Industrial 68 1.0 7 4
Residential 1,424 21.4 155 6
Other 548 8.2 44 9
All Property 6,651 100.0 595 16
Statement of Index Composition at December 2011
IPD Market Coverage 29% at end of December 2011
Market Size 22.8 €bn
Reporting Frequency Annually
Valuation Frequency Annually
Base Date December 2003
Sectors Retail – 2003Office – 2003Industrial – 2004Residential – 2003Other – 2003
Valuation Approach Income approach (Ertragswertverfahren)
Reporting Currency EUR
Index Status Unfrozen
IPD.com/IndexGuide 28
IPD Index Guide 2012
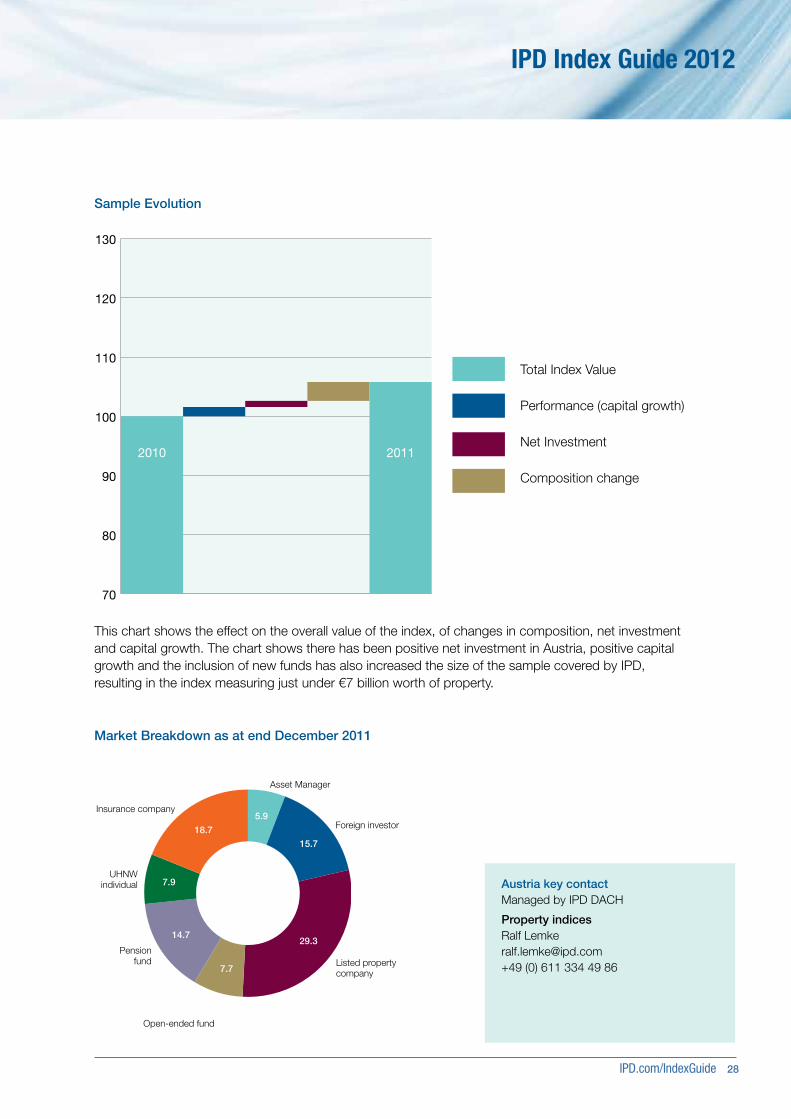
Market Breakdown as at end December 2011
Asset Manager
5.9
15.7
29.314.7
7.9
18.7
7.7
Open-ended fund
Pension fund
UHNW individual
Insurance company
Foreign investor
Listed property company
70
80
90
100
110
120
130
2010 2011
Sample Evolution
This chart shows the effect on the overall value of the index, of changes in composition, net investment and capital growth. The chart shows there has been positive net investment in Austria, positive capital growth and the inclusion of new funds has also increased the size of the sample covered by IPD, resulting in the index measuring just under €7 billion worth of property.
Total Index Value
Performance (capital growth)
Net Investment
Composition change
Austria key contactManaged by IPD DACH
Property indicesRalf Lemke [email protected] +49 (0) 611 334 49 86
29 IPD.com/IndexSchedule
Belgium
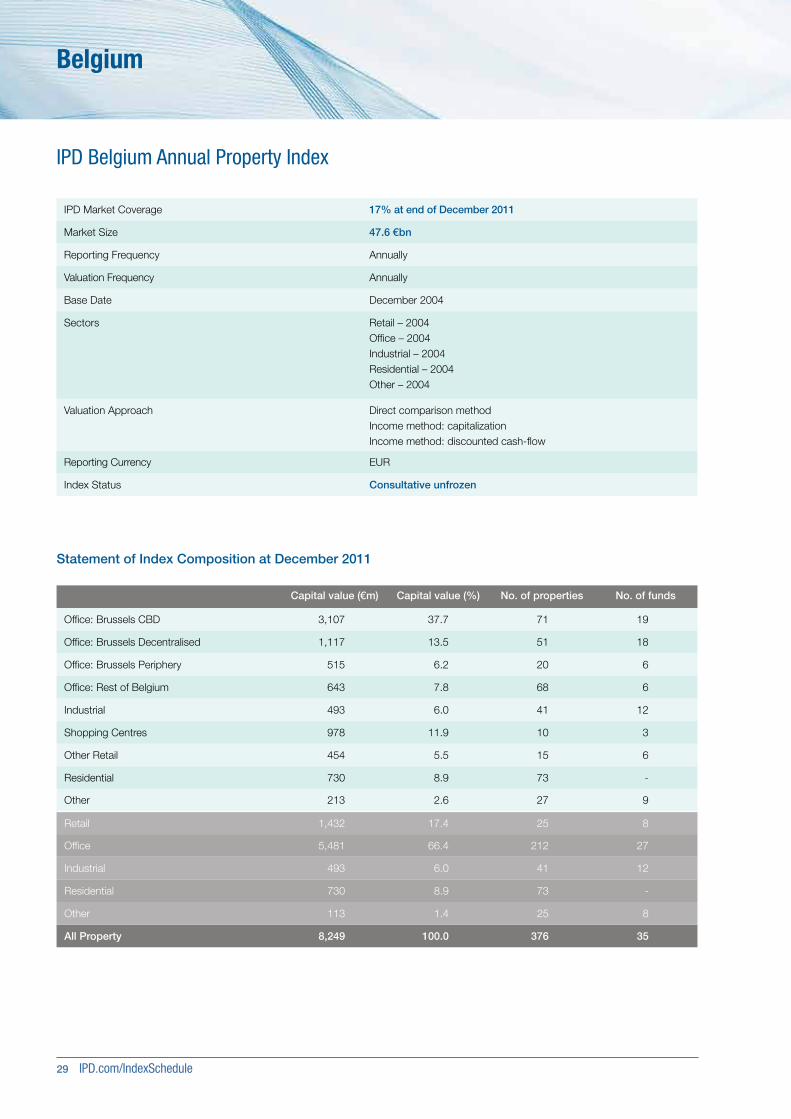
IPD Belgium Annual Property Index
Capital value (€m) Capital value (%) No. of properties No. of funds
Office: Brussels CBD 3,107 37.7 71 19
Office: Brussels Decentralised 1,117 13.5 51 18
Office: Brussels Periphery 515 6.2 20 6
Office: Rest of Belgium 643 7.8 68 6
Industrial 493 6.0 41 12
Shopping Centres 978 11.9 10 3
Other Retail 454 5.5 15 6
Residential 730 8.9 73 -
Other 213 2.6 27 9
Retail 1,432 17.4 25 8
Office 5,481 66.4 212 27
Industrial 493 6.0 41 12
Residential 730 8.9 73 -
Other 113 1.4 25 8
All Property 8,249 100.0 376 35
Statement of Index Composition at December 2011
IPD Market Coverage 17% at end of December 2011
Market Size 47.6 €bn
Reporting Frequency Annually
Valuation Frequency Annually
Base Date December 2004
Sectors Retail – 2004Office – 2004Industrial – 2004Residential – 2004Other – 2004
Valuation Approach Direct comparison methodIncome method: capitalizationIncome method: discounted cash-flow
Reporting Currency EUR
Index Status Consultative unfrozen

IPD.com/IndexGuide 30
IPD Index Guide 2012
Market Breakdown as at end December 2011
Closed Ended Funds
Other
Fund Manager 0.3
Pension Fund 0.1
14.7
19.6
20.5
12.8
15.8
5.26.2
SICAFI
Open Ended Funds 2.9
Private Funds
Non-ListedManagement Company
REIT
Insurance Funds
70
80
90
100
110
120
130
2010 2011
Sample Evolution
This chart shows the effect on the overall value of the index, of changes in composition, net investment and capital growth. The chart shows that in spite of the negative investment and poor performance, the sample covered by IPD has increased significantly, resulting in the index measuring over €8 billion worth of property.
Total Index Value
Performance (capital growth)
Net Investment
Composition change
Belgium key contactManaged by IPD Southern Europe
Property indicesSebastien [email protected]+49 (0) 611 334 49 986
31 IPD.com/IndexSchedule
Canada
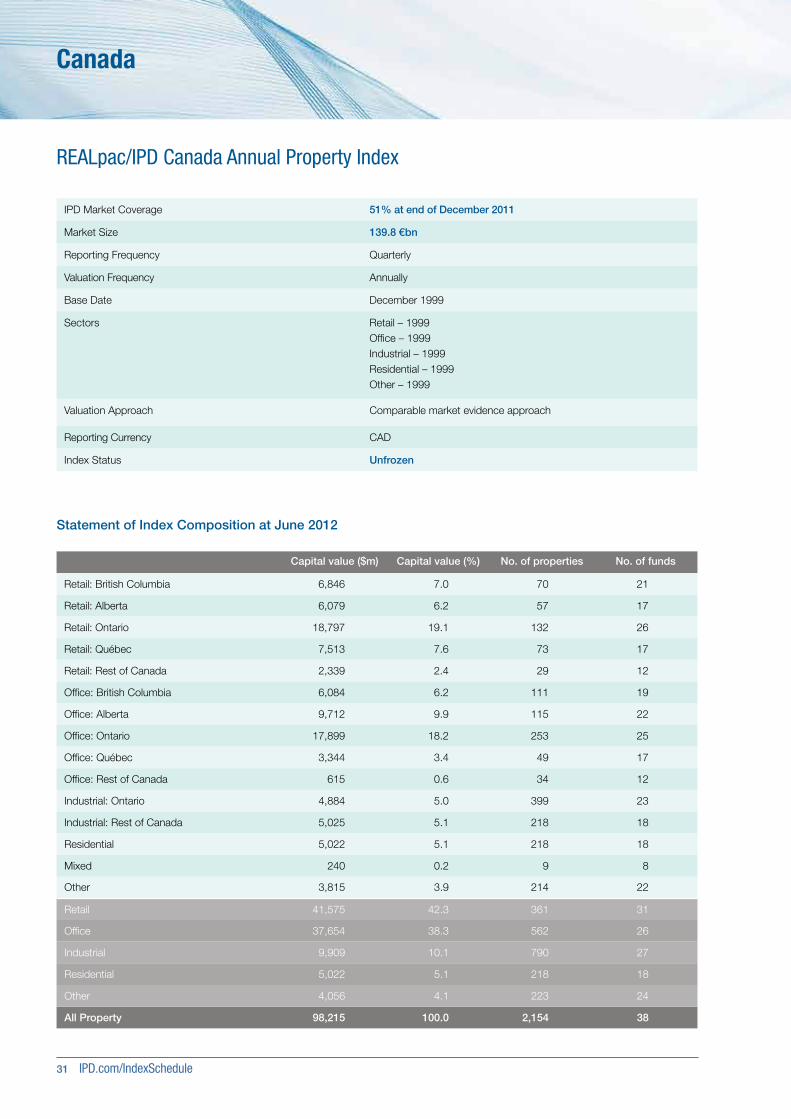
REALpac/IPD Canada Annual Property Index
Capital value ($m) Capital value (%) No. of properties No. of funds
Retail: British Columbia 6,846 7.0 70 21
Retail: Alberta 6,079 6.2 57 17
Retail: Ontario 18,797 19.1 132 26
Retail: Québec 7,513 7.6 73 17
Retail: Rest of Canada 2,339 2.4 29 12
Office: British Columbia 6,084 6.2 111 19
Office: Alberta 9,712 9.9 115 22
Office: Ontario 17,899 18.2 253 25
Office: Québec 3,344 3.4 49 17
Office: Rest of Canada 615 0.6 34 12
Industrial: Ontario 4,884 5.0 399 23
Industrial: Rest of Canada 5,025 5.1 218 18
Residential 5,022 5.1 218 18
Mixed 240 0.2 9 8
Other 3,815 3.9 214 22
Retail 41,575 42.3 361 31
Office 37,654 38.3 562 26
Industrial 9,909 10.1 790 27
Residential 5,022 5.1 218 18
Other 4,056 4.1 223 24
All Property 98,215 100.0 2,154 38
Statement of Index Composition at June 2012
IPD Market Coverage 51% at end of December 2011
Market Size 139.8 €bn
Reporting Frequency Quarterly
Valuation Frequency Annually
Base Date December 1999
Sectors Retail – 1999Office – 1999Industrial – 1999Residential – 1999Other – 1999
Valuation Approach Comparable market evidence approach
Reporting Currency CAD
Index Status Unfrozen
IPD.com/IndexGuide 32
IPD Index Guide 2012
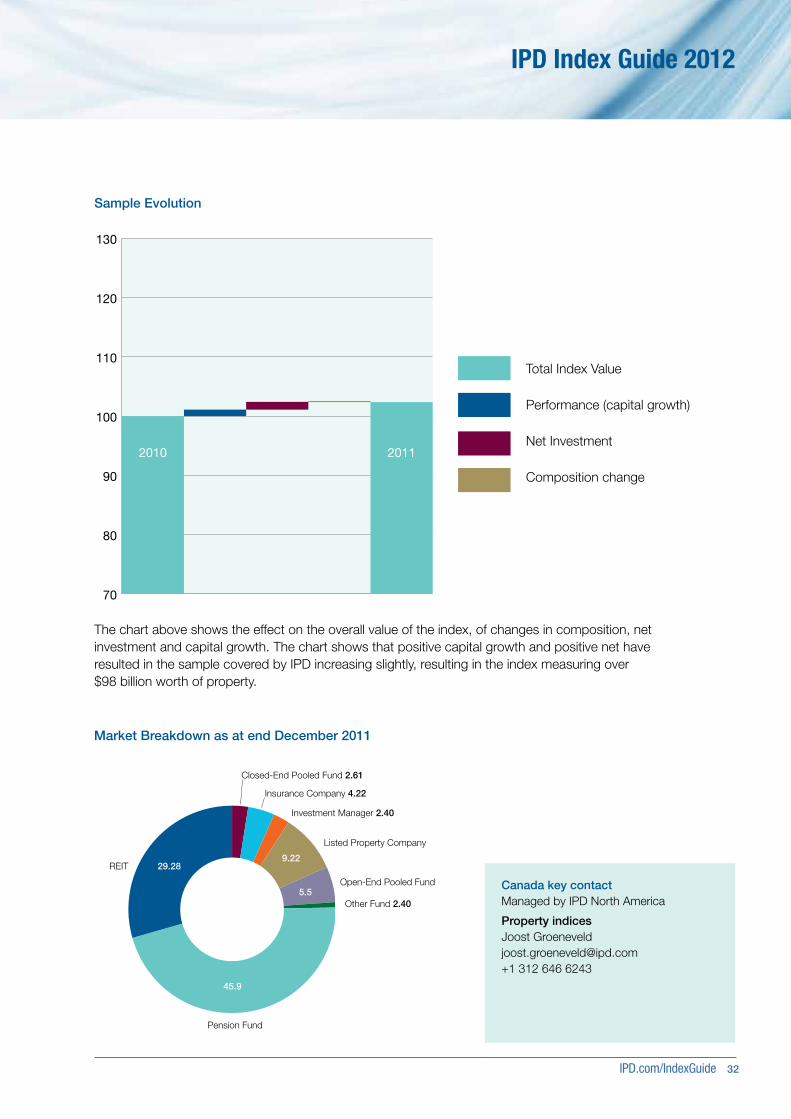
Market Breakdown as at end December 2011
70
80
90
100
110
120
130
2010 2011
Sample Evolution
Closed-End Pooled Fund 2.61
Insurance Company 4.22
Investment Manager 2.40
Other Fund 2.40
Pension Fund
REIT
Listed Property Company
Open-End Pooled Fund
9.22
5.5
45.9
29.28
The chart above shows the effect on the overall value of the index, of changes in composition, net investment and capital growth. The chart shows that positive capital growth and positive net have resulted in the sample covered by IPD increasing slightly, resulting in the index measuring over $98 billion worth of property.
Total Index Value
Performance (capital growth)
Net Investment
Composition change
Canada key contactManaged by IPD North America
Property indicesJoost [email protected] +1 312 646 6243

33 IPD.com/IndexSchedule
Czech Republic
IPD Czech Republic Annual Property Index
Capital value (€m) Capital value (%) No. of properties No. of funds
Retail 761 26.4 40 9
Office 1,578 54.8 42 12
Industrial 540 18.8 37 11
All Property 2,888 100.0 120 22
Statement of Index Composition at June 2012
IPD Market Coverage 26% at end of December 2011
Market Size 11.2 €bn
Reporting Frequency Annually
Valuation Frequency Annually
Base Date December 2004
Sectors Retail – 2004Office – 2004Industrial – 2005
Valuation Approach Comparable market evidence approach
Reporting Currency EUR
Index Status Consultative unfrozen
70
80
90
100
110
120
130
2010 2011
Sample Evolution
This chart shows the effect on the overall value of the index, of changes in composition, net investment and capital growth. Positive capital growth, net investment and the introduction of new properties into the index has resulted in it increasing in value to just under €3 billion.
Czech Republic key contactManaged by IPD DACH
Property indicesNassos Manginas nassos.manginas @ipd.com+44 (0) 20 7336 9316
Total Index Value
Performance (capital growth)
Net Investment
Composition change
IPD.com/IndexGuide 34
IPD Index Guide 2012
Czech Republic key contactManaged by IPD DACH
Property indicesNassos Manginas nassos.manginas @ipd.com+44 (0) 20 7336 9316
As the leading global provider of real estate benchmarking services, IPD provides benchmarking on portfolios of property assets held by investing institutions, and also on fund structures, which are increasingly used as financial wrappers for holding such assets. What is the difference between an index and a benchmark?
An index reflects market movement and therefore only includes direct property standing investments.
A benchmark includes all actively managed properties (buying, selling, developing) as well as standing investments.
The IPD Benchmarking Guide explains the principles and practices applied by IPD, key measures used and the framework for choosing IPD benchmarks across different markets and sectors.
IPD Benchmarking Guide
ipd.com/benchmarkingguide
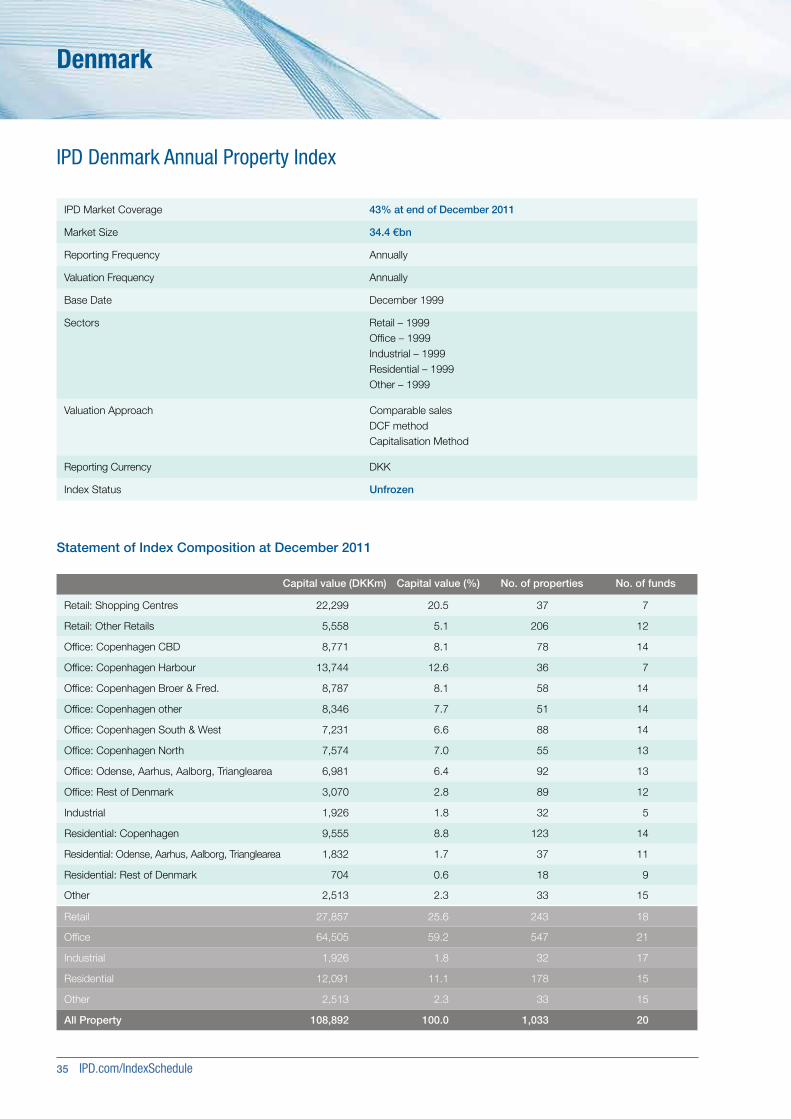
35 IPD.com/IndexSchedule
Denmark
IPD Denmark Annual Property Index
Statement of Index Composition at December 2011
Capital value (DKKm) Capital value (%) No. of properties No. of funds
Retail: Shopping Centres 22,299 20.5 37 7
Retail: Other Retails 5,558 5.1 206 12
Office: Copenhagen CBD 8,771 8.1 78 14
Office: Copenhagen Harbour 13,744 12.6 36 7
Office: Copenhagen Broer & Fred. 8,787 8.1 58 14
Office: Copenhagen other 8,346 7.7 51 14
Office: Copenhagen South & West 7,231 6.6 88 14
Office: Copenhagen North 7,574 7.0 55 13
Office: Odense, Aarhus, Aalborg, Trianglearea 6,981 6.4 92 13
Office: Rest of Denmark 3,070 2.8 89 12
Industrial 1,926 1.8 32 5
Residential: Copenhagen 9,555 8.8 123 14
Residential: Odense, Aarhus, Aalborg, Trianglearea 1,832 1.7 37 11
Residential: Rest of Denmark 704 0.6 18 9
Other 2,513 2.3 33 15
Retail 27,857 25.6 243 18
Office 64,505 59.2 547 21
Industrial 1,926 1.8 32 17
Residential 12,091 11.1 178 15
Other 2,513 2.3 33 15
All Property 108,892 100.0 1,033 20
IPD Market Coverage 43% at end of December 2011
Market Size 34.4 €bn
Reporting Frequency Annually
Valuation Frequency Annually
Base Date December 1999
Sectors Retail – 1999Office – 1999Industrial – 1999Residential – 1999Other – 1999
Valuation Approach Comparable salesDCF methodCapitalisation Method
Reporting Currency DKK
Index Status Unfrozen
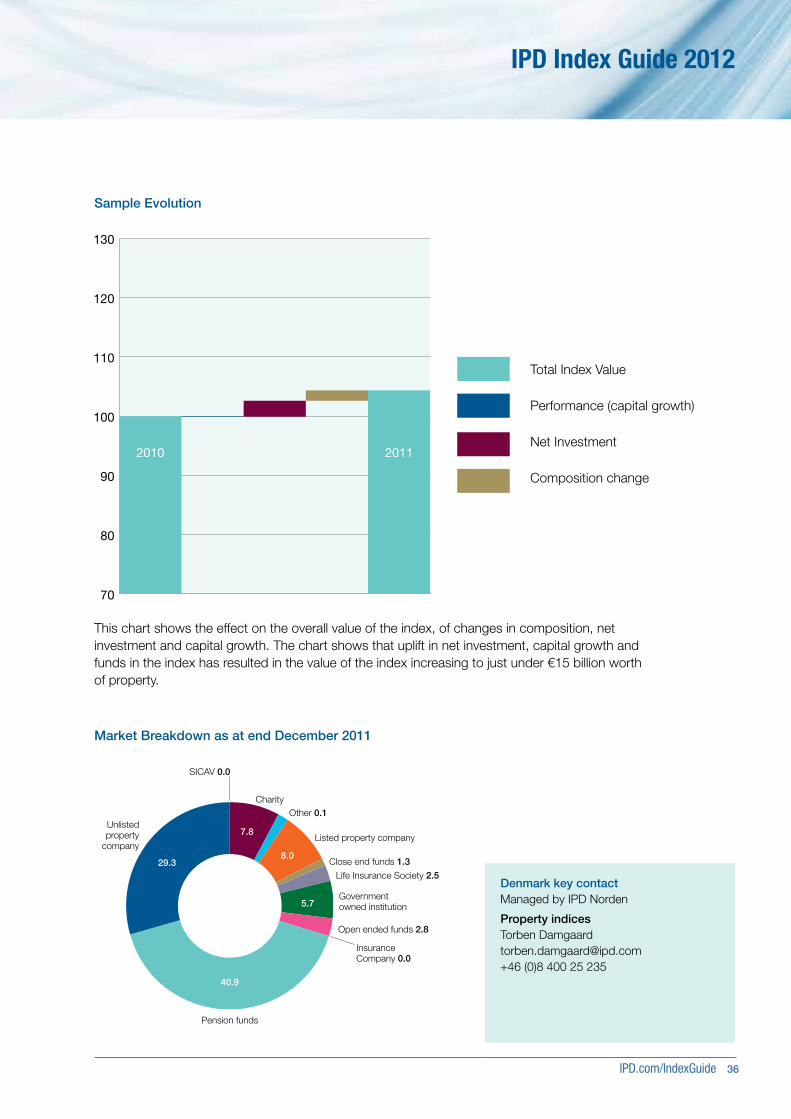
IPD.com/IndexGuide 36
IPD Index Guide 2012
Market Breakdown as at end December 2011
SICAV 0.0
Charity
Listed property company
Government owned institution
Other 0.1
Close end funds 1.3
Life Insurance Society 2.5
Open ended funds 2.8
Insurance Company 0.0
8.0
7.8
5.7
40.9
29.3
Unlisted property
company
Pension funds
70
80
90
100
110
120
130
2010 2011
Sample Evolution
This chart shows the effect on the overall value of the index, of changes in composition, net investment and capital growth. The chart shows that uplift in net investment, capital growth and funds in the index has resulted in the value of the index increasing to just under €15 billion worth of property.
Total Index Value
Performance (capital growth)
Net Investment
Composition change
Denmark key contactManaged by IPD Norden
Property indicesTorben Damgaard [email protected]+46 (0)8 400 25 235

37 IPD.com/IndexSchedule
France
IPD France Annual Property Index
Statement of Index Composition at December 2011
Capital value (€m) Capital value (%) No. of properties No. of funds
Office: Paris CBD 14,507 13.3 425 54
Office: Paris Other Areas 9,096 8.3 407 58
Office: West CBD - La Défense 19,887 18.2 569 73
Office: Rest of Petite Couronne 4,961 4.5 207 60
Office: Rest of Ile de France 3,125 2.9 359 53
Office: Other regions 4,606 4.2 1,160 65
Residential: Paris West, Centre & Neuilly 6,555 6.0 325 23
Residential: Rest of Paris 4,676 4.3 247 23
Residential: Rest of Ile de France 3,722 3.4 291 24
Residential: Other regions 1,473 1.3 216 16
Shopping Centres 18,602 17.0 652 50
All Other Retail 6,303 5.8 1,102 70
Warehouses and Logistics 6,401 5.8 443 48
Workshops 1,661 1.5 224 39
Mixed Use - Other 3,874 3.5 305 39
Retail 24,905 22.8 1,754 73
Office 56,183 51.3 3,127 91
Industrial 8,062 7.4 667 60
Residential 16,426 15.0 1,079 29
Other 3,874 3.5 305 39
All Property 109,450 100.0 6,932 6,932
IPD Market Coverage 46% at end of December 2011
Market Size 236.3 €bn
Reporting Frequency Annually
Valuation Frequency Annually
Base DateDecember 1997. Additional long term series available from 1986.
Sectors Retail – 1997Office – 1997Industrial – 1997Residential – 1997Other – 1997
Valuation Approach Direct comparison methodIncome method: capitalisationIncome method: discounted cash-flow
Reporting Currency EUR
Index Status Frozen
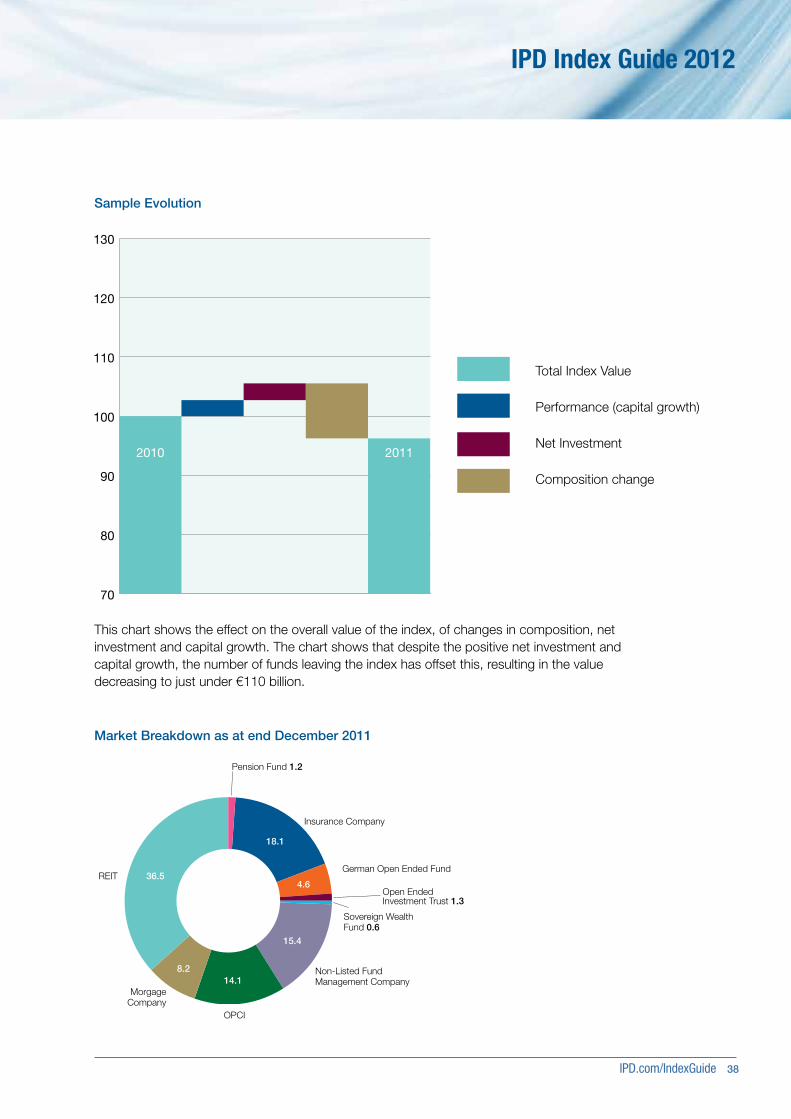
IPD.com/IndexGuide 38
IPD Index Guide 2012
Market Breakdown as at end December 2011
Pension Fund 1.2
Open Ended Investment Trust 1.3
Sovereign Wealth Fund 0.6
Insurance Company
German Open Ended Fund
Non-Listed Fund Management Company
Morgage Company
8.2
18.1
4.6
15.4
14.1
36.5REIT
OPCI
70
80
90
100
110
120
130
2010 2011
Sample Evolution
This chart shows the effect on the overall value of the index, of changes in composition, net investment and capital growth. The chart shows that despite the positive net investment and capital growth, the number of funds leaving the index has offset this, resulting in the value decreasing to just under €110 billion.
Total Index Value
Performance (capital growth)
Net Investment
Composition change
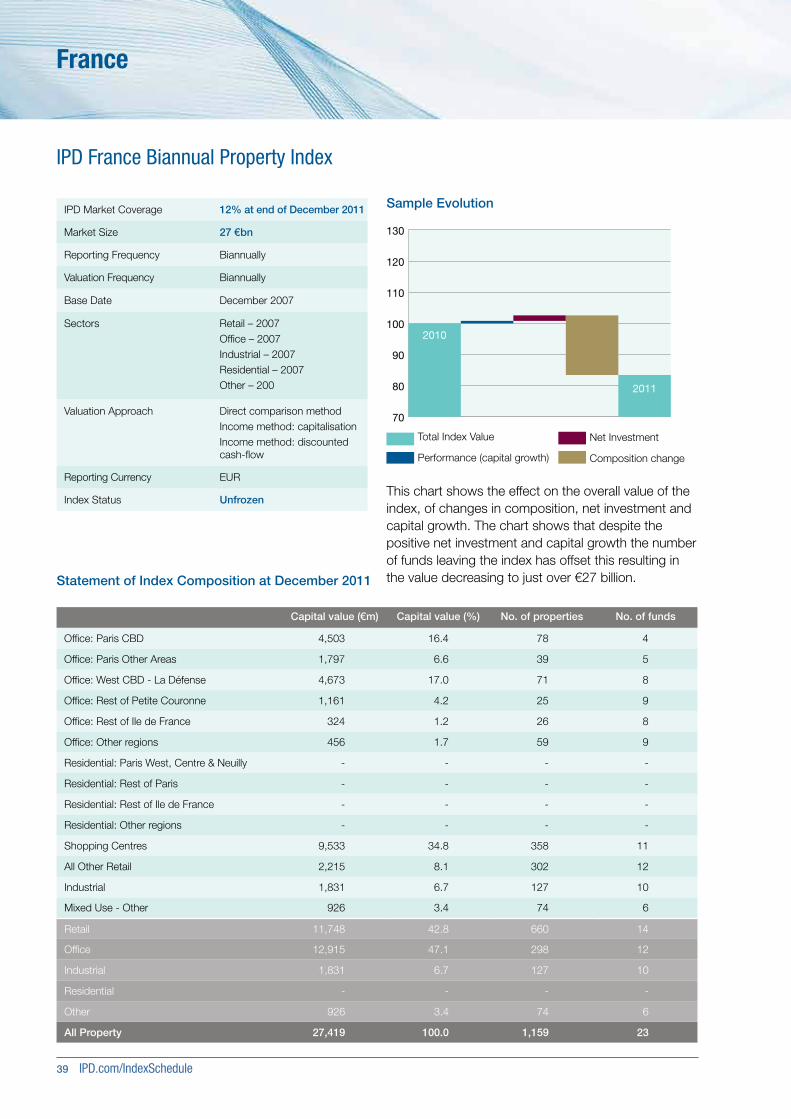
39 IPD.com/IndexSchedule
Statement of Index Composition at December 2011
70
80
90
100
110
120
130
2010
2011
Sample Evolution
This chart shows the effect on the overall value of the index, of changes in composition, net investment and capital growth. The chart shows that despite the positive net investment and capital growth the number of funds leaving the index has offset this resulting in the value decreasing to just over €27 billion.
Capital value (€m) Capital value (%) No. of properties No. of funds
Office: Paris CBD 4,503 16.4 78 4
Office: Paris Other Areas 1,797 6.6 39 5
Office: West CBD - La Défense 4,673 17.0 71 8
Office: Rest of Petite Couronne 1,161 4.2 25 9
Office: Rest of Ile de France 324 1.2 26 8
Office: Other regions 456 1.7 59 9
Residential: Paris West, Centre & Neuilly - - - -
Residential: Rest of Paris - - - -
Residential: Rest of Ile de France - - - -
Residential: Other regions - - - -
Shopping Centres 9,533 34.8 358 11
All Other Retail 2,215 8.1 302 12
Industrial 1,831 6.7 127 10
Mixed Use - Other 926 3.4 74 6
Retail 11,748 42.8 660 14
Office 12,915 47.1 298 12
Industrial 1,831 6.7 127 10
Residential - - - -
Other 926 3.4 74 6
All Property 27,419 100.0 1,159 23
IPD France Biannual Property Index
IPD Market Coverage 12% at end of December 2011
Market Size 27 €bn
Reporting Frequency Biannually
Valuation Frequency Biannually
Base Date December 2007
Sectors Retail – 2007Office – 2007Industrial – 2007Residential – 2007Other – 200
Valuation Approach Direct comparison methodIncome method: capitalisationIncome method: discounted cash-flow
Reporting Currency EUR
Index Status Unfrozen
Total Index Value
Performance (capital growth)
Net Investment
Composition change
France
IPD.com/IndexGuide 40
IPD Index Guide 2012
IPD France Biannual OPCI RFA Property Fund Index
Index status Unfrozen
Reporting Currency EUR
Index and sub-indices All property funds from December 2009Leverage: 0% from December 2009Leverage: 0–50% from December 2009Leverage: >50% from December 2009
Index qualification, unlisted funds eligible where the fund: • Is an OPCI structure• Reports biannually to investors• Re-values the direct portfolio at least biannually• Has been/will be/is open to new investment from third parties
Valuation Approach Direct comparison method
Base Date December 2009
Statement of Fund Index Composition at June 2012
Index name Net asset value (€m) Net asset value (%) No. of Funds
IPD France Biannual OPCI RFA Index - All property funds 9,147 100.0 67
IPD France Biannual OPCI RFA Index - Unleveraged 5,847 63.9 36
IPD France Biannual OPCI RFA Index - Leveraged: 0% - 50% 2,721 29.8 20
IPD France Biannual OPCI RFA Index - Leveraged: > 50% 579 6.3 11
OPCI RFA funds are property funds open to institutional investors. The portfolio must comprise of at least 60% of direct property assets with liquidity of up to 10%. They benefit from flexible taxation. SCPI funds are not covered in this index.
France key contactManaged by IPD Southern Europe
Property indicesCarine Dassé carine.dassé@ipd.com+33 (0)1 58 05 36 81
Fund indices Thomas Morizet [email protected] +33 (0)1 58 05 36 54
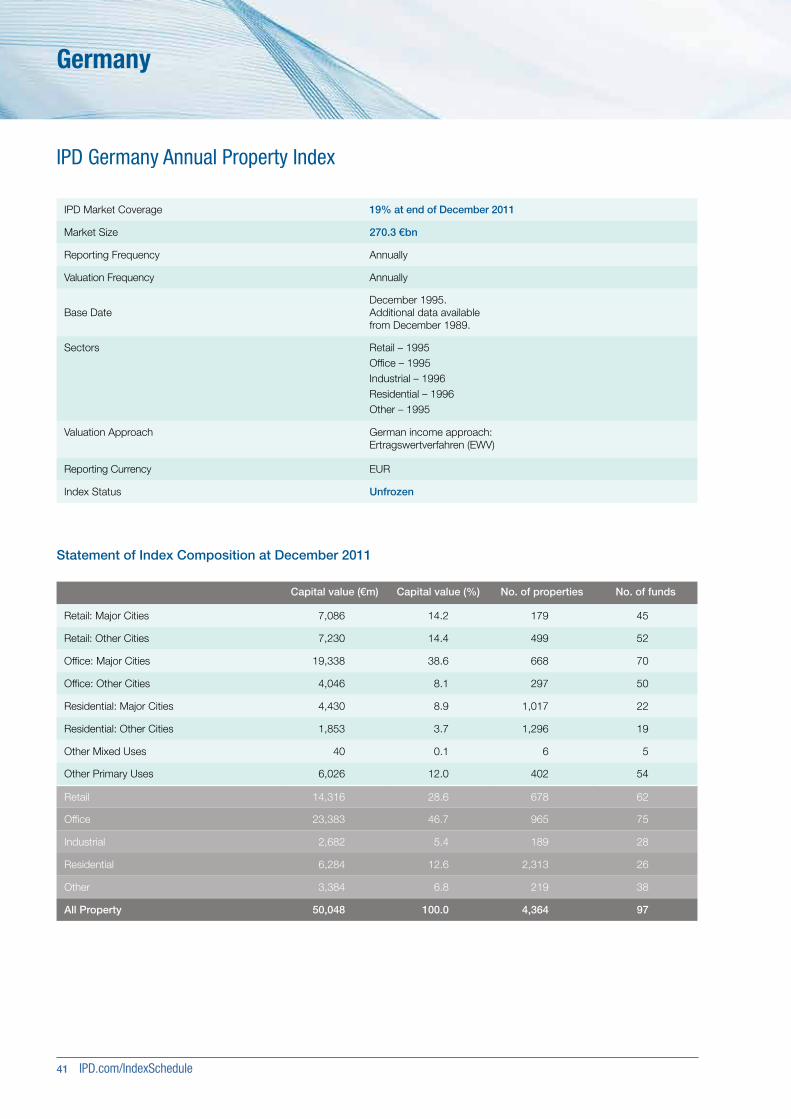
41 IPD.com/IndexSchedule
Germany
IPD Germany Annual Property Index
Capital value (€m) Capital value (%) No. of properties No. of funds
Retail: Major Cities 7,086 14.2 179 45
Retail: Other Cities 7,230 14.4 499 52
Office: Major Cities 19,338 38.6 668 70
Office: Other Cities 4,046 8.1 297 50
Residential: Major Cities 4,430 8.9 1,017 22
Residential: Other Cities 1,853 3.7 1,296 19
Other Mixed Uses 40 0.1 6 5
Other Primary Uses 6,026 12.0 402 54
Retail 14,316 28.6 678 62
Office 23,383 46.7 965 75
Industrial 2,682 5.4 189 28
Residential 6,284 12.6 2,313 26
Other 3,384 6.8 219 38
All Property 50,048 100.0 4,364 97
Statement of Index Composition at December 2011
IPD Market Coverage 19% at end of December 2011
Market Size 270.3 €bn
Reporting Frequency Annually
Valuation Frequency Annually
Base DateDecember 1995. Additional data available from December 1989.
Sectors Retail – 1995Office – 1995Industrial – 1996Residential – 1996Other – 1995
Valuation Approach German income approach:Ertragswertverfahren (EWV)
Reporting Currency EUR
Index Status Unfrozen
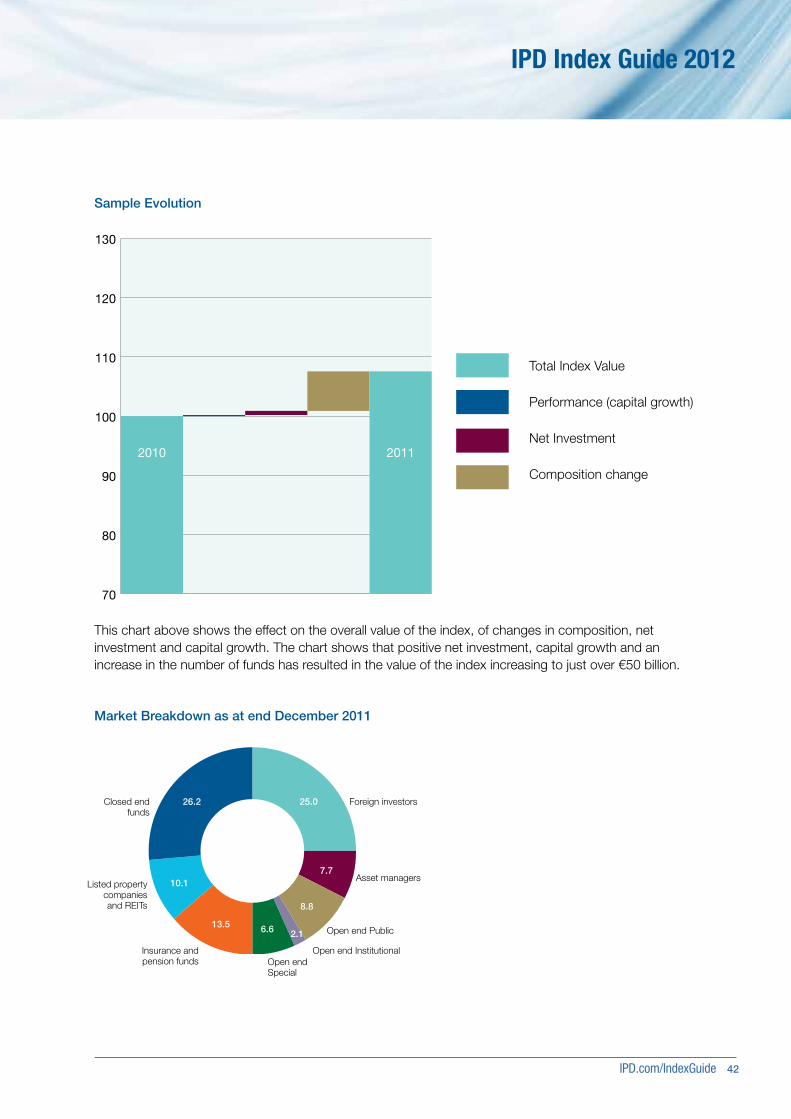
IPD.com/IndexGuide 42
IPD Index Guide 2012
Market Breakdown as at end December 2011
Foreign investors25.0
7.7
8.8
6.613.5
10.1
26.2
Insurance and pension funds
Listed property companies and REITs
Closed end funds
Asset managers
Open end Public
Open end Special
70
80
90
100
110
120
130
2010 2011
Sample Evolution
Open end Institutional
This chart above shows the effect on the overall value of the index, of changes in composition, net investment and capital growth. The chart shows that positive net investment, capital growth and an increase in the number of funds has resulted in the value of the index increasing to just over €50 billion.
Total Index Value
Performance (capital growth)
Net Investment
Composition change
2.1
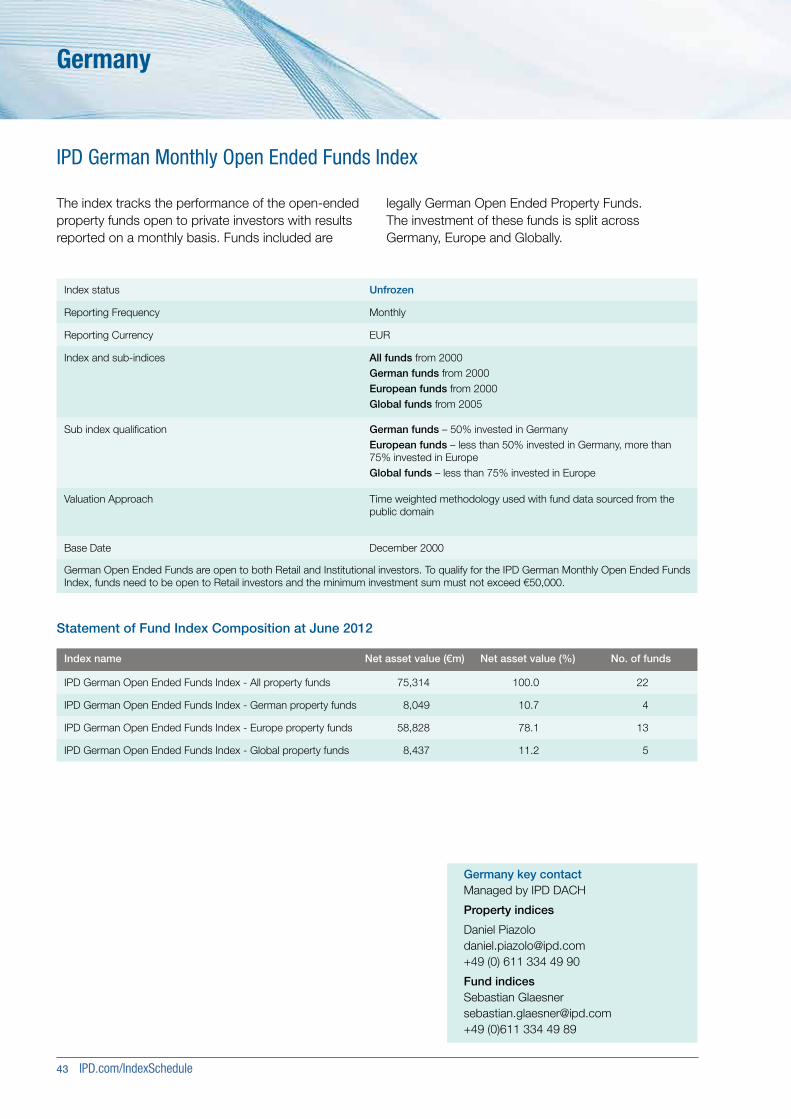
43 IPD.com/IndexSchedule
IPD German Monthly Open Ended Funds Index
Index status Unfrozen
Reporting Frequency Monthly
Reporting Currency EUR
Index and sub-indices All funds from 2000German funds from 2000European funds from 2000Global funds from 2005
Sub index qualification German funds – 50% invested in GermanyEuropean funds – less than 50% invested in Germany, more than 75% invested in EuropeGlobal funds – less than 75% invested in Europe
Valuation Approach Time weighted methodology used with fund data sourced from the public domain
Base Date December 2000
German Open Ended Funds are open to both Retail and Institutional investors. To qualify for the IPD German Monthly Open Ended Funds Index, funds need to be open to Retail investors and the minimum investment sum must not exceed €50,000.
Statement of Fund Index Composition at June 2012
Index name Net asset value (€m) Net asset value (%) No. of funds
IPD German Open Ended Funds Index - All property funds 75,314 100.0 22
IPD German Open Ended Funds Index - German property funds 8,049 10.7 4
IPD German Open Ended Funds Index - Europe property funds 58,828 78.1 13
IPD German Open Ended Funds Index - Global property funds 8,437 11.2 5
The index tracks the performance of the open-ended property funds open to private investors with results reported on a monthly basis. Funds included are
legally German Open Ended Property Funds. The investment of these funds is split across Germany, Europe and Globally.
Germany key contactManaged by IPD DACH
Property indices
Daniel [email protected] +49 (0) 611 334 49 90
Fund indices Sebastian Glaesner [email protected] +49 (0)611 334 49 89
Germany
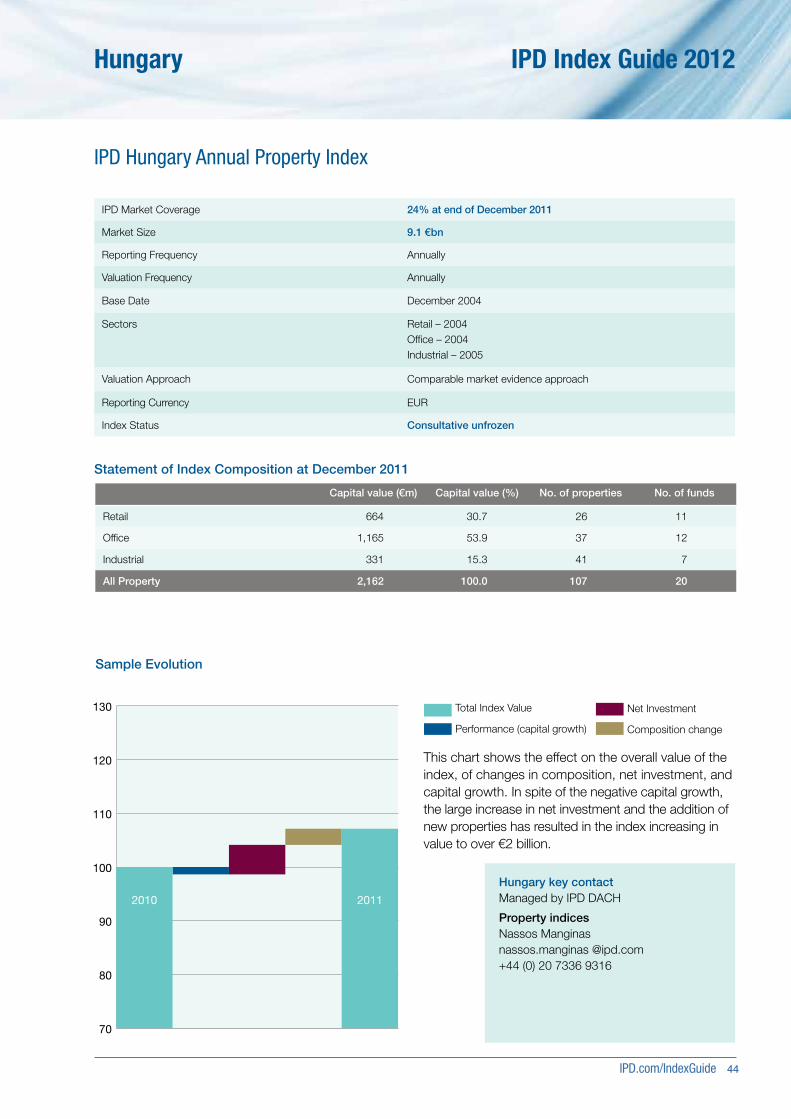
IPD.com/IndexGuide 44
IPD Index Guide 2012Hungary
IPD Hungary Annual Property Index
Statement of Index Composition at December 2011
70
80
90
100
110
120
130
2010 2011
Sample Evolution
IPD Market Coverage 24% at end of December 2011
Market Size 9.1 €bn
Reporting Frequency Annually
Valuation Frequency Annually
Base Date December 2004
Sectors Retail – 2004Office – 2004Industrial – 2005
Valuation Approach Comparable market evidence approach
Reporting Currency EUR
Index Status Consultative unfrozen
Capital value (€m) Capital value (%) No. of properties No. of funds
Retail 664 30.7 26 11
Office 1,165 53.9 37 12
Industrial 331 15.3 41 7
All Property 2,162 100.0 107 20
This chart shows the effect on the overall value of the index, of changes in composition, net investment, and capital growth. In spite of the negative capital growth, the large increase in net investment and the addition of new properties has resulted in the index increasing in value to over €2 billion.
Hungary key contactManaged by IPD DACH
Property indicesNassos Manginas nassos.manginas @ipd.com+44 (0) 20 7336 9316
Germany key contactManaged by IPD DACH
Property indices
Daniel [email protected] +49 (0) 611 334 49 90
Fund indices Sebastian Glaesner [email protected] +49 (0)611 334 49 89
Total Index Value
Performance (capital growth)
Net Investment
Composition change
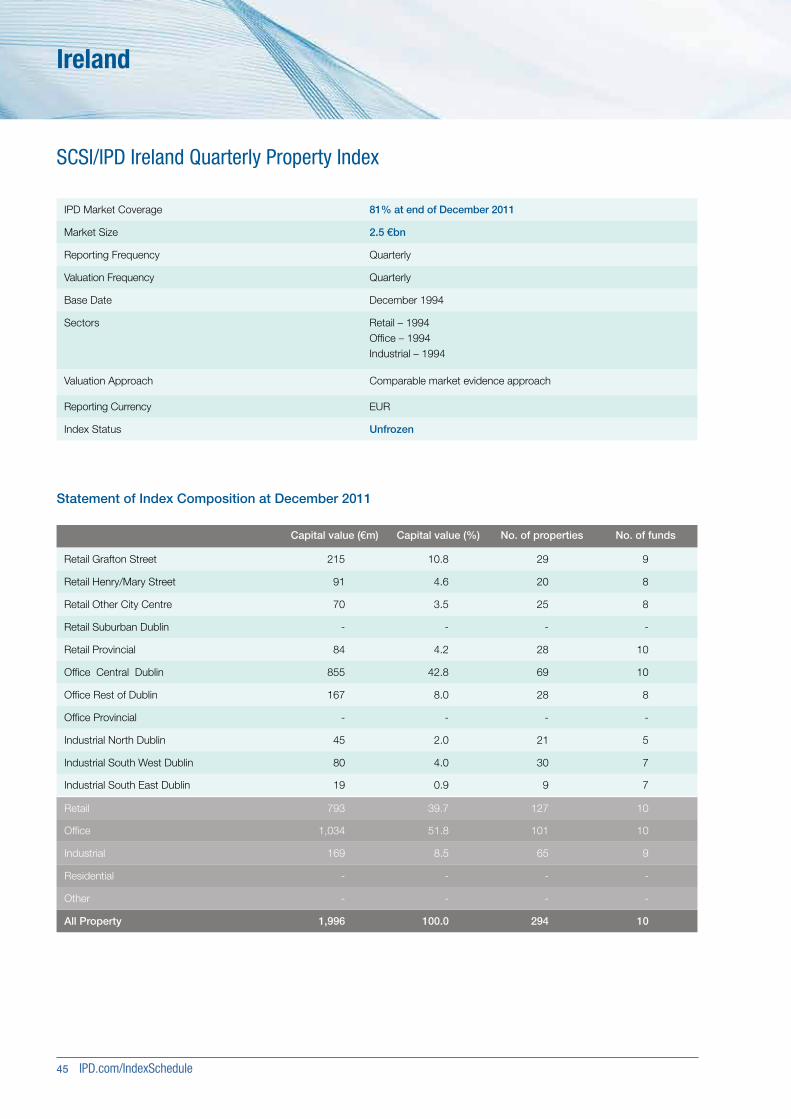
45 IPD.com/IndexSchedule
Ireland
SCSI/IPD Ireland Quarterly Property Index
Capital value (€m) Capital value (%) No. of properties No. of funds
Retail Grafton Street 215 10.8 29 9
Retail Henry/Mary Street 91 4.6 20 8
Retail Other City Centre 70 3.5 25 8
Retail Suburban Dublin - - - -
Retail Provincial 84 4.2 28 10
Office Central Dublin 855 42.8 69 10
Office Rest of Dublin 167 8.0 28 8
Office Provincial - - - -
Industrial North Dublin 45 2.0 21 5
Industrial South West Dublin 80 4.0 30 7
Industrial South East Dublin 19 0.9 9 7
Retail 793 39.7 127 10
Office 1,034 51.8 101 10
Industrial 169 8.5 65 9
Residential - - - -
Other - - - -
All Property 1,996 100.0 294 10
Statement of Index Composition at December 2011
IPD Market Coverage 81% at end of December 2011
Market Size 2.5 €bn
Reporting Frequency Quarterly
Valuation Frequency Quarterly
Base Date December 1994
Sectors Retail – 1994Office – 1994Industrial – 1994
Valuation Approach Comparable market evidence approach
Reporting Currency EUR
Index Status Unfrozen
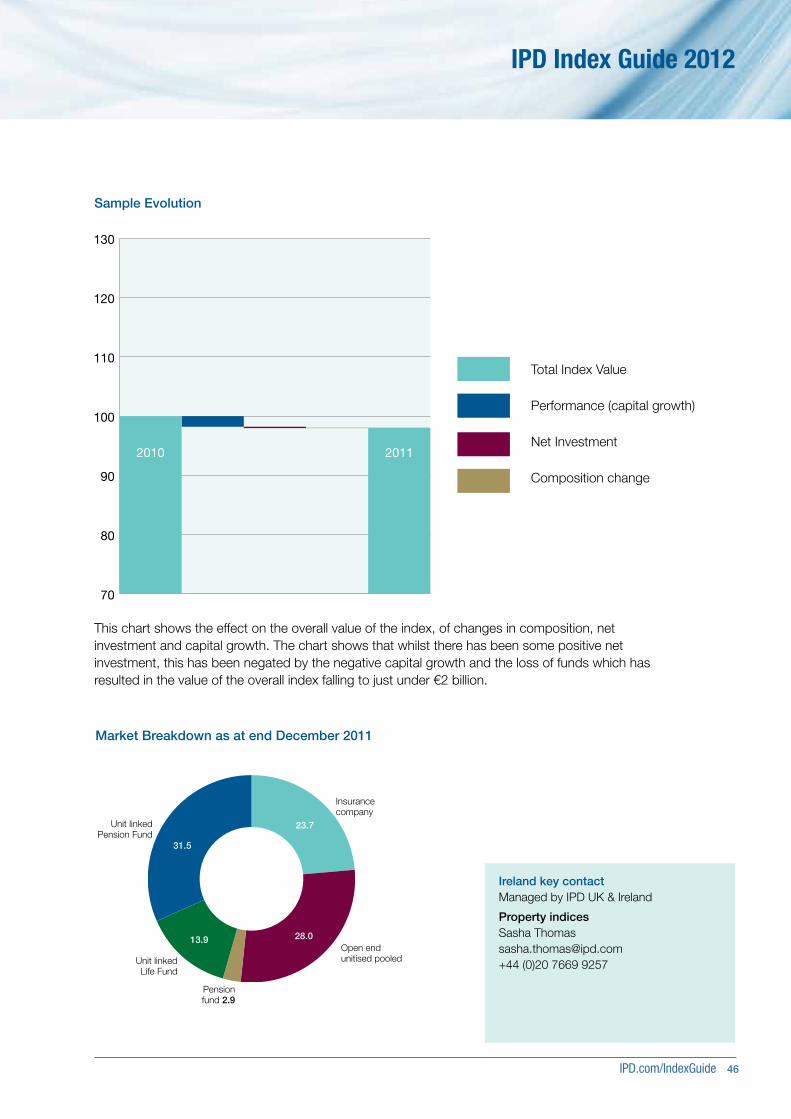
IPD.com/IndexGuide 46
IPD Index Guide 2012
Market Breakdown as at end December 2011
Insurance company
23.7
28.013.9
31.5
Unit linked Life Fund
Pensionfund 2.9
Unit linked Pension Fund
Open end unitised pooled
70
80
90
100
110
120
130
2010 2011
Sample Evolution
This chart shows the effect on the overall value of the index, of changes in composition, net investment and capital growth. The chart shows that whilst there has been some positive net investment, this has been negated by the negative capital growth and the loss of funds which has resulted in the value of the overall index falling to just under €2 billion.
Total Index Value
Performance (capital growth)
Net Investment
Composition change
Ireland key contactManaged by IPD UK & Ireland
Property indicesSasha Thomas [email protected] +44 (0)20 7669 9257
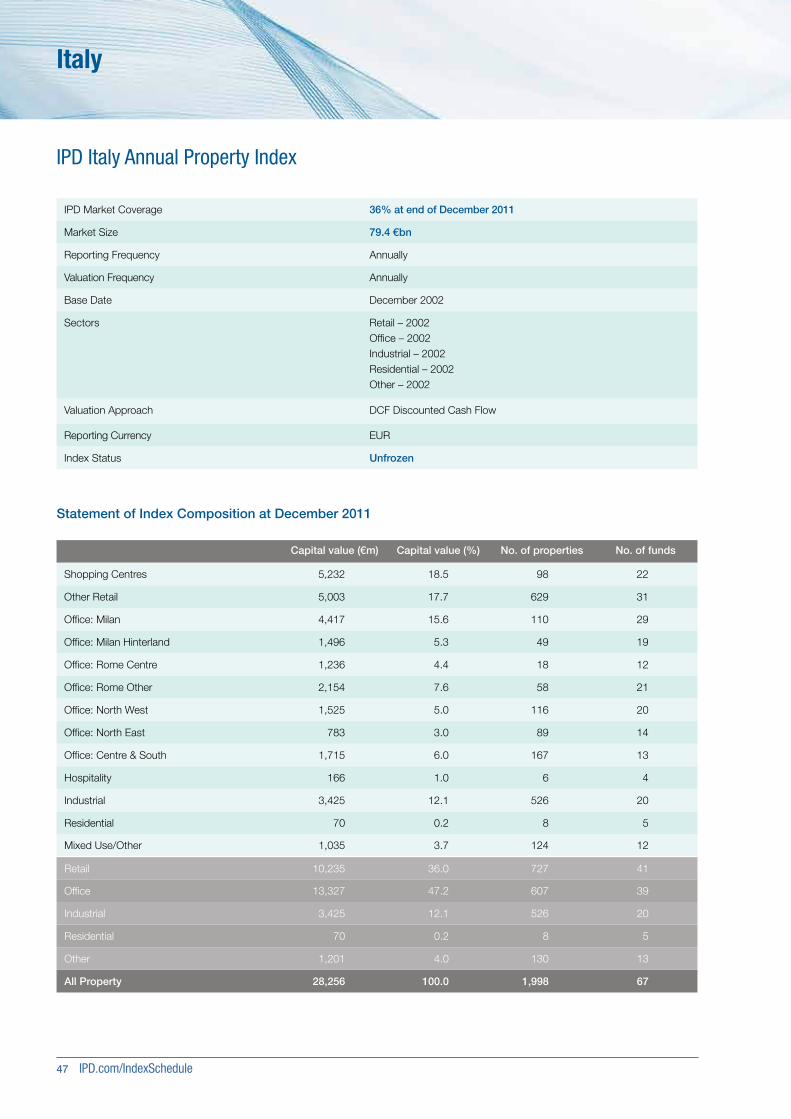
47 IPD.com/IndexSchedule
Italy
IPD Italy Annual Property Index
Statement of Index Composition at December 2011
Capital value (€m) Capital value (%) No. of properties No. of funds
Shopping Centres 5,232 18.5 98 22
Other Retail 5,003 17.7 629 31
Office: Milan 4,417 15.6 110 29
Office: Milan Hinterland 1,496 5.3 49 19
Office: Rome Centre 1,236 4.4 18 12
Office: Rome Other 2,154 7.6 58 21
Office: North West 1,525 5.0 116 20
Office: North East 783 3.0 89 14
Office: Centre & South 1,715 6.0 167 13
Hospitality 166 1.0 6 4
Industrial 3,425 12.1 526 20
Residential 70 0.2 8 5
Mixed Use/Other 1,035 3.7 124 12
Retail 10,235 36.0 727 41
Office 13,327 47.2 607 39
Industrial 3,425 12.1 526 20
Residential 70 0.2 8 5
Other 1,201 4.0 130 13
All Property 28,256 100.0 1,998 67
IPD Market Coverage 36% at end of December 2011
Market Size 79.4 €bn
Reporting Frequency Annually
Valuation Frequency Annually
Base Date December 2002
Sectors Retail – 2002Office – 2002Industrial – 2002Residential – 2002Other – 2002
Valuation Approach DCF Discounted Cash Flow
Reporting Currency EUR
Index Status Unfrozen
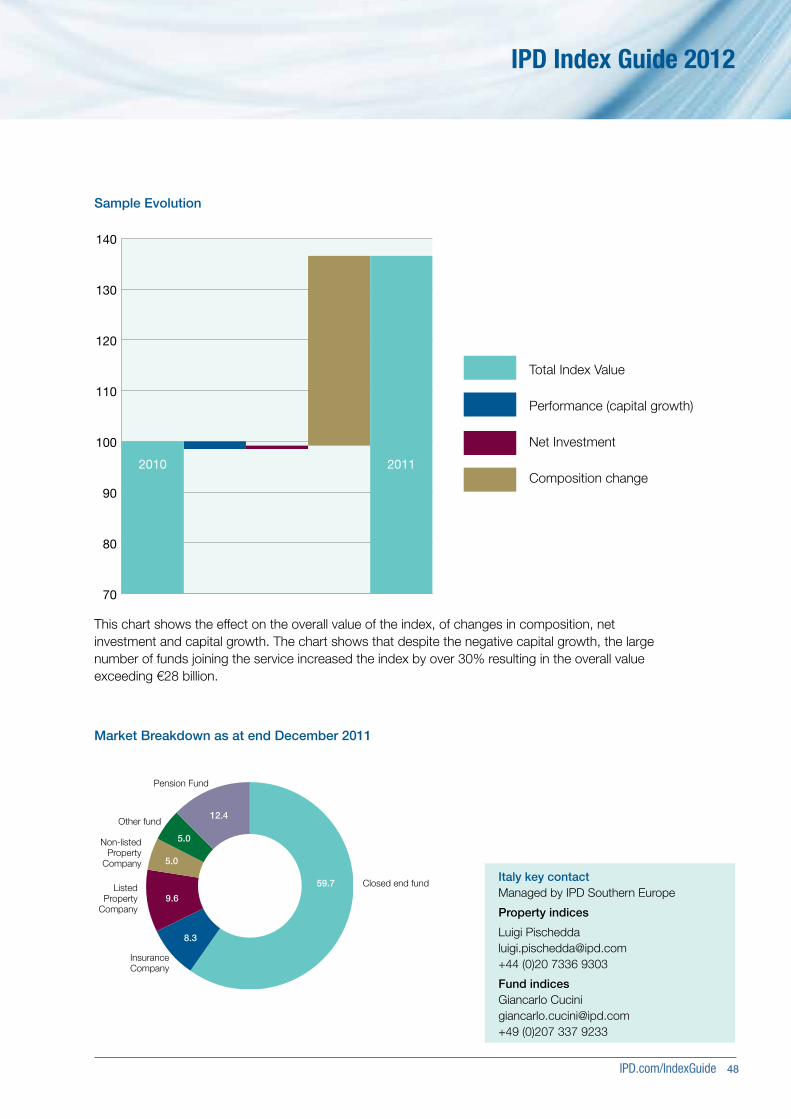
IPD.com/IndexGuide 48
IPD Index Guide 2012
Market Breakdown as at end December 2011
Pension Fund
Insurance Company
Listed Property
Company
Non-listedProperty
Company
Other fund
Closed end fund
8.3
9.6
59.7
5.0
5.0
12.4
70
80
90
100
110
120
130
140
2010 2011
Sample Evolution
This chart shows the effect on the overall value of the index, of changes in composition, net investment and capital growth. The chart shows that despite the negative capital growth, the large number of funds joining the service increased the index by over 30% resulting in the overall value exceeding €28 billion.
Total Index Value
Performance (capital growth)
Net Investment
Composition change
Italy key contactManaged by IPD Southern Europe
Property indices
Luigi [email protected]+44 (0)20 7336 9303
Fund indices Giancarlo [email protected]+49 (0)207 337 9233
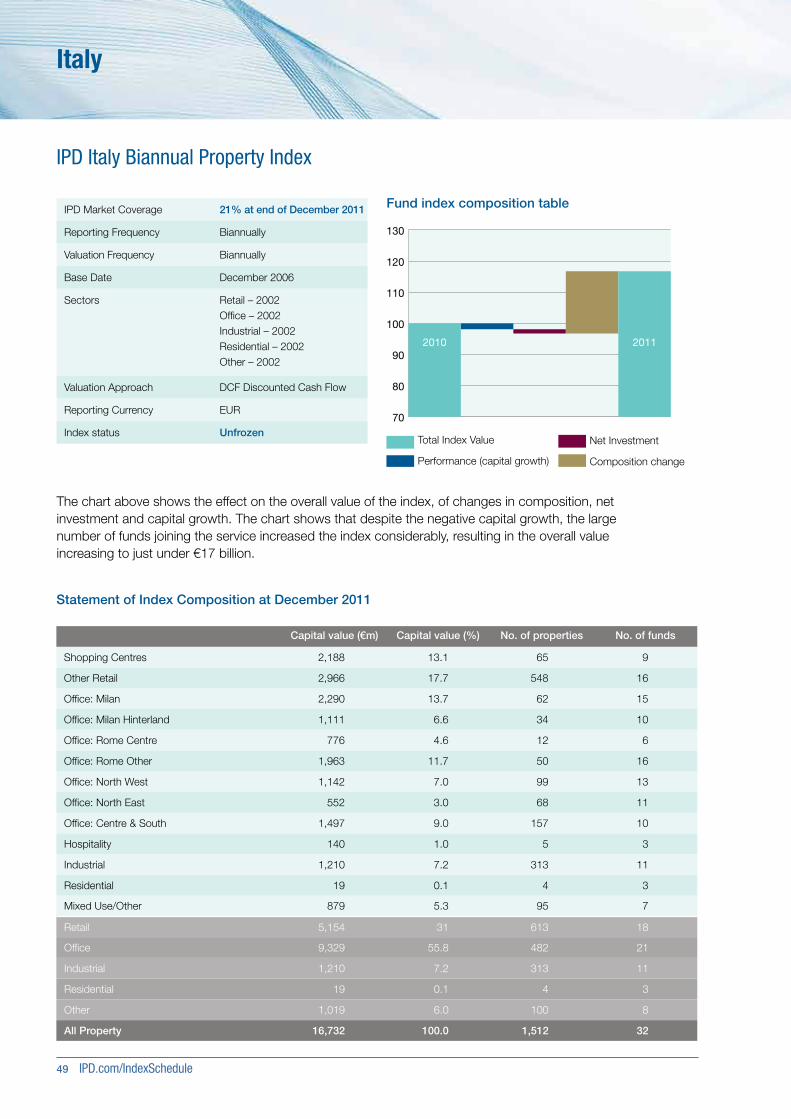
49 IPD.com/IndexSchedule
Statement of Index Composition at December 2011
70
80
90
100
110
120
130
2010 2011
Fund index composition table
The chart above shows the effect on the overall value of the index, of changes in composition, net investment and capital growth. The chart shows that despite the negative capital growth, the large number of funds joining the service increased the index considerably, resulting in the overall value increasing to just under €17 billion.
IPD Italy Biannual Property Index
IPD Market Coverage 21% at end of December 2011
Reporting Frequency Biannually
Valuation Frequency Biannually
Base Date December 2006
Sectors Retail – 2002Office – 2002Industrial – 2002Residential – 2002Other – 2002
Valuation Approach DCF Discounted Cash Flow
Reporting Currency EUR
Index status Unfrozen
Capital value (€m) Capital value (%) No. of properties No. of funds
Shopping Centres 2,188 13.1 65 9
Other Retail 2,966 17.7 548 16
Office: Milan 2,290 13.7 62 15
Office: Milan Hinterland 1,111 6.6 34 10
Office: Rome Centre 776 4.6 12 6
Office: Rome Other 1,963 11.7 50 16
Office: North West 1,142 7.0 99 13
Office: North East 552 3.0 68 11
Office: Centre & South 1,497 9.0 157 10
Hospitality 140 1.0 5 3
Industrial 1,210 7.2 313 11
Residential 19 0.1 4 3
Mixed Use/Other 879 5.3 95 7
Retail 5,154 31 613 18
Office 9,329 55.8 482 21
Industrial 1,210 7.2 313 11
Residential 19 0.1 4 3
Other 1,019 6.0 100 8
All Property 16,732 100.0 1,512 32
Total Index Value
Performance (capital growth)
Net Investment
Composition change
Italy

IPD.com/IndexGuide 50
IPD Index Guide 2012
IPD Italy Biannual Property Fund Index
Index status Unfrozen
Reporting Currency EUR
Index and sub-indices All funds from June 2000Blind funds from June 2000Seeded funds from December 2004Retail funds from June 2000Institutional funds from December 2007Balanced funds from June 2000Specialist funds from December 2004
Index qualification, unlisted funds eligible where the fund: • Is managed by an Italian manager (SGR)• Reports biannually to investors• Re-values the direct portfolio at least biannually• Has been/will be/is open to new investment from third parties
Sub index qualification: • Blind funds – created by capital from both retail & institutional investors with no assets held at inception
• Seeded funds –created by institutions already holding assets and open to both retail & institutional investors
• Retail funds – for investment by retail investors only• Institutional funds – for investment by professional investors only• Balanced funds – funds with diversified portfolios• Specialist funds – funds with 70% or more invested into one
sector of the market.
Valuation Approach Time weighted methodology used with fund data sourced from the public domain
Base Date June 2000
Statement of Fund Index Composition at June 2012
Index nameNet asset value (€m)
Net asset value (%)
No. of funds
IPD Italy Biannual Property Fund Index - All property funds 7,940 100 39
IPD Italy Biannual Property Fund Index - Blind property funds 3,247 41 16
IPD Italy Biannual Property Fund Index - Seeded property funds 4,693 59 23
IPD Italy Biannual Property Fund Index - Retail property funds 4,878 61 22
IPD Italy Biannual Property Fund Index - Institutional property funds 3,062 39 17
IPD Italy Biannual Property Fund Index - Balanced property funds 2,852 36 16
IPD Italy Biannual Property Fund Index - Specialist property funds 5,088 64 23
The Index is primarily made up of closed ended funds with the majority of these listed and traded on the Milan Stock Exchange. All of the funds are managed by an Italian Fund Management Company (SGR) and are measured, or were measured, by the IPD Portfolio Analysis Service. The NAV fund performance of the funds is reported at the end of June and December each year.
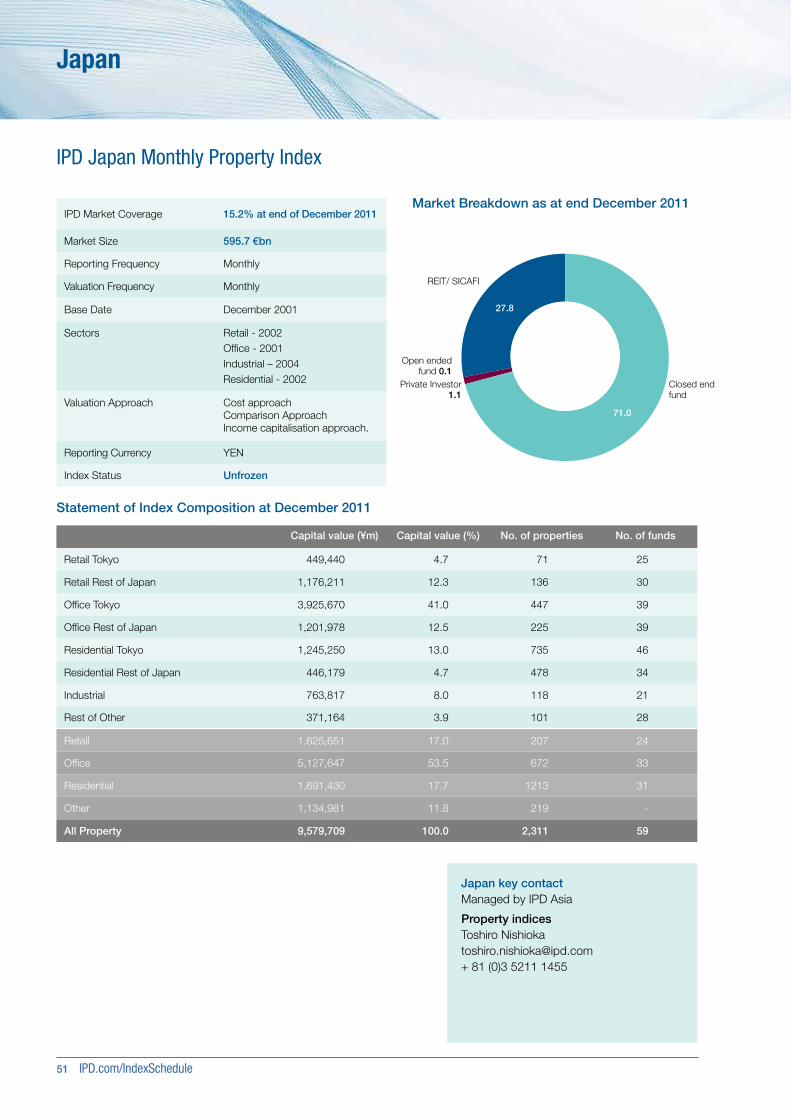
51 IPD.com/IndexSchedule
Japan
IPD Japan Monthly Property Index
Market Breakdown as at end December 2011
71.0
27.8
Private Investor1.1
REIT/ SICAFI
Open ended fund 0.1
Closed end fund
IPD Market Coverage 15.2% at end of December 2011
Market Size 595.7 €bn
Reporting Frequency Monthly
Valuation Frequency Monthly
Base Date December 2001
Sectors Retail - 2002Office - 2001Industrial – 2004Residential - 2002
Valuation Approach Cost approachComparison ApproachIncome capitalisation approach.
Reporting Currency YEN
Index Status Unfrozen
Capital value (¥m) Capital value (%) No. of properties No. of funds
Retail Tokyo 449,440 4.7 71 25
Retail Rest of Japan 1,176,211 12.3 136 30
Office Tokyo 3,925,670 41.0 447 39
Office Rest of Japan 1,201,978 12.5 225 39
Residential Tokyo 1,245,250 13.0 735 46
Residential Rest of Japan 446,179 4.7 478 34
Industrial 763,817 8.0 118 21
Rest of Other 371,164 3.9 101 28
Retail 1,625,651 17.0 207 24
Office 5,127,647 53.5 672 33
Residential 1,691,430 17.7 1213 31
Other 1,134,981 11.8 219 -
All Property 9,579,709 100.0 2,311 59
Statement of Index Composition at December 2011
Japan key contactManaged by IPD Asia
Property indicesToshiro [email protected]+ 81 (0)3 5211 1455
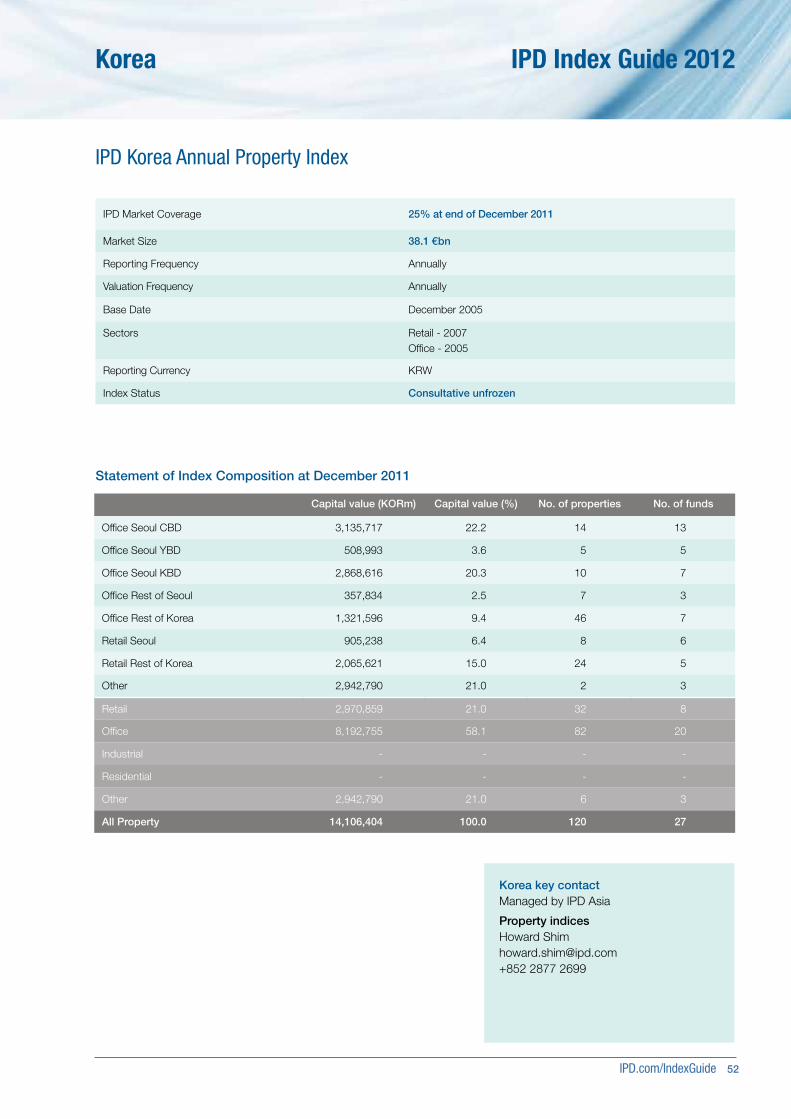
IPD.com/IndexGuide 52
IPD Index Guide 2012Korea
IPD Korea Annual Property Index
IPD Market Coverage 25% at end of December 2011
Market Size 38.1 €bn
Reporting Frequency Annually
Valuation Frequency Annually
Base Date December 2005
Sectors Retail - 2007Office - 2005
Reporting Currency KRW
Index Status Consultative unfrozen
Capital value (KORm) Capital value (%) No. of properties No. of funds
Office Seoul CBD 3,135,717 22.2 14 13
Office Seoul YBD 508,993 3.6 5 5
Office Seoul KBD 2,868,616 20.3 10 7
Office Rest of Seoul 357,834 2.5 7 3
Office Rest of Korea 1,321,596 9.4 46 7
Retail Seoul 905,238 6.4 8 6
Retail Rest of Korea 2,065,621 15.0 24 5
Other 2,942,790 21.0 2 3
Retail 2,970,859 21.0 32 8
Office 8,192,755 58.1 82 20
Industrial - - - -
Residential - - - -
Other 2,942,790 21.0 6 3
All Property 14,106,404 100.0 120 27
Statement of Index Composition at December 2011
Korea key contactManaged by IPD Asia
Property indicesHoward [email protected]+852 2877 2699
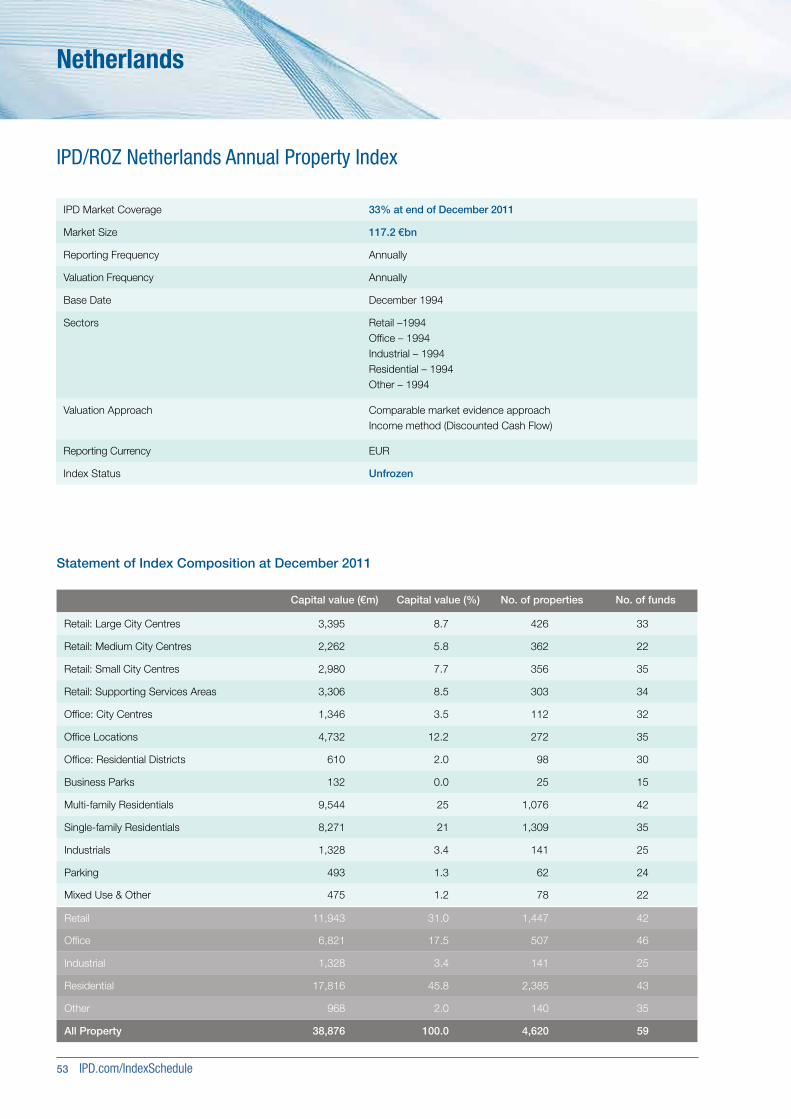
53 IPD.com/IndexSchedule
Netherlands
IPD/ROZ Netherlands Annual Property Index
Statement of Index Composition at December 2011
Capital value (€m) Capital value (%) No. of properties No. of funds
Retail: Large City Centres 3,395 8.7 426 33
Retail: Medium City Centres 2,262 5.8 362 22
Retail: Small City Centres 2,980 7.7 356 35
Retail: Supporting Services Areas 3,306 8.5 303 34
Office: City Centres 1,346 3.5 112 32
Office Locations 4,732 12.2 272 35
Office: Residential Districts 610 2.0 98 30
Business Parks 132 0.0 25 15
Multi-family Residentials 9,544 25 1,076 42
Single-family Residentials 8,271 21 1,309 35
Industrials 1,328 3.4 141 25
Parking 493 1.3 62 24
Mixed Use & Other 475 1.2 78 22
Retail 11,943 31.0 1,447 42
Office 6,821 17.5 507 46
Industrial 1,328 3.4 141 25
Residential 17,816 45.8 2,385 43
Other 968 2.0 140 35
All Property 38,876 100.0 4,620 59
IPD Market Coverage 33% at end of December 2011
Market Size 117.2 €bn
Reporting Frequency Annually
Valuation Frequency Annually
Base Date December 1994
Sectors Retail –1994Office – 1994Industrial – 1994Residential – 1994Other – 1994
Valuation Approach Comparable market evidence approachIncome method (Discounted Cash Flow)
Reporting Currency EUR
Index Status Unfrozen
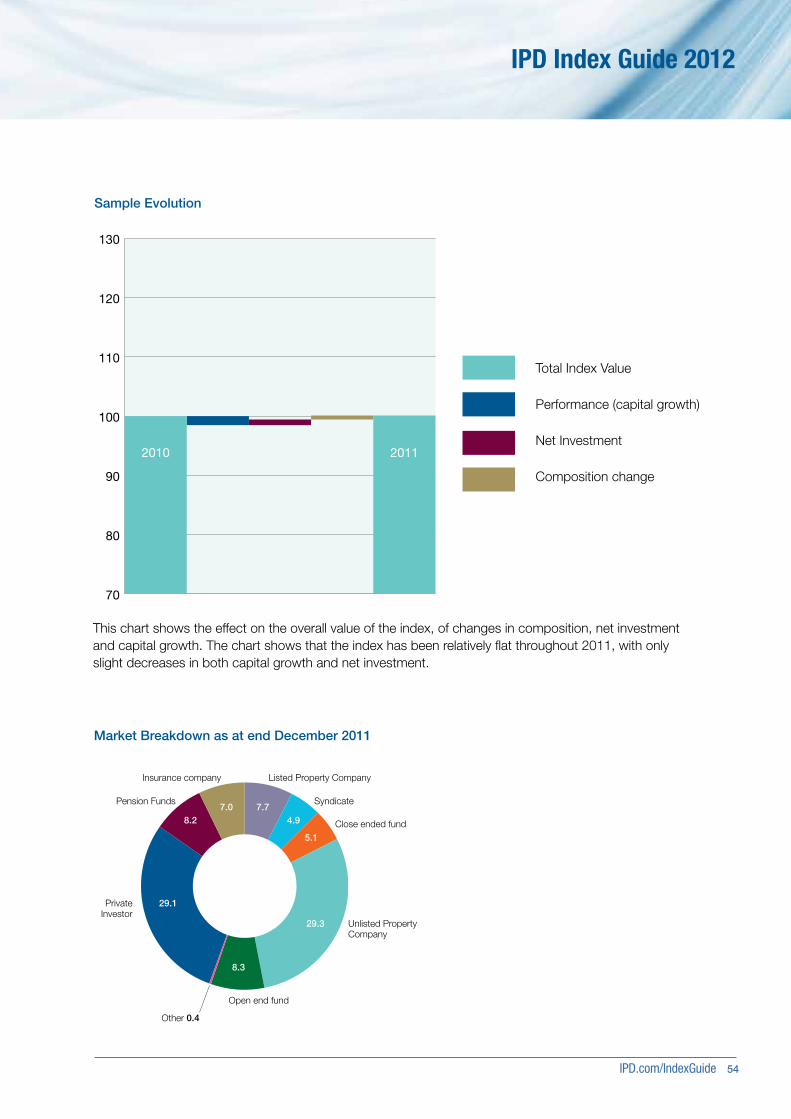
IPD.com/IndexGuide 54
IPD Index Guide 2012
Market Breakdown as at end December 2011
Insurance company
Pension Funds
Private Investor
Listed Property Company
Syndicate
Close ended fund
Open end fund
Other 0.4
Unlisted Property Company
8.3
29.1
29.3
8.27.0 7.7
4.9
5.1
This chart shows the effect on the overall value of the index, of changes in composition, net investment and capital growth. The chart shows that the index has been relatively flat throughout 2011, with only slight decreases in both capital growth and net investment.
70
80
90
100
110
120
130
2010 2011
Sample Evolution
Total Index Value
Performance (capital growth)
Net Investment
Composition change
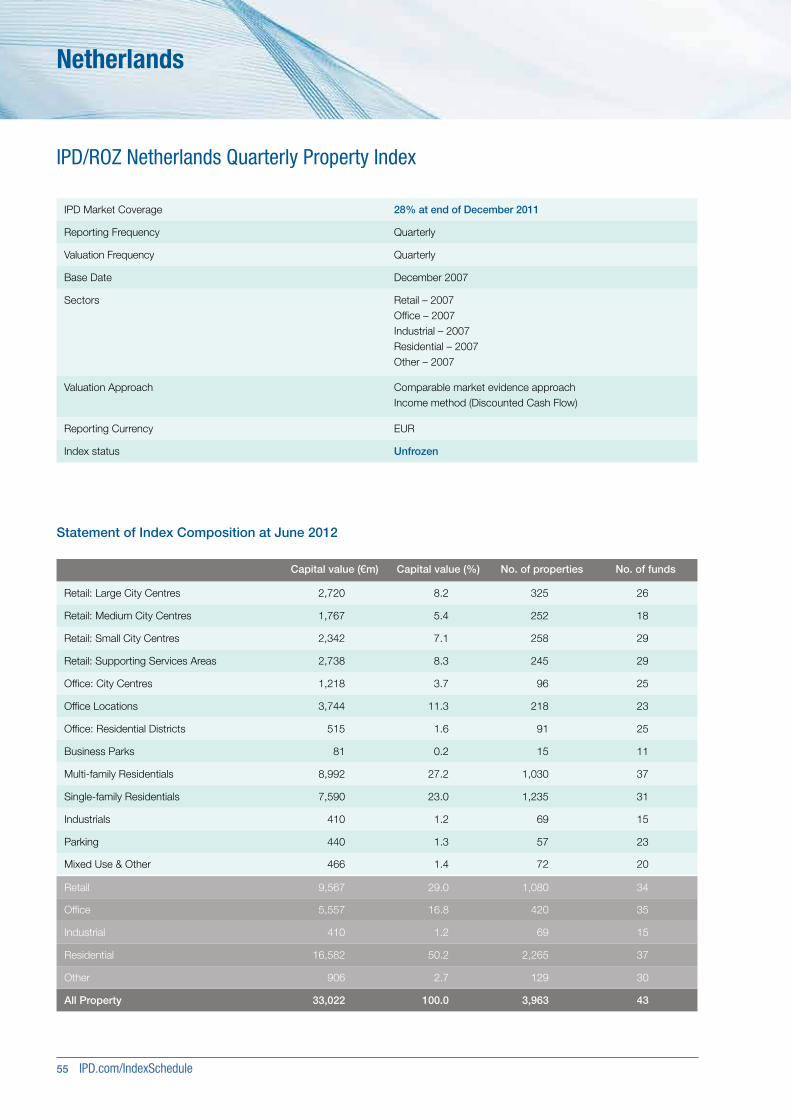
55 IPD.com/IndexSchedule
Statement of Index Composition at June 2012
IPD/ROZ Netherlands Quarterly Property Index
Capital value (€m) Capital value (%) No. of properties No. of funds
Retail: Large City Centres 2,720 8.2 325 26
Retail: Medium City Centres 1,767 5.4 252 18
Retail: Small City Centres 2,342 7.1 258 29
Retail: Supporting Services Areas 2,738 8.3 245 29
Office: City Centres 1,218 3.7 96 25
Office Locations 3,744 11.3 218 23
Office: Residential Districts 515 1.6 91 25
Business Parks 81 0.2 15 11
Multi-family Residentials 8,992 27.2 1,030 37
Single-family Residentials 7,590 23.0 1,235 31
Industrials 410 1.2 69 15
Parking 440 1.3 57 23
Mixed Use & Other 466 1.4 72 20
Retail 9,567 29.0 1,080 34
Office 5,557 16.8 420 35
Industrial 410 1.2 69 15
Residential 16,582 50.2 2,265 37
Other 906 2.7 129 30
All Property 33,022 100.0 3,963 43
Netherlands
IPD Market Coverage 28% at end of December 2011
Reporting Frequency Quarterly
Valuation Frequency Quarterly
Base Date December 2007
Sectors Retail – 2007Office – 2007Industrial – 2007Residential – 2007Other – 2007
Valuation Approach Comparable market evidence approachIncome method (Discounted Cash Flow)
Reporting Currency EUR
Index status Unfrozen
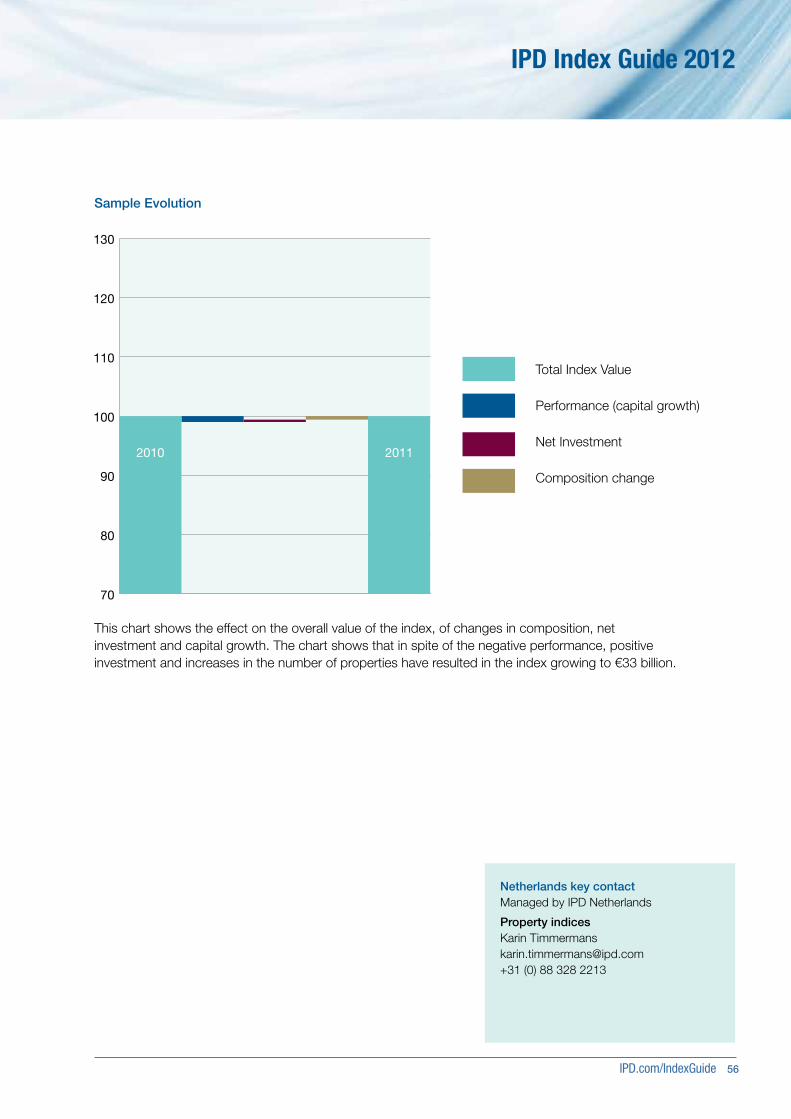
IPD.com/IndexGuide 56
IPD Index Guide 2012
Sample Evolution
This chart shows the effect on the overall value of the index, of changes in composition, net investment and capital growth. The chart shows that in spite of the negative performance, positive investment and increases in the number of properties have resulted in the index growing to €33 billion.
70
80
90
100
110
120
130
2010 2011
Total Index Value
Performance (capital growth)
Net Investment
Composition change
Netherlands key contactManaged by IPD Netherlands
Property indicesKarin [email protected] +31 (0) 88 328 2213
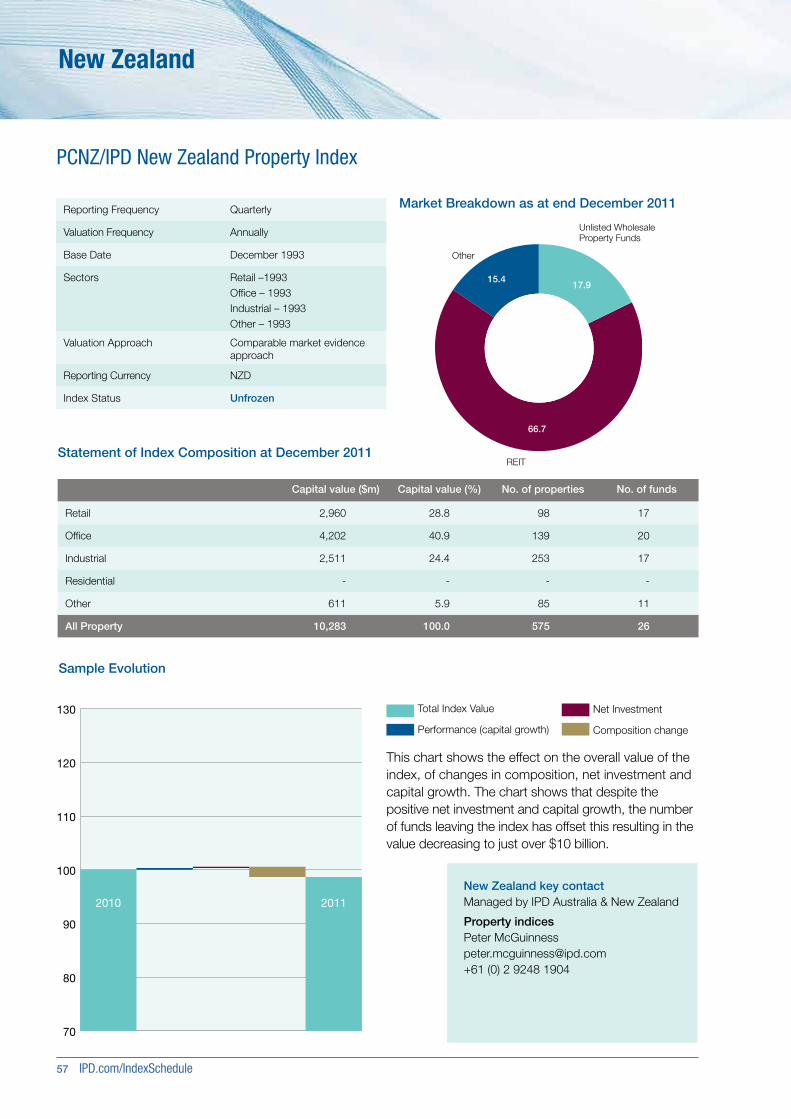
57 IPD.com/IndexSchedule
New Zealand
PCNZ/IPD New Zealand Property Index
Statement of Index Composition at December 2011
Market Breakdown as at end December 2011
Other
Unlisted Wholesale Property Funds
REIT
66.7
15.417.9
This chart shows the effect on the overall value of the index, of changes in composition, net investment and capital growth. The chart shows that despite the positive net investment and capital growth, the number of funds leaving the index has offset this resulting in the value decreasing to just over $10 billion.
Capital value ($m) Capital value (%) No. of properties No. of funds
Retail 2,960 28.8 98 17
Office 4,202 40.9 139 20
Industrial 2,511 24.4 253 17
Residential - - - -
Other 611 5.9 85 11
All Property 10,283 100.0 575 26
70
80
90
100
110
120
130
2010 2011
Reporting Frequency Quarterly
Valuation Frequency Annually
Base Date December 1993
Sectors Retail –1993Office – 1993Industrial – 1993Other – 1993
Valuation Approach Comparable market evidence approach
Reporting Currency NZD
Index Status Unfrozen
Sample Evolution
New Zealand key contactManaged by IPD Australia & New Zealand
Property indicesPeter McGuinness [email protected] +61 (0) 2 9248 1904
Total Index Value
Performance (capital growth)
Net Investment
Composition change
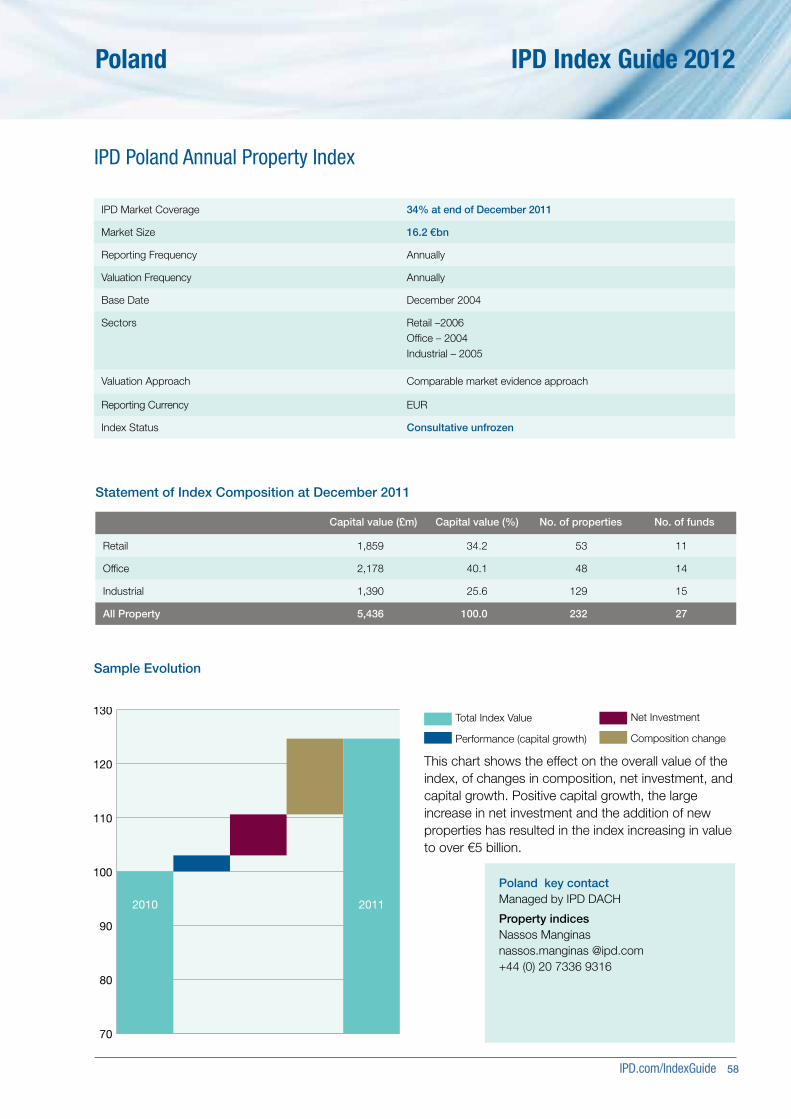
IPD.com/IndexGuide 58
IPD Index Guide 2012Poland
IPD Poland Annual Property Index
Statement of Index Composition at December 2011
70
80
90
100
110
120
130
2010 2011
Sample Evolution
This chart shows the effect on the overall value of the index, of changes in composition, net investment, and capital growth. Positive capital growth, the large increase in net investment and the addition of new properties has resulted in the index increasing in value to over €5 billion.
IPD Market Coverage 34% at end of December 2011
Market Size 16.2 €bn
Reporting Frequency Annually
Valuation Frequency Annually
Base Date December 2004
Sectors Retail –2006Office – 2004Industrial – 2005
Valuation Approach Comparable market evidence approach
Reporting Currency EUR
Index Status Consultative unfrozen
Capital value (£m) Capital value (%) No. of properties No. of funds
Retail 1,859 34.2 53 11
Office 2,178 40.1 48 14
Industrial 1,390 25.6 129 15
All Property 5,436 100.0 232 27
Poland key contactManaged by IPD DACH
Property indicesNassos Manginas nassos.manginas @ipd.com+44 (0) 20 7336 9316
Total Index Value
Performance (capital growth)
Net Investment
Composition change

59 IPD.com/IndexSchedule
Portugal
IPD Portugal Annual Property Index
Statement of Index Composition at December 2011
Capital value (€m) Capital value (%) No. of properties No. of funds
Large shopping centres 2,325 23.6 18 6
Medium shopping centres 1,115 11.3 19 6
Small shopping centres 808 8.2 65 17
Other retail 669 6.8 246 18
Office Lisbon CBD 905 9.2 99 17
Office Lisbon New Office Areas 781 7.9 34 17
Office Lisbon Secondary 210 2.0 37 13
Office Lisbon Out of the Town 565 6.0 69 15
Office Porto 97 1.0 30 8
Office Rest of Portugal 102 1.0 49 10
Industrial Lisbon 784 7.9 97 13
Industrial Rest of Portugal 268 2.7 74 10
Residential 107 1.1 18 7
Other 1,130 11.5 143.0 19.0
Retail 4,918 50 348 26
Office 2,659 26.9 318 28
Industrial 1,053 10.7 171 13
Residential 107 1.1 18 7
Other 1,130 11.0 143 19
All Property 9,866 100.0 998 41
IPD Market Coverage 65% at end of December 2011
Market Size 15.1 €bn
Reporting Frequency Annually
Valuation Frequency Annually
Base Date December 1999
Sectors Retail –1999Office – 1999Industrial – 1999Residential – 1999Other – 1999
Valuation Approach The comparative approachThe income approachThe cost approach
Reporting Currency EUR
Index Status Unfrozen
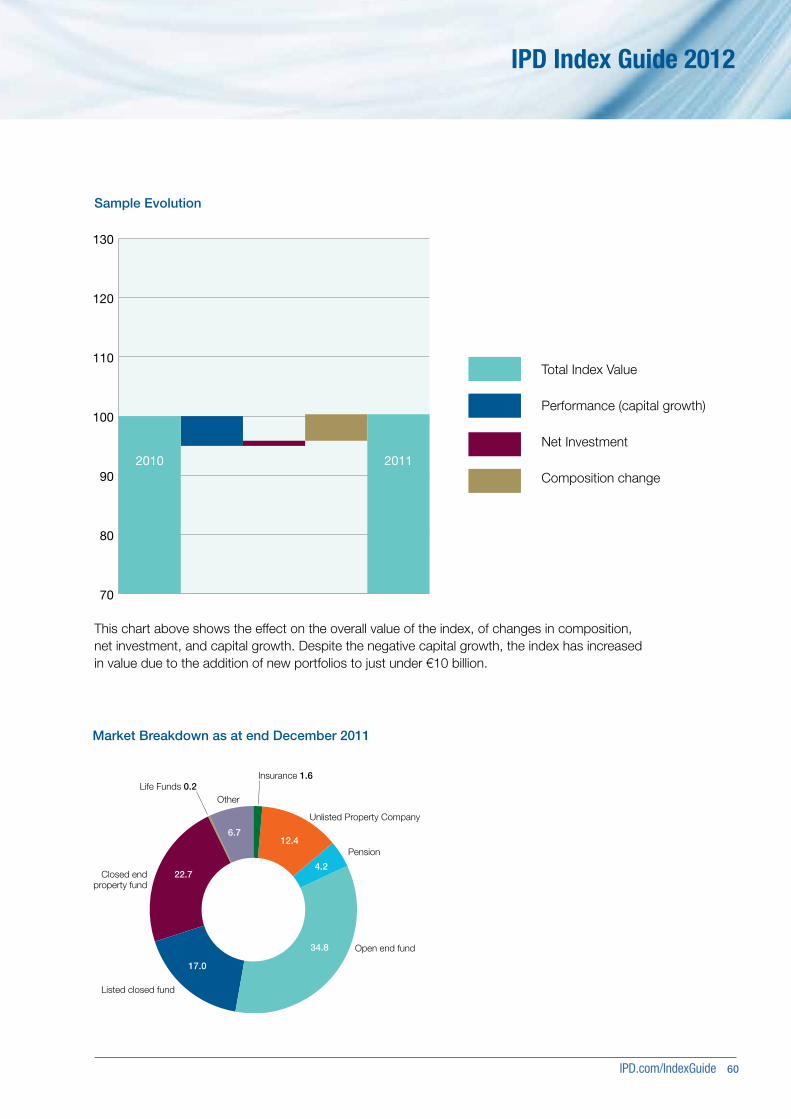
IPD.com/IndexGuide 60
IPD Index Guide 2012
Unlisted Property Company
Pension
OtherLife Funds 0.2
Insurance 1.6
12.4
4.2
34.8
17.0
22.7
6.7
Listed closed fund
Closed end property fund
Open end fund
70
80
90
100
110
120
130
2010 2011
Sample Evolution
This chart above shows the effect on the overall value of the index, of changes in composition, net investment, and capital growth. Despite the negative capital growth, the index has increased in value due to the addition of new portfolios to just under €10 billion.
Market Breakdown as at end December 2011
Total Index Value
Performance (capital growth)
Net Investment
Composition change
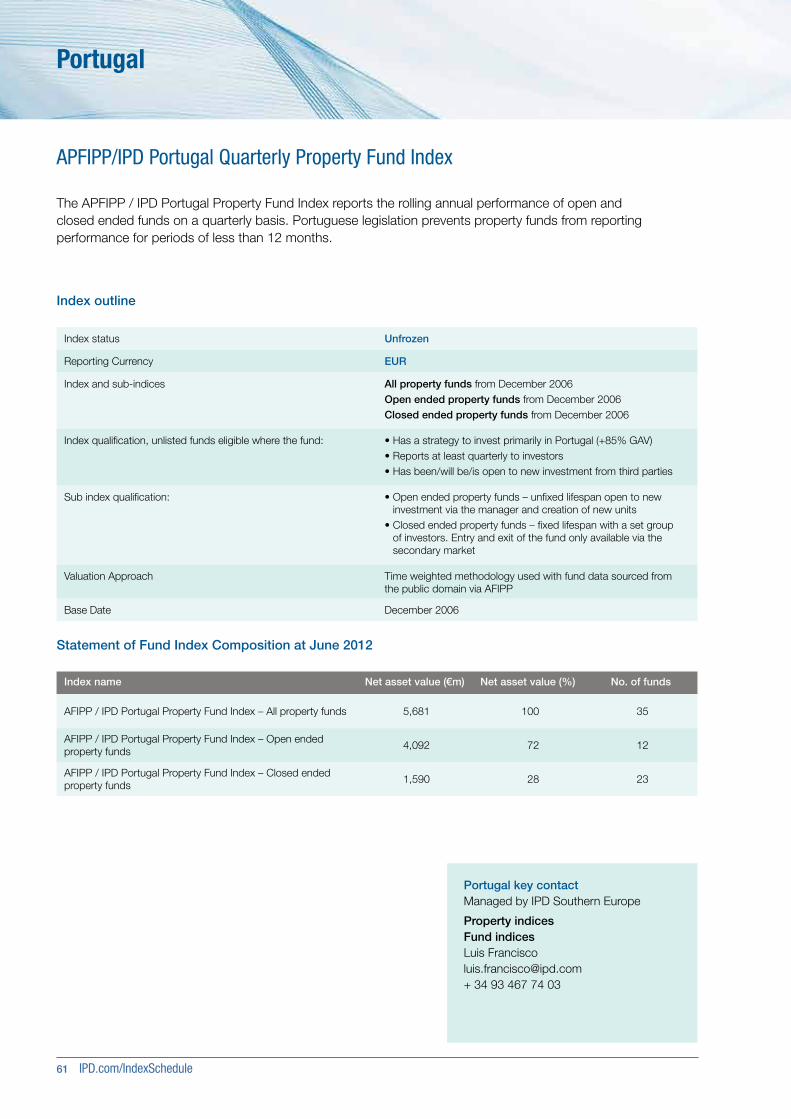
61 IPD.com/IndexSchedule
Portugal
APFIPP/IPD Portugal Quarterly Property Fund Index
Index outline
The APFIPP / IPD Portugal Property Fund Index reports the rolling annual performance of open and closed ended funds on a quarterly basis. Portuguese legislation prevents property funds from reporting performance for periods of less than 12 months.
Statement of Fund Index Composition at June 2012
Index name Net asset value (€m) Net asset value (%) No. of funds
AFIPP / IPD Portugal Property Fund Index – All property funds 5,681 100 35
AFIPP / IPD Portugal Property Fund Index – Open ended property funds
4,092 72 12
AFIPP / IPD Portugal Property Fund Index – Closed ended property funds
1,590 28 23
Index status Unfrozen
Reporting Currency EUR
Index and sub-indices All property funds from December 2006Open ended property funds from December 2006Closed ended property funds from December 2006
Index qualification, unlisted funds eligible where the fund: • Has a strategy to invest primarily in Portugal (+85% GAV)• Reports at least quarterly to investors• Has been/will be/is open to new investment from third parties
Sub index qualification: • Open ended property funds – unfixed lifespan open to new investment via the manager and creation of new units
• Closed ended property funds – fixed lifespan with a set group of investors. Entry and exit of the fund only available via the secondary market
Valuation Approach Time weighted methodology used with fund data sourced from the public domain via AFIPP
Base Date December 2006
Portugal key contactManaged by IPD Southern Europe
Property indicesFund indicesLuis [email protected]+ 34 93 467 74 03

IPD.com/IndexGuide 62
IPD Index Guide 2012
Portugal key contactManaged by IPD Southern Europe
Property indicesFund indicesLuis [email protected]+ 34 93 467 74 03
15th IPD European Property Investment Conference
Headline Sponsor
A New Paradigm for Global Real Estate: From an era of economic destruction, we ask what new forces will emerge
23-24 May 2013Sheraton Lisboa, Portugal
ipd.com/europeanconference

63 IPD.com/IndexSchedule
Spain
IPD Spain Annual Property Index
Statement of Index Composition at December 2011
Capital value (€m) Capital value (%) No. of properties No. of funds
Large shopping centres 1,950 11.0 28 10
Medium shopping centres 2,324 13.1 36 12
Small shopping centres 586 3.3 20 8
Other retail 1,203 6.8 114 13
Office: Madrid CBD & Other Central 4,274 24.0 63 14
Office: Madrid Other 3,302 18.6 61 21
Office: Barcelona Prime/CBD 986 5.5 29 9
Office: Barcelona Other 531 3.0 16 9
Office: Rest of Spain 197 1.1 25 3
Residential 352 2.0 22 5
Industrial 932 5.2 64 19
Other 1,151 6.5 44 10
Retail 6,064 34.1 199 25
Office 9,290 52.2 194 26
Industrial 932 5.2 64 19
Residential 352 2.0 22 5
Other 1,151 6.5 44 10
All Property 17,789 100.0 523 50
IPD Market Coverage 43% at end of December 2011
Market Size 40.9 €bn
Reporting Frequency Annually
Valuation Frequency Annually
Base Date December 2000
Sectors Retail –2000Office – 2000Industrial – 2000Residential – 2000Other – 2000
Valuation Approach Comparable market evidence approach
Reporting Currency EUR
Index Status Unfrozen
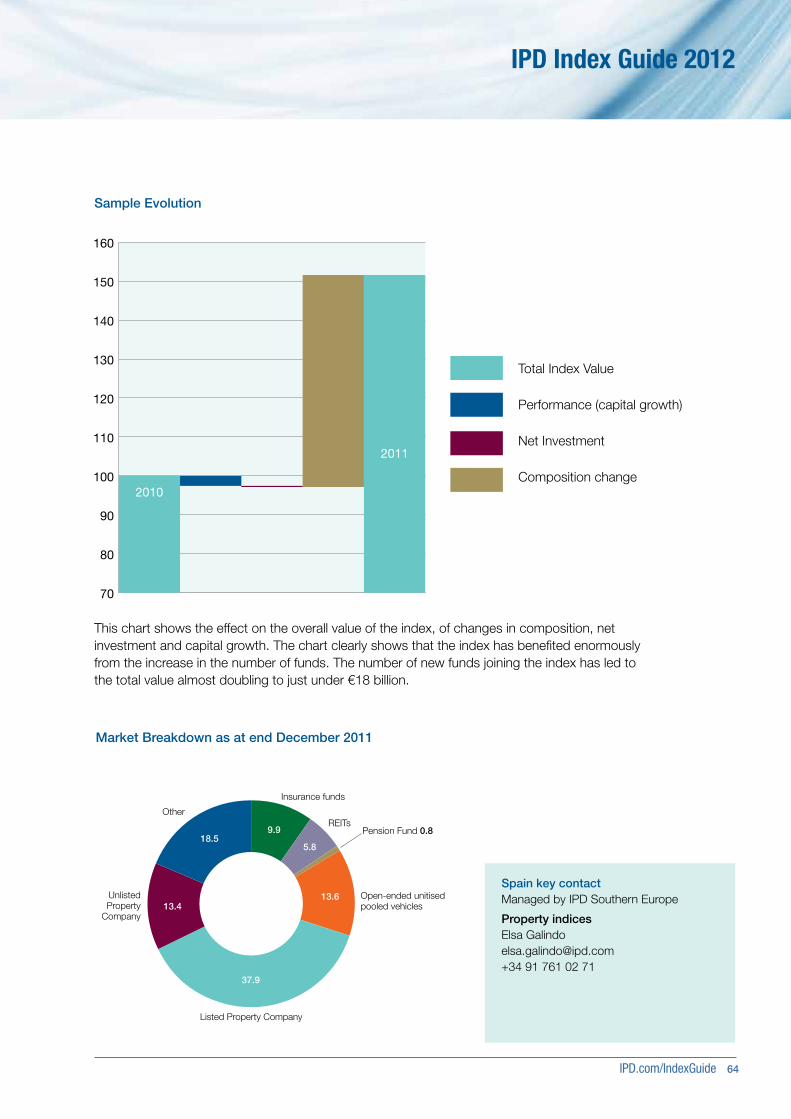
IPD.com/IndexGuide 64
IPD Index Guide 2012
REITsOther
Pension Fund 0.89.9
5.8
13.6
37.9
13.4
18.5
Listed Property Company
Unlisted Property
Company
Insurance funds
Open-ended unitised pooled vehicles
70
80
90
100
110
120
130
140
150
160
2010
2011
This chart shows the effect on the overall value of the index, of changes in composition, net investment and capital growth. The chart clearly shows that the index has benefited enormously from the increase in the number of funds. The number of new funds joining the index has led to the total value almost doubling to just under €18 billion.
Sample Evolution
Market Breakdown as at end December 2011
Total Index Value
Performance (capital growth)
Net Investment
Composition change
Spain key contactManaged by IPD Southern Europe
Property indicesElsa [email protected]+34 91 761 02 71
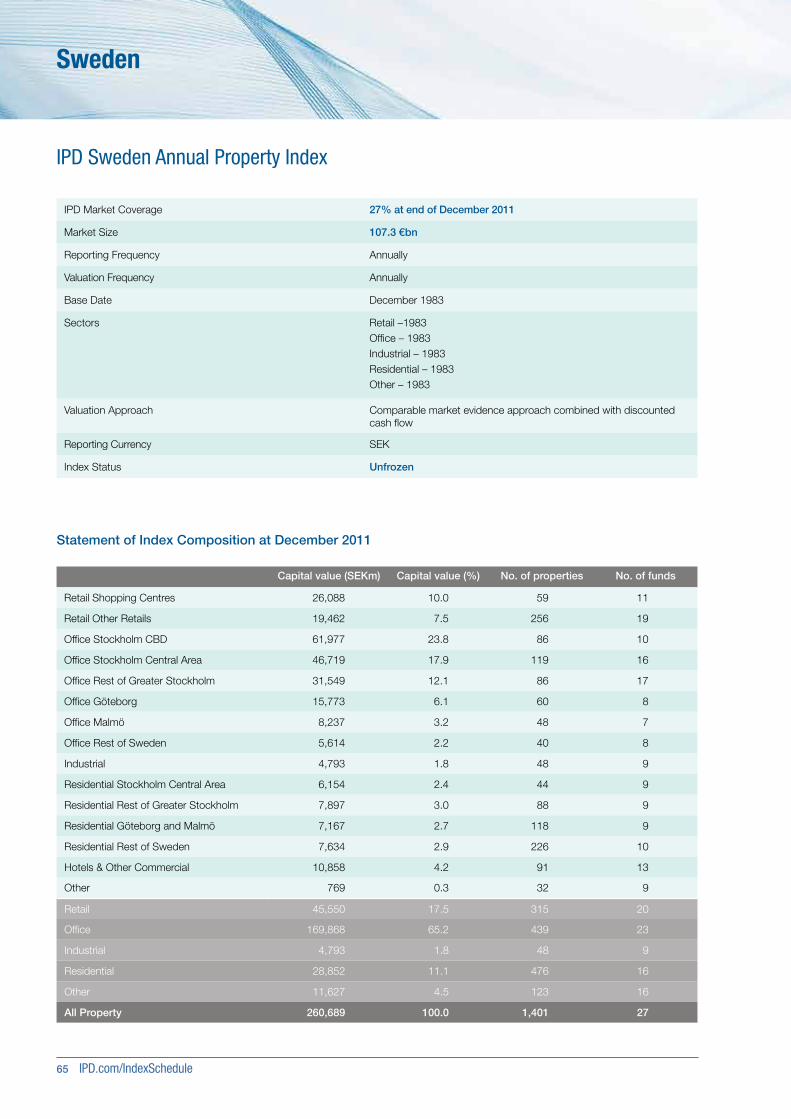
65 IPD.com/IndexSchedule
Sweden
IPD Sweden Annual Property Index
Statement of Index Composition at December 2011
Capital value (SEKm) Capital value (%) No. of properties No. of funds
Retail Shopping Centres 26,088 10.0 59 11
Retail Other Retails 19,462 7.5 256 19
Office Stockholm CBD 61,977 23.8 86 10
Office Stockholm Central Area 46,719 17.9 119 16
Office Rest of Greater Stockholm 31,549 12.1 86 17
Office Göteborg 15,773 6.1 60 8
Office Malmö 8,237 3.2 48 7
Office Rest of Sweden 5,614 2.2 40 8
Industrial 4,793 1.8 48 9
Residential Stockholm Central Area 6,154 2.4 44 9
Residential Rest of Greater Stockholm 7,897 3.0 88 9
Residential Göteborg and Malmö 7,167 2.7 118 9
Residential Rest of Sweden 7,634 2.9 226 10
Hotels & Other Commercial 10,858 4.2 91 13
Other 769 0.3 32 9
Retail 45,550 17.5 315 20
Office 169,868 65.2 439 23
Industrial 4,793 1.8 48 9
Residential 28,852 11.1 476 16
Other 11,627 4.5 123 16
All Property 260,689 100.0 1,401 27
IPD Market Coverage 27% at end of December 2011
Market Size 107.3 €bn
Reporting Frequency Annually
Valuation Frequency Annually
Base Date December 1983
Sectors Retail –1983Office – 1983Industrial – 1983Residential – 1983Other – 1983
Valuation Approach Comparable market evidence approach combined with discounted cash flow
Reporting Currency SEK
Index Status Unfrozen
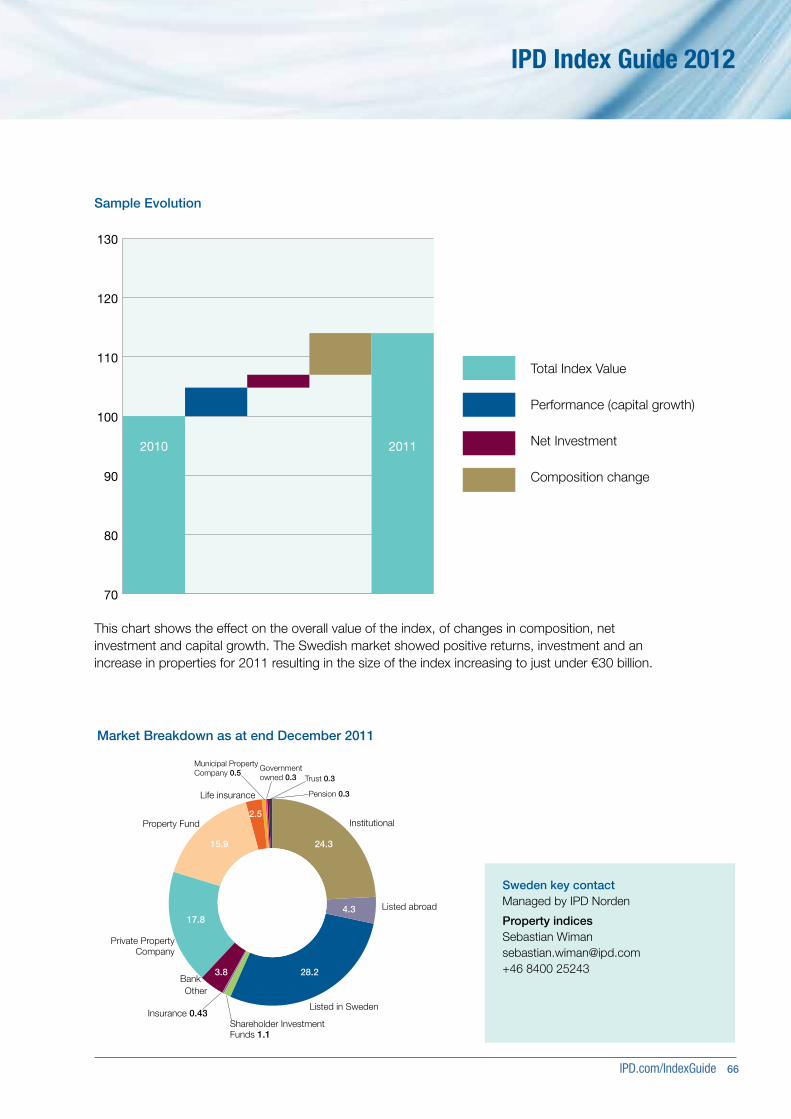
IPD.com/IndexGuide 66
IPD Index Guide 2012
70
80
90
100
110
120
130
2010 2011
This chart shows the effect on the overall value of the index, of changes in composition, net investment and capital growth. The Swedish market showed positive returns, investment and an increase in properties for 2011 resulting in the size of the index increasing to just under €30 billion.
Institutional
Life insurance
3.8
24.3
4.3
28.2
17.8
15.9
Listed in Sweden
Pension 0.3
Listed abroad
Sample Evolution
Market Breakdown as at end December 2011
Shareholder Investment Funds 1.1
Insurance 0.43
OtherBank
Private Property Company
Property Fund2.5
Municipal Property Company 0.5
Government owned 0.3 Trust 0.3
Total Index Value
Performance (capital growth)
Net Investment
Composition change
Sweden key contactManaged by IPD Norden
Property indicesSebastian [email protected] +46 8400 25243
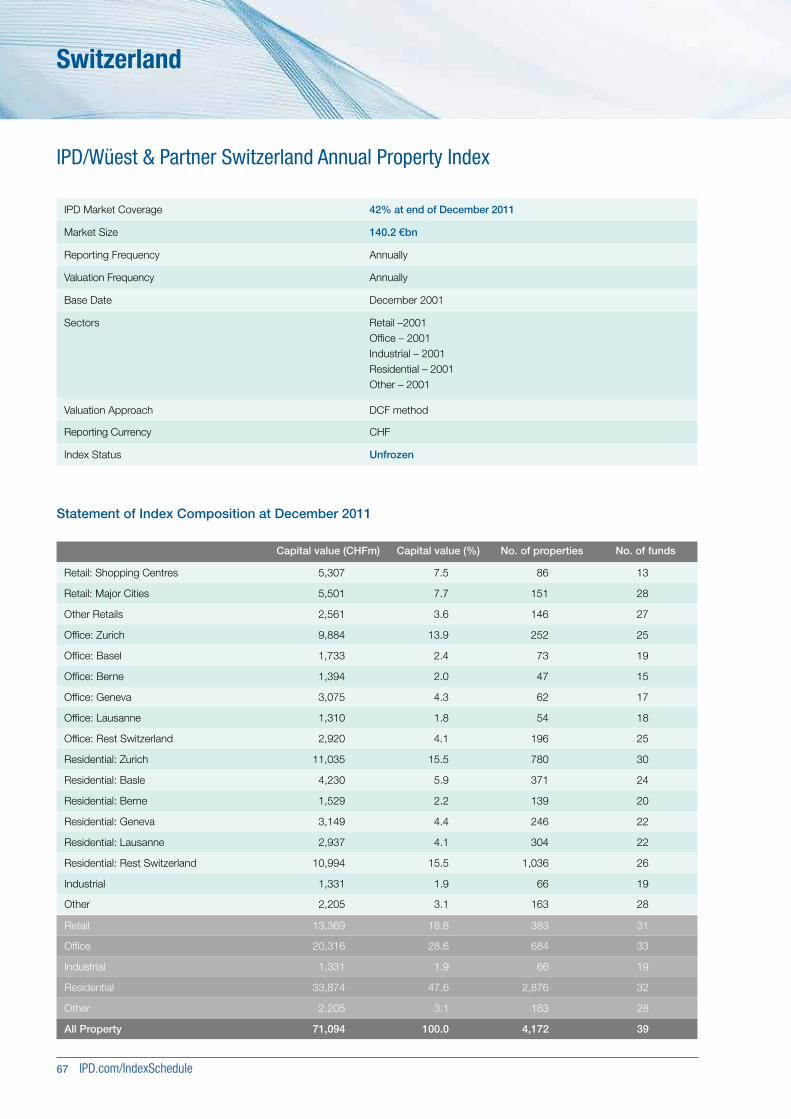
67 IPD.com/IndexSchedule
Switzerland
IPD/Wüest & Partner Switzerland Annual Property Index
Statement of Index Composition at December 2011
Capital value (CHFm) Capital value (%) No. of properties No. of funds
Retail: Shopping Centres 5,307 7.5 86 13
Retail: Major Cities 5,501 7.7 151 28
Other Retails 2,561 3.6 146 27
Office: Zurich 9,884 13.9 252 25
Office: Basel 1,733 2.4 73 19
Office: Berne 1,394 2.0 47 15
Office: Geneva 3,075 4.3 62 17
Office: Lausanne 1,310 1.8 54 18
Office: Rest Switzerland 2,920 4.1 196 25
Residential: Zurich 11,035 15.5 780 30
Residential: Basle 4,230 5.9 371 24
Residential: Berne 1,529 2.2 139 20
Residential: Geneva 3,149 4.4 246 22
Residential: Lausanne 2,937 4.1 304 22
Residential: Rest Switzerland 10,994 15.5 1,036 26
Industrial 1,331 1.9 66 19
Other 2,205 3.1 163 28
Retail 13,369 18.8 383 31
Office 20,316 28.6 684 33
Industrial 1,331 1.9 66 19
Residential 33,874 47.6 2,876 32
Other 2,205 3.1 163 28
All Property 71,094 100.0 4,172 39
IPD Market Coverage 42% at end of December 2011
Market Size 140.2 €bn
Reporting Frequency Annually
Valuation Frequency Annually
Base Date December 2001
Sectors Retail –2001Office – 2001Industrial – 2001Residential – 2001Other – 2001
Valuation Approach DCF method
Reporting Currency CHF
Index Status Unfrozen
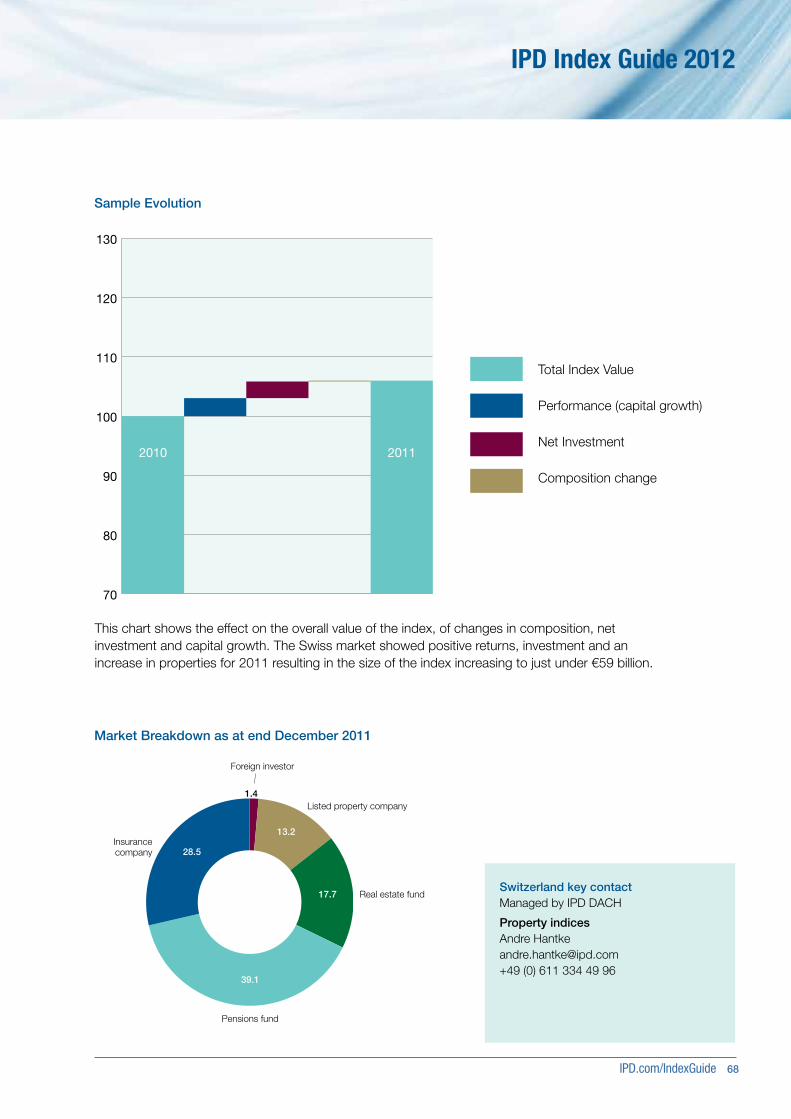
IPD.com/IndexGuide 68
IPD Index Guide 2012
Listed property company
Foreign investor
13.2
17.7
39.1
28.5Insurance company
Real estate fund
Pensions fund
70
80
90
100
110
120
130
2010 2011
This chart shows the effect on the overall value of the index, of changes in composition, net investment and capital growth. The Swiss market showed positive returns, investment and an increase in properties for 2011 resulting in the size of the index increasing to just under €59 billion.
Sample Evolution
Market Breakdown as at end December 2011
Total Index Value
Performance (capital growth)
Net Investment
Composition change
Switzerland key contactManaged by IPD DACH
Property indicesAndre [email protected]+49 (0) 611 334 49 96
1.4
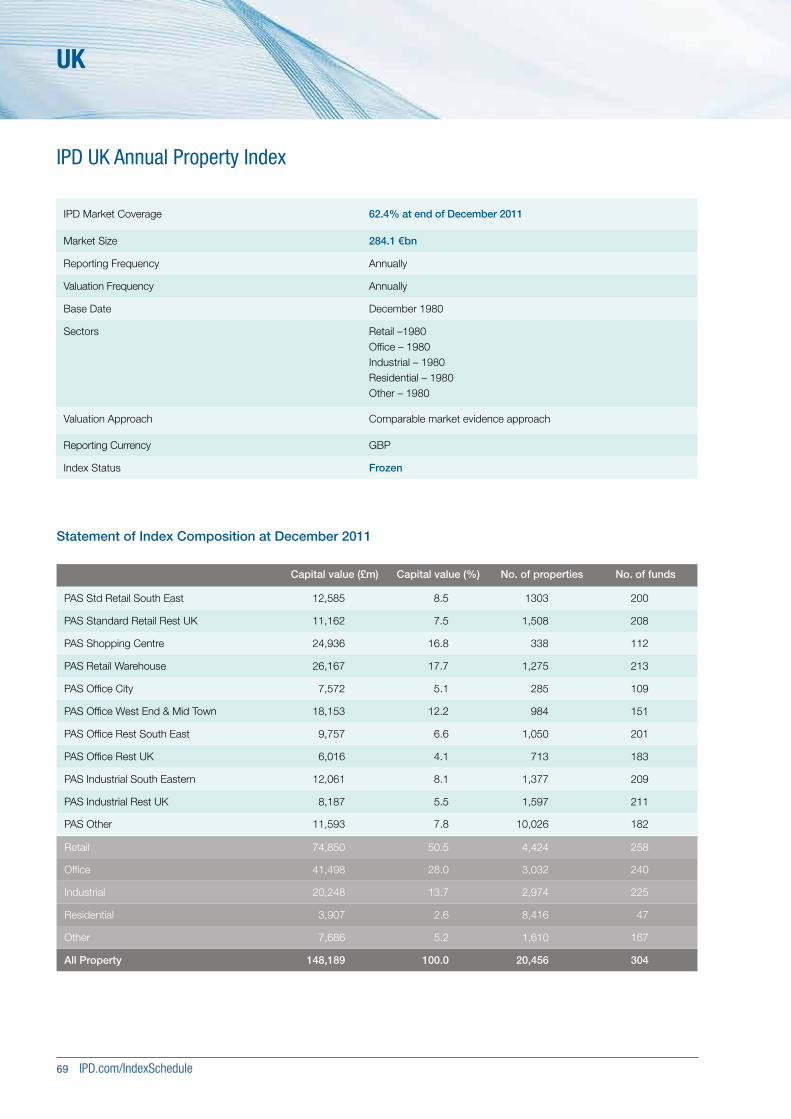
69 IPD.com/IndexSchedule
UK
IPD UK Annual Property Index
Statement of Index Composition at December 2011
Capital value (£m) Capital value (%) No. of properties No. of funds
PAS Std Retail South East 12,585 8.5 1303 200
PAS Standard Retail Rest UK 11,162 7.5 1,508 208
PAS Shopping Centre 24,936 16.8 338 112
PAS Retail Warehouse 26,167 17.7 1,275 213
PAS Office City 7,572 5.1 285 109
PAS Office West End & Mid Town 18,153 12.2 984 151
PAS Office Rest South East 9,757 6.6 1,050 201
PAS Office Rest UK 6,016 4.1 713 183
PAS Industrial South Eastern 12,061 8.1 1,377 209
PAS Industrial Rest UK 8,187 5.5 1,597 211
PAS Other 11,593 7.8 10,026 182
Retail 74,850 50.5 4,424 258
Office 41,498 28.0 3,032 240
Industrial 20,248 13.7 2,974 225
Residential 3,907 2.6 8,416 47
Other 7,686 5.2 1,610 167
All Property 148,189 100.0 20,456 304
IPD Market Coverage 62.4% at end of December 2011
Market Size 284.1 €bn
Reporting Frequency Annually
Valuation Frequency Annually
Base Date December 1980
Sectors Retail –1980Office – 1980Industrial – 1980Residential – 1980Other – 1980
Valuation Approach Comparable market evidence approach
Reporting Currency GBP
Index Status Frozen
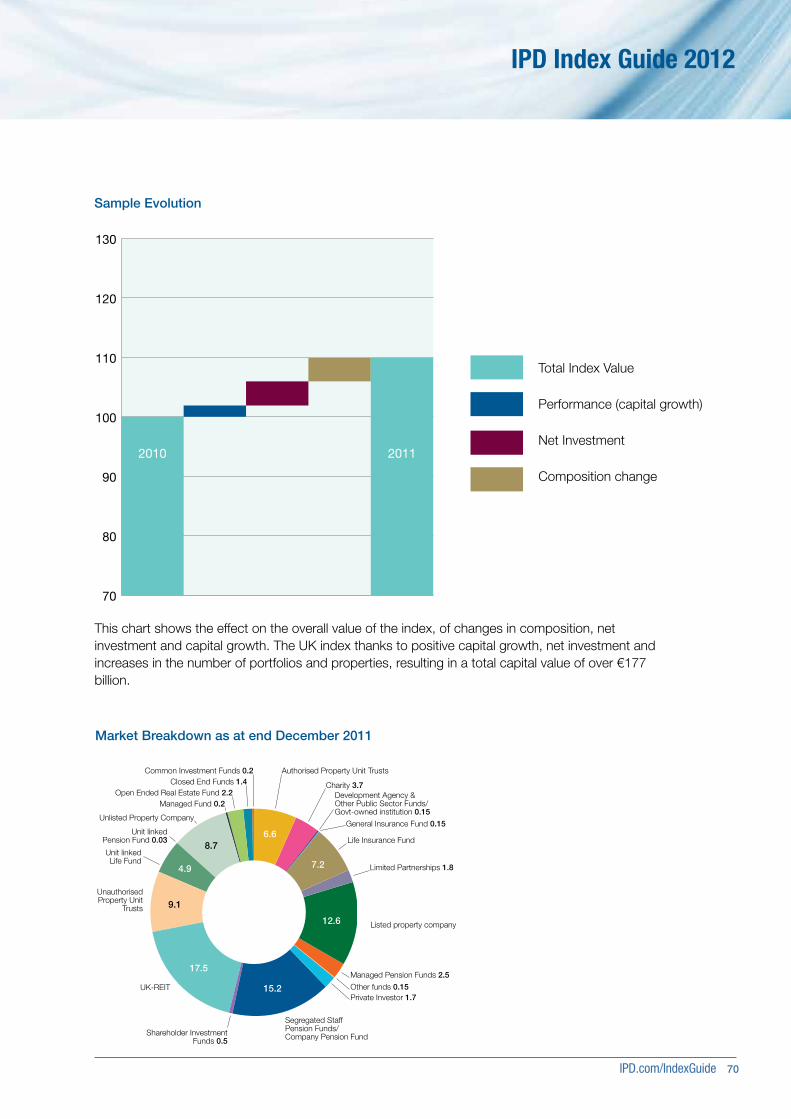
IPD.com/IndexGuide 70
IPD Index Guide 2012
Charity 3.7Development Agency & Other Public Sector Funds/ Govt-owned institution 0.15
Authorised Property Unit Trusts
Limited Partnerships 1.8
Life Insurance Fund
General Insurance Fund 0.15
Managed Pension Funds 2.5
Shareholder Investment Funds 0.5
UK-REITPrivate Investor 1.7Other funds 0.15
6.6
7.2
12.6
15.2
17.5
9.1
8.7
4.9
Unauthorised Property Unit
Trusts
Unit linked Life Fund
Unit linked Pension Fund 0.03
Unlisted Property Company
Managed Fund 0.2Open Ended Real Estate Fund 2.2
Closed End Funds 1.4Common Investment Funds 0.2
Listed property company
Segregated Staff Pension Funds/ Company Pension Fund
70
80
90
100
110
120
130
2010 2011
This chart shows the effect on the overall value of the index, of changes in composition, net investment and capital growth. The UK index thanks to positive capital growth, net investment and increases in the number of portfolios and properties, resulting in a total capital value of over €177 billion.
Sample Evolution
Market Breakdown as at end December 2011
Total Index Value
Performance (capital growth)
Net Investment
Composition change
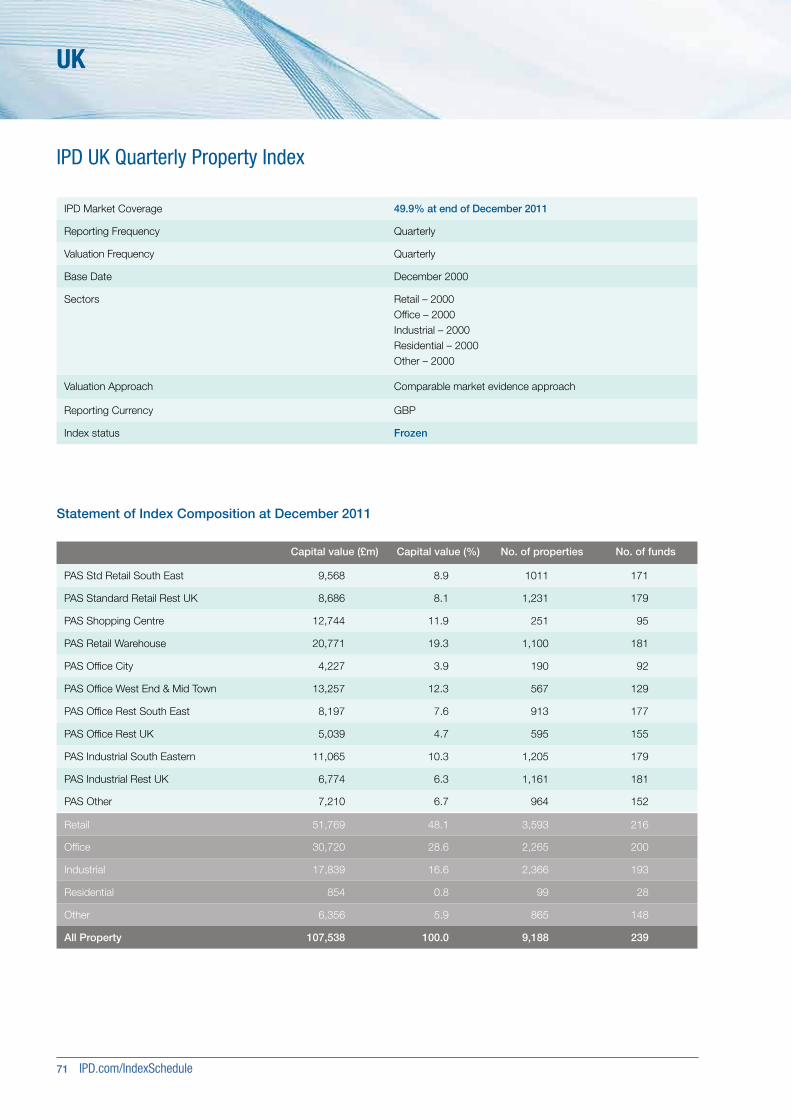
71 IPD.com/IndexSchedule
UK
IPD UK Quarterly Property Index
Statement of Index Composition at December 2011
Capital value (£m) Capital value (%) No. of properties No. of funds
PAS Std Retail South East 9,568 8.9 1011 171
PAS Standard Retail Rest UK 8,686 8.1 1,231 179
PAS Shopping Centre 12,744 11.9 251 95
PAS Retail Warehouse 20,771 19.3 1,100 181
PAS Office City 4,227 3.9 190 92
PAS Office West End & Mid Town 13,257 12.3 567 129
PAS Office Rest South East 8,197 7.6 913 177
PAS Office Rest UK 5,039 4.7 595 155
PAS Industrial South Eastern 11,065 10.3 1,205 179
PAS Industrial Rest UK 6,774 6.3 1,161 181
PAS Other 7,210 6.7 964 152
Retail 51,769 48.1 3,593 216
Office 30,720 28.6 2,265 200
Industrial 17,839 16.6 2,366 193
Residential 854 0.8 99 28
Other 6,356 5.9 865 148
All Property 107,538 100.0 9,188 239
IPD Market Coverage 49.9% at end of December 2011
Reporting Frequency Quarterly
Valuation Frequency Quarterly
Base Date December 2000
Sectors Retail – 2000Office – 2000Industrial – 2000Residential – 2000Other – 2000
Valuation Approach Comparable market evidence approach
Reporting Currency GBP
Index status Frozen
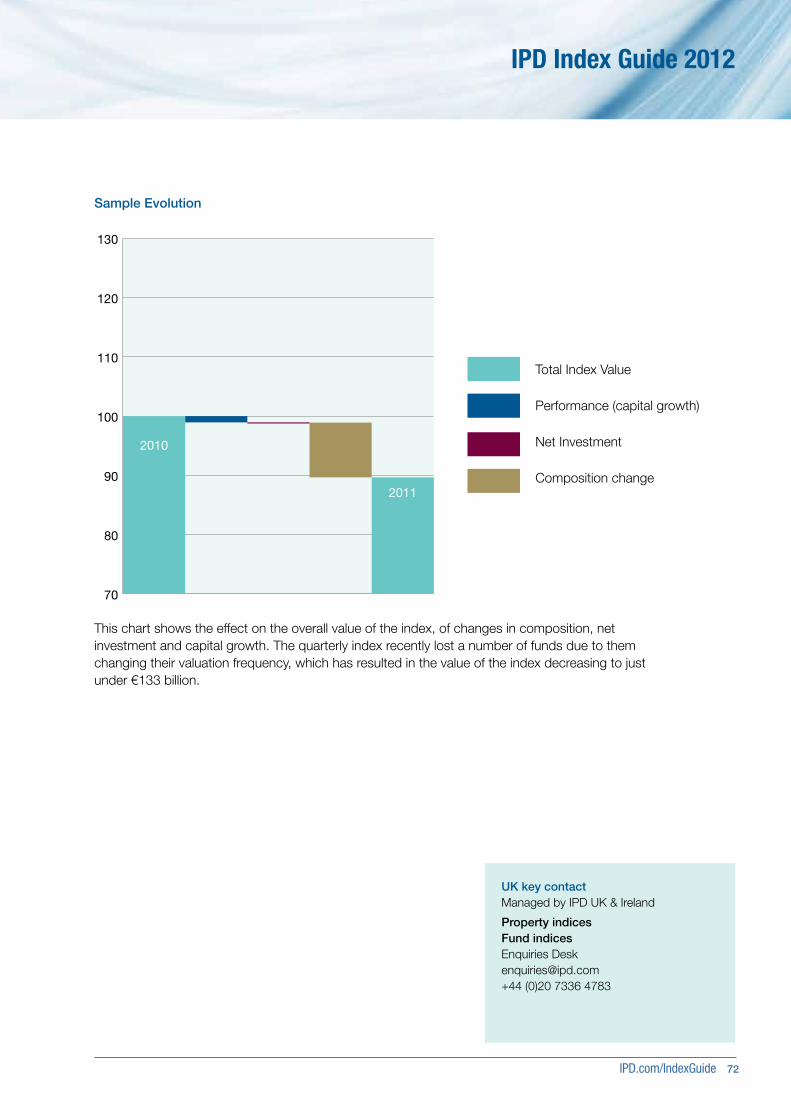
IPD.com/IndexGuide 72
IPD Index Guide 2012
70
80
90
100
110
120
130
2010
2011
This chart shows the effect on the overall value of the index, of changes in composition, net investment and capital growth. The quarterly index recently lost a number of funds due to them changing their valuation frequency, which has resulted in the value of the index decreasing to just under €133 billion.
Sample Evolution
Total Index Value
Performance (capital growth)
Net Investment
Composition change
UK key contactManaged by IPD UK & Ireland
Property indicesFund indicesEnquiries Desk [email protected]+44 (0)20 7336 4783

73 IPD.com/IndexSchedule
UK
IPD UK Monthly Property Index
Statement of Index Composition at December 2011
Capital value (£m) Capital value (%) No. of properties No. of funds
PAS Std Retail South East 2,466 7.4 378 55
PAS Standard Retail Rest UK 3,000 9.1 549 61
PAS Shopping Centre 2,064 6.2 99 33
PAS Retail Warehouse 8,104 24.5 486 59
PAS Office City 1,124 3.4 67 34
PAS Office West End & Mid Town 3,812 11.5 158 47
PAS Office Rest South East 3,231 9.8 394 60
PAS Office Rest UK 1,869 5.6 254 54
PAS Industrial South Eastern 3,140 9.5 434 57
PAS Industrial Rest UK 2,581 7.8 485 60
PAS Other 1,736 5.2 288 40
Retail 15,635 47.2 1,512 64
Office 10,036 30.3 873 63
Industrial 5,721 17.3 919 63
Residential 26 0.1 3 3
Other 1,711 5.2 285 40
All Property 33,128 100.0 3,592 70
IPD Market Coverage 14.5% at end of December 2011
Reporting Frequency Monthly
Valuation Frequency Monthly
Base Date December 1986
Sectors Retail – 2000Office – 2000Industrial – 2000
Valuation Approach Comparable market evidence approach
Reporting Currency GBP
Index status Frozen
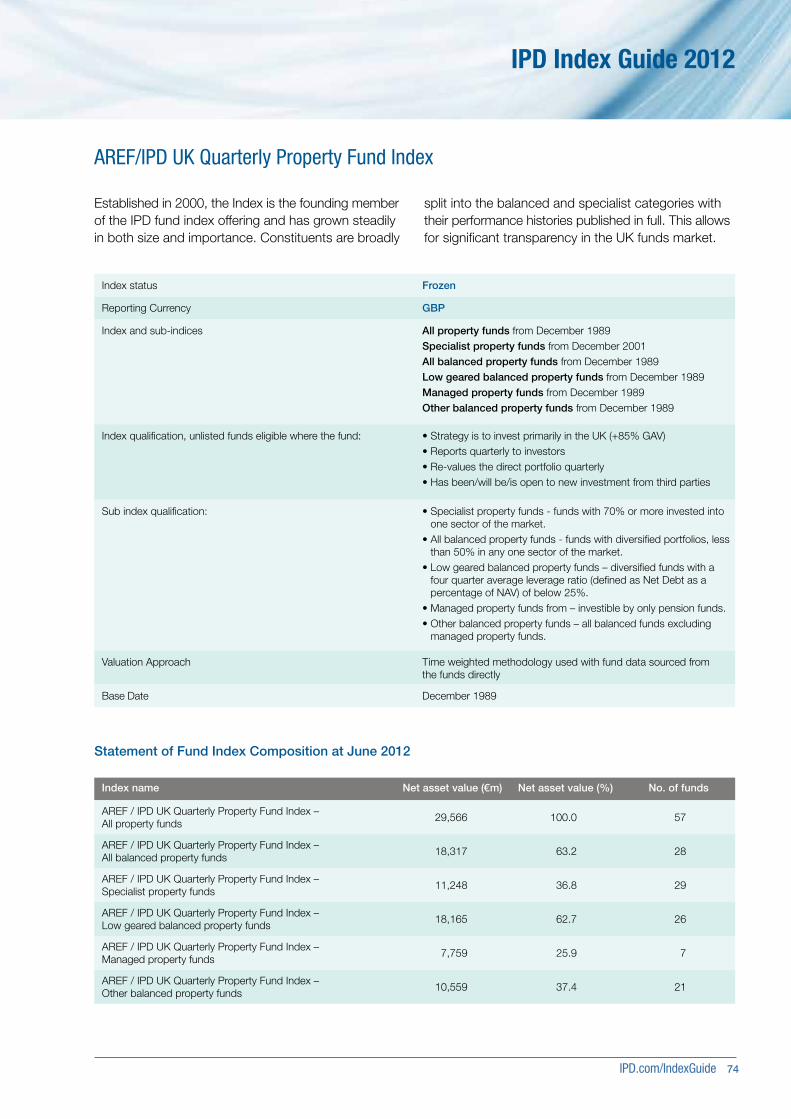
IPD.com/IndexGuide 74
IPD Index Guide 2012
AREF/IPD UK Quarterly Property Fund Index
Established in 2000, the Index is the founding member of the IPD fund index offering and has grown steadily in both size and importance. Constituents are broadly
split into the balanced and specialist categories with their performance histories published in full. This allows for significant transparency in the UK funds market.
Statement of Fund Index Composition at June 2012
Index name Net asset value (€m) Net asset value (%) No. of funds
AREF / IPD UK Quarterly Property Fund Index – All property funds
29,566 100.0 57
AREF / IPD UK Quarterly Property Fund Index – All balanced property funds
18,317 63.2 28
AREF / IPD UK Quarterly Property Fund Index – Specialist property funds
11,248 36.8 29
AREF / IPD UK Quarterly Property Fund Index – Low geared balanced property funds
18,165 62.7 26
AREF / IPD UK Quarterly Property Fund Index – Managed property funds
7,759 25.9 7
AREF / IPD UK Quarterly Property Fund Index – Other balanced property funds
10,559 37.4 21
Index status Frozen
Reporting Currency GBP
Index and sub-indices All property funds from December 1989Specialist property funds from December 2001All balanced property funds from December 1989Low geared balanced property funds from December 1989Managed property funds from December 1989Other balanced property funds from December 1989
Index qualification, unlisted funds eligible where the fund: • Strategy is to invest primarily in the UK (+85% GAV)• Reports quarterly to investors• Re-values the direct portfolio quarterly• Has been/will be/is open to new investment from third parties
Sub index qualification: • Specialist property funds - funds with 70% or more invested into one sector of the market.
• All balanced property funds - funds with diversified portfolios, less than 50% in any one sector of the market.
• Low geared balanced property funds – diversified funds with a four quarter average leverage ratio (defined as Net Debt as a percentage of NAV) of below 25%.
• Managed property funds from – investible by only pension funds.• Other balanced property funds – all balanced funds excluding
managed property funds.
Valuation Approach Time weighted methodology used with fund data sourced from the funds directly
Base Date December 1989
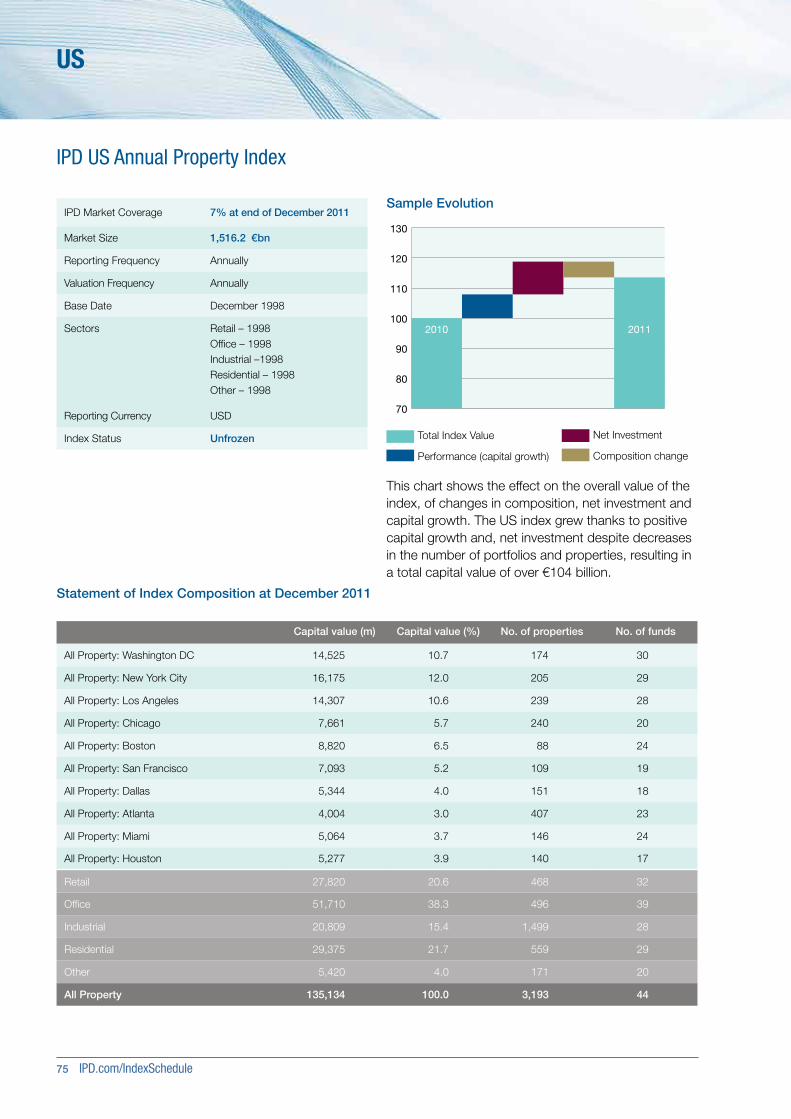
75 IPD.com/IndexSchedule
US
IPD US Annual Property Index
Statement of Index Composition at December 2011
70
80
90
100
110
120
130
2010 2011
This chart shows the effect on the overall value of the index, of changes in composition, net investment and capital growth. The US index grew thanks to positive capital growth and, net investment despite decreases in the number of portfolios and properties, resulting in a total capital value of over €104 billion.
Capital value (m) Capital value (%) No. of properties No. of funds
All Property: Washington DC 14,525 10.7 174 30
All Property: New York City 16,175 12.0 205 29
All Property: Los Angeles 14,307 10.6 239 28
All Property: Chicago 7,661 5.7 240 20
All Property: Boston 8,820 6.5 88 24
All Property: San Francisco 7,093 5.2 109 19
All Property: Dallas 5,344 4.0 151 18
All Property: Atlanta 4,004 3.0 407 23
All Property: Miami 5,064 3.7 146 24
All Property: Houston 5,277 3.9 140 17
Retail 27,820 20.6 468 32
Office 51,710 38.3 496 39
Industrial 20,809 15.4 1,499 28
Residential 29,375 21.7 559 29
Other 5,420 4.0 171 20
All Property 135,134 100.0 3,193 44
Sample EvolutionIPD Market Coverage 7% at end of December 2011
Market Size 1,516.2 €bn
Reporting Frequency Annually
Valuation Frequency Annually
Base Date December 1998
Sectors Retail – 1998Office – 1998Industrial –1998Residential – 1998Other – 1998
Reporting Currency USD
Index Status Unfrozen Total Index Value
Performance (capital growth)
Net Investment
Composition change
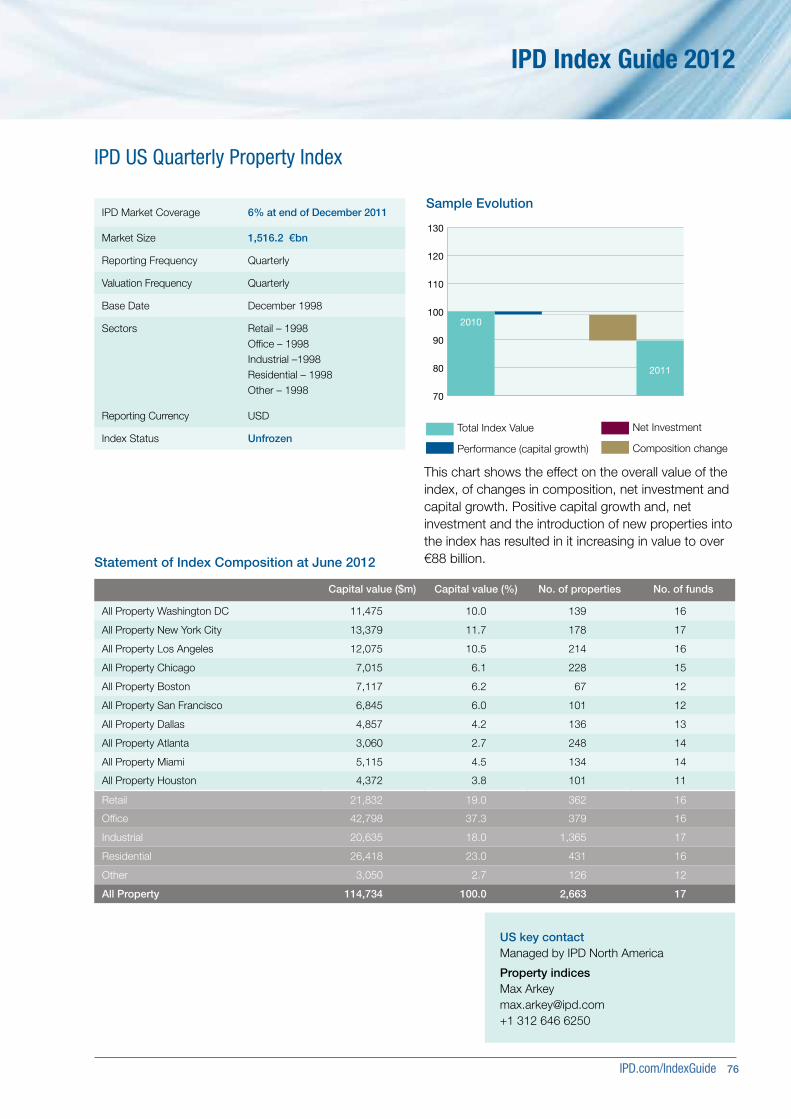
IPD.com/IndexGuide 76
IPD Index Guide 2012
IPD US Quarterly Property Index
Statement of Index Composition at June 2012
70
80
90
100
110
120
130
2010
2011
This chart shows the effect on the overall value of the index, of changes in composition, net investment and capital growth. Positive capital growth and, net investment and the introduction of new properties into the index has resulted in it increasing in value to over €88 billion.
Capital value ($m) Capital value (%) No. of properties No. of funds
All Property Washington DC 11,475 10.0 139 16
All Property New York City 13,379 11.7 178 17
All Property Los Angeles 12,075 10.5 214 16
All Property Chicago 7,015 6.1 228 15
All Property Boston 7,117 6.2 67 12
All Property San Francisco 6,845 6.0 101 12
All Property Dallas 4,857 4.2 136 13
All Property Atlanta 3,060 2.7 248 14
All Property Miami 5,115 4.5 134 14
All Property Houston 4,372 3.8 101 11
Retail 21,832 19.0 362 16
Office 42,798 37.3 379 16
Industrial 20,635 18.0 1,365 17
Residential 26,418 23.0 431 16
Other 3,050 2.7 126 12
All Property 114,734 100.0 2,663 17
Sample EvolutionIPD Market Coverage 6% at end of December 2011
Market Size 1,516.2 €bn
Reporting Frequency Quarterly
Valuation Frequency Quarterly
Base Date December 1998
Sectors Retail – 1998Office – 1998Industrial –1998Residential – 1998Other – 1998
Reporting Currency USD
Index Status Unfrozen
US key contactManaged by IPD North America
Property indicesMax [email protected] +1 312 646 6250
Total Index Value
Performance (capital growth)
Net Investment
Composition change

Australia
T +61 (0) 2 9248 1900 [email protected] ipd.com/australia
France
T +33 (0) 15 805 3690 [email protected] ipd.com/france
Germany
T +49 (0) 611 3344 990 [email protected] ipd.com/germany
Hong Kong
T +85 2 8175 4388 [email protected] ipd.com/asia
Japan
T +81 3 5211 1455 [email protected] ipd.com/japan
Netherlands
T +31 (0) 88 328 2200 [email protected] ipd.com/netherlands
Sweden
T +46 (0) 8 4002 5230 [email protected] ipd.com/nordic
South Africa
T +27 (0) 11 656 2115 [email protected] ipd.com/southafrica
Spain
T +34 (0) 91 761 0271 [email protected] ipd.com/spain
United Kingdom
T +44 (0) 20 7336 4783 [email protected] ipd.com/uk
USA
T +1 (0) 312 646 6240 [email protected] ipd.com/usa
Visit us at IPD.com Follow us at @IPDnewsJoin us on LinkedInContact us at [email protected]