iot-enabled high efficiency smart solar charge controller
TRANSCRIPT

electronics
Article
IoT-Enabled High Efficiency Smart Solar ChargeController with Maximum Power PointTracking—Design, Hardware Implementation andPerformance Testing
Md. Rokonuzzaman 1,2,* , Mohammad Shakeri 1 , Fazrena Azlee Hamid 2,Mahmuda Khatun Mishu 1,2 , Jagadeesh Pasupuleti 1, Kazi Sajedur Rahman 3 ,Sieh Kiong Tiong 1 and Nowshad Amin 1,*
1 Institute of Sustainable Energy (ISE), Universiti Tenaga Nasional (@The National Energy University),Jalan IKRAM-UNITEN, Kajang 43000, Selangor, Malaysia; [email protected] (M.S.);[email protected] (M.K.M.); [email protected] (J.P.);[email protected] (S.K.T.)
2 College of Engineering (COE), Universiti Tenaga Nasional (@The National Energy University),Jalan IKRAM-UNITEN, Kajang 43000, Selangor, Malaysia; [email protected]
3 Solar Energy Research Institute, Universiti Kebangsaan Malaysia, Bangi 43600, Selangor, Malaysia;[email protected]
* Correspondence: [email protected] (M.R.); [email protected] (N.A.)
Received: 30 June 2020; Accepted: 17 July 2020; Published: 7 August 2020�����������������
Abstract: Amid growing demand for solar photovoltaic (PV) energy, the output from PV panels/cellsfails to deliver maximum power to the load, due to the intermittency of ambient conditions. Therefore,utilizing maximum power point tracking (MPPT) becomes essential for PV systems. In this paper,a novel internet of things (IoT)-equipped MPPT solar charge controller (SCC) is designed andimplemented. The proposed circuit system utilizes IoT-based sensors to send vital data to thecloud for remote monitoring and controlling purposes. The IoT platform helps the system to bemonitored remotely. The PIC16F877A is used as a main controller of the proposed MPPT-SCC besidesimplementing the perturb and observe (P&O) technique and a customized buck–boost converter.To validate the proposed system, both simulation and hardware implementation are carried out bythe MATLAB/SIMULINK environment and laboratory set up, respectively. The proposed MPPT-SCCcan handle the maximum current of 10 A at 12 V voltage. Results show that the efficiency of theproposed system reaches up to 99.74% during a month of performance testing duration.
Keywords: internet of things (IoT); MPPT charge controller; solar charge controller (SCC); perturband observe (P&O); microcontroller-based SCC; MATLAB/SIMULINK; PV system
1. Introduction
Energy sources are facing rapid transitions around the world. This shifting trend between fossilfuels and renewable energy is mainly being steered by the growing energy demand, environmentalconcerns, and call for green technology. While fossil fuels could continue to offer nearly 80% of totalenergy demand until 2040, renewable generation envisages capturing more than 50% of the demandthereafter, with an existing annual growth rate of 2.5% [1]. This notion reveals an obvious interestin and potential of renewable energy for future energy demand. Among the potential renewableenergy sources (RESs), including solar energy, wind energy, bioenergy, hydro energy, geothermalenergy, marine energy etc., solar energy has risen as one of the top three most powerful forms of RESs.
Electronics 2020, 9, 1267; doi:10.3390/electronics9081267 www.mdpi.com/journal/electronics

Electronics 2020, 9, 1267 2 of 16
The International Renewable Energy Agency (IRENA) reported that the aggregate sum of 6586 terawatthour (TWh) power generated from renewable energy sources in 2018. Sustainable hydro representedabout 4149 TWh (63%), trailed by wind energy at 1263 TWh (19%), solar energy at 562 TWh (9%),bioenergy at 523 TWh (8%), geothermal energy at 88 TWh (1%) and marine energy at 1 TWh [2].
Despite the rapid expansion of solar energy uses, the non-linearity characteristics of solar cellspose a major challenge to harness the maximum power from the solar energy. Particularly, the current–voltage (I–V) and power–voltage (P–V) curves of the solar photovoltaic (PV) system hold a nonlinearproperty that highly depends on solar irradiance, temperature and load [3]. Based on the fluctuation ofirradiance and temperature, the voltage and current continually vary the expected maximum outputpower from the PV system. This nonlinear nature of the PV panel brings down the energy conversionability and boosts the system installation cost. To overcome the hindrance of nonlinearity, PV panelsmust be operated at maximum power point (MPP) under varying atmospheric circumstances [4–7].Several maximum power point tracking (MPPT) techniques have been developed for the solar chargecontroller (SCC) and studied to track this MPP of the solar cell. For example, perturb and observe(P&O) [8–17], incremental conductance (IC) [18–23], genetic neural algorithm [24–26] and fuzzy logiccontrol (FLC) are studied [27–29] that can operate the solar PV panel at MPP with relatively higherefficiency. However, among them, the P&O algorithm is popular for its simplicity and high efficiency.SCC with MPPT utilizes the output of the PV panel (i.e., the voltage and current) to produce the pulsewidth modulation (PWM) signal to control the boost converter’s output [30]. Without a controllercircuit, a PV panel can accomplish MPPT, but an efficient power transfer may not be often ensured,resulting in a higher power loss, whereas an MPPT-SCC can transfer more than 90% of the PV panelpower to the battery [31].
However, available MPPT-SCCs in the market are inconvenient, expensive, and antiquated.Their operating process is usually complex for urban and non-technical people. Additionally, no smartdata monitoring features were adopted in those controllers. To meet the current demand for energy,an efficient way of energy harvesting and distributing is very important. In modern societies, to meetthe balance between supply and demand, sometimes load-shedding or shifting is needed. A standalonesolar PV system that is equipped with any kind of backup energy storage, such as a battery, can producethe required power for the loads. Batteries are regarded as the highest effective source for homeenergy supply in isolated as well as rural regions [32]. Besides, due to the trend of the smart city,smart buildings, smart homes, smart gadgets, and the economical use of electricity without hamperinghuman comfort [33,34], a smart device is needed that can harness and distribute the energy in analgorithmic way from the PV system. Therefore, the need for an efficient MPPT-SCC is sensed morethan any time.
In this paper, an efficient SCC with IoT features is presented. Particularly, a charge controllerprototype is designed with a 10-bit PIC16F877A microcontroller [35], having a flexible and sufficientI/O pin, 8 K flash program memory, and 356 bytes data memory. As a motivation, the prototypeis equipped with the IoT platform to send vital data to the webserver for remote monitoring andcontrolling. The data are continuously sent to the cloud for further analysis and also for monitoring thestatus of the PV system using the website or mobile apps. These data can also be used to determine anypossible faults of either PV system, batteries, or MPPT-SCC. Finally, a modified buck–boost converteris used to effectively deliver the harvested power from the solar panel to the load. The proposedMPPT-SCC is designed with an external device charging unit, real-time data monitoring display,and the IoT-based sensors to redefine the controller with time features. The proposed controller iscomputationally modeled and simulated with MATLAB/SIMULINK environment, and also, practicallyimplemented with a laboratory set up, to learn its real-time performance improvement over theprominent charge controllers.
This paper is structured as follows. Section 2 captures a brief overview of the state of the MPPTsolar charge controller. A brief outline of the P&O algorithm followed by the modeling of the PVarray with MPPT technique is explained in Section 3. The proposed system is presented in Section 4.

Electronics 2020, 9, 1267 3 of 16
The complete simulation and experimental setup with the specifications of each module is presented inSections 5 and 6, respectively, to validate the proposed MPPT-SCC system. The manuscript concludeswith the results, which are accompanied by a thorough analysis.
2. Current Research Trends of MPPT Solar Charge Controller
Different techniques and algorithms are being used in developing the MPPT-SCC. Despite theirvariety in operating principles, a common objective of the previous and recent research works is toimprove the MPPT efficiency at a low cost, without hampering daily energy consumption routines.Tawfik Radjai et al. [36] presented a fuzzy logic controller based on a newly modified P&O MPPTtechnique with an adaptive duty cycle, which showed 98% efficiency. The authors presented both thesimulation and hardware design of the prototype by using a CUKDC-DC converter and a SunTechSTP085B PV module. Similarly, Ankur Bhattacharjee et al. [12] developed and validated a MPPT batterycharger to use in PV applications. The authors proposed a vanadium redox flow battery (VRFB) insteadof lead-acid and Li-ion batteries, and used a three-stage constant current constant voltage (CC-CV)topology and found 94.5% efficiency to charge the VRFB. Anil S. Hiwale et al. [11] implemented ahardware prototype with 87% efficiency using the P&O algorithm. Here, the controller generates thepulse width modulation (PWM) signal and controls the buck converter to extract the power from thePV module. John Macaulay et al. [13] proposed a fuzzy logic controller-based variable step size P&OMPPT technique for the standalone PV system. An enclosed emulated PV system including DC powersource, boost converter, and a DSPACE card is used to implement the presented system. The trackingefficiency is improved by 0.38% compared to the existing algorithm. Unal Yilmaz et al. [37] haverecently presented a fuzzy logic and PI controller MPPT-SCC for the PV system to rapidly charge thebattery, reduce the losses, and improve the battery life cycle. The complete system was established andexamined in the MATLAB/SIMULINK environment and provided 94.8–99.4% efficiency. In an earlierwork, Rahul Dubey [38] reported a 99% efficient simulation model of a neural network MPPT controllerintegrated with a hysteresis current controlled inverter (HCCI) for a PV system. Jubaer Ahmed et al. [10]also reported an improved P&O MPPT algorithm for higher efficiency. Using the MATLAB/SIMULINKenvironment, the authors reported an overall improvement of 2% for their 99.2% efficient MPPT.
In summary, available MPPT-SCCs in the market do not support any IoT-based smart features,neither are they cost-effective and user friendly for use by urban and non-technical people. Therefore,the requirements of these features and higher efficiency have been the key criteria of SCC developmentin a more efficient way of energy harvesting and distributing.
3. Modeling of the PV Array and MPPT Techniques
Some factors dominate the output of PV cells, such as solar irradiance, temperature, shadows,and dirt. The literature review shows some interesting models of solar cells [39,40]. The single diodemodel and the double diode model are very popular electrical models for the solar cell. Comparingwith the double diode model, the single diode model is efficient as well as simple to design, includingthe low value of series resistance, and have an ideal diode factor that can provide improvement in theresults of PV cells [36]. Hence, a single diode PV model is used in this research work. A simplifiedequivalent single diode electrical model of solar cells is illustrated in Figure 1. The respective I–V curverelation can be represented by Equation (1).
I = Isc − Io
exp
V + RSINsKT
q a
− 1
−(
V + RSIRsh
)(1)
where Isc is the short circuit current, Io denotes the saturation current, the diode ideality constant isa, Ns is the series-connected cell, T is the temperature of the PN junction, K = 1.38 × 10⁻²³ J/K isthe Boltzman constant, q = 1.6 × 10⁻¹⁹ C is the charge of an electron, and RS, and Rsh are the series

Electronics 2020, 9, 1267 4 of 16
and shunt resistance of the array, respectively. If the thermal voltage of the array, Vt =NsKT
q then,Equation (1) can be rewritten as:
I = Isc − Io
[exp
(V + RSIVta
)− 1
]−
(V + RSI
Rsh
)(2)
Electronics 2020, 9, x FOR PEER REVIEW 4 of 16
𝐼 = 𝐼 − 𝐼 𝑒𝑥𝑝 𝑉 + 𝑅 𝐼𝑉 𝑎 − 1 − 𝑉 + 𝑅 𝐼𝑅 (2)
Figure 1. Equivalent single diode electrical model of a solar cell.
The most common and very popular MPPT techniques are perturb and observe (P&O) and incremental conductance (IC). To implement the MPPT in solar panels, the P&O algorithm is the simplest and cheap solution. This algorithm can easily adapt to both the software and hardware platform [16]. Therefore, the P&O algorithm (Algorithm 1) is chosen here to implement the proposed system. P&O works based on the disruption of panel array voltage. Figure 2a illustrates the P–V curve when the P&O algorithm is active. The output power of an MPP SCC is oscillating continuously around the MPP. By reducing the perturbation step rate, the oscillations of the P–V curve can be minimized.
Algorithm 1 Proposed P&O algorithm: State 1: Start State 2: Measure Variables V (k) and I (k) State 3: Estimate power: P (k) = V (k) × I (k) State 4: Call previous power P (k − 1) and voltage V (k − 1) State 5: Estimate the changed power ‘dP’ and changed voltage ‘dV’: dP = P (k) − P (k − 1) and dV = V (k) − V (k − 1). State 6: 𝐼𝑓, 𝑑𝑃 = 0𝐸𝑙𝑠𝑒 ΔD = dP × dV˃0Else ΔD = dP × dV 0 Then step forward to State 7.
State 7: Return.
Figure 1. Equivalent single diode electrical model of a solar cell.
The most common and very popular MPPT techniques are perturb and observe (P&O) andincremental conductance (IC). To implement the MPPT in solar panels, the P&O algorithm is thesimplest and cheap solution. This algorithm can easily adapt to both the software and hardwareplatform [16]. Therefore, the P&O algorithm (Algorithm 1) is chosen here to implement the proposedsystem. P&O works based on the disruption of panel array voltage. Figure 2a illustrates the P–V curvewhen the P&O algorithm is active. The output power of an MPP SCC is oscillating continuously aroundthe MPP. By reducing the perturbation step rate, the oscillations of the P–V curve can be minimized.Electronics 2020, 9, x FOR PEER REVIEW 5 of 16
(a) (b)
Figure 2. (a) P–V curve of a solar PV array on P&O (b) proposed flowchart of P&O algorithm.
Figure 2b illustrates the proposed flowchart of the P&O algorithm. Following State 5, the dP represents a small change in power, while the variation of the voltage is denoted by dV. According to Figure 2a, when the voltage is decreased, then, the power of the MPP increases; similarly, the power of MPP increases when the voltage is increased. This is the core concept behind the P&O algorithm. The algorithm equates the current power reading, Pk, with the previous power reading, Pk−1, after the execution of each increase in the panel operating voltage. The voltage would increase if the power raised; otherwise, it shifts the direction or decreases the voltage through the switching duty cycle. Until the MPP is touched, this process will be repeated at each MPP monitoring phase [31].
4. Proposed System Architecture
The proposed system is divided into two sections. One is a simulation section, and another is an experimental setup. In the experimental setup, a modified buck–boost converter is developed and used. Similarly, in the simulation section, a mathematical model of the buck–boost converter is designed, and the complete system of the proposed design is simulated.
The principal structure of the prototype hardware is presented by a block diagram shown in Figure 3. To achieve the highest energy productivity, the solar PV panel must work at MPP. The complete prototype of the proposed charge controller is shown in Figure 4. The input power source is the 85 W PV module. The state of the input voltage and current is sent to the microcontroller through the corresponding interfaced sensors. A modified buck–boost converter is used as an MPPT controller between the PV panel and battery. The load is connected to the battery. To monitor the system activities, a liquid crystal display (LCD) is connected to the microcontroller. As mentioned before, an IoT communication module is used for the remote monitoring system. In this project, a Bluetooth device is used as an IoT interface communication module, while other modules, such as the global system for mobile (GSM) module or Wi-Fi module, can also be used for IoT connection.
Figure 2. (a) P–V curve of a solar PV array on P&O (b) proposed flowchart of P&O algorithm.

Electronics 2020, 9, 1267 5 of 16
Algorithm 1 Proposed P&O algorithm:
State 1: StartState 2: Measure Variables V (k) and I (k)State 3: Estimate power: P (k) = V (k) × I (k)State 4: Call previous power P (k − 1) and voltage V (k − 1)State 5: Estimate the changed power ‘dP’ and changed voltage ‘dV’:
dP = P (k) − P (k − 1) and dV = V (k) − V (k − 1).State 6:
I f , dP = 0Else ∆D = dP × dV > 0
Else ∆D = dP × dV < 0
Then step forward to State 7.
State 7: Return.
Figure 2b illustrates the proposed flowchart of the P&O algorithm. Following State 5, the dPrepresents a small change in power, while the variation of the voltage is denoted by dV. According toFigure 2a, when the voltage is decreased, then, the power of the MPP increases; similarly, the powerof MPP increases when the voltage is increased. This is the core concept behind the P&O algorithm.The algorithm equates the current power reading, Pk, with the previous power reading, Pk−1, after theexecution of each increase in the panel operating voltage. The voltage would increase if the powerraised; otherwise, it shifts the direction or decreases the voltage through the switching duty cycle.Until the MPP is touched, this process will be repeated at each MPP monitoring phase [31].
4. Proposed System Architecture
The proposed system is divided into two sections. One is a simulation section, and another isan experimental setup. In the experimental setup, a modified buck–boost converter is developedand used. Similarly, in the simulation section, a mathematical model of the buck–boost converter isdesigned, and the complete system of the proposed design is simulated.
The principal structure of the prototype hardware is presented by a block diagram shown inFigure 3. To achieve the highest energy productivity, the solar PV panel must work at MPP. The completeprototype of the proposed charge controller is shown in Figure 4. The input power source is the 85 WPV module. The state of the input voltage and current is sent to the microcontroller through thecorresponding interfaced sensors. A modified buck–boost converter is used as an MPPT controllerbetween the PV panel and battery. The load is connected to the battery. To monitor the systemactivities, a liquid crystal display (LCD) is connected to the microcontroller. As mentioned before,an IoT communication module is used for the remote monitoring system. In this project, a Bluetoothdevice is used as an IoT interface communication module, while other modules, such as the globalsystem for mobile (GSM) module or Wi-Fi module, can also be used for IoT connection.Electronics 2020, 9, x FOR PEER REVIEW 6 of 16
Figure 3. Proposed block diagram of the MPPT solar charge controller (SCC).
Figure 4. The complete prototype of the proposed charge controller.
The proposed buck–boost converter is selected and found from different configurations of the DC–DC converter reviewed to date [41]. A boost converter is a converter in which output must be equivalent to or larger than the input voltage.
According to Figure 5, when the switch is ON, the input voltage passes through the inductor. Therefore, the inductor voltage in this stage is 𝑉 = 𝑉 . When the switch is OFF, the diode becomes forward biased and the output voltage will be 𝑉 = 𝑉 + 𝑉 . In steady-state conditions, the total energy stored in the inductor will be equal to the released energy when the switch is closed. The boost converter output voltage, value of an inductor, and the capacitor can be measured by the following equations: 𝑉 = 𝑉1 − 𝐷 (3)
𝐿 = 𝑉 × 𝐷∆𝐼 × 𝑓 (4)
𝐶 = 𝐼 × 𝐷∆𝑉 × 𝑓 (5)
Figure 3. Proposed block diagram of the MPPT solar charge controller (SCC).

Electronics 2020, 9, 1267 6 of 16
Electronics 2020, 9, x FOR PEER REVIEW 6 of 16
Figure 3. Proposed block diagram of the MPPT solar charge controller (SCC).
Figure 4. The complete prototype of the proposed charge controller.
The proposed buck–boost converter is selected and found from different configurations of the DC–DC converter reviewed to date [41]. A boost converter is a converter in which output must be equivalent to or larger than the input voltage.
According to Figure 5, when the switch is ON, the input voltage passes through the inductor. Therefore, the inductor voltage in this stage is 𝑉 = 𝑉 . When the switch is OFF, the diode becomes forward biased and the output voltage will be 𝑉 = 𝑉 + 𝑉 . In steady-state conditions, the total energy stored in the inductor will be equal to the released energy when the switch is closed. The boost converter output voltage, value of an inductor, and the capacitor can be measured by the following equations: 𝑉 = 𝑉1 − 𝐷 (3)
𝐿 = 𝑉 × 𝐷∆𝐼 × 𝑓 (4)
𝐶 = 𝐼 × 𝐷∆𝑉 × 𝑓 (5)
Figure 4. The complete prototype of the proposed charge controller.
The proposed buck–boost converter is selected and found from different configurations of theDC–DC converter reviewed to date [41]. A boost converter is a converter in which output must beequivalent to or larger than the input voltage.
According to Figure 5, when the switch is ON, the input voltage passes through the inductor.Therefore, the inductor voltage in this stage is Vin = VL. When the switch is OFF, the diodebecomes forward biased and the output voltage will be Vout = Vin + VL. In steady-state conditions,the total energy stored in the inductor will be equal to the released energy when the switch is closed.The boost converter output voltage, value of an inductor, and the capacitor can be measured by thefollowing equations:
Vout =Vin
1−D(3)
L =Vin ×D∆IL × f
(4)
C =Iout ×D
∆Vout × f(5)
A buck converter is a DC-DC converter where the voltage of output is always smaller than thevoltage of input. The output of the buck converter, V0ut, the value of an inductor, L, and value of thecapacitor, C, can be measured by the following equations:
V0ut = Vin ×D (6)
L =VOut × (1−D)
∆iL × f(7)
C =(1−D)
8L(
∆VoutVout
)× f 2
(8)
Here, the duty cycle ratio is denoted by D, f is the frequency, ∆IL is the inductor current, and ∆Vout
is the peak to peak ripple voltage of the output.

Electronics 2020, 9, 1267 7 of 16
Electronics 2020, 9, x FOR PEER REVIEW 7 of 16
A buck converter is a DC-DC converter where the voltage of output is always smaller than the voltage of input. The output of the buck converter, 𝑉 , the value of an inductor, L, and value of the capacitor, C, can be measured by the following equations: 𝑉 = 𝑉 × 𝐷 (6)
𝐿 = 𝑉 × 1 − 𝐷∆𝑖 × 𝑓 (7)
𝐶 = 1 − 𝐷8𝐿 ∆𝑉𝑉 × 𝑓 (8)
Here, the duty cycle ratio is denoted by D, f is the frequency, ∆𝐼 is the inductor current, and ∆𝑉 is the peak to peak ripple voltage of the output.
Figure 5. Proposed buck–boost converter.
In this work, a modified buck–boost converter is proposed, which is shown in Figure 5. A metal-oxide semiconductor field-effect transistor (MOSFET) is replaced instead of a traditional switch. MOSFET is a switching device that facilitated the reduction in the measurable amount of voltage drop in diodes. When the MOSFET is in ON mode, then, the current flows through the circuit and inductor stores the energy. When the MOSFET is in OFF mode, then, the diode is ON and the inductor releases the stored energy [42].
5. Simulation Setup and Results
Function block parameters are shown in Table 1 to develop the subsystem mask of the SM-85KSM PV module. The ideal factor (IF) of 1.3, open circuit voltage (VOC) of 19.7 V, short circuit current (ISC) of 5.9 A, short circuit current temperature coefficient (TC) of 0.003, 36 cells in series, 1 cell in parallel and the reference temperature of 298 K are used.
Table 1. Functional block parameters of the SM-85KSM PV module.
IF (uL) VOC (V) ISC (A) TC of ISC (uL) NS (uL) NP (uL) T (K) 1.3 19.7 V 5.9 A 0.003 36 1 298 K
* unitless (uL).
Figure 6a,b present the I–V and the P–V characteristics curve of the proposed PV module model, respectively, in different solar irradiances at 25 °C constant temperature. The lowest irradiance is 200 W/m2, and in this state, the PV panel produces the lowest power. The highest irradiance is 1000 W/m2, and in this state, PV panel generates the highest power.
Figure 5. Proposed buck–boost converter.
In this work, a modified buck–boost converter is proposed, which is shown in Figure 5. A metal-oxide semiconductor field-effect transistor (MOSFET) is replaced instead of a traditional switch.MOSFET is a switching device that facilitated the reduction in the measurable amount of voltage dropin diodes. When the MOSFET is in ON mode, then, the current flows through the circuit and inductorstores the energy. When the MOSFET is in OFF mode, then, the diode is ON and the inductor releasesthe stored energy [42].
5. Simulation Setup and Results
Function block parameters are shown in Table 1 to develop the subsystem mask of the SM-85KSMPV module. The ideal factor (IF) of 1.3, open circuit voltage (VOC) of 19.7 V, short circuit current (ISC)of 5.9 A, short circuit current temperature coefficient (TC) of 0.003, 36 cells in series, 1 cell in paralleland the reference temperature of 298 K are used.
Table 1. Functional block parameters of the SM-85KSM PV module.
IF (uL) VOC (V) ISC (A) TC of ISC (uL) NS (uL) NP (uL) T (K)
1.3 19.7 V 5.9 A 0.003 36 1 298 K
unitless (uL).
Figure 6a,b present the I–V and the P–V characteristics curve of the proposed PV module model,respectively, in different solar irradiances at 25 ◦C constant temperature. The lowest irradiance is200 W/m2, and in this state, the PV panel produces the lowest power. The highest irradiance is1000 W/m2, and in this state, PV panel generates the highest power.
Figure 7 shows the proposed mathematical model for the buck–boost converter, which is simulatedin MATLAB/SIMULINK. Repeating the sequence and duty cycle generates pulses and connected to theMOSFETs, gain as a switching signal.

Electronics 2020, 9, 1267 8 of 16Electronics 2020, 9, x FOR PEER REVIEW 8 of 16
Figure 6. Characteristics curve of the proposed SM-85KSM PV module for different solar irradiance at 25 °C. (a) I–V (current–voltage) curve (b) P–V (power–voltage) curve.
Figure 7 shows the proposed mathematical model for the buck–boost converter, which is simulated in MATLAB/SIMULINK. Repeating the sequence and duty cycle generates pulses and connected to the MOSFETs, gain as a switching signal.
Figure 7. Simulation diagram of buck–boost converter.
The output of the buck–boost converter is shown in Figure 8 in three individual plots. The first plot shows the output voltage of the converter. The output voltage is unstable in the time of 0 to 0.1 s and the maximum voltage in this time range is 17.1 V. The output starts to stabilize from 0.1 s and is immediately stable with the voltage of 16 V. The second plot shows the output current of the converter where the maximum current is higher than 3.5 A in the 0 to 0.1 s. Later, from 0.1 s, the current stabilizes with the constant current of 2.20 A. The third plot is the battery charging state at 13.5 V.
Figure 6. Characteristics curve of the proposed SM-85KSM PV module for different solar irradiance at25 ◦C. (a) I–V (current–voltage) curve (b) P–V (power–voltage) curve.
Electronics 2020, 9, x FOR PEER REVIEW 8 of 16
Figure 6. Characteristics curve of the proposed SM-85KSM PV module for different solar irradiance at 25 °C. (a) I–V (current–voltage) curve (b) P–V (power–voltage) curve.
Figure 7 shows the proposed mathematical model for the buck–boost converter, which is simulated in MATLAB/SIMULINK. Repeating the sequence and duty cycle generates pulses and connected to the MOSFETs, gain as a switching signal.
Figure 7. Simulation diagram of buck–boost converter.
The output of the buck–boost converter is shown in Figure 8 in three individual plots. The first plot shows the output voltage of the converter. The output voltage is unstable in the time of 0 to 0.1 s and the maximum voltage in this time range is 17.1 V. The output starts to stabilize from 0.1 s and is immediately stable with the voltage of 16 V. The second plot shows the output current of the converter where the maximum current is higher than 3.5 A in the 0 to 0.1 s. Later, from 0.1 s, the current stabilizes with the constant current of 2.20 A. The third plot is the battery charging state at 13.5 V.
Figure 7. Simulation diagram of buck–boost converter.
The output of the buck–boost converter is shown in Figure 8 in three individual plots. The firstplot shows the output voltage of the converter. The output voltage is unstable in the time of 0 to 0.1 sand the maximum voltage in this time range is 17.1 V. The output starts to stabilize from 0.1 s and isimmediately stable with the voltage of 16 V. The second plot shows the output current of the converterwhere the maximum current is higher than 3.5 A in the 0 to 0.1 s. Later, from 0.1 s, the current stabilizeswith the constant current of 2.20 A. The third plot is the battery charging state at 13.5 V.
The proposed SIMULINK model of the MPPT solar charge controller is shown in Figure 9. A PVmodule of SM-85KSM, the buck–boost converter, which is sub-masked of a 12 V, 100 Ah lead-acidbattery, MPPT block, makes the complete system operable standalone PV system.

Electronics 2020, 9, 1267 9 of 16
Electronics 2020, 9, x FOR PEER REVIEW 9 of 16
Figure 8. Simulation output of the buck–boost converter.
The proposed SIMULINK model of the MPPT solar charge controller is shown in Figure 9. A PV module of SM-85KSM, the buck–boost converter, which is sub-masked of a 12 V, 100 Ah lead-acid battery, MPPT block, makes the complete system operable standalone PV system.
The maximum solar irradiance (G) of 1000 W/m2 and temperature (T) of 298 K are used. Figure 10 presents the simulation results, where four scope blocks are connected to the output of them. The scope shows the converter input voltage (V_Input) in the first plot, input current (I_Input) in the second plot, output power (P_Output) in the third plot, and the output current (I_Output) in the fourth plot.
Figure 9. Proposed MPPT solar charge controller in MATLAB/SIMULINK.
Figure 8. Simulation output of the buck–boost converter.
Electronics 2020, 9, x FOR PEER REVIEW 9 of 16
Figure 8. Simulation output of the buck–boost converter.
The proposed SIMULINK model of the MPPT solar charge controller is shown in Figure 9. A PV module of SM-85KSM, the buck–boost converter, which is sub-masked of a 12 V, 100 Ah lead-acid battery, MPPT block, makes the complete system operable standalone PV system.
The maximum solar irradiance (G) of 1000 W/m2 and temperature (T) of 298 K are used. Figure 10 presents the simulation results, where four scope blocks are connected to the output of them. The scope shows the converter input voltage (V_Input) in the first plot, input current (I_Input) in the second plot, output power (P_Output) in the third plot, and the output current (I_Output) in the fourth plot.
Figure 9. Proposed MPPT solar charge controller in MATLAB/SIMULINK. Figure 9. Proposed MPPT solar charge controller in MATLAB/SIMULINK.
The maximum solar irradiance (G) of 1000 W/m2 and temperature (T) of 298 K are used. Figure 10presents the simulation results, where four scope blocks are connected to the output of them. The scopeshows the converter input voltage (V_Input) in the first plot, input current (I_Input) in the second plot,output power (P_Output) in the third plot, and the output current (I_Output) in the fourth plot.

Electronics 2020, 9, 1267 10 of 16
Electronics 2020, 9, x FOR PEER REVIEW 10 of 16
Figure 10. Simulation results of the proposed charge controller.
6. Experimental Setup and Results
A real-time experiment is carried out to validate the simulation results. The experimental setup for the validation of the designed solar charge controller is shown in Figure 11a–b. Figure 11a shows the PV panel on the rooftop, model number SM-85KSM from KYOCERA, Japan. Figure 11b shows the complete laboratory setup with the battery and solar testbed. A 12 V, 100 Ah lead-acid battery from HAMKO is used for energy storage. The output power of the PV module is stored in the battery through the solar charge controller; the controller operation is tested by the digital oscilloscope—the brand name is GWINSTEK and the model number is GDS-2204A. The incoming voltage, current as well as the battery condition are directly displayed by the analog meter board.
Figure 10. Simulation results of the proposed charge controller.
6. Experimental Setup and Results
A real-time experiment is carried out to validate the simulation results. The experimental setupfor the validation of the designed solar charge controller is shown in Figure 11a,b. Figure 11a showsthe PV panel on the rooftop, model number SM-85KSM from KYOCERA, Japan. Figure 11b showsthe complete laboratory setup with the battery and solar testbed. A 12 V, 100 Ah lead-acid batteryfrom HAMKO is used for energy storage. The output power of the PV module is stored in the batterythrough the solar charge controller; the controller operation is tested by the digital oscilloscope—thebrand name is GWINSTEK and the model number is GDS-2204A. The incoming voltage, current aswell as the battery condition are directly displayed by the analog meter board.
Figure 12a shows the PV output voltage (Channel 1, red color) and the converted voltage(Channel 2, blue color) of the buck–boost converter from the oscilloscope in a single plot with respect to10 µs time. The PV voltage is almost 16 V, which is over the range to charge the battery, so the converterreduces the voltage to 13 V, as the highest required voltage to charge a lead-acid battery is 14.4 Vwithout damaging the battery. The converter output voltage, duty cycle and the battery charging stateis shown in Figure 12b, as the channel 1 (blue color), channel 2 (red color) and channel 3 (green color),respectively, in a single plot. The plot is taken in 10 µs timeframes and the zoomed portion observedat 2 µs timeframes. The converter voltage in blue color is shown in the first plot, the duty cycle ispresented in the second plot in red color, and the third plot is the battery charging state in green color.The on-time of the duty cycle is 98% and the rest 2% of the duty cycle is shown on the right side of thesecond plot in the zoomed version. The effect of the rest 2% duty cycle on the battery charging state isalso shown on the right side of the third plot as a zoomed version. Both the zoomed signal is in 2 µstime range.

Electronics 2020, 9, 1267 11 of 16Electronics 2020, 9, x FOR PEER REVIEW 11 of 16
Figure 11. Experimental setup of the complete system: (a) PV module on the rooftop, and (b) laboratory setup (inset) with battery (bottom-right corner) and metering board (top-right corner).
Figure 12a shows the PV output voltage (Channel 1, red color) and the converted voltage (Channel 2, blue color) of the buck–boost converter from the oscilloscope in a single plot with respect to 10 µs time. The PV voltage is almost 16 V, which is over the range to charge the battery, so the converter reduces the voltage to 13 V, as the highest required voltage to charge a lead-acid battery is 14.4 V without damaging the battery. The converter output voltage, duty cycle and the battery charging state is shown in Figure 12b, as the channel 1 (blue color), channel 2 (red color) and channel 3 (green color), respectively, in a single plot. The plot is taken in 10 µs timeframes and the zoomed portion observed at 2 µs timeframes. The converter voltage in blue color is shown in the first plot, the duty cycle is presented in the second plot in red color, and the third plot is the battery charging state in green color. The on-time of the duty cycle is 98% and the rest 2% of the duty cycle is shown on the right side of the second plot in the zoomed version. The effect of the rest 2% duty cycle on the battery charging state is also shown on the right side of the third plot as a zoomed version. Both the zoomed signal is in 2 µs time range.
Figure 11. Experimental setup of the complete system: (a) PV module on the rooftop, and (b) laboratorysetup (inset) with battery (bottom-right corner) and metering board (top-right corner).Electronics 2020, 9, x FOR PEER REVIEW 12 of 16
Figure 12. (a) The output waveform of the buck–boost converter from the oscilloscope, (b) output plot from the oscilloscope.
The crucial data, such as related PV panel and batteries system voltages, currents, temperatures, input and output power of the charge controller, state of charge of batteries, etc., are collected through IoT-enabled sensors of the charge controller and transferred to the webserver or other resources using the IoT concept. These data then will be available from a smartphone or webpage, as shown in Figure 13a. In this project, the logged data are transferred to an online service named “Byte stream mode”. This enables the users to monitor the charge controller from the remote area. This device is also compatible with the GSM and Bluetooth modules to directly send warning messages during abnormal situations such as the high temperature of the batteries, etc., to the cellphone. Figure 13b shows the function of the external device charging unit through the universal serial bus (USB) port. A smartphone is charging through the USB port, while the charge state of the battery is 45%. Incoming PV voltage is 20.7 V, manually measured by the digital multimeter. This USB port is enabled to charge any electronic device without any charger.
(a) (b)
Figure 13. (a) System monitoring by smartphone through IoT, (b) external device charging unit.
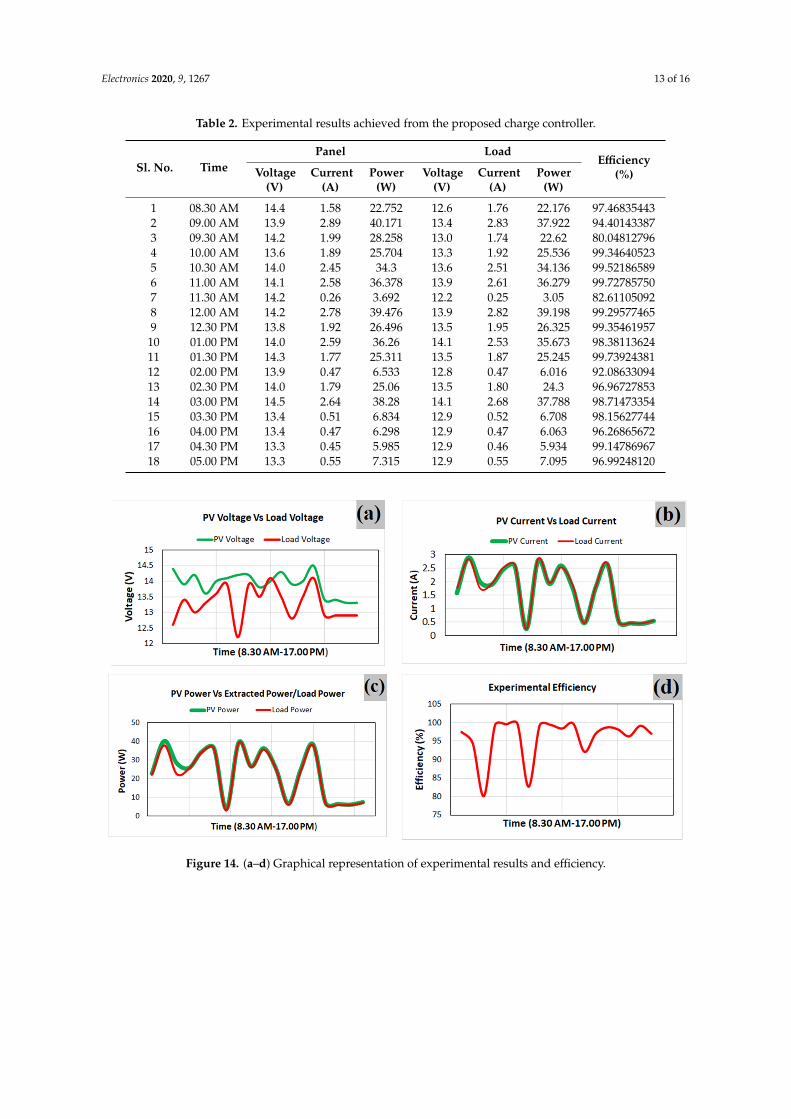
The experimental results of the proposed MPPT solar charge controller are shown in Table 2. The experimental values are taken at the times of 8.30 a.m. to 5.00 p.m. After 30 min average interval, the results are recorded manually as well as compared with the value of LCD. The highest efficiency, 99.73924381~99.74, is recorded at 1.30 p.m., where the PV power is 25.311 W and the extracted power by the system to the load is 25.245 W. This proves that the MPPT technique to extract the maximum
Figure 12. (a) The output waveform of the buck–boost converter from the oscilloscope, (b) output plotfrom the oscilloscope.

Electronics 2020, 9, 1267 12 of 16
The crucial data, such as related PV panel and batteries system voltages, currents, temperatures,input and output power of the charge controller, state of charge of batteries, etc., are collected throughIoT-enabled sensors of the charge controller and transferred to the webserver or other resources usingthe IoT concept. These data then will be available from a smartphone or webpage, as shown inFigure 13a. In this project, the logged data are transferred to an online service named “Byte streammode”. This enables the users to monitor the charge controller from the remote area. This deviceis also compatible with the GSM and Bluetooth modules to directly send warning messages duringabnormal situations such as the high temperature of the batteries, etc., to the cellphone. Figure 13bshows the function of the external device charging unit through the universal serial bus (USB) port.A smartphone is charging through the USB port, while the charge state of the battery is 45%. IncomingPV voltage is 20.7 V, manually measured by the digital multimeter. This USB port is enabled to chargeany electronic device without any charger.
Electronics 2020, 9, x FOR PEER REVIEW 12 of 17
Figure 12. (a) The output waveform of the buck–boost converter from the oscilloscope, (b) output plot from the oscilloscope.
The crucial data, such as related PV panel and batteries system voltages, currents, temperatures, input and output power of the charge controller, state of charge of batteries, etc., are collected through IoT-enabled sensors of the charge controller and transferred to the webserver or other resources using the IoT concept. These data then will be available from a smartphone or webpage, as shown in Figure 13a. In this project, the logged data are transferred to an online service named “Byte stream mode”. This enables the users to monitor the charge controller from the remote area. This device is also compatible with the GSM and Bluetooth modules to directly send warning messages during abnormal situations such as the high temperature of the batteries, etc., to the cellphone. Figure 13b shows the function of the external device charging unit through the universal serial bus (USB) port. A smartphone is charging through the USB port, while the charge state of the battery is 45%. Incoming PV voltage is 20.7 V, manually measured by the digital multimeter. This USB port is enabled to charge any electronic device without any charger.
(a) (b)
Figure 13. (a) System monitoring by smartphone through IoT, (b) external device charging unit.
The experimental results of the proposed MPPT solar charge controller are shown in Table 2.The experimental values are taken at the times of 8.30 a.m. to 5.00 p.m. After 30 min average interval,the results are recorded manually as well as compared with the value of LCD. The highest efficiency,99.73924381~99.74, is recorded at 1.30 p.m., where the PV power is 25.311 W and the extracted powerby the system to the load is 25.245 W. This proves that the MPPT technique to extract the maximumpower from the PV panel is working efficiently. Figure 14a–d depicts the value of (a) PV and loadvoltage, (b) PV and load current, (c) PV and load power, and (e) efficiency graphically. Equation (9) isused to determine the charge controller efficiency (η).
η =Pout
Pin× 100% (9)
where, Pout = output power and Pin = input power.From the obtained results, the comparative analysis of different MPPT techniques efficiency is
shown in Table 3.
Electronics 2020, 9, 1267 13 of 16
Table 2. Experimental results achieved from the proposed charge controller.
Sl. No. TimePanel Load
Efficiency(%)Voltage
(V)Current
(A)Power
(W)Voltage
(V)Current
(A)Power
(W)
1 08.30 AM 14.4 1.58 22.752 12.6 1.76 22.176 97.468354432 09.00 AM 13.9 2.89 40.171 13.4 2.83 37.922 94.401433873 09.30 AM 14.2 1.99 28.258 13.0 1.74 22.62 80.048127964 10.00 AM 13.6 1.89 25.704 13.3 1.92 25.536 99.346405235 10.30 AM 14.0 2.45 34.3 13.6 2.51 34.136 99.521865896 11.00 AM 14.1 2.58 36.378 13.9 2.61 36.279 99.727857507 11.30 AM 14.2 0.26 3.692 12.2 0.25 3.05 82.611050928 12.00 AM 14.2 2.78 39.476 13.9 2.82 39.198 99.295774659 12.30 PM 13.8 1.92 26.496 13.5 1.95 26.325 99.35461957
10 01.00 PM 14.0 2.59 36.26 14.1 2.53 35.673 98.3811362411 01.30 PM 14.3 1.77 25.311 13.5 1.87 25.245 99.7392438112 02.00 PM 13.9 0.47 6.533 12.8 0.47 6.016 92.0863309413 02.30 PM 14.0 1.79 25.06 13.5 1.80 24.3 96.9672785314 03.00 PM 14.5 2.64 38.28 14.1 2.68 37.788 98.7147335415 03.30 PM 13.4 0.51 6.834 12.9 0.52 6.708 98.1562774416 04.00 PM 13.4 0.47 6.298 12.9 0.47 6.063 96.2686567217 04.30 PM 13.3 0.45 5.985 12.9 0.46 5.934 99.1478696718 05.00 PM 13.3 0.55 7.315 12.9 0.55 7.095 96.99248120
Electronics 2020, 9, x FOR PEER REVIEW 13 of 16
power from the PV panel is working efficiently. Figure 14a–d depicts the value of (a) PV and load voltage, (b) PV and load current, (c) PV and load power, and (e) efficiency graphically. Equation (9) is used to determine the charge controller efficiency (η). 𝜂 = 𝑃𝑃 × 100% (9)
where, 𝑃 = 𝑜𝑢𝑡𝑝𝑢𝑡 𝑝𝑜𝑤𝑒𝑟 and 𝑃 = 𝑖𝑛𝑝𝑢𝑡 𝑝𝑜𝑤𝑒𝑟. From the obtained results, the comparative analysis of different MPPT techniques efficiency is
shown in Table 3.
Table 2. Experimental results achieved from the proposed charge controller.
Sl. No.
Time Panel Load Efficiency (%) Voltage
(V) Current
(A) Power
(W) Voltage
(V) Current
(A) Power
(W) 1 08.30 AM 14.4 1.58 22.752 12.6 1.76 22.176 97.46835443 2 09.00 AM 13.9 2.89 40.171 13.4 2.83 37.922 94.40143387 3 09.30 AM 14.2 1.99 28.258 13.0 1.74 22.62 80.04812796 4 10.00 AM 13.6 1.89 25.704 13.3 1.92 25.536 99.34640523 5 10.30 AM 14.0 2.45 34.3 13.6 2.51 34.136 99.52186589 6 11.00 AM 14.1 2.58 36.378 13.9 2.61 36.279 99.72785750 7 11.30 AM 14.2 0.26 3.692 12.2 0.25 3.05 82.61105092 8 12.00 AM 14.2 2.78 39.476 13.9 2.82 39.198 99.29577465 9 12.30 PM 13.8 1.92 26.496 13.5 1.95 26.325 99.35461957 10 01.00 PM 14.0 2.59 36.26 14.1 2.53 35.673 98.38113624 11 01.30 PM 14.3 1.77 25.311 13.5 1.87 25.245 99.73924381 12 02.00 PM 13.9 0.47 6.533 12.8 0.47 6.016 92.08633094 13 02.30 PM 14.0 1.79 25.06 13.5 1.80 24.3 96.96727853 14 03.00 PM 14.5 2.64 38.28 14.1 2.68 37.788 98.71473354 15 03.30 PM 13.4 0.51 6.834 12.9 0.52 6.708 98.15627744 16 04.00 PM 13.4 0.47 6.298 12.9 0.47 6.063 96.26865672 17 04.30 PM 13.3 0.45 5.985 12.9 0.46 5.934 99.14786967 18 05.00 PM 13.3 0.55 7.315 12.9 0.55 7.095 96.99248120
Figure 14. (a–d). Graphical representation of experimental results and efficiency. Figure 14. (a–d) Graphical representation of experimental results and efficiency.

Electronics 2020, 9, 1267 14 of 16
Table 3. Comparative analysis of different MPPT technique efficiency.
References Author’s Name Year Tech. Efficiency RM
[10] Jubaer Ahmed et al. 2015 P&O MPPT 99.20% SI[11] Anil. S. Hiwale et al. 2014 P&O MPPT 87% HI[12] Ankur Bhatt. et al. 2018 P&O MPPT 94.5% SSHI[13] John Macaulay et al. 2018 FLC P&O 0.38% SSHI[36] Tawfik Radjai et al. 2015 P&O MPPT 98% SSHI[38] Dubey et al. 2014 ANN 99% SI[37] Unal Yilmaz et al. 2018 FLC MPPT 94.8–99.4% SI
* Proposed design 2020 P&O MPPT 99.74% SSHI
* SSHI—Software Simulation (SI) and Hardware Implementation (HI), Tech.—Technique, RM—Research Mode.
7. Conclusions
An IoT-equipped MPPT-SCC is designed, implemented, and tested in this paper. The proposedMPPT-SCC consists of a common P&O algorithm with a modified buck–boost converter. To validatethe results, the proposed hardware was first simulated in the MATLAB/SIMULINK platform and then,a prototype device was made and tested for one month. Then, the proposed design was validatedthrough simulation and experimental results. The experimental results show that the proposed SCC hasan acceptable performance and efficiency of around 99.74%. The proposed charge controller is equippedwith an IoT platform that enables us to easily monitor the condition of the SCC remotely. To improvethe performance further, thorough investigation and optimization are necessary. The collected datathrough the IoT platform can be used in smart home applications as training data for machine learning(ML) techniques. ML besides P&O can be incorporated in the future to increase the speed, reduce thefluctuation around the maximum power point, and increase the efficiency further of the device.
Author Contributions: Conceptualization, M.R.; Data curation, M.R.; Formal analysis, M.R.; Funding acquisition,N.A.; Investigation, M.R.; M.S.; and K.S.R.; Methodology, M.R. and M.K.M.; Project administration, N.A.;Resources, M.R.; Software, M.R., and M.K.M.; Supervision, J.P., and N.A.; Validation, M.R., M.S. and K.S.R.;Visualization, M.R. and M.K.M.; Writing—original draft, M.R.; Writing—review and editing, M.R., M.K.M., M.S.,K.S.R., N.A., J.P., F.A.H. and S.K.T. All authors have read and agreed to the published version of the manuscript.
Funding: This research is financially supported by LRGS/1/2019/UKM-UNITEN/6/2 from Ministry of HigherEducation (MoHE), Malaysia as well as BOLD2025 grant code of RJO10517844/069 for partial support and OpexRJO10517919/iRMC/Publication for publication support from Universiti Tenaga Nasional (@UNITEN), Malaysia.
Acknowledgments: The authors wish to thank the Ministry of Higher Education (MoHE), Malaysia for providingthe research grant with the code LRGS/1/2019/UKM-UNITEN/6/2 to support this research. Authors alsoacknowledge the all-out laboratory support of Universiti Tenaga Nasional (@UNITEN), Malaysia, as well as thecontribution in publication support from the BOLD 2025 program under the iRMC of the University. Last but notthe least, the authors are also indebted to Hussain Nyeem for his invaluable assistance in manuscript preparation.
Conflicts of Interest: The authors declare no conflict of interest.
References
1. Vipin Arora, M.; Metelitsa, A. International Energy Outlook 2013; U.S. Energy Information Administration:Washington, DC, USA, 2013; pp. 202–586.
2. International Renewable Energy Agency. Renewable Energy Statistics 2019 Statistiques D Énergie Renouvelable2019 Estadísticas De Energía; International Renewable Energy Agency: Bonn, Germany, 2019.
3. Cheng, P.C.; Peng, B.R.; Liu, Y.H.; Cheng, Y.S.; Huang, J.W. Optimization of a fuzzy-logic-control-basedMPPT algorithm using the particle Swarm optimization technique. Energies 2015, 8, 5338–5360. [CrossRef]
4. Graditi, G.; Adinolfi, G.; Tina, G.M. Photovoltaic optimizer boost converters: Temperature influence andelectro-thermal design. Appl. Energy 2014, 115, 140–150. [CrossRef]
5. Graditi, G.; Adinolfi, G.; Femia, N.; Vitelli, M. Comparative analysis of Synchronous Rectification Boost andDiode Rectification Boost converter for DMPPT applications. In Proceedings of the 2011 IEEE InternationalSymposium on Industrial Electronics, Gdansk, Poland, 27–30 June 2011; pp. 1000–1005.

Electronics 2020, 9, 1267 15 of 16
6. Patel, H.; Agarwal, V.; Member, S. MATLAB-based modeling to study the effects of partial shading on PVarray characteristics. IEEE Trans. Energy Convers. 2008, 23, 302–310. [CrossRef]
7. Karatepe, E.; Boztepe, M.; Colak, M. Development of a suitable model for characterizing photovoltaic arrayswith shaded solar cells. Sol. Energy 2007, 81, 977–992. [CrossRef]
8. Elgendy, M.A.A.; Zahawi, B.; Atkinson, D.J.J. Evaluation of perturb and observe MPPT algorithmimplementation techniques. In Proceedings of the 6th IET International Conference on Power Electronics,Machines and Drives (PEMD 2012), Bristol, UK, 19 July 2012; pp. 110–116.
9. Elgendy, M.A.; Zahawi, B.; Atkinson, D.J. Assessment of perturb and observe MPPT algorithm implementationtechniques for PV pumping applications. IEEE Trans. Sustain. Energy 2012, 3, 21–33. [CrossRef]
10. Ahmed, J.; Salam, Z. An improved perturb and observe (P&O) maximum power point tracking (MPPT)algorithm for higher efficiency. Appl. Energy 2015, 150, 97–108.
11. S Hiwale, D.A.; V Patil, M.; Vinchurkar, H. An Efficient MPPT Solar Charge Controller. Int. J. Adv. Res. Electr.Electron. Instrum. Eng. 2014, 3, 10505–10511.
12. Bhattacharjee, A.; Samanta, H.; Banerjee, N.; Saha, H. Development and validation of a real time flow controlintegrated MPPT charger for solar PV applications of vanadium redox flow battery. Energy Convers. Manag.2018, 171, 1449–1462. [CrossRef]
13. Macaulay, J.; Zhou, Z. A fuzzy logical-based variable step size P&O MPPT algorithm for photovoltaic system.Energies 2018, 11, 1340.
14. Rokonuzzaman, M.; Hossam-E-Haider, M. Design of a Peripheral Interface Controller Based MPPT ChargeController. In Proceedings of the 2nd International Conference on Electrical, Computer & TelecommunicationEngineering (ICECTE), Rajshahi, Bangladesh, 8–10 December 2016; pp. 1–4.
15. Mohanty, S.; Subudhi, B.; Ray, P.K. A grey wolf-assisted perturb & observe MPPT algorithm for a PV system.IEEE Trans. Energy Convers. 2016, 32, 340–347.
16. Tajuddin, M.F.N.; Arif, M.S.; Ayob, S.M.; Salam, Z. Perturbative methods for maximum power point tracking(MPPT) of photovoltaic (PV) systems: A review. Int. J. Energy Res. 2015, 39, 1153–1178. [CrossRef]
17. Sahu, T.P.; Dixit, T.V.; Kumar, R. Simulation and analysis of perturb and observe MPPT algorithm for PVarray using CUK converter. Adv. Electron. Electr. Eng. 2014, 4, 213–224.
18. Elgendy, M.A.; Zahawi, B.; Member, S.; Atkinson, D.J. Assessment of the Incremental Conductance MaximumPower Point Tracking Algorithm. IEEE Trans. Sustain. Energy 2012, 4, 1–10. [CrossRef]
19. Safari, A.; Mekhilef, S. Simulation and hardware implementation of incremental conductance MPPT withdirect control method using cuk converter. IEEE Trans. Ind. Electron. 2010, 58, 1154–1161. [CrossRef]
20. Radjai, T.; Rahmani, L.; Mekhilef, S.; Gaubert, J.P. Implementation of a modified incremental conductanceMPPT algorithm with direct control based on a fuzzy duty cycle change estimator using dSPACE. Sol. Energy2014, 110, 325–337. [CrossRef]
21. Sivakumar, P.; Kader, A.A.; Kaliavaradhan, Y.; Arutchelvi, M. Analysis and enhancement of PV efficiencywith incremental conductance MPPT technique under non-linear loading conditions. Renew. Energy 2015, 81,543–550. [CrossRef]
22. Loukriz, A.; Haddadi, M.; Messalti, S. Simulation and experimental design of a new advanced variablestep size Incremental Conductance MPPT algorithm for PV systems. ISA Trans. 2016, 62, 30–38. [CrossRef][PubMed]
23. Chafle, S.R.; Vaidya, U.B. Incremental conductance MPPT technique FOR PV system. Int. J. Adv. Res. Electr.Electron. Instrum. Eng. 2013, 2, 2720–2726.
24. Abu Eldahab, Y.E.; Saad, N.H.; Zekry, A. Enhancing the maximum power point tracking techniques forphotovoltaic systems. Renew. Sustain. Energy Rev. 2014, 40, 505–514. [CrossRef]
25. Daraban, S.; Petreus, D.; Morel, C. A novel MPPT (maximum power point tracking) algorithm based ona modified genetic algorithm specialized on tracking the global maximum power point in photovoltaicsystems affected by partial shading. Energy 2014, 74, 374–388. [CrossRef]
26. Ranjhitha, G.; Rajkumar, M.V. Implementation of Genetic Algorithm based Maximum Power Point Trackingfor Photovoltaic System. Int. J. Innov. Res. Sci. Eng. Technol. 2016, 5, 18860–18868.
27. Al-Majidi, S.D.; Abbod, M.F.; Al-Raweshidy, H.S. A novel maximum power point tracking technique basedon fuzzy logic for photovoltaic systems. Int. J. Hydrog. Energy 2018, 43, 14158–14171. [CrossRef]
28. Fawzy El-Khatib, M.; Shaaban, S.; Abu El-Sebah, M.I. A proposed advanced maximum power point trackingcontrol for a photovoltaic-solar pump system. Sol. Energy 2017, 158, 321–331. [CrossRef]
Electronics 2020, 9, 1267 16 of 16
29. Roy, R.B.; Basher, E.; Yasmin, R.; Rokonuzzaman, M. Fuzzy logic based MPPT approach in a grid connectedphotovoltaic system. In Proceedings of the 8th International Conference on Software, Knowledge, InformationManagement and Applications (SKIMA), Dhaka, Bangladesh, 18–20 December 2014; Volume 1, pp. 1–6.
30. Singh, A.K.; Hussain, I.; Singh, B. Double-Stage Three-Phase Grid-Integrated Solar PV System with FastZero Attracting Normalized Least Mean Fourth Based Adaptive Control. IEEE Trans. Ind. Electron. 2018, 65,3921–3931. [CrossRef]
31. Rosu-hamzescu, M. An1521 Introduction; Microchip: Chandler, AZ, USA, 2013.32. Pode, R. Battery charging stations for home lighting in Mekong region countries. Renew. Sustain. Energy Rev.
2015, 44, 543–560. [CrossRef]33. Shakeri, M.; Shayestegan, M.; Abunima, H.; Reza, S.M.S.; Akhtaruzzaman, M.; Alamoud, A.R.M.; Sopian, K.;
Amin, N. An intelligent system architecture in home energy management systems (HEMS) for efficientdemand response in smart grid. Energy Build. 2017, 138, 154–164. [CrossRef]
34. Shakeri, M.; Shayestegan, M.; Reza, S.M.S.; Yahya, I.; Bais, B.; Akhtaruzzaman, M.; Sopian, K.; Amin, N.Implementation of a novel home energy management system (HEMS) architecture with solar photovoltaicsystem as supplementary source. Renew. Energy 2018, 125, 108–120. [CrossRef]
35. Microchip. AN236 Home Automation Using the PIC16F877A Author; Microchip: Chandler, AZ, USA, 2010;pp. 1–26.
36. Tawfik, R. Experimental verification of P&O MPPT algorithm with direct control based on Fuzzy logiccontrol using CUK converter. Int. Trans. Electr. Energy Syst. 2015, 25, 3492–3508.
37. Yilmaz, U.; Kircay, A.; Borekci, S. PV system fuzzy logic MPPT method and PI control as a charge controller.Renew. Sustain. Energy Rev. 2018, 81, 994–1001. [CrossRef]
38. Dubey, R. Neural network MPPT control scheme with hysteresis current controlled inverter for photovoltaicsystem. Recent Adv. Eng. Comput. Sci. RAECS 2014, 2014, 6–8.
39. Andreas, D.; Theocharis, E.C.P. Development of a linearized photovoltaic generator model for simulationstudies with electromagnetic transient programs. Int. Trans. Electr. Energy Syst. 2015, 25, 454–470.
40. Alireza, A. Voltage prediction of a photovoltaic module using artificial neural networks. Int. Trans. Electr.Energy Syst. 2014, 24, 1715–1725.
41. Dixit, T.V.; Yadav, A.; Gupta, S. Experimental assessment of maximum power extraction from solar panelwith different converter topologies. Int. Trans. Electr. Energy Syst. 2019, 29, 1–33. [CrossRef]
42. Hart Danial, W. Power Electronics; McGraw.Hill: New York, NY, USA, 2010.
© 2020 by the authors. Licensee MDPI, Basel, Switzerland. This article is an open accessarticle distributed under the terms and conditions of the Creative Commons Attribution(CC BY) license (http://creativecommons.org/licenses/by/4.0/).