ionic conduction in cubic na 3 tip 3 o 9 n, a secondary … conduction in cubic na 3tip 3o 9n, a...
TRANSCRIPT

Ionic Conduction in Cubic Na3TiP3O9N, a Secondary Na-Ion BatteryCathode with Extremely Low Volume ChangeJue Liu,† Donghee Chang,‡ Pamela Whitfield,§ Yuri Janssen,† Xiqian Yu,∥ Yongning Zhou,∥ Jianming Bai,⊥
Jonathan Ko,# Kyung-Wan Nam,∥,⧫ Lijun Wu, Yimei Zhu, Mikhail Feygenson,§ Glenn Amatucci,#
Anton Van der Ven,,‡ Xiao-Qing Yang,∥ and Peter Khalifah*,†,∥
†Department of Chemistry, State University of New York at Stony Brook, Stony Brook, New York 11794-3400, United States‡Department of Materials Science and Engineering, University of Michigan, Ann Arbor, Michigan 48109, United States§Chemical and Engineering Materials Division, Oak Ridge National Laboratory, Oak Ridge, Tennessee 37830, United States∥Department of Chemistry, Brookhaven National Laboratory, Upton, New York 11973, United States⊥Photon Science Division, Brookhaven National Laboratory, Upton, New York 11973, United States#Energy Storage Research Group, Department of Materials Science and Engineering, Rutgers, The State University of New Jersey,671 US Hwy 1, North Brunswick, New Jersey 08902, United StatesMaterials Department, University of California Santa Barbara, Santa Barbara, California 93106, United StatesCondensed Matter Physics and Material Science Department, Brookhaven National Laboratory, Upton, New York 11973, UnitedStates
*S Supporting Information
ABSTRACT: It is demonstrated that Na ions are mobile atroom temperature in the nitridophosphate compoundNa3TiP3O9N, with a diffusion pathway that is calculated tobe fully three-dimensional and isotropic. When used as acathode in Na-ion batteries, Na3TiP3O9N has an averagevoltage of 2.7 V vs Na+/Na and cycles with good reversibilitythrough a mechanism that appears to be a single solid solutionprocess without any intermediate plateaus. X-ray and neutrondiffraction studies as well as first-principles calculationsindicate that the volume change that occurs on Na-ion removal is only about 0.5%, a remarkably small volume change giventhe large ionic radius of Na+. Rietveld refinements indicate that the Na1 site is selectively depopulated during sodium removal.Furthermore, the refined displacement parameters support theoretical predictions that the lowest energy diffusion pathwayincorporates the Na1 and Na3 sites while the Na2 site is relatively inaccessible. The measured room temperature ionicconductivity of Na3TiP3O9N is substantial (4 × 10⁻⁷ S/cm), though both the strong temperature dependence of Na-ion thermalparameters and the observed activation energy of 0.54 eV suggest that much higher ionic conductivities can be achieved withminimal heating. Excellent thermal stability is observed for both pristine Na3TiP3O9N and desodiated Na2TiP3O9N, suggestingthat this phase can serve as a safe Na-ion battery electrode. Moreover, it is expected that further optimization of the general cubicframework of Na3TiP3O9N by chemical substitution will result in thermostable solid state electrolytes with isotropicconductivities that can function at temperatures near or just above room temperature.
1. INTRODUCTION
The rapid growth of the mobile electronic industry has beenfacilitated by the development of high power Li-ion batteries.The development of next-generation batteries which can meetthe demands of the automotive industry and electrical utilitiesmay similarly revolutionize these sectors, though these batteriesmight not use Li+ as the mobile ion. The batteries required forthese emerging industries are very large and thereforenecessitate inexpensive compounds which can still meet desiredperformance metrics of power, safety, and lifetime. There hastherefore been a renewed interest in Na-ion batteries due to thereduced cost and enhanced availability of sodium relative tolithium,1−3 and depending on the needs of the particular
application, the minimum metrics for energy density and rateperformance may be relaxed relative to those of the mobileelectronics industry.Some classic Li-ion battery structures have therefore been
revisited and tested for their ability to serve as Na-ion batteries.For example, secondary batteries based on the Na-ionanalogues of the one-dimensional (1D) Li-ion conductorswith the olivine structure (NaFePO4 or NaFe1/2Mn1/2PO4
instead of LiFePO4) have been developed.4,5 Similarly,
Received: March 30, 2014Revised: April 27, 2014Published: April 30, 2014
Article
pubs.acs.org/cm
© 2014 American Chemical Society 3295 dx.doi.org/10.1021/cm5011218 | Chem. Mater. 2014, 26, 3295−3305

analogues of the very important 2D α-NaFeO2 structure familyof LiCoO2 have also been revisited (NaCrO2, NaVO2,NaNi1/3Mn1/3Co1/3O2, etc.) and were found to supportreversible Na-ion storage.6−14 However, good Na-ion analoguesof the important 3D cubic spinel class of Li-ion batteries havenot yet been found; perhaps the Na-ion battery cathodesystems that come closest to achieving isotropic 3D Na-ionconduction are those based on the NASICON structureframework first developed for superionic conduction applica-tions,15 such as NaTi2(PO4)3
16 and Na3V2(PO4)3.17,18
Although there has been prior work aimed at developing astable cubic stable framework for isotropic fast Na-ionconduction,15 this classic goal has not yet been achieved.There have, however, been a number of interesting recentsuccesses in discovering novel structural frameworks with othersymmetries which do permit sufficiently rapid room temper-ature Na-ion conduction to serve as electrode materials forsecondary Na-ion batteries, resulting in the development ofcompounds l ike NaVPO4F,
19 Na3V2(PO4)2F3,20 ,21
Na2FePO4F,22,23 Na3MnPO4CO3,
24 and Na2FeSO4·2H2O.25
In order to expand the range of available structural familiescapable of transporting mobile ions, we have been motivated toincorporate N3− anions into cathode materials. The use ofnitrogen offers potential advantages in energy density since themass charge ratio of N3− (m/z = 5) is low relative to O2− (m/z= 8) and F− (m/z = 19), though the detailed structure andstoichiometry of nitrogen-containing compounds will deter-mine whether or not the overall capacity will exceed that ofcurrent generation materials. When nitrogen is present in theform of nitridophosphate (PO3N) groups, inductive effectsallow high voltages suitable for cathodes to be realized. Wehave recently demonstrated that the 2:2 cubic nitridophosphateNa2Fe2P3O9N can effectively serve as a Li-ion battery at roomtemperature at voltages above 3 V (vs Li+/Li) after Li-ionexchange with the theoretical capacity of this compound (144mAh/g) mostly realized, though higher temperatures (∼300°C) are necessary to effectively remove Na ions from theframework during the initial ion exchange process due to thelow room temperature mobility of Na in this compound. Thelarge difference in mobility between Na and Li in this Fe-containing framework is correctly predicted by bond valencesum (BVS) maps, which give a threshold of more than 0.5valence units (v.u.) for Na ions, but less than 0.05 v.u. for Liions.26 While the room temperature mobility of Na inNa2Fe2P3O9N is poor, it is worthwhile to ask if higher Namobilities can be achieved by chemical substitutions in the veryintriguing cubic framework of this compound that should beconducive to isotropic Na-ion conduction, and which may beable to effectively serve as a secondary battery cathode or as anisotropic solid state electrolyte, depending on the nature ofcation used to replace Fe. In addition to the 2:2 Na2M
II2P3O9N
compounds with divalent cations, charge balance can also beachieved in 3:1 cubic sodium nitridophosphate compoundswith a trivalent cation resulting in the general formulaNa3M
IIIP3O9N. A variety of redox-active trivalent 3d transitionmetals (M = Ti, V, Cr, etc.) can occupy theMIII site,27−32 givingtheoretical specific gravimetric capacities of 70−215 mAh/g ifone to three Na ions can be cycled electrochemically. Therepresentative Na3TiP3O9N structure is shown in Figure 1.Our simple bond valence sum map calculations suggest that
3:1 Na3TiP3O9N should have much higher Na-ion mobilitythan 2:2 Na2Fe2P3O9N. We demonstrate here the validity ofthis prediction for Na3TiP3O9N through a variety of electro-
chemical, structural, and theoretical experiments which confirmthat there is very good three-dimensional Na-ion mobility atroom temperature in this compound. It is shown thatNa3TiP3O9N can reversibly cycle Na-ions in a manner suitablefor secondary batteries, and that the volume changes on Na-removal are remarkably small (<1%) relative to other knownNa-ion battery systems and offer unique advantages toward thedevelopment of Na-ion systems with extended lifetimes. Due tothe cubic symmetry of this phase, the ionic conductivity ofNa3TiP3O9N is fully isotropic unlike other known classes ofNa-ions conductors such as beta″-aluminas (two-dimensionalNa-ion conductivity)33 or NASICONs (three-dimensional butanisotropic Na-ion conduction)15 and may therefore offerunique advantages as a solid state electrolyte. This general classof cubic nitridophosphate structures will be abbreviated asCUBICONs (CUBic Ionic Conductors), in recognition of theNa+ (and Li+) ion conduction possible within the framework ofthese 3:1 and 2:2 nitridophosphate compounds.
2. EXPERIMENTAL SECTION2.1. Synthesis of Na3TiP3O9N. For a single-step synthesis of
Na3TiP3O9N, NaPO3 (Fisher Scientific, n ∼ 6), and TiO2 (<32 nm,Alfa Aesar, 99.9%) were combined in a molar ratio of 3.05:1 and ballmilled for 120 min in the vibratory ball mill together with 10% (molarratio relative to Ti4+) ascorbic acid. The mixture was then put into anopen-ended fused quartz boat (prepared by cutting open a 15 mmdiameter tube) which was then inserted into a 1 in. diameter fusedquartz tube and heated at 200 °C/h to a reaction temperature of 850°C for 20 h under flowing ammonia gas (50 mL/min). A minor (lessthan 5%) impurity phase of NASICON-type Na3−xTi2(PO4)3 wastypically found in the final product when ascorbic acid was not used inthe reaction.
2.2. Chemical Desodiation. Powder samples obtained from asingle-step solid state synthesis were oxidized with excess 1.0 MNO2BF4 in acetonitrile solution for 10 to 20 h in an Ar filled glovebox.The oxidized products were washed with acetonitrile (three times) andthen acetone (three times) and were finally dried at room temperaturein a glovebox. The color of Na3TiP3O9N powder samples changedfrom violet to gray after 10 h, indicating the partial oxidation of Ti3+,and then to nearly white after 20 h, indicating a Ti4+ valence in thefinal product which resulted from the very nearly complete sampledesodiation.
2.3. Diffraction Studies. Room temperature X-ray diffraction(XRD) data on as-prepared Na3−xTiP3O9N powders were collected ona Bruker D8 Advance diffractometer utilizing Cu Kα radiation from afine focus X-ray tube (Kα1 = 1.54053 Å, Kα2 = 1.54431 Å), with a 300mm working radius and a 1D position-sensitive LynxEye Si detectorwith 192 channels. Synchrotron X-ray diffraction data of powdersamples were collected at beamline X14A of the National SynchrotronLight Source (NSLS) of Brookhaven National Laboratory (BNL) with
Figure 1. (A) Crystal structure of Na3TiP3O9N viewed along the(100) direction, with unit cell boundaries shown in black. (B) Theconnectivity of trimers of PO3N tetrahedra (green) with isolated TiO6octahedra (blue).
Chemistry of Materials Article
dx.doi.org/10.1021/cm5011218 | Chem. Mater. 2014, 26, 3295−33053296

a 1D linear position sensitive detector at a distance of 1433 mm and awavelength of approximately 0.78 Å. Additional synchrotron XRD dataof Na2.5TiNP3O9 were collected at beamline X7B of the NSLS with a2D area detector at a distance of 376 mm with a constant wavelengthof about 0.32 Å. The software Fit2D34 was used to convert the 2Ddiffraction image to a 1D diffraction pattern based on an estimatedbeam polarization of 90%. In situ XRD experiments probing thethermal decomposition of Na3TiP3O9N powders were carried out atbeamline X7B. The powder sample was placed in a 1.5 mm quartzcapillary, and then the whole capillary was mounted on a thick-wireresistive heater which had been calibrated in advance of theexperiment.35 The sample was heated to 850 °C at 2 °C/min, heldat 850 °C for 30 min, and then allowed to naturally cool to roomtemperature. Structures were refined using the Rietveld method asimplemented in the TOPAS software package (Bruker-AXS, version4.2).Time-of-flight (TOF) neutron diffraction experiments were
performed on the NOMAD36 and POWGEN powder diffractometersat the Spallation Neutron Source (SNS), Oak Ridge NationalLaboratory during the 2013-A run cycle (NOMAD) and 2013-B runcycle (POWGEN). For NOMAD experiments, about 100 mg ofpowder was packed in a 3 mm diameter fused quartz capillary, andtypical data acquisition times of 100 min were used. The detectorswere calibrated using scattering from the standard diamond powderprior to the measurements. Neutron powder diffraction data werenormalized against a V rod, and the background was subtracted usingthe specific IDL routines developed for NOMAD instrument,including corrections for coherent scattering from the V rod.POWGEN diffraction data were collected with a center neutronwavelength of 1.333 Å. About 1.5 g of sample were loaded into a 6 mmvanadium can which was inserted into a cryofurnace (JANIS) runningunder a vacuum (pressure less than 10−5 bar during data collection).Powder diffraction data were collected with a typical data acquisitiontime of 3 h. High temperature scans on Na3TiP3O9N were run attemperatures of 300, 400, 500, 595, and 645 K.The neutron diffraction data were refined using the Rietveld
method as implemented in the TOPAS software package (Bruker-AXS, version 4.2). A back-to-back exponential function convolutedwith a split pseudo-Voigt function was used to model the peak shape.No absorption correction was needed for the NOMAD data due to thelow linear absorption coefficient of both the sample (μ = 0.055 cm−1,μR = 0.0165) and the thin, small diameter capillary. For POWGENdata, a cylindrical absorption correction with estimated absorptioncoefficient μR ∼ 0.35 was used.2.4. X-Ray Absorption Spectroscopy. X-ray absorption spec-
troscopy (XAS) data at the Ti K-edge were collected in transmissionmode at beamline X19A of the NSLS synchrotron at BNL. Ti metalfoil was used as a simultaneous reference energy calibrant. The X-rayabsorption near edge structure (XANES) data were processed usingthe ATHENA software package.37
2.5. Electrochemistry. For Na-ion battery testing, electrochemicalcycling against a sodium metal anode was done in a 2032-type coincell. Cathodes were prepared by mixing Na3TiP3O9N powdersobtained from the ascorbic acid assisted method for producing acarbon coating during the synthesis procedure (TGA tests indicatesabout 4 wt% carbon in the powder), carbon black, and PVDF in themass ratio of 8:1:1. Mixing was done either by hand grinding (all datain main paper) or by low energy milling in a vibratory ball mill(additional data in SI), which led to slightly enhanced electrochemicalperformance. Coin cells were assembled in an Ar-filled glovebox usingthickly cut strips of Na metal as the anode and 1 M NaClO4 in 3:7 (bymass) EC/DMC solution as the electrolyte (CAUTION! NaClO4 is astrong oxidizer and can react explosively with easily oxidized organics).The coin cells were tested at room temperature on an Arbin BTU-2000 instrument with a typical current density of 0.014 mA/cm2
corresponding to a C/20 rate, though other rates were alsoinvestigated. Galvanostatic intermittent titration technique (GITT)experiments were carried out on coin cells by first charging for 1 h at aconstant current of 0.014 mA/cm2 and then relaxing for 20 hours and
repeating until the potential reached 3.5 V (on charge) or 1.4 V (onthe subsequent discharge).
Ionic and electronic conductivities were determined using pellets ofNa3TiP3O9N that were synthesized without ascorbic acid (about 12.7mm in diameter, 1.7 mm in thickness, and 85% dense) prepared bycompression under a uniaxial force of 1000 to 4000 kg followed bysintering for 8−16 h at 600 °C under flowing NH3. Gold contacts(∼250 nm thick) were prepared on both sides of the pellet by sputterdeposition (Denton Vacuum). The pellet was loaded into a Swagelok-type electrochemical cell, allowing dc polarization data to be collectedusing Solartron SI1287 and SI1260 instruments. Cells were polarizedat 20 mV for 18 h, allowing a sufficient amount of time for ions to beblocked at the gold contacts, a process followed by monitoring thecurrent decay as a function of time. After polarization the cell was leftat an open circuit for 12 h, and the voltage decay was used to monitorthe relaxation of the cell. Alternating current (ac) impedancemeasurements were also taken before and after polarization to checkfor consistency in conductivity calculations and to identify any changesin the cell resulting from polarization. Cells were scanned from 2 MHzto 100 mHz with a 20 mV amplitude sweep. For the activation energymeasurements, temperature dependent AC impedance data werecollected using a similar pellet of Na3TiP3O9N (about 12.7 mm indiameter/2.5 mm thick) with contacts made by a thick Ag epoxycoating (∼1 mm) applied to both faces of the pellet. The pellet wasplaced on a gold coated glass slide which was then heated on a hotplate. Temperatures at the top and bottom of the pellet were recordedusing a thermocouple and averaged, with their temperature differencetypically being less than 2 °C. Data was collected both on heating (to185 °C) and cooling (to 75 °C) using scans from 20 Hz to 2 MHz (5mV amplitude) on an Agilent E4980A LCR Meter.
2.6. Electron Microscopy. Scanning electron microscope (SEM)images were collected on a JEOL 7600 SEM operating at 5 kV in a lowvacuum condition to minimize charging effects. Elemental-dispersiveX-ray analysis (EDX) spectra of the as-prepared samples werecollected on a JEOL 7600 SEM operating at 15 kV equipped withan Oxford EDX spectrometer. TEM images and electron diffractionpatterns were recorded at 300 kV in a JEM-3000F transmissionelectron microscope equipped with a field emission gun and a GatanImage Filter spectrometer.
2.7. Thermogravimetric Analysis. Thermogravimetric analysis(TGA) was carried out between 25 and 700 °C on a Q5000IR (TAInstruments) system with a constant flow of oxygen gas (25 mL/min).A 3−4 mg sample was placed on a platinum pan and first stabilized at50 °C for 2 h to remove moisture potentially present in the powders,then heated to 700 °C at 2 °C/min, held at 700 °C for 4 h, and finallycooled down to 25 °C in a symmetrical manner, allowing overall masschanges to be determined without requiring separate corrections forbuoyancy effects when initial and final masses at equal temperatureswere compared.
2.8. Bond Valence Sum Maps. Bond valence sum (BVS) mapswere calculated using a local computer program incorporating routinesfrom the Crystallographic Fortran Modules Library.38 In the BVS mapcalculation, the positions of oxygen and nitrogen were used tocalculate the valence of Na within the unit cell using the softBVparameters provided by Adams.39 Since the soft BVS parameters for Nhave not yet been determined, the nitrogen was given the sameparameters as oxygen ionsa good approximation (hard BVSparameters for N give a valence contribution only 4% different fromO at the same distance) that should have negligible influence on theresults since the N atoms were far from any potential Li or Na site.The absolute valence difference (ΔV) between the calculated bondvalence of Li or Na at each point on a 3D grid within the unit cell andthe ideal valence of 1 was then plotted as an isosurface in VESTA.40
The likely ion diffusion pathways were estimated by increasing ΔV tothe minimal values necessary to connect the mobile cation sites into acontinuous network. Although there is not a simple relationshipbetween valence and free energy, sites with higher valence differencesdo represent sites with higher free energies that require higheractivation energies to access during diffusional processes. Although theBVS method does not include repulsions from neighboring cations,
Chemistry of Materials Article
dx.doi.org/10.1021/cm5011218 | Chem. Mater. 2014, 26, 3295−33053297

this method has been successfully applied to estimate the Li-iondiffusion pathways in LiFePO4 and many other battery materials.41−44
2.9. First-Principles Calculations. First-principles calculationswere performed using the generalized gradient approximation (GGA-PBE) to density functional theory (DFT) and the Hubbard modelextension (GGA+U) as implemented in the Vienna ab initioSimulation package (VASP).45 The effect of the core electrons onthe valence states was treated with the projector augmented wave(PAW) method.46 A plane wave energy cutoff of 600 eV was used. Thek-point sampling within the Brillouin zone was performed with a 3 × 3× 3 mesh for the primitive unit cell (containing a total 68 atoms).Equivalent k-point densities were used for supercells of the primitiveunit cell. All calculations were performed using spin polarization withferromagnetic ordering of the initial magnetic moments. GGA+Ucalculations were performed with the method of Dudarev et al.47 withan effective Coulombic potential of Ueff = U − J (effectively, J = 0).It was found that pure GGA calculations with U = 0 underestimated
the average voltage by more than 1 V, which can be attributed to alarge self-interaction error in GGA for localized electronic states. Incontrast to simple oxides of Ti like TiO2, the cubic structure and theisolated Ti octahedra within it are more likely to localize electronicstates around Ti. By performing a systematic study of the dependenceof the average voltage of the Na3TiN(PO3)3−Na2TiN(PO3)3 couplerelative to a Na metal reference anode on the Hubbard U parameter,we determined that a value of U = 5.0 eV predicts an average voltageof 2.7 V, which is close to the experimentally measured averagevoltage. We used this value of U to further analyze phase stability andthermodynamic properties at room temperature. The energies of fivedifferent Na-vacancy arrangements over the Na1 sites of this structurewere calculated within GGA+U. For each Na-vacancy configurationover the Na1 sites, we enumerated all symmetrically distinct Ti3+/Ti4+
arrangements and used these to initialize the DFT calculations (byinitializing magnetic moments consistent with the particular Ti3+/Ti4+
charge ordering). The lowest energy for each of the Na-vacancyconfigurations was then used to parametrize a cluster expansion48,49 todescribe the variation of the fully relaxed energy with Na-vacancyarrangement. Due to the large distance between neighboring Na1 sites,the cluster expansion Hamiltonian only includes pair, triplet, andquadruplet clusters extending up to the first-nearest neighbor cell.Grand canonical Monte Carlo simulations were applied to the clusterexpansion to predict the equilibrium voltage curve (which is related tonegative of the Na chemical potential). Migration barriers for Na hopsto vacant neighboring sites were calculated with the nudged elasticband method as implemented in VASP using both GGA and GGA+Umethods.
3. RESULTS AND DISCUSSION
3.1. Synthesis and Sodium Ion Removal. Na3TiP3O9Npowders were prepared by a single-step solid state reactionunder flowing ammonia gas similar to the method originallydescribed by Marchand et al.,27 but with the addition ofascorbic acid to minimize or eliminate the amount of nitrogen-free impurities (typically of the NaTi2(PO4)3 NASICON-typestructure) that would otherwise form. Rietveld refinements ofsynchrotron X-ray and time-of-flight (TOF) neutron powderdiffraction data confirmed the space group (P213, #198) andcation stoichiometry (nearly 3:1) expected for this structuretype (details in Figure 2 and subsequent figures and tables inthe Supporting Information). The structure of this compoundconsists of TiO6 octahedra which are linked by trimers of PO3Ntetrahedra that share a central N ion and together form a rigid[P3O9N]
6− polyanion unit, as can be seen in Figure 1.Potentially mobile Na ions are found within open spaces insidethe framework constructed from the TiO6 octahedra andP3O9N tetrahedral trimers. Three different types of sodiumsites are present in this structure, with equal abundances butwith very different coordination environments despite the fact
that all the Na sites are situated on 3-fold rotation axes. Na1 sitsat the center of a NaO6 trigonal prism, Na2 occupies a distortedoctahedron formed by six oxygen atoms, and Na3 is closelycoordinated by three oxygens (2.4 Å) with six more oxygenatoms at much longer distances (3.0 and 3.1 Å) that are at bestweakly bound. The valences of Na1, Na2, and Na3 werecalculated to be 0.67, 1.03, and 0.72, respectively, by hard BVSmethods.50 This suggests that Na ions at Na1 and Na3 sites areweakly bound and should be quite mobile at elevatedtemperatures if a diffusion pathway exists. This weak bondingwas experimentally confirmed by the observation of largesodium thermal displacement values at Na1 and Na3 sites inRietveld refinements, shown in Figure 2 and discussed in moredetail later.The removal of sodium from this structure and the
concomitant oxidation of Ti3+ to Ti4+ could be chemicallydriven by reacting Na3TiP3O9N with NO2BF4 in acetonitrile. Incontrast to Na2Fe2P3O9N (which requires elevated temper-atures of almost 300 °C for the complete removal of Na ions),the essentially complete removal of Na could be accomplishedat room temperature in Na3TiP3O9N, indicating a largeenhancement in Na-ion mobility relative to Na2Fe2P3O9N.
26
The robustness of the Na3TiP3O9N lattice during this processof chemical desodiation is demonstrated by a comparison of thepowder XRD patterns of Na3TiP3O9N, Na2.5TiP3O9N, andNa2TiP3O9N, which exhibit the same cubic structure before andafter Na removal as shown in Figure 3. The (002) peak and(022) peak intensities are particularly sensitive to the changesin Na occupancy. The change in Ti oxidation state during Na-ion removal was reflected both in changes in sample color(violet → gray → white) and in the shifts in the position of theTi K-edge seen in XANES spectra (Figure 3).The stoichiometry of these Na3−xTiP3O9N (0 ≤ x ≤ 1)
samples was more precisely investigated through the Rietveld
Figure 2. Rietveld refinement of Na3TiP3O9N synchrotron XRD data(λ = 0.7788 Å, top) and TOF neutron diffraction data (2θ = 154°bank, bottom) with experimental data in black dots, calculated patternin red, tick marks indicating Bragg reflections in purple, and differencecurves in green.
Chemistry of Materials Article
dx.doi.org/10.1021/cm5011218 | Chem. Mater. 2014, 26, 3295−33053298

refinement of high resolution synchrotron (x = 0, 0.5, 1.0) andtime-of-flight neutron (x = 0, 1) diffraction data. The fullobserved and modeled spectra, data collection parameters,atomic site information, and relevant bond distances areprovided in the Supporting Information (Figures S1 to S5,Tables S1 to S7) and will be discussed in more detail when thecycling mechanism of this system is discussed. From these, it isfound that the Na1 site is depopulated during the chemicaldesodiation process. First-principles density functional theorycalculations done both within the generalized gradientapproximations (GGA) and with a Hubbard model extension(GGA+U) similarly found that Na vacancies are most stable atthe Na1 site. Placing the vacancies in the other sodium sitesincreases the energy by 210 meV (Na2) or 180 meV (Na3) performula unit, as can be seen in Figure S6.An intriguing feature of the Na3−xTiP3O9N X-ray diffraction
patterns is the nearly imperceptible shifts in peak positionsduring the desodiation process. A Le Bail fitting of laboratoryXRD lattice parameters shows a volume change of −0.16% afterdeintercalation of 0.5 Na and −0.54% after deintercalation of1.0 Na (Table 1). This cubic Na-ion framework approaches the
zero volume change observed for the cubic Li anode spinel,Li4/3Ti5/3O4,
51 a remarkable result given that Na ions have anionic volume about 150% larger than Li ions (4.4 vs 2.4 Å3).The observed small volume changes are in good agreementwith theory as GGA+U calculations predict a volume change of−0.6% upon removal of Na from Na3TiP3O9N to form
Na2TiP3O9N (Figure S6). Since the cycling-induced develop-ment of stresses and subsequent cracking can be a major failuremechanism in systems with large volumetric changes, it isexpected that the present system could be very suitable forextended cycling applications if other failure mechanisms (i.e.those associated with surface reactions) in the electrochemicalcell can be identified and eliminated. Small volume changes arealso very desirable for all solid state batteries, which wouldfurther benefit from the isotropic nature of this structure type.
3.2. Na3TiP3O9N As a Na-Ion Battery Cathode. Thecomplete oxidation of Na3TiP3O9N during chemical desodia-tion and the extremely small volume change of the open cubicframework of this phase during this process indicate thatNa3TiP3O9N may be an excellent electrode material for Na-ionbatteries. Indeed, it was determined that Na3TiP3O9N can bevery effectively cycled against a Na metal electrode using anelectrolyte of 1 M NaClO4 in 3:7 EC/DMC with a promisingNa-ion rate performance and reversibility with an averagevoltage of about 2.7 V vs Na+/Na, as shown in Figure 4. At acharge/discharge rate of C/20, a discharge capacity of 67 mAh/g (91% of the theoretical capacity of 74 mAh/g) is achieved inthe first cycle, with discharge capacities stabilizing at 50−60mAh/g over the subsequent 50 cycles, depending on thecharging rate. Unlike many other Na-ion systems, nointermediate plateaus are observed during charge/discharge.This is likely a consequence of the worm-like diffusion channelswithin this material, which lead to a higher degree of screeningof Na+ ions from each other, thus inhibiting the formation ofCoulombically stabilized intermediate phases with differenttypes of Na-ion ordering during charge/discharge cycles. Whilerelatively small polarization was observed in the middle of thecharge/discharge curves, higher polarization was observed nearthe ends of these curves. This is attributed to kinetic limitationsin accessing the center of particles due to limitations in the timescale of ionic or electronic conduction. This assignment isconfirmed by GITT experiments, which clearly demonstratethat the system relaxes to voltages close to the average potentialwhen the system is allowed to fully equilibrate.This is also consistent with the reduction in accessible
capacity when the cycling rate is increased from C/40 to C/5.The typical particle size of Na3TiP3O9N observed in SEMexperiments (Figure 5) and TEM experiments (Figure S7) wason the order of 1−5 μm in diameter and 0.5 μm in theminimum dimension, suggesting that there is an opportunity toimprove the electrochemical performance of this system ifimproved syntheses which reduce the particle size can bedeveloped. The presence of facets on these particles suggeststhat partial melting of precursors may occur during thesynthesis, and that smaller particle sizes cannot be achievedwithout switching to precursors (or reaction conditions) thatpromote higher melting point. Initial efforts to reduce theparticle size using a vibratory mill resulted in improved capacityretention, though XANES spectra indicated that someoxidation was found to occur when this milling was carriedout under an air atmosphere (Figures S8, S9).Since no evidence of a plateau is seen in the GITT data, it is
concluded that the cycling occurs through a solid solutionrather than a two-phase mechanism. The mechanism can befurther explored through density functional theory. The voltageprofile of Na3TiP3O9N was calculated from Monte Carlosimulations performed on a cluster expansion Hamiltoniandescribing the energy of Na-vacancy disorder parametrized byGGA+U total energy calculations. At 0 K, GGA+U calculations
Figure 3. Top: XRD patterns of Na2+xTiP3O9N (x = 0, 0.5, 1.0)phases formed by chemical desodiation. Bottom: Ti K-edge XANESspectra compared to a Ti4+ reference, TiO2.
Table 1. Volume Changes on Desodiation of Na3TiNP3O9N
compound a (Å) V (Å3) ΔV
Na2.96TiP3O9N 9.5219(1) 863.33(1)Na2.47TiP3O9N 9.5170(3) 861.98(7) −0.16%Na2.08TiP3O9N 9.5048(1) 858.69(1) −0.54%
Chemistry of Materials Article
dx.doi.org/10.1021/cm5011218 | Chem. Mater. 2014, 26, 3295−33053299

predict that that there will be ordering of the Na vacancies (onNa1 sites) in partially desodiated samples resulting in a two-phase reaction mechanism at this temperature. However, thisvacancy ordered structure has only slightly positive formationenergies relative to Na2TiP3O9N and Na3TiP3O9N, and as aresult, Monte Carlo simulations predict that solid-solutionbehavior with a slightly sloping voltage profile should be seen atroom temperature (blue dots, Figure 4A), behavior which isindeed observed in experimental GITT measurements.
3.3. Ionic Conductivity Studies. The facile chemicaldesodiation and reversible electrochemical cycling ofNa3TiP3O9N suggests that the ionic conductivity within thisstructural framework may be good. The possibility of achievinghigh Na+ ion conductivity within an isotropic cubic frameworkis especially intriguing, as there are not many existing materialswith this combination of properties, though some promisingoxide and oxoanion cubic frameworks have previously beenscreened for this purpose.15 The Na+ mobility within theNa3TiP3O9N CUBICON structure was first studied by dcpolarization measurements on sintered pellets (∼85% dense) ofNa3TiP3O9N with gold blocking electrodes (Figure 6). Thecurrent decayed by more than 98% after relaxation, indicatingthat the ionic conductivity (σI = 4.2 × 10⁻⁷ S/cm) of pristineNa3TiP3O9N far exceeds its electronic conductivity (σe = 6.8 ×10⁻⁹ S/cm) at room temperature. This ionic conductivity isquite substantial, and it is likely that the framework ionicconductivity can be enhanced considerably by the intentionalintroduction of Na vacancies, or by substitutions on thetransition metal site. The electronic conductivity for thiscompound is somewhat low in a manner reminiscent ofphosphate battery electrode materials. During cycling, theelectrical conductivity is expected to somewhat increase relativeto the integer valence pristine material but will likely remain thelimiting factor for cycling rates due to the lack of direct metal−oxygen−metal linkages between transition metal sites.Further insights into the ionic conductivity of Na3TiP3O9N
were obtained from ac impedance measurements (Figure 6).The data at all temperatures were well modeled using anequivalent circuit previously proposed for solids with primarilyionic conductivity (ref 52) and represent an upper limit for thebulk conductivity since the actual sample contains abundantgrain boundaries which may also contributed to the overallconductivity. The fit process is described in more detail in theSupporting Information (Figure S10). The temperaturedependence of conductivity followed a modified Arrheniusform of σT = σ0 exp(−Ea/kBT) with an activation energy of0.54 eV (52 kJ/mol). The total conductivity was found to be2.5 × 10−7 S/cm at 30 °C and 4.0 × 10⁻⁵ S/cm at 163 °C. Thisconductivity is similar to that observed for some NASICON-type NaM2(PO4)3 compounds,
53 though it is about 2 orders ofmagnitude lower than for fully optimized NASICONNa3Zr2PSi2O12.
15 It is expected that the conductivity of theCUBICON framework can be similarly optimized bysubstitution (aliovalent doping to increase the vacancy content,or isovalent doping to tune the size of the diffusion channels).Furthermore, our prior studies on LixFe2P3O9N found that Li issubstantially more mobile than Na within this framework,26
suggesting that Li conductivity in the CUBICON frameworkmay be increased by a few orders of magnitude and mightpotentially permit the observation of Li superionic conduction.Good insights into the potential wells associated with the
three sodium sites in Na3TiP3O9N can be gained from thedisplacement parameters refined using high resolution time-of-
Figure 4. . (A) Electrochemical performance of Na3TiP3O9N cathodescycled against Na metal. The voltage (vs Na+/Na) charge−dischargecurve of Na3TiP3O9N was obtained at C/20. The thermodynamiccharge−discharge curve predicted by DFT calculation is overlaid (bluedotted symbols). (B) GITT curve of Na3TiP3O9N cathode cycledagainst Na metal. (C) Capacity retention of Na3TiP3O9N cathodecycled against Na metal.
Figure 5. SEM image of Na3TiP3O9N particles. Scale bar is 1 μm inlength.
Chemistry of Materials Article
dx.doi.org/10.1021/cm5011218 | Chem. Mater. 2014, 26, 3295−33053300

flight neutron diffraction data (dmin ∼ 0.3 Å) acquired on thePOWGEN diffractometer. The very large room temperaturedisplacement parameters refined for Na1 (Ueq = 0.033 Å2) andNa3 (0.039 Å2) far exceed that of Na2 (0.015 Å2) and the othernonsodium atoms (Figure 7). These displacements are stronglyenhanced by increasing temperature, confirming that theyrepresent dynamic rather than static displacements. Theaverage displacement inferred from these parameters increasesfrom about 0.2 Å at room temperature to 0.3 Å at 650 K. Thisindicates that Na1 and Na3 have very shallow potential wellswhich are conducive to fast ionic diffusion if a suitable diffusionpathway exists.In order to visualize possible diffusion paths for Na ions
within this structure type, bond valence sum (BVS) differencemaps54 were calculated. It is expected that all positions withinthe cell where the absolute value of the valence difference(|ΔV|) between the BVS-calculated valence and the idealvalence of +1 is small represent low free energy positions thatare accessible to Na at modest activation energies. The likely
diffusion paths of Na ions are represented by the |ΔV|isosurfaces shown in Figure 8, which were calculated based onthe refined structures for stoichiometric Na3TiP3O9N (top) anddesodiated Na2TiP3O9N (bottom). The Na1 and Na3 sites ofNa3TiP3O9N first become connected in a continuous networkwhen a very small |ΔV| threshold of 0.03 is chosen, and Na ionsat these two sites are therefore predicted to be mobile and toform an isotropic three-dimensional ion transport network. TheNa2 site requires a much larger threshold of 0.45 valence unitsto be connected, and it is therefore expected to be difficult toaccess these sites at room temperature. A comparison ofthreshold |ΔV| values for network formation of Na3−xTiP3O9Nstructures determined in this work (Table 2) suggests thatsimilar behavior will be observed for structures with differentsodium concentrations, though the barrier for accessing Na2 islowered when Na is partially or fully removed. The relativebarriers to diffusion predicted for the three Na sites are very
Figure 6. (A) Decay of dc current for Na3TiP3O9N polarized at 20mV. (B) Na3TiP3O9N ac impedance spectra and (C) the Arrheniusbehavior of the derived activation energy.
Figure 7. Temperature-dependent displacement parameters for thesodium sites of Na3TiP3O9N from neutron diffraction data.
Figure 8. Na difference bond valence sum (|ΔV|) map of Na3TiP3O9N(top) and Na2TiP3O9N (bottom) drawn with an isosurface level of0.12. The Na1 and Na3 sites (white and blue spheres, respectively) arepredicted to be part of a three-dimensional ion conduction network,while the Na2 sites (purple) are expected to be isolated from thisnetwork.
Chemistry of Materials Article
dx.doi.org/10.1021/cm5011218 | Chem. Mater. 2014, 26, 3295−33053301
consistent with the displacement parameters associated withthese sights, suggesting that the primary barrier to motion inthe diffusional process is directly associated with the potentialwell in the immediate vicinity of the Na atoms.Although BVS maps have been found to be a convenient and
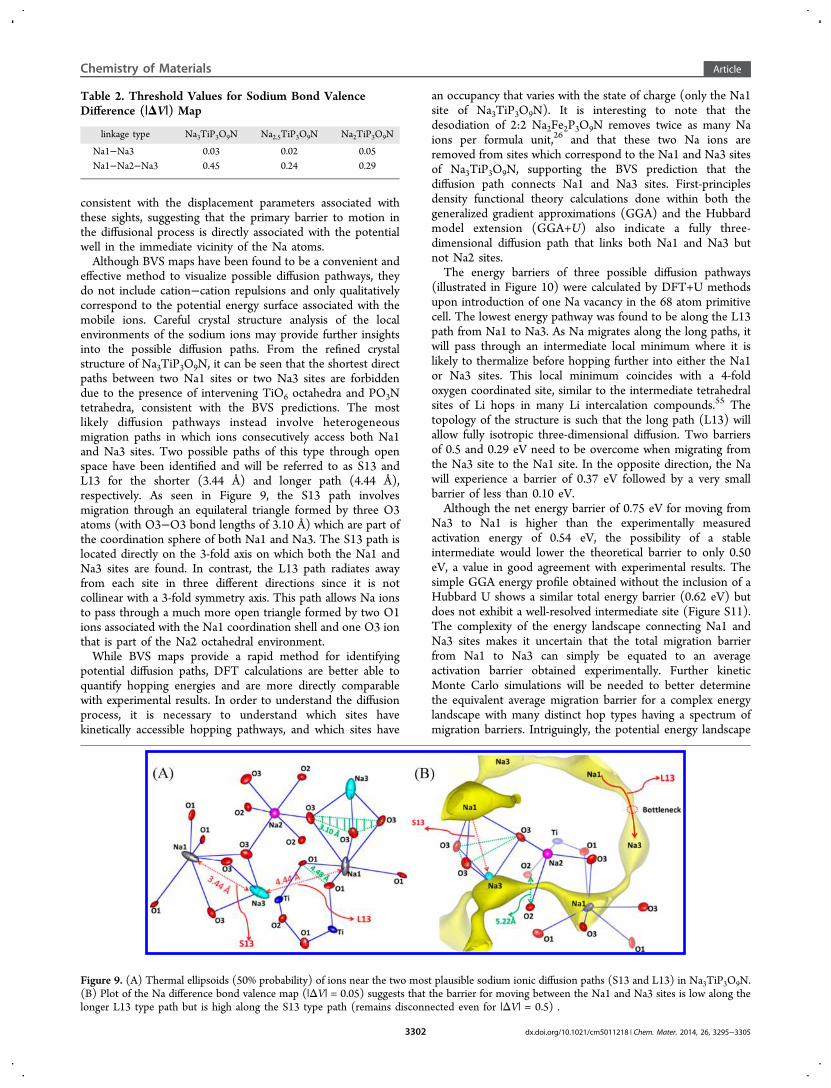
effective method to visualize possible diffusion pathways, theydo not include cation−cation repulsions and only qualitativelycorrespond to the potential energy surface associated with themobile ions. Careful crystal structure analysis of the localenvironments of the sodium ions may provide further insightsinto the possible diffusion paths. From the refined crystalstructure of Na3TiP3O9N, it can be seen that the shortest directpaths between two Na1 sites or two Na3 sites are forbiddendue to the presence of intervening TiO6 octahedra and PO3Ntetrahedra, consistent with the BVS predictions. The mostlikely diffusion pathways instead involve heterogeneousmigration paths in which ions consecutively access both Na1and Na3 sites. Two possible paths of this type through openspace have been identified and will be referred to as S13 andL13 for the shorter (3.44 Å) and longer path (4.44 Å),respectively. As seen in Figure 9, the S13 path involvesmigration through an equilateral triangle formed by three O3atoms (with O3−O3 bond lengths of 3.10 Å) which are part ofthe coordination sphere of both Na1 and Na3. The S13 path islocated directly on the 3-fold axis on which both the Na1 andNa3 sites are found. In contrast, the L13 path radiates awayfrom each site in three different directions since it is notcollinear with a 3-fold symmetry axis. This path allows Na ionsto pass through a much more open triangle formed by two O1ions associated with the Na1 coordination shell and one O3 ionthat is part of the Na2 octahedral environment.While BVS maps provide a rapid method for identifying
potential diffusion paths, DFT calculations are better able toquantify hopping energies and are more directly comparablewith experimental results. In order to understand the diffusionprocess, it is necessary to understand which sites havekinetically accessible hopping pathways, and which sites have
an occupancy that varies with the state of charge (only the Na1site of Na3TiP3O9N). It is interesting to note that thedesodiation of 2:2 Na2Fe2P3O9N removes twice as many Naions per formula unit,26 and that these two Na ions areremoved from sites which correspond to the Na1 and Na3 sitesof Na3TiP3O9N, supporting the BVS prediction that thediffusion path connects Na1 and Na3 sites. First-principlesdensity functional theory calculations done within both thegeneralized gradient approximations (GGA) and the Hubbardmodel extension (GGA+U) also indicate a fully three-dimensional diffusion path that links both Na1 and Na3 butnot Na2 sites.The energy barriers of three possible diffusion pathways
(illustrated in Figure 10) were calculated by DFT+U methodsupon introduction of one Na vacancy in the 68 atom primitivecell. The lowest energy pathway was found to be along the L13path from Na1 to Na3. As Na migrates along the long paths, itwill pass through an intermediate local minimum where it islikely to thermalize before hopping further into either the Na1or Na3 sites. This local minimum coincides with a 4-foldoxygen coordinated site, similar to the intermediate tetrahedralsites of Li hops in many Li intercalation compounds.55 Thetopology of the structure is such that the long path (L13) willallow fully isotropic three-dimensional diffusion. Two barriersof 0.5 and 0.29 eV need to be overcome when migrating fromthe Na3 site to the Na1 site. In the opposite direction, the Nawill experience a barrier of 0.37 eV followed by a very smallbarrier of less than 0.10 eV.Although the net energy barrier of 0.75 eV for moving from
Na3 to Na1 is higher than the experimentally measuredactivation energy of 0.54 eV, the possibility of a stableintermediate would lower the theoretical barrier to only 0.50eV, a value in good agreement with experimental results. Thesimple GGA energy profile obtained without the inclusion of aHubbard U shows a similar total energy barrier (0.62 eV) butdoes not exhibit a well-resolved intermediate site (Figure S11).The complexity of the energy landscape connecting Na1 andNa3 sites makes it uncertain that the total migration barrierfrom Na1 to Na3 can simply be equated to an averageactivation barrier obtained experimentally. Further kineticMonte Carlo simulations will be needed to better determinethe equivalent average migration barrier for a complex energylandscape with many distinct hop types having a spectrum ofmigration barriers. Intriguingly, the potential energy landscape
Table 2. Threshold Values for Sodium Bond ValenceDifference (|ΔV|) Map
linkage type Na3TiP3O9N Na2.5TiP3O9N Na2TiP3O9N
Na1−Na3 0.03 0.02 0.05Na1−Na2−Na3 0.45 0.24 0.29
Figure 9. (A) Thermal ellipsoids (50% probability) of ions near the two most plausible sodium ionic diffusion paths (S13 and L13) in Na3TiP3O9N.(B) Plot of the Na difference bond valence map (|ΔV| = 0.05) suggests that the barrier for moving between the Na1 and Na3 sites is low along thelonger L13 type path but is high along the S13 type path (remains disconnected even for |ΔV| = 0.5) .
Chemistry of Materials Article
dx.doi.org/10.1021/cm5011218 | Chem. Mater. 2014, 26, 3295−33053302

suggests that the overall diffusional barrier could potentially befurther lowered if the Na3 site is destabilized through chemicalsubstitutions (at the sites of nonmobile ions), as a majorcontributor L13 diffusional barrier is the difference in Napotential energy between the Na1 and Na3 sites.Although a shorter S13 diffusion path between the Na1 and
Na3 sites is nominally available, the limiting barrier for thispathway is calculated to be 0.87 eV for Na3 → Na1 hops. Dueto the difference in the Na1 and Na3 site energies, a lowerbarrier of 0.47 is predicted for Na3 → Na1 hops, though thislower barrier is not the limiting one for diffusion through thenetwork of Na1 and Na3 sites. In contrast to the L13 hop, theS13 barrier shows no evidence of an intermediate resting siteand clearly must be overcome in a single hop. The high barrierof 0.87 eV for the S13 path suggests that this pathway isunlikely to be important to ion diffusion in Na3TiP3O9N. Asimilar energy barrier (0.89/0.57 eV) is found for the lowestenergy path for Na migration between the Na1 and Na2 sites,denoted P12. While this barrier is too large for the Na2 site tosignificantly contribute to the overall ionic mobility ofNa3TiP3O9N at room temperature, it is not expected to belarge enough to prevent site exchange at the Na2 site atelevated temperatures. This is experimentally confirmed by ourLi ion-exchange studies, which will be described elsewhere.56
3.4. Thermal Stability of Na3TiP3O9N Framework. Thesafety of battery systems is of significant concern for portableelectronics applications, and may become even more importantin applications which utilize larger battery systems (electricvehicles, grid-scale storage). The thermal stability of cathodematerials has been shown to be a good predictor of stabilityagainst overcharge.57 Although nitride and oxynitride systemscan be susceptible to decomposition by oxygen attack, somesystems like GaN or SIALONs have very good temperaturestability to ∼900 °C.58,59 Furthermore, nitridophosphatesystems have the potential for the loss of inert N2 rather thanreactive O2 loss, potentially mitigating their reactivity withorganic electrolytes. Finally, the fully charged state ofNa3TiP3O9N contains Ti4+, an oxidation state which is veryresistant to oxygen loss (in sharp contrast to tetravalent 3dtransition metals such as Mn, Fe, or Co, which are typicallysusceptible to oxygen loss). Thermogravimetric analyses(TGA) were used to assess the thermal stability ofNa3TiP3O9N by following the mass changes that occurred onheating in an O2 atmosphere (Figure 11). Full decomposition
did not occur until temperatures in excess of 550 °C. The onsetof mass gain begins above 400 °C, although it is not clear ifinitial mass loss is due to framework decomposition (1.5 O2−
ions replace each N3−) or Ti oxidation (Ti3+ oxidized to Ti4+
charge balanced by the gain of 0.5 O2−) as both of theseprocesses involve mass gains. In either case, this mixed anioncompound can be considered to have good oxidative stability ina manner analogous to LiFePO4, which thermally decomposesaround 550 °C.60 When Na3TiP3O9N is fully desodiated toproduce Na2TiP3O9N using a chemical oxidant, this frameworkstill remains stable against oxidation in O2 up to at least 400 °C.In order to get a more direct measure of the framework
stability and the decomposition processes, in situ X-raydiffraction data (Figure 12) were collected at the X7B beamlineof the NSLS synchrotron. Up to 550 °C, the only crystallinephase is Na3TiP3O9N. At 575 °C, peaks appear for a secondcrystalline phase which can be indexed based on theNASICON-type phase NaTi2(PO4)3. Rietveld refinement ofthe last diffraction pattern collected at 200 °C (Figure S12)showed this phase crystallized in space group of R3c with latticeparameters of a = 8.4736(3) and b = 21.9502(10). Theseresults are consistent with our synthetic studies, which alsoshow this NASICON phase as a common impurity whichcannot be converted to Na3TiP3O9N by any amount ofannealing under NH3, suggesting that this is an irreversibletransformation driven by nitrogen loss. The transformation of
Figure 10. (A) Visualization of the three potential diffusion paths evaluated using DFT+U calculations, superimposed on the BVS map ((|ΔV| =0.05, yellow) . The favored L13 path (red, 0.50/0.37 eV) is marked with a solid red arrow, while dashed lines indicate the high barrier pathways S13(black, 0.87/0.50 eV) and P12 (blue, 0.98/0.75 eV). (B) DFT+U energies for points along the short (S13) and long (L13) Na1−Na3 pathways, withenergies evaluated at positions marked by spheres in the left panel.
Figure 11. Thermogravimetric response of pristine Na3TiP3O9N(black) and chemically desodiated Na2TiP3O9N (red) on heating (2°C/min, flowing O2) .
Chemistry of Materials Article
dx.doi.org/10.1021/cm5011218 | Chem. Mater. 2014, 26, 3295−33053303

Na3TiP3O9N to NaTi2(PO4)3 was observed to be complete by725 °C, suggesting that this reaction occurs quickly in thepresent of oxygen.
4. CONCLUSIONS
In conclusion, Na3TiP3O9N is shown to be the first member ofthe CUBICON family of nitridophosphate compounds that caneffectively cycle Na ions reversibly at room temperature. The3D Na-ion conduction pathways, good sodium ionic con-ductivity, extremely small volume changes, high redox potential(0.6 V higher than equivalent Ti4+/Ti3+ redox couple ofNASICON-type Na3Ti2(PO4)3 cathodes), and good thermalstability make this structure type particularly attractive forrechargeable Na-ion battery applications. Although the capacityof Na3TiP3O9N is somewhat limited (74 mAh/g) for practicalcathode applications, this CUBICON framework contains tworeadily mobile Na ions (and three Na ions in total) pertransition metal site, so the theoretical capacity of thisframework can be doubled or even tripled if transition metalssuch as V3+ (V4+, V5+) or Cr3+ (Cr4+, Cr5+, Cr6+) that can accessmore than two oxidation states are substituted for Ti3+. Also,significantly higher voltages are expected when other trivalenttransition metals are substituted for Ti3+. In general, the Li-ionvariants of the CUBICON framework appear to havesubstantially higher ionic conductivities than their Na-ionanalogues, and appropriate chemical substitutions may offer thepossibility of discovering superionic conductivity within thisisotropic cubic frameworkideal behavior for a solid stateelectrolyte.
ASSOCIATED CONTENT
*S Supporting InformationFits and structures obtained from Rietveld refinements, DFTsite energies, SEM and TEM results, XANES measurements,additional cycling data, EIS fitting, Rietveld analysis of thermaldecomposition product. This material is available free of chargevia the Internet at http://pubs.acs.org.
AUTHOR INFORMATION
Corresponding Author*E-mail: [email protected].
Present Address⧫Department of Energy and Materials Engineering, DonggukUniversity-Seoul, Seoul 100-715, Republic of Korea.
NotesThe authors declare no competing financial interest.
ACKNOWLEDGMENTS
Research supported as part of the Northeastern Center forChemical Energy Storage (NECCES), an Energy FrontierResearch Center funded by the U.S. Department of Energy,Office of Basic Energy Sciences under Award DE-SC0001294,including matching support from NYSTAR-NYSDED. Thisresearch utilized the facilities at the Center for FunctionalNanomaterials, Brookhaven National Laboratory, which issupported by the U.S. Department of Energy, Office of BasicEnergy Sciences, under Contract No. DE-AC02-98CH10886.Use of the National Synchrotron Light Source, BrookhavenNational Laboratory, was supported by the U.S. Department ofEnergy, Office of Science, Office of Basic Energy Sciences,under Contract No. DE-AC02-98CH10886. Research con-ducted at ORNL’s Spallation Neutron Source was sponsored bythe Scientific User Facilities Division, Office of Basic EnergySciences, US Department of Energy. M. Dawber and J.Sinsheimer are thanked for use of their instrumentation andguidance in the collection of impedance spectroscopy data. P.K.would like to acknowledge the support and guidance providedby the EFRC directors and Intercalation Thrust Leaders, C. P.Grey and M. S. Whittingham, as well as discussions onoxynitrides with G. Ceder. The authors thank the NSLSbeamline scientists at X7B and X19A for their technicalsupport.
REFERENCES(1) Pan, H. L.; Hu, Y. S.; Chen, L. Q. Energy Environ. Sci. 2013, 6,2338.(2) Palomares, V.; Serras, P.; Villaluenga, I.; Hueso, K. B.; Carretero-Gonzalez, J.; Rojo, T. Energy Environ. Sci. 2012, 5, 5884.(3) Kim, S. W.; Seo, D. H.; Ma, X. H.; Ceder, G.; Kang, K. Adv.Energy Mater. 2012, 2, 710.(4) Braconnier, J. J.; Delmas, C.; Fouassier, C.; Hagenmuller, P.Mater. Res. Bull. 1980, 15, 1797.(5) Delmas, C.; Fouassier, C.; Hagenmuller, P. Physica B+C(Amsterdam) 1980, 99, 81.(6) Braconnier, J. J.; Delmas, C.; Hagenmuller, P. Mater. Res. Bull.1982, 17, 993.(7) Didier, C.; Guignard, M.; Denage, C.; Szajwaj, O.; Ito, S.;Saadoune, I.; Darriet, J.; Delmas, C. Electrochem. Solid-State Lett. 2011,14, A75.(8) Komaba, S.; Takei, C.; Nakayama, T.; Ogata, A.; Yabuuchi, N.Electrochem. Commun. 2010, 12, 355.
Figure 12. (A) In situ XRD data (λ = 0.3196 Å) following the transformation of CUBICON Na3TiP3O9N heated under flowing air. Thermaldecomposition was first observed at 575 °C, and the only decomposed product giving diffraction peaks could be indexed as NASICON-typeNaTi2(PO4)3. (B) Refined phase fractions of CUBICON and NASICON components.
Chemistry of Materials Article
dx.doi.org/10.1021/cm5011218 | Chem. Mater. 2014, 26, 3295−33053304

(9) Zhou, Y. N.; Ding, J. J.; Nam, K. W.; Yu, X. Q.; Bak, S. M.; Hu, E.Y.; Liu, J.; Bai, J. M.; Li, H.; Fu, Z. W.; Yang, X. Q. J. Mater. Chem. A2013, 1, 11130.(10) Caballero, A.; Hernan, L.; Morales, J.; Sanchez, L.; Pena, J. S.;Aranda, M. A. G. J. Mater. Chem. 2002, 12, 1142.(11) Berthelot, R.; Carlier, D.; Delmas, C. Nat. Mater. 2011, 10, 74.(12) Yabuuchi, N.; Kajiyama, M.; Iwatate, J.; Nishikawa, H.; Hitomi,S.; Okuyama, R.; Usui, R.; Yamada, Y.; Komaba, S. Nat. Mater. 2012,11, 512.(13) Moreau, P.; Guyomard, D.; Gaubicher, J.; Boucher, F. Chem.Mater. 2010, 22, 4126.(14) Lee, K. T.; Ramesh, T. N.; Nan, F.; Botton, G.; Nazar, L. F.Chem. Mater. 2011, 23, 3593.(15) Goodenough, J. B.; Hong, H. Y. P.; Kafalas, J. A. Mater. Res. Bull.1976, 11, 203.(16) Delmas, C.; Cherkaoui, F.; Nadiri, A.; Hagenmuller, P. Mater.Res. Bull. 1987, 22, 631.(17) Plashnitsa, L. S.; Kobayashi, E.; Noguchi, Y.; Okada, S.; Yamaki,J. J. Electrochem. Soc. 2010, 157, A536.(18) Jian, Z. L.; Zhao, L.; Pan, H. L.; Hu, Y. S.; Li, H.; Chen, W.;Chen, L. Q. Electrochem. Commun. 2012, 14, 86.(19) Barker, J.; Saidi, M. Y.; Swoyer, J. L. Electrochem. Solid-State Lett.2003, 6, A1.(20) Gover, R.; Bryan, A.; Burns, P.; Barker, J. Solid State Ionics 2006,177, 1495.(21) Chihara, K.; Kitajou, A.; Gocheva, I. D.; Okada, S.; Yamaki, J. J.Power Sources 2013, 227, 80.(22) Ellis, B. L.; Makahnouk, W. R. M.; Makimura, Y.; Toghill, K.;Nazar, L. F. Nat. Mater. 2007, 6, 749.(23) Recham, N.; Chotard, J. N.; Dupont, L.; Djellab, K.; Armand,M.; Tarascon, J. M. J. Electrochem. Soc. 2009, 156, A993.(24) Chen, H. L.; Hao, Q.; Zivkovic, O.; Hautier, G.; Du, L. S.; Tang,Y. Z.; Hu, Y. Y.; Ma, X. H.; Grey, C. P.; Ceder, G. Chem. Mater. 2013,25, 2777.(25) Barpanda, P.; Oyama, G.; Ling, C. D.; Yamada, A. Chem. Mater.2014, 26, 1297.(26) Liu, J.; Yu, X. Q.; Hu, E. Y.; Nam, K. W.; Yang, X. Q.; Khalifah,P. G. Chem. Mater. 2013, 25, 3929.(27) Conanec, R.; Feldmann, W.; Marchand, R.; Laurent, Y. J. SolidState Chem. 1996, 121, 418.(28) Feldmann, W. Z. Chem. (Stuttgart, Ger.) 1987, 27, 182.(29) Feldmann, W. Z. Chem. (Stuttgart, Ger.) 1987, 27, 100.(30) Zatovsky, I. V.; Vorobjova, T. V.; Domasevitch, K. V.;Ogorodnyk, I. V.; Slobodyanik, N. S. Acta Crystallogr., Sect. E: Struct.Rep. Online 2006, 62, 32.(31) Barker, J. U.S. Patent 2008/0187831 A1.(32) Lee, M. S.; Kang, J. K.; Kim, S. J. Bull. Korean Chem. Soc. 2012,33, 2083.(33) Yao, Y. F. Y.; Kummer, J. T. J. Inorg. Nucl. Chem. 1967, 29, 2453.(34) Hammersley, A. P.; Svensson, S. O.; Hanfland, M.; Fitch, A. N.;Hausermann, D. High Pressure Res. 1996, 14, 235.(35) Hu, E.; Bak, S.-M.; Liu, J.; Yu, X.; Zhou, Y.; Ehrlich, S. N.; Yang,X.-Q.; Nam, K.-W. Chem. Mater. 2014, 26, 1108.(36) Neuefeind, J.; Feygenson, M.; Carruth, J.; Hoffmann, R.;Chipley, K. K. Nucl. Instrum. Methods Phys. Res., Sect. B 2012, 287, 68.(37) Ravel, B.; Newville, M. J. Synchrotron Radiat 2005, 12, 537.(38) Rodriguez-Carvajal, J.; Gonzalez-Platas, J. Acta Crystallogr., Sect.A 2002, A58, C87.(39) Adams, S. Acta Crystallogr., Sect. B 2001, 57, 278.(40) Momma, K.; Izumi, F. J. Appl. Crystallogr. 2008, 41, 653.(41) Thangadurai, V.; Adams, S.; Weppner, W. Chem. Mater. 2004,16, 2998.(42) Adams, S. J. Solid State Electrochem. 2010, 14, 1787.(43) Adams, S.; Rao, R. P. Phys. Status Solidi A 2011, 208, 1746.(44) Janssen, Y.; Middlemiss, D. S.; Bo, S. H.; Grey, C. P.; Khalifah,P. G. J. Am. Chem. Soc. 2012, 134, 12516.(45) Kresse, G.; Furthmuller, J. Phys. Rev. B 1996, 54, 11169.(46) Blochl, P. E. Phys. Rev. B 1994, 50, 17953.
(47) Dudarev, S. L.; Botton, G. A.; Savrasov, S. Y.; Humphreys, C. J.;Sutton, A. P. Phys. Rev. B 1998, 57, 1505.(48) Sanchez, J. M.; Ducastelle, F.; Gratias, D. Physica A 1984, 128,334.(49) Van der Ven, A.; Thomas, J. C.; Xu, Q. C.; Swoboda, B.;Morgan, D. Phys. Rev. B 2008, 78.(50) Wood, R. M.; Palenik, G. J. Inorg. Chem. 1999, 38, 3926.(51) Ohzuku, T.; Ueda, A.; Yamamoto, N. J. Electrochem. Soc. 1995,142, 1431.(52) Neudecker, B. J.; Weppner, W. J. Electrochem. Soc. 1996, 143,2198.(53) Aono, H.; Sugimoto, E. J. Am. Ceram. Soc. 1996, 79, 2786.(54) Brown, I. D. Chem. Rev. (Washington, DC, U. S.) 2009, 109,6858.(55) Van der Ven, A.; Bhattacharya, J.; Belak, A. A. Acc. Chem. Res.2013, 46, 1216.(56) Liu, J. et al. Unpublished results.(57) Ong, S. P.; Jain, A.; Hautier, G.; Kang, B.; Ceder, G. Electrochem.Commun. 2010, 12, 427.(58) Reinert, A. A.; Payne, C.; Wang, L. M.; Ciston, J.; Zhu, Y. M.;Khalifah, P. G. Inorg. Chem. 2013, 52, 8389.(59) Hewett, C. L.; Cheng, Y. B.; Muddle, B. C.; Trigg, M. B. J. Eur.Ceram. Soc. 1998, 18, 417.(60) Delacourt, C.; Poizot, P.; Tarascon, J.-M.; Masquelier, C. Nat.Mater. 2005, 4, 254.
Chemistry of Materials Article
dx.doi.org/10.1021/cm5011218 | Chem. Mater. 2014, 26, 3295−33053305

1
Supporting Information
Ionic conduction in cubic Na3TiP3O9N, a secondary Na-ion battery cathode with extremely low volume change
Jue Liu§, Donghee Chang∥, Pamela Whitfield&, Yuri Janssen§, Xiqian Yu†, Yongning Zhou
†, Jianming
Bai#, Jonathan Ko‡, Kyung-Wan Nam†, Lijun Wu⊥, Yimei Zhu⊥, Mikhail Feygenson&, Glenn
Amatucci‡, Anton Van der Ven+,∥, Xiao-Qing Yang†, Peter Khalifah *,
§, †
§ Department of Chemistry, State University of New York at Stony Brook, Stony Brook, United States
∥Department of Materials Science and Engineering, University of Michigan, Ann Arbor, MI, United States &Chemical and Engineering Materials Division, Oak Ridge National Laboratory, Oak Ridge, TN, 37830, United States † Department of Chemistry, Brookhaven National Laboratory, Uptown, NY, United States # Photon Science Division, Brookhaven National Laboratory, Uptown, NY, United States ‡ Energy Storage Research Group, Department of Materials Science and Engineering, Rutgers, The State University of New Jersey, 671 US Hwy 1, North Brunswick, NJ , United States+ Materials Department, University of California Santa Barbara, Santa Barbara, CA, 93106, United States
⊥ Condensed Matter Physics and Material Science Department, Brookhaven National Laboratory, Upton, NY, United States
2
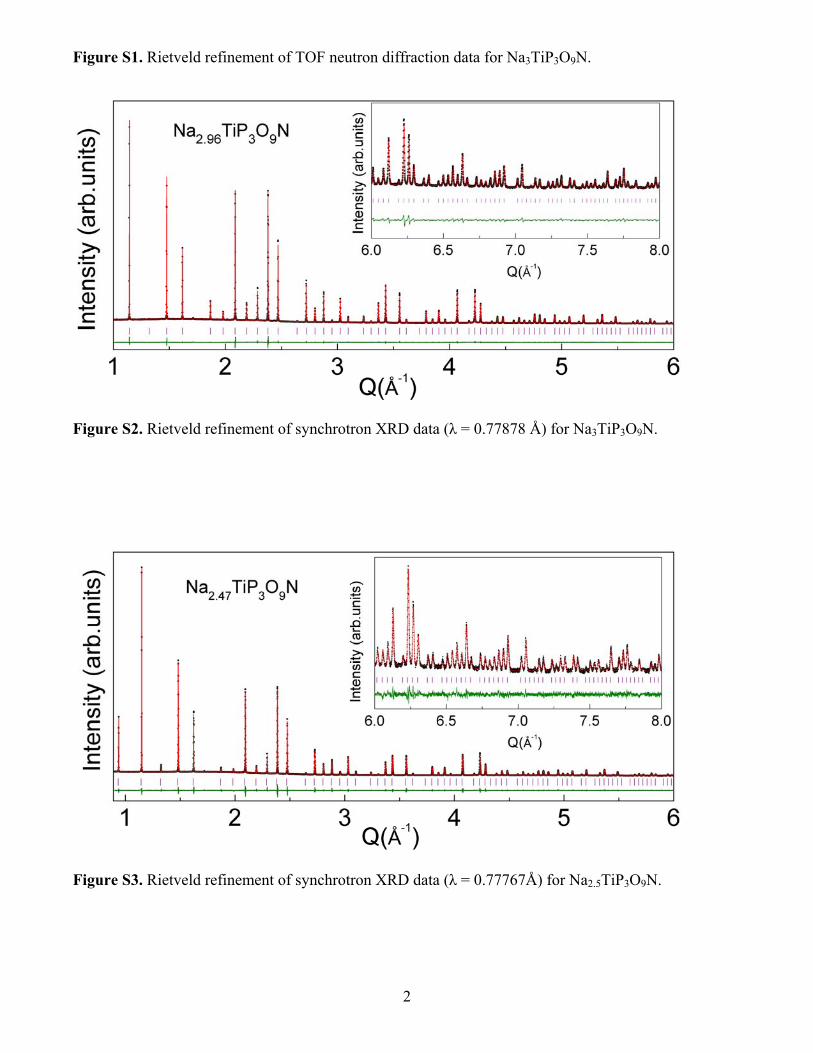
Figure S1. Rietveld refinement of TOF neutron diffraction data for Na3TiP3O9N.
Figure S2. Rietveld refinement of synchrotron XRD data (λ = 0.77878 Å) for Na3TiP3O9N.
Figure S3. Rietveld refinement of synchrotron XRD data (λ = 0.77767Å) for Na2.5TiP3O9N.

3
Figure S4. Rietveld refinement of synchrotron XRD data (λ = 0.77875 Å) for Na2TiP3O9N.
Figure S5. Rietveld refinement of TOF neutron diffraction data for Na2TiP3O9N.

4
Table S1. Summary of Rietveld refinement results
Radiation XRD XRD XRD TOF neutron TOF neutron
0.77878 Å 0.77767Å 0.77875 Å 0.1-3 Å 0.1-3 Å
Formula Na2.96TiP3O9N Na2.47TiP3O9N Na2.08TiP3O9N Na2.97TiP3O9N Na2.08TiP3O9N
Crystal system Cubic Cubic Cubic Cubic Cubic
Space group P213(198) P213(198) P213(198) P213(198) P213(198)
Lattice a 9.5192 (3) Å 9.5161 (4) Å 9.5046 (2) Å 9.5180 (2) Å 9.5092 (2) Å
Cell volume 862.58 (7) Å3 861.74 (11) Å3 858.60 (6) Å3 862.26 (5) Å3 859.86 (5) Å3
Rwp 2.81% 3.68% 4.45% 2.34% 2.64%
Rp 1.88% 2.56% 2.60% 2.15% 1.59%
χ2 3.50 3.99 3.75 1.21 1.66
Table S2. Rietveld refinement results for Na3TiP3O9N using TOF neutron diffraction data measured at 300 K in Ar (NOMAD, SNS).
Atom Wyck. x y z Occ. Beq (Å2)
Na1 4a 0.01129(34) 0.01129(34) 0.01129(34) 0.966(37) 2.49 Na2 4a 0.39430(27) 0.39430(27) 0.39430(27) 1 1.49 Na3 4a 0.80249(36) 0.80249(36) 0.80249(36) 1 2.99 Ti1 4a 0.58186(25) 0.58186(25) 0.58186(25) 1 0.95 P1 12b 0.08461(16) 0.24474(15) 0.33282(18) 1 0.74 O1 12b 0.02187(14) 0.84785(14) 0.23148(13) 1 1.12 O2 12b 0.00640(15) 0.11152(14) 0.37448(14) 1 1.26 O3 12b 0.16837(15) 0.30919(18) 0.45015(14) 1 1.43 N1 4a 0.19905(9) 0.19905(9) 0.19905(9) 1 0.79 Atom
U11(Å
2) U22(Å
2) U33(Å
2) U12(Å
2) U13(Å
2) U23(Å
2) Na1 0.0348(24) 0.0348(24) 0.0348(24) 0.0210(29) 0.0210(29) 0.0210(29) Na2 0.0209(16) 0.0209(16) 0.0209(16) 0 0 0 Na3 0.0459(25) 0.0459(25) 0.0459(25) 0.0247(35) 0.0247(35) 0.0247(35) Ti1 0.0131(12) 0.0131(12) 0.0131(12) 0.0045(13) 0.0045(13) 0.0045(13) P1 0.0136(12) 0.0064(11) 0.0095(12) 0.0024(8) 0.0007(7) -0.0007(7) O1 0.0158(12) 0.0140(13) 0.0153(12) -0.0102(8) 0.0012(8) -0.0034(8) O2 0.0153(12) 0.0120(12) 0.0157(13) -0.0015(7) 0.0014(8) 0.0028(7) O3 0.0207(14) 0.0280(15) 0.0110(11) -0.0050(9) -0.0011(8) -0.0045(9) N1 0.0107(8) 0.0107(8) 0.0107(8) -0.0008(4) -0.0008(4) -0.0008(4)

5
Table S3. Rietveld refinement results for Na3TiP3O9N using synchrotron X-ray diffraction data measured at 300 K in air. (X14A, NSLS).
Atom Wyck. x y z Occ. Beq (Å2)
Na1 4a 0.01231(18) 0.01231(18) 0.01231(18) 0.963(10) 1.61(13) Na2 4a 0.39364(21) 0.39364(21) 0.39364(21) 1 1.53(11) Na3 4a 0.80348(25) 0.80348(25) 0.80348(25) 1 1.93(10) Ti1 4a 0.58129(8) 0.58129(8) 0.58129(8) 1 0.59(8) P1 12b 0.08636(12) 0.24551(13) 0.33344(13) 1 0.52(8) O1 12b 0.02168(26) 0.84884(27) 0.23382(40) 1 1.01(10) O2 12b 0.00552(30) 0.11398(27) 0.37635(27) 1 0.77(10) O3 12b 0.16837(27) 0.30995(26) 0.44508(43) 1 0.90(10) N1 4a 0.19893(32) 0.19893(32) 0.19893(32) 1 0.57(20)
Table S4. Rietveld refinement results for Na2.5TiP3O9N using synchrotron X-ray diffraction data measured at 300 K in air. (X14A, NSLS).
Atom Wyck. x y z Occ. Beq (Å2)
Na1 4a 0.01408(55) 0.01408(55) 0.01408(55) 0.474(10) 2.96(29) Na2 4a 0.39080(23) 0.39080(23) 0.39080(23) 1 2.33(16) Na3 4a 0.80829(24) 0.80829(24) 0.80829(24) 1 1.97(13) Ti1 4a 0.58318(10) 0.58318(10) 0.58318(10) 1 0.68(11) P1 12b 0.08461(14) 0.24248(15) 0.33057(14) 1 0.58(11) O1 12b 0.02430(30) 0.83715(32) 0.24097(39) 1 0.75(13) O2 12b 0.00869(31) 0.10782(44) 0.37752(38) 1 0.77(10) O3 12b 0.16696(32) 0.30557(33) 0.44779(34) 1 0.97(13) N1 4a 0.19730(36) 0.19730(36) 0.19730(36) 1 1.25(19)

6
Table S5. Rietveld refinement results for Na2TiP3O9N using TOF neutron diffraction data measured at 300 K in Ar (NOMAD, SNS).
Atom Wyck. x y z Occ. Beq (Å2)
Na1 4a 0.0064(27) 0.0064(27) 0.0064(27) 0.085(4) 2.17(98) Na2 4a 0.39123(20) 0.39123(20) 0.39123(20) 1 1.10 Na3 4a 0.81376(23) 0.81376(23) 0.81376(23) 1 2.33 Ti1 4a 0.58474(21) 0.58474(21) 0.58474(21) 1 1.10 P1 12b 0.08461(14) 0.23983(12) 0.32989(14) 1 0.62 O1 12b 0.02576(11) 0.83577(12) 0.23872(10) 1 0.94 O2 12b 0.00893(12) 0.10335(11) 0.37382(11) 1 0.89 O3 12b 0.16634(12) 0.30500(13) 0.44710(11) 1 1.40 N1 4a 0.19616(7) 0.19616(7) 0.19616(7) 1 0.72 Atom
U11(Å
2) U22(Å
2) U33(Å
2) U12(Å
2) U13(Å
2) U23(Å
2) Na1 - - - - - - Na2 0.0139(11) 0.0139(11) 0.0139(11) 0 0 0 Na3 0.0296(13) 0.0296(13) 0.0296(13) 0.0053(19) 0.0053(19) 0.0053(19) Ti1 0.0140(10) 0.0140(10) 0.0140(10) 0.0013(11) 0.0013(11) 0.0013(11) P1 0.0104(9) 0.0063(8) 0.0069(8) -0.0008(4) -0.0002(5) -0.0021(6) O1 0.0127(8) 0.0134(1) 0.0095(8) -0.0061(5) -0.0002(6) -0.0022(7) O2 0.0112(8) 0.01096(9) 0.0118(8) -0.0053(4) 0.0016(7) 0.0005(6) O3 0.0194(11) 0.0229(10) 0.0109(8) -0.0067(6) -0.0039(7) -0.0035(7) N1 0.0090(4) 0.0090(4) 0.0090(4) 0.0011(4) 0.0011(4) 0.0011(4)
Table S6 Rietveld refinement results for Na2TiP3O9N using synchrotron X-ray diffraction data measured at 300 K in air (X14A, NSLS).
Atom Wyck. x y z Occ. Beq (Å2)
Na1 4a 0.01232(18) 0.0026(35) 0.0026(35) 0.085* 2.17* Na2 4a 0.39090(25) 0.39090(25) 0.39090(25) 1 1.51(15) Na3 4a 0.81422(32) 0.81422(32) 0.81422(32) 1 1.80(15) Ti1 4a 0.58518(10) 0.58518(10) 0.58518(10) 1 0.49(13) P1 12b 0.08541(15) 0.23998(11) 0.33038(15) 1 0.43(14) O1 12b 0.02451(40) 0.83665(45) 0.23960(42) 1 0.67(15) O2 12b 0.00848(40) 0.10458(41) 0.37511(42) 1 0.68(14) O3 12b 0.16587(47) 0.30312(46) 0.44508(43) 1 1.21(16) N1 4a 0.19524(51) 0.19524(51) 0.19524(51) 1 0.57(20) * fixed to refinement result of neutron diffraction data

7
Table S7. Selected bond distances (Å) for Na3TiP3O9N, Na2.5TiP3O9N and Na2TiP3O9N.
Na2.96TiP3O9N (XRD)
Na2.97TiP3O9N (TOF neutron)
Na2.5TiP3O9N (XRD)
Na2.08TiP3O9N (XRD)
Na2.08TiP3O9N (TOF neutron)
Na1 – O1 (×3) 2.6220(34) 2.6120(14) 2.7397(35) 2.7661(83) 2.7480(61) Na1 – O3 (×3) 2.6091(33) 2.5998(44) 2.6527(74) 2.577(41) 2.559(32) Na1 – N 3.0767(60) 3.0953(58) 3.020(11) 3.112(58) 3.130(45) Na2 – O2 (×3) 2.4358(36) 2.4465(36) 2.4737(46) 2.4832(44) 2.4991(28) Na2 – O3 (×3) 2.3464(33) 2.3586(31) 2.3429(38) 2.3545(43) 2.3512(23) Na3 – O1 (×3) 3.0697(43) 3.0473(52) 3.0723(45) 3.1071(48) 3.1257(34) Na3 – O3 (×3) 2.3765(38) 2.3715(40) 2.3332(40) 2.3096(43) 2.2834(24) Ti – O1 (×3) 1.9642(36) 1.9824(25) 1.9207(36) 1.8985(36) 1.9245(21) Ti – O2 (×3) 2.0344(27) 2.0190(30) 1.9865(41) 1.9688(34) 1.9684(25) P – O1 1.5614(31) 1.5378(21) 1.5327(35) 1.5449(37) 1.5361(17) P – O2 1.5256(29) 1.5229(20) 1.5374(41) 1.5355(35) 1.5416(16) P – O3 1.4792(30) 1.5030(21) 1.4896(35) 1.4723(40) 1.4935(17) P – N 1.7274(15) 1.7311(17) 1.7155(17) 1.7133(18) 1.7073(13)
Figure S6. Calculated free energy (a) and volume change (b) associated with Na removal from each of the three crystallographic sites of Na3TiP3O9N (energies and volumes are per primitive unit cell containing four Na3TiP3O9N formula units).
(b)(a)

8
Figure S7. (a) SEM image, (b) EDX pattern, (c) TEM image, and (d) electron diffraction pattern from
as-prepared Na3TiP3O9N powder.
[111] [2-10]
1μm
(c) (d)
(a) (b)
1μm

9
Figure S8. Ti K-edge XANES spectra of pristine Na3TiP3O9N and partially oxidized Na3-xTiP3O9N after ball milling for 1 hour.
Figure S9. Charge-discharge profile of Na3TiP3O9N (ball milled for 1 hour) cycled against Na at C/20.

10

11
Figure S10. Fits of AC impedance spectra collected at temperatures from 30 – 163 °C using frequencies of 20 Hz – 2 MHz, and the equivalent circuit used for modeling the data. Refined parameters are reported in Table S8.
The parameters in this equivalent circuit are closely associated with physical response mechanisms permitted within pellet the measurement geometry. Rg represents the bulk resistance of the Na3TiP3O9N electrolyte, Cg represents the capacitance between the two metal electrodes, CPEgb is a constant-phase-angle element that represents sodium ions moving into (or across) grain boundaries, and CPEI is a constant-phase-angle element used to model the diffusion of sodium ions into the contacts. The first three elements allow the high-frequency arc to be described, while the CPEI is required to model the low frequency tail of the spectrum.
Table S8. Fitting results of T-dependent ac impedance data.
T (ᵒC) Rg (Ω) Δ Rg (%) Cg (F) CPEgb B1 (Ω S-n1)
CPEgb n1
CPEI B2 (Ω S-n2)
CPEI n2
30 794790 0.226 6.97E-12 4.33E-09 0.5449 6.37E-07 0.4522857 402160 0.485 6.23E-12 3.20E-09 0.5682 3.40E-06 0.4003165 306230 0.106 6.28E-12 3.30E-09 0.5635 7.22E-06 0.3644175 211990 0.119 6.28E-12 3.46E-09 0.5628 8.72E-06 0.3699086 127070 0.377 6.06E-12 3.77E-09 0.5670 7.39E-06 0.47269
103 58355 0.266 6.30E-12 5.60E-09 0.5547 2.62E-05 0.36451116 32646 0.510 7.00E-12 7.88E-09 0.5424 5.07E-05 0.24503130 20074 0.257 7.41E-12 1.11E-08 0.5311 0.000101 0.19595141 12105 0.748 6.81E-12 1.38E-08 0.5336 0.000172 0.19916153 7319 0.108 7.42E-12 9.99E-09 0.5558 0.000269 0.17713163 4929 1.184 5.48E-12 8.93E-09 0.5860 0.00034 0.17380

12
Figure S11. Energies for points along the short (S13) and long (L13) Na1‐Na3 pathways calculated by simple GGA methods without the inclusion of a Hubbard U term. Distances are given in Å.
Figure S12. Energies for points along the Na1-Na2 type pathway (P12). Distances are given in Å. (a) Energies are calculated by GGA (b) Energies calculated by GGA+U (U=5 eV).

13
Figure S13. Rietveld refinement of final diffraction pattern (scan number 168, λ = 0.3196 Å) containing NaTi2(PO4)3 at the conclusion of the in situ heating experiment for Na3TiP3O9N.
Table S9 Crystallographic data of NaTi2(PO4)3 from the Rietveld refinement of 200 °C data (scan 168).
Formula
NaTi2(PO4)3
Space group
R‐3c (# 167)
Lattice parameters (Å )
a = 8.4736(3) b = 21.9502(10)
Atom Wyckoff symbol x y z Occ. Biso (Å2)
Na 6b 0 0 0 1 4.35(14)
Ti 12c 0 0 0.1459 (1) 1 0.91(4)
P 18e 0.2857 (2) 0 0.25 1 1.15(5)
O1 36f 0.0307 (4) 0.2000 (4) 0.1926 (1) 1 1.62(8)
O2 36f 0.1934 (3) 0.1653 (3) 0.0900(1) 1 1.08 (7)