ion diagnostics for laser plasma experiments
TRANSCRIPT

Nuclear Instruments and Methods in Physics Research A 623 (2010) 709–711
Contents lists available at ScienceDirect
Nuclear Instruments and Methods inPhysics Research A
0168-90
doi:10.1
� Corr
E-m
journal homepage: www.elsevier.com/locate/nima
Ion diagnostics for laser plasma experiments
S. Ter-Avetisyan a,�, L. Romagnani a, M. Borghesi a, M. Schnurer b, P.V. Nickles b,c
a Centre for Plasma Physics, School of Mathematics and Physics, The Queen’s University of Belfast, University Street, Belfast BT7 1NN, UKb Max Born Institute, Nonlinear Optics and Short Pulse Spectroscopy, Berlin, Germanyc Gwangju Institute of Science and Technology, WCU Department, Gwangju, Republic of Korea
a r t i c l e i n f o
Available online 18 February 2010
Keywords:
Laser plasma
Thomson spectrometer
Ion diagnostic
Ion source characteristics
02/$ - see front matter & 2010 Elsevier B.V. A
016/j.nima.2010.02.094
esponding author.
ail address: [email protected] (S. Ter-A
a b s t r a c t
For laser plasma diagnostic purposes, a specific Thomson spectrometer with a multi-pinhole array at
the entrance aperture is proposed. The ion beam under investigation is thus divided into small beamlets
and the obtained spectral image combines the recorded spectra of the ions, which are emitted under
different angles of the source. This resembles a simultaneous measurement with many independent
spectrometers. Thereby, the emission characteristic of the ion source can be reconstructed. The
quantitative analysis of the ion emission spectra allows one to gain detailed information about the
accelerating sheath field profile and dynamics.
& 2010 Elsevier B.V. All rights reserved.
1. Introduction
Laser-driven multi-MeV ion beams have unique propertiessuch as high ion numbers per bunch, ultra-low emittance, andshort pulse duration. Therefore, these ion beams are recognized aspotentially interesting for a number of innovative applications [1].However, beside the general constraint on maximum available ionenergies, knowledge of the detailed properties of the beams’source characteristics and control on these properties willdetermine which of the proposed applications have realisticprospects.
From a diagnostic perspective, Thomson parabola spectro-meters [2] are invaluable tools in gaining spectral information onthe ion beams. Different modifications of a basic Thomsonspectrometer design have been introduced for several purposessuch as simultaneous measurement of ion and electron energyspectra obtained from laser plasma [3], high spatial resolutionspectrometry [4], time-resolved Thomson parabola spectrometryproviding time-resolved characteristics of ions in addition to thetime-integrated information [5], Thomson parabola spectrometerapplication to proton deflectometry [6], and complementaryThomson parabola—XUV spectrometer allowing simultaneousdetection of the ion and XUV spectra [7]. In this letter we arepresenting a further modification of a Thomson parabola spectro-meter, which allows investigating the angular and spectral sourcecharacteristics in order to obtain quantitative information on thesheath field being responsible for ion acceleration and beamformation.
ll rights reserved.
vetisyan).
Studies published so far [8–12] have concentrated on diver-gence measurement of the whole ion beam together with a totalsource extension determination using stacks of Radiochromic filmdetectors. In these measurements, the data are provided only forcertain discrete energy intervals and the particle trajectories inthe detector are only traceable with a relatively limited accuracy.Detailed investigations of the accelerating sheath dynamicsare essential in order to benchmark existing theoretical modelsand simulations, which provide only a simplified picture of thecomplex acceleration process. Here we will discuss how thedescribed modification of the Thomson parabola spectrometerallows high-resolution analysis of the laser–plasma source, whichcan also serve to identify any possible process (e.g. instabilities)affecting the trajectories of the ions in the emitted beam.
2. Principles and method
The use of a Thomson spectrometer for the investigation oflaser-driven ion beams has resulted in several instances in thedetection of ion traces deviating from the ideal parabolic traces[4,13] expected by using this diagnostic [5]. Such effects wereparticularly pronounced when the spectrometer was modified toan image magnifying mode [4]. In order to study these distortionsand to find its origin a Thomson spectrometer with two pinholes(Fig. 1) placed along the ion flight path was employed [13]. Theidea is that the two pinholes, aligned along the same line of sightfrom the target, allow the detection of particles emitted only froma target coordinate located on this line. The size of the area seenby the detector is defined by the pinhole diameter, the divergenceof the beam, and the geometry of the experiment. In the setup twopinholes with diameters 30 and 150mm were located 50 and
Z/mv
Z/AS
MCP
detec to r
U(2-6) keV
Laser B ~ 0.27 T
X
Y
N Z/mv 2target
pinholes
30 µm45°
50 mm 350 mm 400 mm
150 µm
Fig. 1. Schematic figure of the geometry of Thomson spectrometer with two
entrance pinholes.
energy, MeV
protons
0.2 0.5 1 2 3 4
Fig. 2. CCD picture of the proton spectrum measured in the direction of target
normal when proton beam passes through two pinholes.
S
Z/mv
MCPdetector
X
Y
Npinholes array
B=0.33 T
a
prot
ons
c
012 3laser45°
target
number of pinholes
b
Fig. 3. Schematic figure of the geometry of Thomson spectrometer with multi-
pinhole array.
20.2 0.3 0.4 0.5 1energy (MeV)
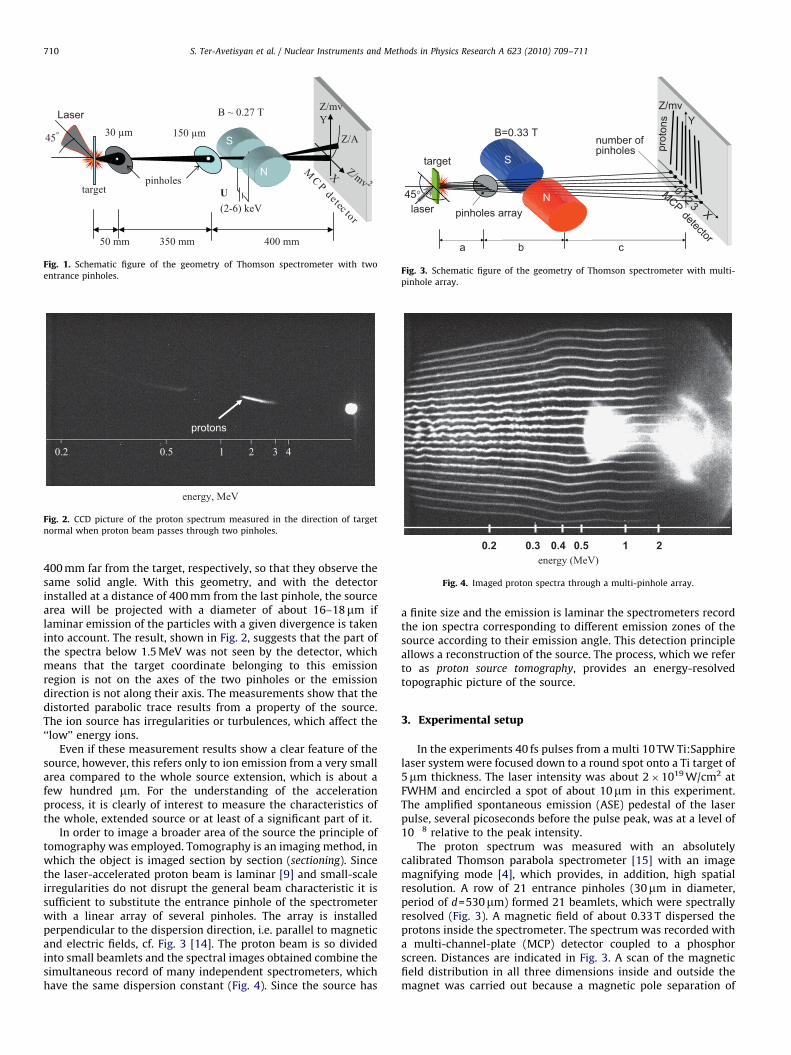
Fig. 4. Imaged proton spectra through a multi-pinhole array.
S. Ter-Avetisyan et al. / Nuclear Instruments and Methods in Physics Research A 623 (2010) 709–711710
400 mm far from the target, respectively, so that they observe thesame solid angle. With this geometry, and with the detectorinstalled at a distance of 400 mm from the last pinhole, the sourcearea will be projected with a diameter of about 16–18mm iflaminar emission of the particles with a given divergence is takeninto account. The result, shown in Fig. 2, suggests that the part ofthe spectra below 1.5 MeV was not seen by the detector, whichmeans that the target coordinate belonging to this emissionregion is not on the axes of the two pinholes or the emissiondirection is not along their axis. The measurements show that thedistorted parabolic trace results from a property of the source.The ion source has irregularities or turbulences, which affect the‘‘low’’ energy ions.
Even if these measurement results show a clear feature of thesource, however, this refers only to ion emission from a very smallarea compared to the whole source extension, which is about afew hundred mm. For the understanding of the accelerationprocess, it is clearly of interest to measure the characteristics ofthe whole, extended source or at least of a significant part of it.
In order to image a broader area of the source the principle oftomography was employed. Tomography is an imaging method, inwhich the object is imaged section by section (sectioning). Sincethe laser-accelerated proton beam is laminar [9] and small-scaleirregularities do not disrupt the general beam characteristic it issufficient to substitute the entrance pinhole of the spectrometerwith a linear array of several pinholes. The array is installedperpendicular to the dispersion direction, i.e. parallel to magneticand electric fields, cf. Fig. 3 [14]. The proton beam is so dividedinto small beamlets and the spectral images obtained combine thesimultaneous record of many independent spectrometers, whichhave the same dispersion constant (Fig. 4). Since the source has
a finite size and the emission is laminar the spectrometers recordthe ion spectra corresponding to different emission zones of thesource according to their emission angle. This detection principleallows a reconstruction of the source. The process, which we referto as proton source tomography, provides an energy-resolvedtopographic picture of the source.
3. Experimental setup
In the experiments 40 fs pulses from a multi 10 TW Ti:Sapphirelaser system were focused down to a round spot onto a Ti target of5mm thickness. The laser intensity was about 2�1019 W/cm2 atFWHM and encircled a spot of about 10mm in this experiment.The amplified spontaneous emission (ASE) pedestal of the laserpulse, several picoseconds before the pulse peak, was at a level of10�8 relative to the peak intensity.
The proton spectrum was measured with an absolutelycalibrated Thomson parabola spectrometer [15] with an imagemagnifying mode [4], which provides, in addition, high spatialresolution. A row of 21 entrance pinholes (30mm in diameter,period of d=530mm) formed 21 beamlets, which were spectrallyresolved (Fig. 3). A magnetic field of about 0.33 T dispersed theprotons inside the spectrometer. The spectrum was recorded witha multi-channel-plate (MCP) detector coupled to a phosphorscreen. Distances are indicated in Fig. 3. A scan of the magneticfield distribution in all three dimensions inside and outside themagnet was carried out because a magnetic pole separation of

~~8
zero pointproton beamlets
S. Ter-Avetisyan et al. / Nuclear Instruments and Methods in Physics Research A 623 (2010) 709–711 711
4 cm causes a field distribution one has to consider. The instru-ment function so obtained was confirmed with an additional testexperiment to exclude that any artifact on the spectral tracescould arise due to field inhomogeneities or fringe fields.
0
1
2
prot
on e
nerg
y (M
eV)
virtual source -target front surface distance (µm)
virtual source
target
0 10 300 350 400 450 500
Fig. 5. Virtual proton source positions in front of the target for different proton
energies. In figure inset the virtual proton source position in front of the target for
certain energy is shown.
4. Results and discussion
The spectral image of the proton beam divided into smallbeamlets is shown in Fig. 4 and it is interesting under severalrespects. First of all, the picture is clearly symmetric with respectto the central axes, meaning that beam, source and plasmaevolution are obeying the same symmetry. The spectra can beanalyzed and with simple geometrical relations the ion trajec-tories can be retraced to the source as described in [14]. In theideal case each proton trace should originate from a point whichcorresponds to the axis of the spectrometer. Thus, if a tilt of theproton trace from this axis occurs, the coordinate of the protonemission from target and correspondingly the emission angle canbe calculated for each energy.
The spectra in Fig. 4 can be divided qualitatively into threeenergy regions; a first one in the range 2–0.8 MeV, a second in therange 0.8–0.3 MeV, and a third going from 0.3 MeV down to thelow-energy cutoff of the spectrometer. The following features canbe observed in these three regions: in the first part, whichcorresponds to the range from the measured maximum 2 MeVdown to about 0.8 MeV energies, the spectra have no tilt or theirprojection on the X-axis (Fig. 3) is zero. This means that the ions ineach trace are emitted from the same target coordinate along thespectrometers axes and have the same divergence or emittedunder same angle. This region corresponds to an ‘‘ideal case’’emission scenario. In the second region, at proton energies ofabout 0.8 MeV it appears that the divergence starts to increase,decreasing again at about 0.4 MeV and coming back to the originaldivergence at proton energies of about 0.3 MeV. In the thirdregion, the proton spectra have a tilt or their projection on the X-axis (see Fig. 3) is not zero, therefore, similarly to [14], the protonsare emitted from different target coordinates and under differentangles. In this spectral region, we can summarize the emissionproperties from the part of the source under observation asfollows: the protons with lower energy are emitted with smalleremission angle relative to the target normal but from a largerarea. Additionally, starting from the seventh trace from top andbottom some small-scale irregularities or ‘‘oscillations’’ appear inthe spectra. Their nature has to be investigated in more detail butthe detail of these small-scale observations shows the potential ofthe diagnostic method described.
If one adopts the idea of a virtual source [9], when thepropagation of the proton beam after the acceleration process isballistic and there is no ion interaction within the beam, theproton trajectories are straight lines and one can trace back thesetrajectories to a virtual source in front of the target. The virtual ionsource positions in front of the target for different proton energiesare shown in Fig. 5. If the ‘‘Zero points’’ refer to the X-ray sourceand the high-energy protons (2–0.8 MeV) are emitted from thesame virtual source, the virtual source position for the low-energyprotons is changing. In other words, protons with differentenergies are emitted with a different curvature of the accelerat-ing sheath field. This hints at a change of the sheath fieldcurvature during the acceleration process. From the data one canqualitatively describe the emission process taking place in therecorded experiment as follows: laser-accelerated electrons crossthe target emitting X-rays and the electrons build up the acce-lerating sheath field, which accelerates the protons to the highest
energy (‘‘zero points’’ and 2–0.8 MeV region). Then the sheathfield curvature increases until it decreases again at around 0.8–0.3 MeV. Finally, it continuously decreases for the protons withenergies below 0.3 MeV.
5. Summary
The proposed design of a Thomson spectrometer provides anopportunity to characterize an ion (or particle) source, which isbased on a laser-driven acceleration process. The measurementsystem has in principle no significant restrictions in terms ofresolution, and can be installed according to requirements. Forinstance, both the spectral and the spatial resolutions can besignificantly improved if the spectrometer is installed closer tothe source. This will allow increasing the spectral resolution of thespectrometer by simply using a smaller array of entrance pinholeswhile the acceptance solid angle can be the same as in theinstallation described in this paper. The detailed analysis of datafrom this instrument can provide quantitative information (notdiscussed in detail in this paper) on the acceleration process andthe properties of the source. Thereby, such an instrument can beof high relevance to the investigation of complex phenomenataking place during laser–plasma interaction.
References
[1] J.J. Thomson, Cathode Rays Philos. Mag. 44 (1897) 293.[2] M. Borghesi, et al., Fusion Sci. Technol. 49 (2006) 412.[3] S. Ter-Avetisyan, et al., Phys. Rev. Lett. 93 (2004) 155006.[4] J. Schreiber, et al., Phys. Plasmas 13 (2006) 033111.[5] S. Ter-Avetisyan, M. Schnurer, P.V. Nickles, J. Phys. D 38 (2005) 863.[6] S. Ter-Avetisyan, et al., Rev. Sci. Instrum. 79 (2008) 033303.[7] S. Ter-Avetsiyan, et al., Rev. Sci. Instrum. 80 (2009) 103302.[8] T.E. Cowan, et al., Phys. Rev. Lett. 92 (2004) 204801.[9] M. Borghesi, et al., Phys. Rev. Lett. 92 (2004) 055003.
[10] M. Roth, et al., Laser Part. Beams 23 (2005) 95.[11] E. Brambrink, et al., Phys. Rev. Lett. 96 (2006) 154801.[12] S. Ter-Avetisyan, et al., Laser Part. Beams 26 (2008) 637.[13] T. Nakamura, et al., Phys. Rev. E 77 (2008) 036407.[14] S. Ter-Avetisyan, et al., Phys. Plasmas 16 (2009) 043108.[15] S. Ter-Avetisyan, et al., J. Phys. B: At. Mol. Opt. Phys. 37 (2004) 3633.