luigi giubbolini | time/space-probing interferometer for plasma diagnostics
DESCRIPTION
By Luigi Giubbolini Published article about Rapid progress in plasma applications requires new instrumentation. Luigi Giubbolini has engineering experience in industrial, government laboratory & academic environments.TRANSCRIPT


TIME/SPACE-PROBING INTERFEROMETER FOR PLASMA DIAGNOSTICS
V. A. Manasson, A. Avakian, A. Brailovsky, W. Gekelman*, A. Gigliotti*, L. Giubbolini, I. Gordion, M. Felman, V. Khodos, V. Litvinov, P. Pribyl*, L. Sadovnik
(WaveBand, a Business Unit of Sierra Nevada Corporation, 15245 Alton Pkwy, Ste. 100,
Irvine, California, 92618 * UCLA Basic Plasma Science Facility, 1000 Veteran Ave.,
Los Angeles, California, 90095)
Rapid progress in plasma applications requires new instrumentation. Plasma density distribution is a key characteristic in fusion devices and in applications related to plasma processing. The plasma dielectric constant depends on the plasma density. The latter is subject to rapid local changes. Millimeter-wave (MMW) interferometry can be used for measuring such variations. It is desirable that the interferometer be capable to track both time and space plasma density variations. The latter typically requires a rather long time for changing the position of the instrument. We propose a new device that provides fast spatial probing. The new instrument is based on electronically controlled MMW beam-formers recently developed at WaveBand-SNC. The major advantages of this device are fast data acquisition and holographically flexible beam-forming. In future, an array of the proposed interferometers will be used as a key subsystem in plasma diagnostics tomography. We have built a prototype of the new interferometer, which is planned to be installed for testing and for exploring the capability of the new approach at the Large Plasma Device (LAPD) at UCLA. The prototype comprises a heterodyne type reflectometer-interferometer operating at 76 GHz and two synchronously operating electronically controlled scanning antennas, one for transmitting MMW radiation and the other for receiving the radiation reflected back from a mirror placed behind the plasma tube. The antennas scan beams over a 30° angular range and can switch beam position within 3 μs. Preliminary demonstration of the new instrument was performed at LAPD with a plasma density of 3121041 −×− cm . The new instrument can find applications in plasma diagnostics in scientific research as well as in commercial applications of plasma.

1. Introduction
Millimeter wave (MMW) interferometry is an established means for measurements of electron density in plasmas [1-3]. The underlying principle is the phase shift attained by a MMW beam traversing a plasma volume. The phase shift is proportional to the plasma index of refraction integrated along the beam path. The plasma refractive index according to the Drude model is
2
2
1f
fn p−= (1),
where e
p mNef
2
≡ is the electron plasma frequency; N is the plasma density, e is the
elementary charge, and me is the electron mass. For electromagnetic waves with frequencies higher than the plasma frequency ( and for “O” mode in magnetized plasmas with f >>fpe) , the plasma is almost transparent and the effect is a phase delay for the propagating wave. This makes MMW interferometry applicable for diagnostics of plasmas with densities lower than N~(1011 - 1012)cm-3. A conventional interferometer measures the phase delay of an electromagnetic wave passing through the plasma volume in a single direction (single channel), with respect to a wave which does not. Having these measurements performed in different directions and applying tomography makes it possible to recover 2-D or 3-D plasma density distributions. Using a single interferometer for tomography, with the inevitable repositioning of the instrument, makes the measurement process slow and inefficient. Using several conventional interferometers and parallel data acquisition speeds up the process but makes it much more costly. We propose an alternative solution to the problem. Radical improvement in data acquisition time, at a moderate increase in the instrument cost, can be achieved by using a new type of device, a multi-channel interferometer (MCI). This is an instrument that can quickly switch from one direction of plasma probing to another (one measurement channel to another), thus eliminating the need for moving the entire device to a new position. The switched multi-channel device makes it possible to use an inexpensive conventional interferometer to probe many directions, each for a short time. In this paper we describe a prototype of the new multi-channel instrument that was built and installed for exploration and testing of the new approach at the UCLA Large Plasma Device. The key elements of the new instrument are fast, operating almost in real-time, flexible beam-formers, based on a Electronically Reconfigurable Aperture (ERA) recently developed at WaveBand (a business unit of Sierra Nevada Corporation).

2. Interferometer
The block-diagram of the interferometer is shown in Figure 1. It comprises a transmitter, a receiver, and phase detector. The receiver is configured as a heterodyne operating at IF=19 GHz.
Figure 1. Block-diagram of the heterodyne interferometer.
The transmitter is based on a tunable Gunn oscillator with a central frequency of 75.9 GHz and a power level of 17 dBm. A magic tee distributes the source power between two channels. One channel goes to the transmitting antenna while the other one drives the harmonic mixer and is used for Phase Lock Loop (PLL), which synchronizes the Gunn oscillator with the reference oscillator. The reference oscillator is a 9.5 GHz dielectric resonator oscillator with an active frequency multiplier. Output 19 GHz signal from the multiplier goes to the reference input of the harmonic mixer. IF signal from the mixer output has a frequency of 4×19 GHz - Ftr, where Ftr is the Gunn source frequency. The IF-signal goes to PLL circuit where it is compared to the 100 MHz clock oscillator signal. The PLL circuit output signal goes to varactor-biased input of the Gunn oscillator and sets its frequency to Ftr = 4×19 GHz – 100 MHz = 75.9 GHz. Received radiation is collected by the receiving antenna. A 2nd harmonic mixer is identical to the mixer used in
~110V
Power Supply Module
Interferometer Base Block
PLL Circuit IF Amplifier Phase Detector
Ref. 100MHz
IF
Transmitter
Power Supply
PLL IF In
PLL IF Out
PLL Control Out
PLL Control In
Transmitting Antenna
I Out
Q Out To Data Acquisition
Receiver
(Harmonic Mixer)
Receiving Antenna
RF Out
RF In
LO Out LO In
19 GHz
76 GHz
Receiver IF In
IF Out
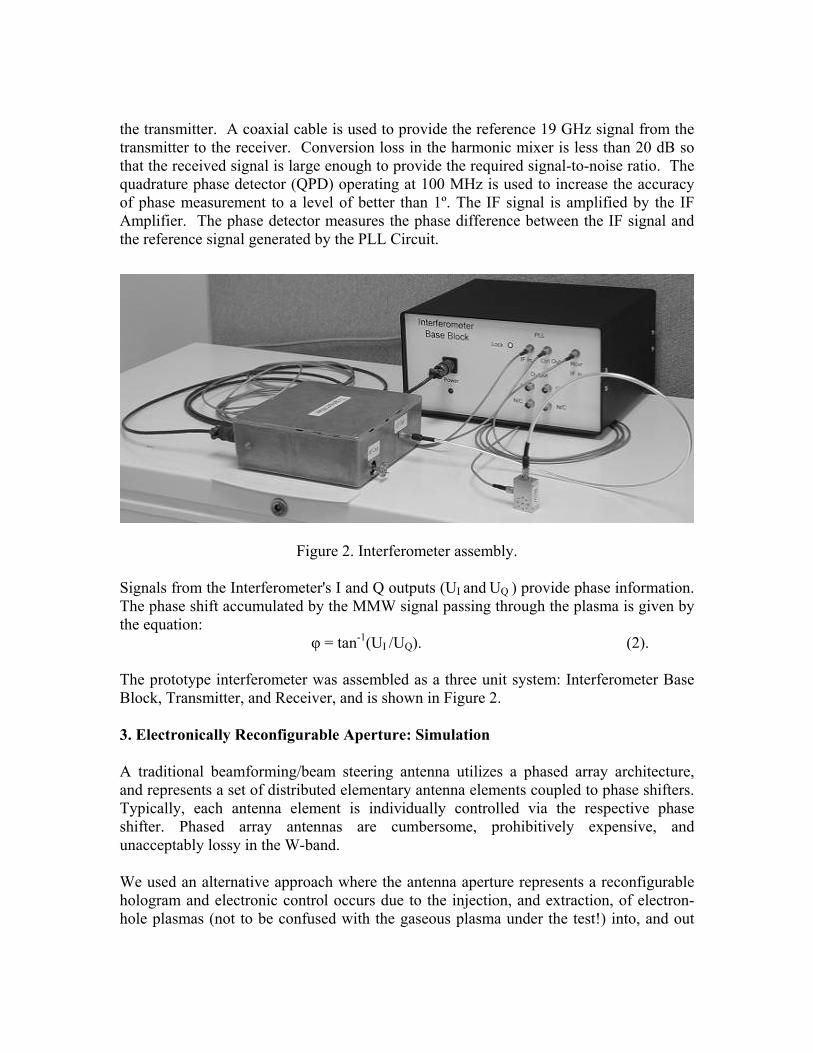
the transmitter. A coaxial cable is used to provide the reference 19 GHz signal from the transmitter to the receiver. Conversion loss in the harmonic mixer is less than 20 dB so that the received signal is large enough to provide the required signal-to-noise ratio. The quadrature phase detector (QPD) operating at 100 MHz is used to increase the accuracy of phase measurement to a level of better than 1º. The IF signal is amplified by the IF Amplifier. The phase detector measures the phase difference between the IF signal and the reference signal generated by the PLL Circuit.
Figure 2. Interferometer assembly. Signals from the Interferometer's I and Q outputs (UI and UQ ) provide phase information. The phase shift accumulated by the MMW signal passing through the plasma is given by the equation:
φ = tan-1(UI /UQ). (2).
The prototype interferometer was assembled as a three unit system: Interferometer Base Block, Transmitter, and Receiver, and is shown in Figure 2. 3. Electronically Reconfigurable Aperture: Simulation
A traditional beamforming/beam steering antenna utilizes a phased array architecture, and represents a set of distributed elementary antenna elements coupled to phase shifters. Typically, each antenna element is individually controlled via the respective phase shifter. Phased array antennas are cumbersome, prohibitively expensive, and unacceptably lossy in the W-band.
We used an alternative approach where the antenna aperture represents a reconfigurable hologram and electronic control occurs due to the injection, and extraction, of electron-hole plasmas (not to be confused with the gaseous plasma under the test!) into, and out

of, a semiconductor waveguiding medium. The aperture hologram can be varied continuously (WaveBand has developed a method for continuous aperture variations in mechanically controlled antennas and in optically controlled plasma grating antennas [4,5]) or varied digitally in a pixelized aperture. Pixels, in turn, can be controlled either continuously or digitally. The pixelized Electronically Reconfigurable Aperture (ERA) with digital control, combines high stability and beam-forming flexibility. The ERA beam-forming flexibility is at the same level as the flexibility of traditional phased array antennas, however, ERA’s temperature stability is much better.
For the plasma interferometer prototype we have developed a monolithic 1-dimensional (1D) ERA. The development process included Ansoft HFSS simulations. A typical simulated far-field beam pattern is shown in Figure 3.
Figure 3. Simulated far field antenna beam pattern for 1D ERA: upper curve represents the azimuth beam pattern, lower curve represents the elevation beam pattern.
θφ
Z
YX

4. ERA Test Results
Two monolithic ERA chips where fabricated for installation in the interferometer. Each chip was 3-inchs long, or approximately 19 wavelengths at 76 GHz. The chips were coupled to RF electronics via dielectric waveguides. The required hologram patterns were created by using a programmable electronic driver-controller. Beam shape in the H-plane was controlled by selecting the appropriate hologram pattern. Beam shape in V-plane was fixed and determined by the cylindrical lens attached to the aperture. The antenna assembly with the attached driver-controller is shown in Figure 4. Each antenna was capable of creating a sequence of beams covering a wide angle span. The beam width at -3 dB level in the H-plane was on the order of 3-3.5 deg. Samples of measured H-plane beam patterns are shown in Figures 5 and 6.
Figure 4. Antenna assembly at the near-field antenna measurement test setup.
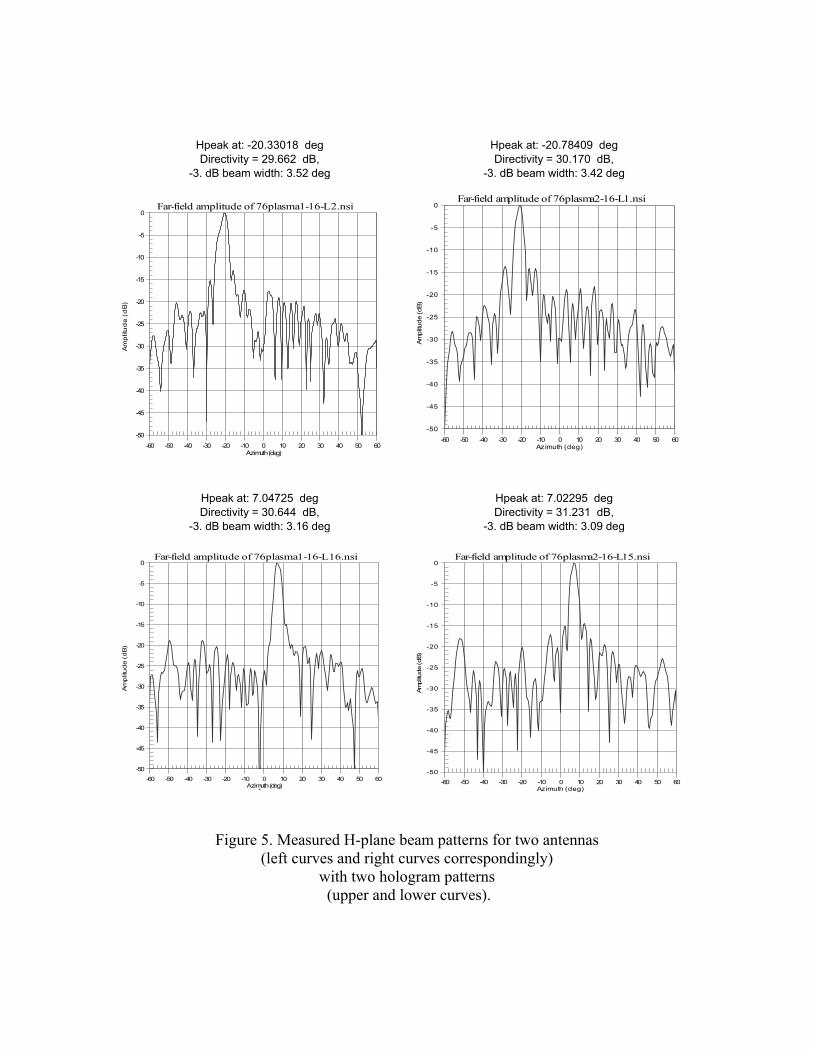
Hpeak at: -20.33018 deg Hpeak at: -20.78409 deg Directivity = 29.662 dB, Directivity = 30.170 dB,
-3. dB beam width: 3.52 deg -3. dB beam width: 3.42 deg
-50
-45
-40
-35
-30
-25
-20
-15
-10
-5
0
-60 -50 -40 -30 -20 -10 0 10 20 30 40 50 60
Far-field amplitude of 76plasma1-16-L2.nsi
Am
plit
ud
e (
dB
)
Azimuth (deg)
-50
-45
-40
-35
-30
-25
-20
-15
-10
-5
0
-60 -50 -40 -30 -20 -10 0 10 20 30 40 50 60
Far-field amplitude of 76plasma2-16-L1.nsi
Ampl
itude
(dB)
Az imuth (deg)
Hpeak at: 7.04725 deg Hpeak at: 7.02295 deg Directivity = 30.644 dB, Directivity = 31.231 dB,
-3. dB beam width: 3.16 deg -3. dB beam width: 3.09 deg
-50
-45
-40
-35
-30
-25
-20
-15
-10
-5
0
-60 -50 -40 -30 -20 -10 0 10 20 30 40 50 60
Far-field amplitude of 76plasma1-16-L16.nsi
Am
plit
ud
e (
dB
)
Azimuth (deg)
-50
-45
-40
-35
-30
-25
-20
-15
-10
-5
0
-60 -50 -40 -30 -20 -10 0 10 20 30 40 50 60
Far-field amplitude of 76plasma2-16-L15.nsi
Ampl
itude
(dB)
Azimuth (deg)
Figure 5. Measured H-plane beam patterns for two antennas
(left curves and right curves correspondingly) with two hologram patterns (upper and lower curves).

Figure 6. Selected H-plane beam-patterns corresponding to different hologram patterns.
To measure the time needed for switching from one beam position to another, we used a setup consisting of the interferometer receiver and the transmitter radiating toward the antenna via a pyramidal horn. The ERA was programmed to be positioned toward the horn and was located at a distance of 1 m from the horn. Two hologram patterns were loaded into the driver memory, one for the antenna pointing toward the horn, the other for the antenna pointed in a different direction. The harmonic mixer was connected to the antenna output. A 19 GHz RF signal was fed into the reference input of the mixer. The differential frequency from the mixer output was amplified and recorded by oscilloscope. The oscillogram is shown in Figure 7.

-0.15
-0.1
-0.05
0
0.05
0.1
0.15
0 1000 2000 3000 4000 5000 6000 7000 8000 9000 10000
-3
-2
-1
0
1
2
3
4
5
6
0 1000 2000 3000 4000 5000 6000 7000 8000 9000 10000
Figure 7. Switching time measurements: upper curve is the antenna response, lower curve is pulse generated by the antenna driver.
The driving pulse duration was 6.6 microseconds (lower curve). The signal generated by the antenna has a rise time on the order of 3 microseconds (the upper curve).
5. MCI Assembly and Test Results
The transmit and receive antennas were assembled on a common mount as shown in Figure 8. The overall size matched the size of the LAPD window. The antennas were
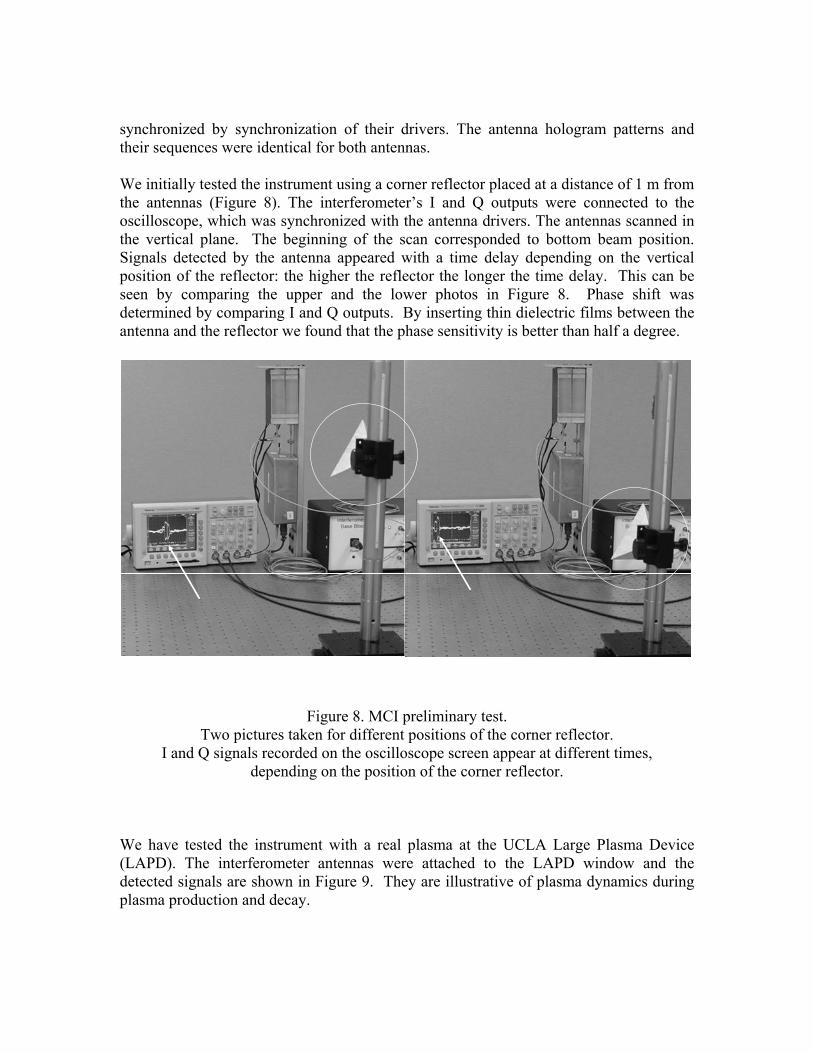
synchronized by synchronization of their drivers. The antenna hologram patterns and their sequences were identical for both antennas. We initially tested the instrument using a corner reflector placed at a distance of 1 m from the antennas (Figure 8). The interferometer’s I and Q outputs were connected to the oscilloscope, which was synchronized with the antenna drivers. The antennas scanned in the vertical plane. The beginning of the scan corresponded to bottom beam position. Signals detected by the antenna appeared with a time delay depending on the vertical position of the reflector: the higher the reflector the longer the time delay. This can be seen by comparing the upper and the lower photos in Figure 8. Phase shift was determined by comparing I and Q outputs. By inserting thin dielectric films between the antenna and the reflector we found that the phase sensitivity is better than half a degree.
Figure 8. MCI preliminary test. Two pictures taken for different positions of the corner reflector.
I and Q signals recorded on the oscilloscope screen appear at different times, depending on the position of the corner reflector.
We have tested the instrument with a real plasma at the UCLA Large Plasma Device (LAPD). The interferometer antennas were attached to the LAPD window and the detected signals are shown in Figure 9. They are illustrative of plasma dynamics during plasma production and decay.

Figure 9. Data obtained while testing the interferometer at the LAPD. Curve 1 is a reference signal from an independent 56 GHz interferometer. Curves 2 and 3 are, respectively, I and Q signals from the interferometer.
Curve 4 is the calculated phase shift obtained using formula (2). Results presented in Figure 9 show that the phase dynamics measured by the MCI are correlated with the plasma density dynamics. However, the data are affected by parasitic reflections from the plasma reactor window. The accumulated phase shift inserted by plasma greatly exceeds 2π. Without window reflection, all curves would have a vertical span equal to 2π. However, reflection from the reactor window creates a parallel reflection channel that screens the plasma phase variations. In future operation, the window reflection will be minimized by optimization of the window material and its geometry. The effect of the window reflection can be accounted for, and the corrected data have been used to estimate plasma density. The resulting curves are presented in Figures 10 and 11.

Figure 10. Plasma density dynamics obtained with the new interferometer in comparison with the reference device (56 GHz).
Figure 11. Plasma density dynamics in different directions obtained with the new interferometer.
6. Conclusions
We have designed, fabricated and preliminarily tested a scanning interferometer for plasma tomography. The device utilizes novel beam steering antennas based on WaveBand’s ERA technology. Preliminary test at the Large Plasma Device at UCLA was successfully completed.
7. Acknowledgment
This work was supported by the US Department of Energy (contract DE-FG02-03ER83843).
8. References
[1] D. Veron, “Submillimeter Interferometry of High-Density Plasmas”, in Infrared and Millimeter Waves, K.J. Button, ed., Vol. 2, pp. 67-135, NewYork, Academic Press, 1979. [2] N.C. Luhmann, Jr. "Instrumentation and Techniques for Plasma Diagnostics: An Overview", in Infrared and Millimeter Waves, K.J. Button, ed., Vol. 2, pp. 1-65, NewYork, Academic Press, 1979. [3] C.W. Domier, W.A. Peebles, and N.C. Luhmann, “Millimeter-wave interferometer for measuring plasma electron density,” Rev. Sci. Instrum., vol. 59, No.8, pp.1588-1590, 1988. [4] V.A. Manasson, L. S. Sadovnik, K. Spariosu, “Compact Version of an Optically Scanning MMW Antenna,” 20th Antenna Application Symposium, Allerton Park, Monticello, IL, pp. 1-11, 1996 [5] V. A. Manasson, L. S. Sadovnik, V.A. Yepishin, L. Timashpolsky, and R. Mino, "Spinning-Array 2-D Beam-Steering MMW Antenna," 23rd Antenna Application Symposium, Allerton Park, Monticello, Illinois, pp. 243-250, 1999