involving exxonmobil - ieefaieefa.org/wp-content/uploads/2016/10/red-flags-on-exxonmobil-xom … ·...
TRANSCRIPT


The oil industry, led by ExxonMobil, the world’s largest publicly traded international oil and
gas company, once provided its investors with outsize returns.
This is no longer the case.
Today annual cash distributions to investors are less than half of the annual average payout
for the last decade. ExxonMobil’s future is one of diminished prospects.
The principal drivers of oil industry profitability have eroded in recent years, and investors—
institutional investors in particular because of their fiduciary responsibilities to their
shareholders—are faced now with hard questions about oil industry finances and about the
suitability of owning stock in companies like ExxonMobil.
ExxonMobil’s financial management challenges are compounded by climate change
controversies. The dispute over differences between the company’s public statements on
climate change risks and its non-public knowledge of those risks has grown, and outside
scrutiny has now come to bear on the size and value of ExxonMobil’s reserves.
Institutional investors face issues not only related to lower shareholder payouts but also
involving ExxonMobil’s corporate philosophy and its long-term strategy. Urgent questions
raised now by investors require frank and honest answers from the company.
ExxonMobil is under considerable financial stress.
The company is emblematic of the once dominant energy industry that now takes a back
seat to other sectors of the global economy. Corporations that specialize, by comparison, in
information technology, manufacturing, finances, consumer goods and telecommunications
are all growing at faster rates than the oil industry—and they all have more stable outlooks.
To be sure, ExxonMobil remains a presence among the world’s largest publicly traded
companies. But its position is eroding, and the company, like the industry as a whole, will only
grow smaller as time goes by and as the global energy transition gains steam.
ExxonMobil’s management has a responsibility, first, to acknowledge to investors that the
company sits squarely at the center of this transition and, second, to develop a strategy
grounded in this acknowledgement.
ExxonMobil was a dominant force in the stock market for decades, leading every other
public company in size and sway and driving much of the performance of the S&P 500 Index.
But beginning in the 1990s, companies from other industries began to usurp oil producers in
terms of stock-market heft. ExxonMobil is the last of the big oil companies among the top 10
S&P stocks, and for the last nine consecutive quarters, the company has lagged the overall
performance of the S&P 500.
Low oil prices have driven ExxonMobil’s decline, and the company’s revenues have fallen by
45 percent over the last five years. Rising production costs have outpaced its revenue losses
as its net income, cash flow and aggregate payments to shareholders have declined. The
company has recently more than tripled its reliance on long-term borrowing and has been
downgraded by two credit agencies this year.

In the meantime, capital expenditure—a key long-term indicator of future revenues—is being
reduced. ExxonMobil, of course, is not alone in this department; it is one of more than 47 oil
companies that have cut capital expenditures, an industrywide move that signals lower
future profits and production.
Low oil prices, a factor beyond ExxonMobil’s control, are likely to remain a constant as
supply-and-demand imbalances, new political alliances and low-carbon initiatives foster a
realignment of global energy priorities and a capital-allocation shift away from fossil fuels.
ExxonMobil is paying out more money to shareholders than its operational revenues are
generating (this has been so now for a decade). The company has only recently indirectly
acknowledged this problem by announcing an end to its stock buybacks. Yet the company
has maintained its commitment to steady, modest increases in its dividend payments. In the
meantime, reduced cash outlays to investors have decreased the per-share returns on
ExxonMobil stock.
As the company struggles to find a profitable strategy for its conventional oil, natural gas, oil
sands and petrochemical businesses, it is being hampered now by serious controversy over
whether it has been fully transparent in how it has managed climate-change risk. Inquiries by
securities watchdogs are looking closely at how low oil prices affect ExxonMobil’s disclosures
regarding the size and value of its reserves.
Both ExxonMobil and its investors, then, find themselves in a pivotal period. The company’s
financial performance alone suggests an enterprise facing a much smaller market for its
product.
Sections I-V of this report offer context and perspective on ExxonMobil’s current
circumstances.
Section VI sets forth pertinent questions for investors that reflect the management concerns
flowing from Exxon Mobil’s financial stress, climate challenges and its response to securities
investigations.

The chart below tracks the price of oil over the past 70 years:
Figure 1: Crude Oil Price Per Barrel, WTI (NYMEX), 1946 - 2016
The price has risen and fallen with more or less equal intensity over the past decade. The
price in January 2001 was $35.88 per barrel, up from a low of $16.44 in November 1998. After
a modest rise in 2001, the price dropped in early 2002, to $26.79. From March 2002 to June
2008, oil prices maintained a prolonged, steady upward rise to a record high of $151.72 per
barrel in a June 2008 price spike. This spike was short-lived, though, and prices plummeted to
$46.86 by January 2009. The price rose quickly over the course of the next year, hitting a
peak of $119.51 per barrel by April 2011.

The price of oil has been on a largely downward path since 2011, hitting a low of $28.00 per
barrel in January 2016, a low that had not been seen in a decade. Since January 2016, the
price has mounted a modest comeback and is currently just over $50 per barrel.
If oil is viewed simply as a commodity, its volatility can be explained simply enough by a
constantly shifting array of market factors that include a) economics, including the laws of
supply, demand and price; b) geological science; and c) technological innovation. Taken
together, these elements present an endless combination of effects on the direction of oil
prices and of the oil industry.
But oil is more than a commodity. It is also a critical element of GDP, an instrument of finance
and monetization, a contributor to fiscal and trade balance (and imbalance) and a political
weapon.
Oil prices and the direction of the industry are shaped by an array of external forces that
have historically included a) regional and global economics (as measured by GDP,
globalization, finance, trading, and monetary events and trends); b) the quality of GDP
growth; c) national politics and geopolitics, which can be shaped by war, terrorism,
leadership changes, fiscal balance and popular unrest; d) competition within the oil industry
itself and with other forms of energy, including competition driven by technology, weather
and policy choices; and e) a recent wave of carbon-control initiatives at the global, national
and local levels.
The oil industry has a long history of contributing to global economic growth, wealth creation,
societal development and political organization. It has been a mainstay of the global
economy, political order and technological change.
Oil companies rely on enhanced revenues derived from price spikes to shore up their annual
balance sheets—improving net incomes, allowing for debt repayment, providing potential
for new capital investment, and funding payments to shareholders.
Price-spike revenue can cover operational expenses but also goes to investments in new
production (physical project add-ons and new research) and to payouts to investors. Striking
the right balance between these three elements is the key to strong company management.
Too much capital investment, for example, will create pressure to cancel future projects if
prices rapidly decline. Too much payout to investors can limit capital expenditures.
Operational expenses that aren’t tied to productivity are wasteful and take dollars away
from capital expenditures and investor payouts.
Good management turns price spikes to a company’s advantage.
Good management also anticipates the duration of rising or falling markets. Although price
spikes are common, they can be difficult to predict because they can be driven by any
number of a wide range of outside events as well as by the internal dynamics of the oil
industry itself.
The price spike of 2008 occurred against a backdrop of decisions by OPEC and other
producers to reduce production at precisely the time that worldwide demand, powered by
India and China, was rising. The imbalance (and price spike) that resulted was driven, in
short, by too much demand chasing too little oil on the market.1
The specific drivers of the short-lived spike in 2011 included the U.S. recovering from recession,
actions taken by the U.S. to weaken the dollar, and continued demand from China and
India.2
The point is, oil markets aren’t necessarily any more mysterious than most other markets, and
good oil-company management will position a company so that it—and its shareholders—
benefit from market changes.
A healthy revenue flow for an oil company covers costs of operations and new investment,
and produces profits. Different production plays have different cost structures, however.
Each play benefits and is punished as market prices rise and fall. For example, Canadian Oil
Sands projects require an oil price of $98 per barrel because these projects rely on very
expensive extraction processes. Oil shale, on the other hand, produce oil at a more
competitive price of around $70 per barrel, 3 and various conventional onshore and offshore
plays are profitable if prices are in the $40-to $60-per-barrel range.
The current price of oil—around $50—renders significant segments of the world’s oil
investments unprofitable.
The obvious question, then, is where oil prices will be in the months and years ahead.
In the short term, through 2017, some recovery is expected but prices will remain in the low
$50-per-barrel range.4 In the medium term, through 2020, the U.S. Energy Information
Administration, the World Bank5, and the International Monetary Fund see prices rising to
anywhere from $57 per barrel to $71.12 per barrel.6 Other analyses project a more robust
price increase to $95.7
1 Daniel Yergin, The Quest, New York: Penguin Press, 2011, p. 161-162. 2 http://www.ibtimes.com/rising-demand-should-push-crude-oil-prices-2011-252477 3 http://seekingalpha.com/instablog/910351-robert-p-balan/4877825-rystad-s-outlook-price-crude-oil-2025 4 https://knoema.com/yxptpab/crude-oil-price-forecast-long-term-2016-to-2025-data-and-charts 5 http://pubdocs.worldbank.org/en/328921469543025388/CMO-July-2016-Full-Report.pdf, p.29. 6 https://knoema.com/yxptpab/crude-oil-price-forecast-long-term-2016-to-2025-data-and-charts 7 http://seekingalpha.com/instablog/910351-robert-p-balan/4877825-rystad-s-outlook-price-crude-oil-2025

ExxonMobil CEO Rex Tillerson presented his perspective on future oil prices at the annual Oil &
Money conference in October 2016, stating that low prices are part of the financial
landscape for years to come.8
Any outlook for steadily rising prices is best tempered by the reality of geopolitics. Current
events are putting downward pressure on oil prices, and market structures and national
agreements that once drove the production and international pricing of oil are under
significant stress that is not likely to abate in the foreseeable future.9
Oil demand is also at issue, and ExxonMobil is an excellent case in point.
The company’s business model relies on continuous growth in demand for oil and natural
gas. While ExxonMobil’s long-term demand forecasts show robust growth for both,10 not
everyone is so optimistic.11 Bloomberg New Energy Finance (BNEF), for one, envisions stronger
consumer demand for electric cars, greater efficiency gains in energy consumption, and the
adoption of policy changes that favor renewables, and more investment in wind and solar
energy.12 Indeed, ExxonMobil’s overall long-term outlook for robust demand is contradicted
by its own analysis of energy intensity declines in every country in the world between now
and 2040.13
8 http://www.bloomberg.com/news/articles/2016-10-19/exxon-ceo-doesn-t-see-supply-shortage-pushing-up-oil-prices 9 http://www.theweek.co.uk/oil-price/60838/oil-price-slips-down-as-us-crude-stocks-grow 10 http://cdn.exxonmobil.com/~/media/global/files/outlook-for-energy/2016/2016-outlook-for-energy.pdf 11 http://www.bloomberg.com/news/articles/2015-11-06/the-oil-industry-has-been-put-on-notice 12 http://www.bloomberg.com/news/articles/2016-02-24/another-oil-crash-is-coming-and-there-may-be-no-recovery 13 http://cdn.exxonmobil.com/~/media/global/files/outlook-for-energy/2016/2016-outlook-for-energy.pdf, p. 77.

The oil industry dominated stock markets in the decades after World War II, and by 1980
seven of the ten biggest stocks in the S&P 500 were oil companies.14
ExxonMobil has remained a stalwart ever since. In the mid-1990s the company continued to
lead the Standard and Poor’s Index with solid performance. It was the No. 1 company, by
stock market capitalization, in the Standard and Poor’s 500 from 2006-2011, when its financial
performance, rising stock price, and strong share distributions outpaced that of any other
company in the index.
Today ExxonMobil15 is the only oil company in the S&P 500 top 10, where it is the third-largest
company.16 Information-technology, consumer, financial, and telecommunications
companies make up the rest.
This shift in market-capitalization rankings by industry demonstrates a broadening and
diversification of the market.
14 http://etfdb.com/history-of-the-s-and-p-500/#1980. For a more comprehensive treatment of significant drivers of oil and gas investments see the June 2016 report by As You Sow, Unconventional Risks: The Growing Uncertainty of Oil Investments: http://www.asyousow.org/wp-content/uploads/2016/07/AS-YOU-SOW-REPORT-OIL-INDUSTRY-FUNDAMENTALS-WEAKENING-UNDER-STRUCTURAL-PRESSURE_201607134.pdf 15 A list of the company’s 50 largest institutional investors can be found in Appendix III. 16 http://us.spindices.com/indices/equity/sp-500, Standard and Poor’s 500 Top 50, Factsheet, August 31, 2016, p. 3.

Figure 2: Change in ExxonMobil Stock Price and the S&P 500 Index, 2006-2016
Companies in other industries have grown at a faster pace and have become more
dominant by market capitalization—and by other measures—than ExxonMobil. Microsoft
and Apple, for instance, both have bigger market capitalizations than ExxonMobil, and
several other companies, none of which are in the energy industry, are not far behind
(among them Amazon, GE, and AT&T).
ExxonMobil’s stock performance has lagged the S&P 500 for the 10 quarters since January
2014,17 a period characterized by falling revenues, rising costs, declining net income,
decreasing cash reserves, rising indebtedness and diminished capital investment.
17 Yahoo Finance, Exxon Mobil Corporation (XOM)
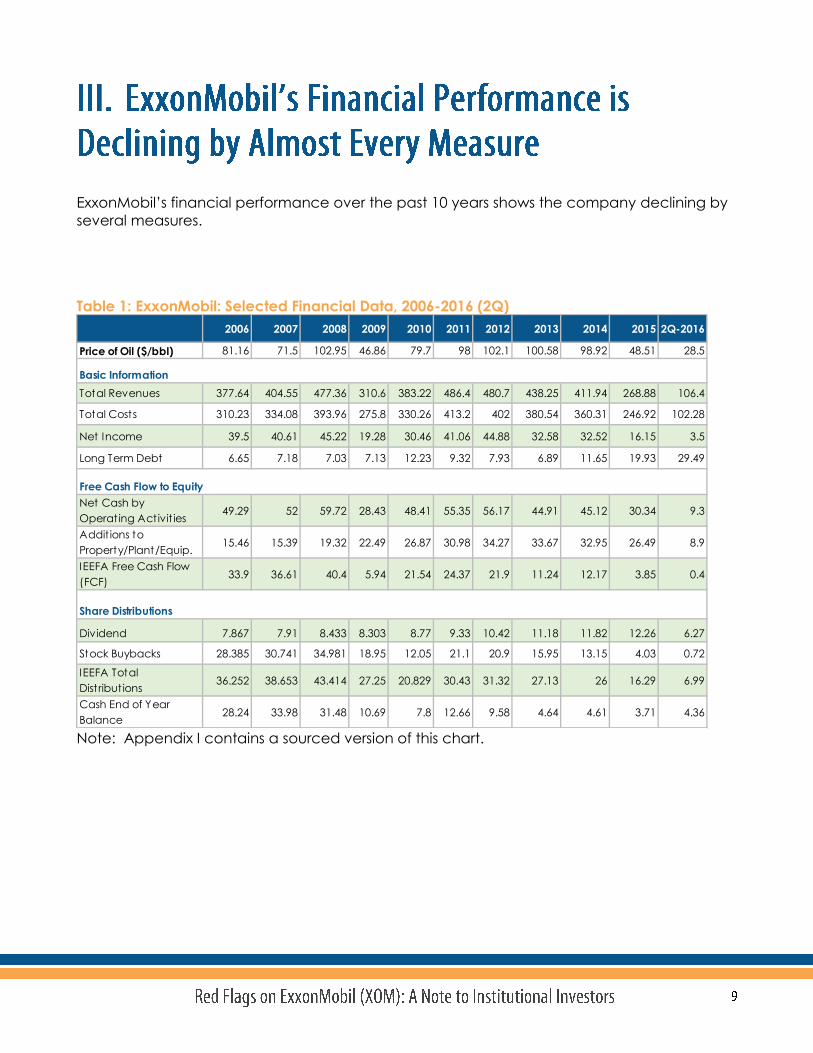
ExxonMobil’s financial performance over the past 10 years shows the company declining by
several measures.
Table 1: ExxonMobil: Selected Financial Data, 2006-2016 (2Q)
2006 2007 2008 2009 2010 2011 2012 2013 2014 2015 2Q-2016
Price of Oil ($/bbl) 81.16 71.5 102.95 46.86 79.7 98 102.1 100.58 98.92 48.51 28.5
Total Revenues 377.64 404.55 477.36 310.6 383.22 486.4 480.7 438.25 411.94 268.88 106.4
Total Costs 310.23 334.08 393.96 275.8 330.26 413.2 402 380.54 360.31 246.92 102.28
Net Income 39.5 40.61 45.22 19.28 30.46 41.06 44.88 32.58 32.52 16.15 3.5
Long Term Debt 6.65 7.18 7.03 7.13 12.23 9.32 7.93 6.89 11.65 19.93 29.49
Net Cash by
Operating Activit ies 49.29 52 59.72 28.43 48.41 55.35 56.17 44.91 45.12 30.34 9.3
Addit ions to
Property/Plant/Equip.15.46 15.39 19.32 22.49 26.87 30.98 34.27 33.67 32.95 26.49 8.9
IEEFA Free Cash Flow
(FCF) 33.9 36.61 40.4 5.94 21.54 24.37 21.9 11.24 12.17 3.85 0.4
Dividend 7.867 7.91 8.433 8.303 8.77 9.33 10.42 11.18 11.82 12.26 6.27
Stock Buybacks 28.385 30.741 34.981 18.95 12.05 21.1 20.9 15.95 13.15 4.03 0.72
IEEFA Total
Distribut ions36.252 38.653 43.414 27.25 20.829 30.43 31.32 27.13 26 16.29 6.99
Cash End of Year
Balance28.24 33.98 31.48 10.69 7.8 12.66 9.58 4.64 4.61 3.71 4.36
Share Distributions
Basic Information
Free Cash Flow to Equity
Note: Appendix I contains a sourced version of this chart.

Figure 3: ExxonMobil: Total Revenues 2006-2015
ExxonMobil’s revenues peaked at $486 billion in 2012 and have fallen significantly since then.
The company reported $268 billion in revenues in 2015, a 45 percent decline from the
previous year, the poorest revenue performance in the 10 years covered in this report.
Reported earnings through the second quarter of 2016 suggest that the persistence of low oil
prices will continue to erode the company’s revenues.
ExxonMobil’s costs of production for its oil, bitumen and synthetics segments, which are
reported in its annual 10K, dropped in 2015. This was after a period where the cost of
production for oil had risen by 85% and the cost of production for bitumen had increased by
144% since 2007. Synthetics increased from 33% during the same period.

ExxonMobil’s annual average net income has averaged $34 billion over the past decade.
The company’s net income peaked in 2012 at $45 billion and hit a decade low of $16 billion
in 2015. ExxonMobil’s net income for the first two quarters of 2016 is $3.5 billion.
Figure 4: ExxonMobil: Net Income 2006-2015
As shown in the table above, the company reported a precipitous drop of $25 billion in net
income between 2008 and 2009. Then, as oil prices spiked back up, the company’s position
improved. It is worth noting, though, that during periods when the price of oil was at or
above $100 per barrel, ExxonMobil’s net income rose above $40 billion, while in 2013 and
2014, even though oil prices were at or near $100 per barrel, the company’s net income was
a relatively low $32.5 billion.
Net income eroded further in 2015 and the second quarter of 2016 with declines in oil prices,
indicating the company is on track to reporting two consecutive years of reporting record-
low net income.

ExxonMobil’s annual capital outlays peaked at $34 billion in 2012, at the height of the most
recent spike in oil prices. In 2015, the company announced a reduced level of capital
expenditures, to $26.5 billion, and its guidance for 2016 was that it would log $23 billion in
capital expenditure. In its 2016 end-of-second-quarter results, however, the company
acknowledged that its capital spending has been less than planned. 18
ExxonMobil‘s overall reduction in capital expenditures is in line with a worldwide industry
trend. An April 2016 analysis by Wood MacKenzie showed 47 oil companies reducing capital
expenditures19, a move meant to help these companies weather a time of weak prices for
oil.
Figure 5: Change in Upstream Capital Budget (2015 to 2016), 49 Oil Companies
18 Jeffrey Woodbury, Vice President, Investor Relations, in response to question from Wolfe Research.
http://seekingalpha.com/article/3993326-exxon-mobil-xom-q2-2016-results-earnings-call-transcript?page=9 19 http://oilprice.com/Energy/Crude-Oil/91-Billion-In-Capex-Cuts-A-Serious-Hangover-For-Oil.html

This comes at the cost of a diminished outlook for future revenues, asset valuations, and stock
price. At its heart, a reduction in capital expenditures is a measure of how an oil company
views the potential profitability of projects in its pipeline. It flows from a company’s analysis of
future price of oil and costs of production. The recent worldwide reduction in capital
expenditures by oil companies suggests that the industry will be smaller in the future. 20
This is particularly true in Canada, where oil companies have cut back expansions of the oil
sands development. From 2010-2012, oil sands developers announced aggressive plans to
expand.21 Since then, capital spending in the oil sands industry is down and is expected to
decline by over 30% in 2016. Imperial Oil (an ExxonMobil subsidiary)22 has announced it will
reduce its capital expenditures in each of the next four years.23 It has also recently
announced progress on two new oil sands investments it says will be commercially viable by
2020. Imperial Oil says these projects will be viable in a price environment of $50-$60 per
barrel. 24 It is unclear whether these targets can be met, since Canadian Oil Sands projects
generally require an oil price of $98 per barrel, or if these project economics would be
applicable to other projects in ExxonMobil’s pipeline.
20 https://sputniknews.com/business/201510151028573056-us-shale-oil-producers-forecasts/ 21 http://ieefa.org/report-material-risks/ 22 http://corporate.exxonmobil.com/en/company/worldwide-operations/locations/canada/about/overview 23 http://business.financialpost.com/news/energy/imperial-oil-predicts-demand?__lsa=7de6-e976

ExxonMobil has historically relied less on long-term borrowing (and more on its strong cash
position) to deliver profits and support investment in new income-producing assets. From 2006
to 2013, ExxonMobil’s annual average long-term debt was $8 billion. It increased from $6.89
billion in 2013 to $29.49 billion through the second quarter of 2016.25
Figure 6: ExxonMobil: Long Term Debt 2006-2015
In April 2016, Moody’s Investors Services and Standard and Poor’s downgraded the
ExxonMobil, both for the first time in 30 years. A Standard and Poor’s analyst offered this
assessment:
“The company’s debt level has more than doubled in recent years, reflecting high
capital spending on major projects in a high commodity price environment and
dividends and share repurchases that substantially exceeded internally generated
cash flow.” 26
These downgrades, coming at a time of increased reliance on long term debt, compound
the cost of the borrowings. 27
25 ExxonMobil lists its total borrowing at $44.5 billion inclusive of long term and current liabilities.
http://cdn.exxonmobil.com/~/media/Global/Files/Earnings/2016/news_supp_earnings_2q16_2.pdf 26 https://www.ft.com/content/a37a80bc-0bc0-11e6-9456-444ab5211a2f 27 http://www.bloomberg.com/news/articles/2016-04-26/exxon-mobil-loses-top-credit-rating-it-held-since-depression

ExxonMobil’s end-of-year cash balances have eroded over the last decade. From 2006-
2008, the company maintained year-end cash balances of about $30 billion. From 2009 to
the present, cash balances never exceeded $13 billion. The company ended 2015 with cash
balances of $3.71 billion.
Figure 7: ExxonMobil: End of Year Cash Balances 2006-2015
Despite the company’s emphasis on cost control and capital-expenditure reductions, the
downturn in oil prices has served to outpace these initiatives and to affect net income and
other critical financial measures.

A company’s payout to investors through dividends and share buybacks is considered a
fundamental measure of the success or failure of a company’s management and its board
of directors. Despite the oil-market downturn, ExxonMobil has remained committed to paying
steady, modest increases in shareholder dividends.28
Since 2006, ExxonMobil has paid its shareholders an aggregate of $302.7 billion. While the
average payout during these 10 years was $30 billion, actual annual distributions to
shareholders declined significantly, from a peak in 2008 of $43.4 billion to a low of $16.29
billion in 2015.
These shareholder payments have consisted of $205 billion in share buybacks and $97.7
billion in dividends. ExxonMobil has announced it will end its longstanding policy to return
cash to shareholders principally through the mechanism of stock buybacks, reducing that
payment to zero in 2016. ExxonMobil paid $94 billion in share buybacks from 2006-2008,
averaging $31 billion per year. For the remaining seven years of the decade, stock buyback
distributions averaged $15 billion.
28 http://cdn.exxonmobil.com/~/media/global/files/investor-reports/2016/2016_proxy_statement.pdf, p. 65
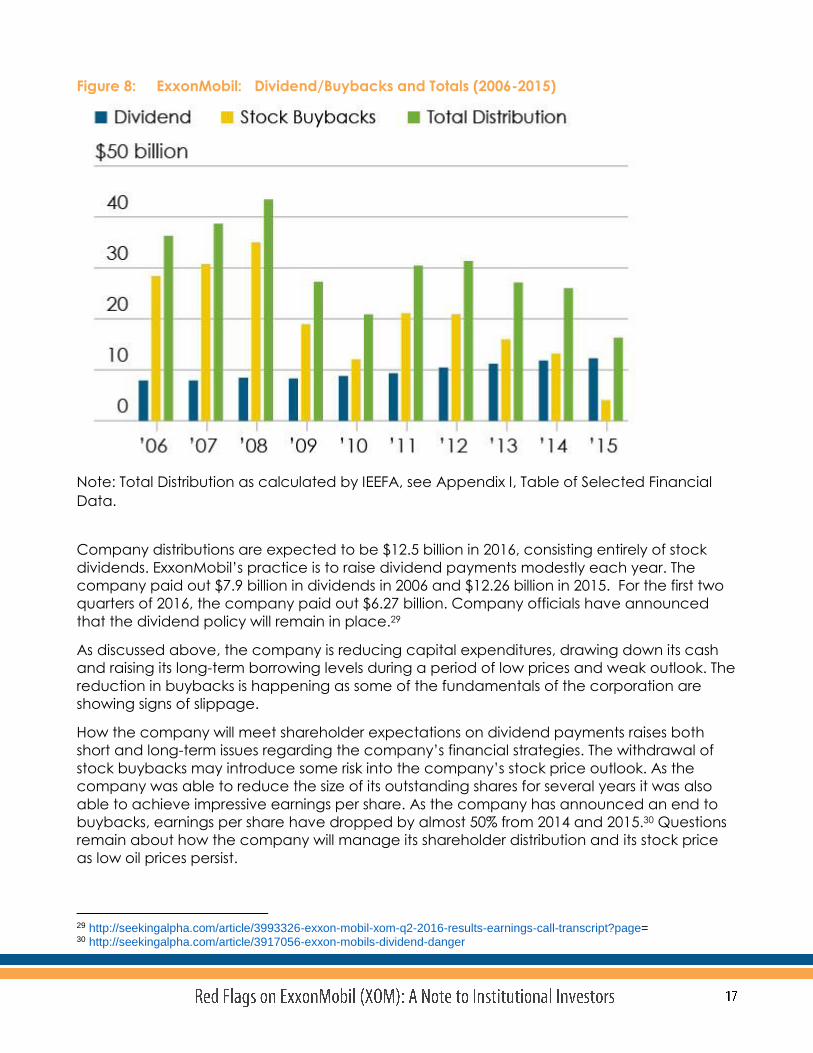
Figure 8: ExxonMobil: Dividend/Buybacks and Totals (2006-2015)
Note: Total Distribution as calculated by IEEFA, see Appendix I, Table of Selected Financial
Data.
Company distributions are expected to be $12.5 billion in 2016, consisting entirely of stock
dividends. ExxonMobil’s practice is to raise dividend payments modestly each year. The
company paid out $7.9 billion in dividends in 2006 and $12.26 billion in 2015. For the first two
quarters of 2016, the company paid out $6.27 billion. Company officials have announced
that the dividend policy will remain in place.29
As discussed above, the company is reducing capital expenditures, drawing down its cash
and raising its long-term borrowing levels during a period of low prices and weak outlook. The
reduction in buybacks is happening as some of the fundamentals of the corporation are
showing signs of slippage.
How the company will meet shareholder expectations on dividend payments raises both
short and long-term issues regarding the company’s financial strategies. The withdrawal of
stock buybacks may introduce some risk into the company’s stock price outlook. As the
company was able to reduce the size of its outstanding shares for several years it was also
able to achieve impressive earnings per share. As the company has announced an end to
buybacks, earnings per share have dropped by almost 50% from 2014 and 2015.30 Questions
remain about how the company will manage its shareholder distribution and its stock price
as low oil prices persist.
29 http://seekingalpha.com/article/3993326-exxon-mobil-xom-q2-2016-results-earnings-call-transcript?page= 30 http://seekingalpha.com/article/3917056-exxon-mobils-dividend-danger
Free cash flow is the cash available to a company after it has paid all of its expenses and
invested in its capital project pipeline. It is the cash that can be distributed to shareholders.
It is a useful financial indicator because it drives decision-making on profit distribution. It is also
a good measure of long-term financial performance, as the calculation places fluctuations
in capital-expenditure spending and investment policy in a larger financial-performance
context.
Free cash flow analysis is developed from a company’s 10K cash flow statement. IEEFA uses a
simple calculation to determine free cash flow,31 subtracting annual capital expenditures
(additions to property/plant and equipment) from net cash from operating activities. The
balance represents the free cash flow.
Net cash from operating activities is derived by taking the net income figure from the income
statement and adjusting it to account for non-cash expenses like depreciation and for
drawdowns from working capital reserves.
Like the net income measure discussed above, ExxonMobil’s free cash flow has deteriorated
over the last decade. From 2006-2008, free cash flow averaged $37 billion annually. Since
then it has averaged $14 billion annually. Free cash flow hit a decade low of $3.85 billion in
2015.
The decline of ExxonMobil’s free cash flow is driven by declines in net operating cash during
the period combined with relatively high capital expenditures. Company capital
expenditures averaged approximately $16 billion between 2006 and 2008, and rose to an
annual average of $30 billion from 2008 to the present.
31 Appendix I: A comparison of FCF methods showing strengths and weaknesses of each. We include a brief analysis of
Exxon’s own Free Cash Flow analysis.

Figure 9: ExxonMobil: Net Income, Shareholder Distributions and Free Cash Flow 2006-2015 ($ billions)
The relatively constant size of ExxonMobil’s payments to shareholders from 2006 to 2014, and
the benefits investors derived from them, have served to mask what is in reality an
unsustainable practice of distributing cash to shareholders.
IEEFA’s analysis shows that ExxonMobil’s annual shareholder distributions have exceeded its
free cash flow in nine of the last ten years.
In order to maintain investor support, the company paid out high shareholder distributions
based not on the amount of annual cash produced from its business operations,32 but by
drawing on internal cash reserves, asset sales and by borrowing to pay dividends.
If ExxonMobil were operating in a relatively high oil price environment, and costs were stable,
this practice could be manageable. But the current low price environment exposes the
unsustainable nature of this practice and exposes underlying financial stress.
32 Using a somewhat different financial metric Goldman Sachs has also recently concluded that the oil industry, including
ExxonMobil has seen its return on capital deteriorate over the last decade: http://www.bloomberg.com/news/articles/2016-09-19/big-oil-was-never-that-big-a-money-maker-goldman-sachs-says

Through the second quarter of 2016, company free cash flow equaled $400 million, and its
dividend outlays were $6.27 billion, notwithstanding management strategies, board policy
and accounting treatments aimed at correcting this imbalance. During this same period, as
shown in the chart above, the company’s net income declined to $3.5 billion. And during
that same quarter the company added $11.96 billion in long-term debt.
The convergence of a down market and rising concerns over climate-change risk have
caught the eye of securities regulators and focused their attention on ExxonMobil.33 The
office of the New York Attorney General and the Securities and Exchange Commission (SEC)
are both investigating ExxonMobil. While we cannot know the full scope of these
investigations, questions have emerged as to whether ExxonMobil has appropriately valued
its reserves in the wake of significant oil price declines (and other factors) and whether the
company concealed its climate-change research from its investors.
Every major oil company other than Exxon has written down assets on their balance sheets as
a result of the down market, capital-expenditure reductions and weak price outlooks.34
ExxonMobil is alone among these companies in its view that the current market has not
impaired the value of its reserves.35 In defending its stance, the company points to what it
says is its conservative valuation methods and its long-term investment outlook.
In other words, ExxonMobil is reassuring investors that every barrel of oil listed in its corporate
filings is economically extractable, and its reserves can meet the company’s goal of
producing revenue that covers operations, financing and profits. The assessment is based
largely on the company’s outlook regarding oil prices and its cost-of-production outlook. The
validity of this investment thesis will be tested by time and financial results and determine
whether shareholders maintain confidence in management’s ability to invest prudently and
efficiently.
The company outlines its relevant policies in several documents.36 It states that it does not
adjust proven and probable reserves for temporary price declines. Recent company
statements express some concern over the low price environment. However, at the end of
2015, the company conducted an impairment review and asserted that its valuations are
within a range that does not require downward adjustments.
ExxonMobil’s public defense of its practices creates a conundrum for regulators and
investors. If ExxonMobil has policies that are uniquely different from other companies in the
industry, does its accounting treatment run afoul of uniform standards designed to foster
33 http://www.bloomberg.com/news/articles/2016-09-16/n-y-said-to-be-probing-exxon-s-valuation-of-oil-reserves 34 http://www.bloomberg.com/news/articles/2016-07-29/chevron-extends-losing-streak-as-prices-reel-under-glut-s-weight
and https://www.ft.com/content/fb178154-7faa-11e6-8e50-8ec15fb462f4 35 http://www.wsj.com/articles/sec-investigating-exxon-on-valuing-of-assets-accounting-practices-1474393593 36 http://cdn.exxonmobil.com/~/media/global/files/investor-reports/2016/2015_Financial_Statements.pdf, p.22-24.

comparisons between companies, industries and nations? Or if the company’s standards
are not so dissimilar from its competitors, then why has it not responded to declining market
conditions by making asset impairments and/or debooking assets?
The company originally stated that it is complying with the New York attorney general’s
subpoenas.37 And although it had asserted that the attorney general’s investigation into its
climate-change research is politically motivated,38 it had agreed to cooperate39 with the
recent extension of the investigation into the company’s reserve accounting.40 On October
18, 2016, however, ExxonMobil filed a motion in federal court in Texas to quash the NYS
Attorney General’s subpoena.41
The company has pledged to cooperate with a recently disclosed investigation by the SEC
and has made public assurances that it meets all accounting and disclosure standards.42
In August43 Rep. Lamar Smith of Texas (ExxonMobil’s home state), chairman of the House
Committee on Science, Space and Technology in concert with other members of Congress,
issued subpoenas to the New York and Massachusetts attorneys general44 (which is also
conducting an investigation) and to eight environmental organizations. The Smith inquiry
aims ostensibly to protect ExxonMobil’s right to express its views on climate change. In
September, Smith wrote to the SEC expressing skepticism of its ExxonMobil inquiry and
requesting documents and additional information.45
The SEC and the NYS Attorney General have different institutional mandates, although they
sometimes overlap. The SEC enforces the U.S. securities laws,46 which are designed to protect
investors, to maintain fair, orderly and efficient markets, and to facilitate capital formation.
37 http://www.bloomberg.com/news/articles/2016-09-07/will-exxonmobil-have-to-pay-for-misleading-the-public-on-climate-
change 38 https://energyfactor.exxonmobil.com/perspectives/exxonmobil-responds-state-ags/ 39 http://www.reuters.com/article/us-exxon-mobil-probe-idUSKCN11M113 40 http://www.bloomberg.com/news/articles/2016-09-16/n-y-said-to-be-probing-exxon-s-valuation-of-oil-reserves 41 http://www.bloomberg.com/news/articles/2016-10-18/exxon-decides-to-fight-new-york-s-climate-change-probe 42 http://www.bloomberg.com/news/articles/2016-09-20/exxon-s-accounting-said-to-prompt-sec-review-after-oil-slump 43 https://science.house.gov/news/press-releases/smith-subpoenas-ma-ny-attorneys-general-environmental-groups 44 The Massachusetts Attorney General and several other Attorneys General are part of litigation over the investigations into
Exxon. https://insideclimatenews.org/news/09082016/massachusetts-ag-maura-healey-criticizes-exxon-continuing-climate-deceit
45 https://science.house.gov/sites/republicans.science.house.gov/files/documents/09-29-16%20CLS%20-%20Securities%20and%20Exchange%20Commission.pdf
46 A good succinct summary of the law, related legislation and the administrative and enforcement structure for securities law oversight can be found at: https://www.sec.gov/about/whatwedo.shtml
The New York State Martin Act47 empowers the attorney general to investigate deceptive
market practices in the securities industry.
The SEC’s has a broader mandate on securities regulation, including deceptive practices,
while the attorney general’s mandate is broader in terms of securities fraud.48 Each is
empowered to enforce compliance through corrective actions, criminal prosecution and
the imposition of fines.
ExxonMobil’s seeming acceptance of the SEC investigation but its more strident position
toward the New York attorney general 49 misconstrues the functions of each organization. In
this case, the SEC’s announcement of a review represents a validation of the New York
attorney general’s investigation.50 It also likely indicates that the agencies will coordinate
their inquiries. These investigations may well trigger Congressional inquiries, which will likely
heighten the controversy and intensify investor risk.
While most institutional investors are well versed in the SEC’s role in securities regulation, they
are often less familiar with New York State’s Martin Act. The Martin Act, which grew out of
New York City’s role as the financial capital of the world, is unlike any other state law in the
U.S.
The law, which passed in 1921, pre-dated both the stock market crash of 1929 and the
passage of federal securities law in the 1930’s. As the growing economy in the early
twentieth century sought to obtain capital from an organized market, fraudulent schemes
proliferated under the guise of stock sales, and get- rich-quick schemers bilked investors. The
Martin Act struck a political compromise between those who were seeking securities
registration as the basis for organized markets and the securities industry which resisted this
level of regulation. The compromise gave the attorney general a mandate to investigate
fraud where it was found. Critics said the Martin Act empowered a watchdog, but one with
“false teeth.” 51
Attorney General Albert Ottinger (1925-1929) was the first to use the law aggressively52 to shut
down a fraudulent “exchange,” then also known as a bucket shop.
The law has become stronger over time, and was amended in 1955 at the request of then-
Attorney General Jacob Javits (1955-1957) to expand the definition of fraudulent activities
and to give the attorney general the right to pursue criminal enforcement. From then until
47http://www.ag.ny.gov/sites/default/files/pdfs/bureaus/investor_protection/library/NY%20Gen%20Bus%20Law%20Article%2
023-A.pdf 48 For a brief legal comparison see: http://digitalcommons.law.umaryland.edu/cgi/viewcontent.cgi?article=1010&context=jbtl 49 http://www.bloomberg.com/news/articles/2016-09-16/n-y-said-to-be-probing-exxon-s-valuation-of-oil-reserves 50 Congressman’s Smith letter to the SEC expresses frustration on just this point, that the SEC’s line of inquiry validates
what he sees as a meritless investigation by the New York State Attorney General:. https://science.house.gov/sites/republicans.science.house.gov/files/documents/09-29-16%20CLS%20-%20Securities%20and%20Exchange%20Commission.pdf
51 https://www.legalaffairs.org/issues/May-June-2004/feature_thompson_mayjun04.msp 52 For a scholarly treatment of early implementation of the Martin Act and the market context for Ottinger’s actions see:
http://www.hup.harvard.edu/catalog.php?isbn=9780674417021, pp. 194-198.

the election of Eliot Spitzer forty years later, the law was used mostly in low profile, small fraud
cases.53 Attorneys General Spitzer (1999-2007) and Andrew Cuomo (2007-2011) both used the
law to look at larger systemic issues involved with Wall Street and its stakeholders.
The legislative history and use of the law by successive attorney’s general cannot be
separated from the fact that the Attorney General is a state-elected official.54 New York
attorneys general – both Republicans and Democrats -- have been elected (rather than
appointed), and thus accountable to the people, since 1846.
The attorney general’s office carries out many ministerial functions for the State of New York
and works closely with the governor and other branches of government to defend the
interests of the State of New York. The broad mandate of the office and the changing nature
of public issues has led successive attorney’s general to pursue consumer advocacy in both
the public and private sector, address organized crime influence, combat Medicaid fraud,
police nursing home and charities abuses, enforce labor laws, and enforce environmental
mandates related to clean water, clean air, and out-of-state power plants. For example,
Attorney General Spitzer’s use of the Martin Act was developed in response to Wall Street
scandals that had a specific resonance in New York State.55
The current NYS Attorney General’s actions related to ExxonMobil have taken place against
this backdrop of institutional mandates, tradition and emerging issues.
ExxonMobil is based in Irving, Texas, but its reach is global. It has significant reserves on
several continents, and the company’s history is one of superior innovation in the oil, natural
gas and petrochemical fields. This record allows the company to attract and keep top
talent. ExxonMobil has been a reliable partner to significant segments of the economy in
most of the countries where it has an interest.
Its position as an industry leader—perhaps the industry leader—gives it considerable political
influence nationally and abroad. The company has its own set of institutional requirements
and interests.
The company has historically managed much of its political affairs in the U.S. through its
Washington, D.C. office, in close coordination with corporate headquarters in Texas.56
ExxonMobil employs a staff to monitor and intervene in Washington public policy matters. Its
staff lobbies, networks and oversees political contributions. The company also retains groups
of lawyers and other operatives to assist in managing its interests.
53 https://www.legalaffairs.org/issues/May-June-2004/feature_thompson_mayjun04.msp 54 For a scholarly treatment of the New York State Attorney General as a political institution in NYS government see:
http://www.oxfordhandbooks.com/view/10.1093/oxfordhb/9780195387230.001.0001/oxfordhb-9780195387230-e-12 55 https://books.google.com/books/about/Impact_of_the_corporate_scandals_on_New.html?id=ys5YAAAAYAAJ 56 Steve Coll, Private Empire: Exxon Mobil and American Power, Penguin Books, New York, 2012, pps. 73-77.

ExxonMobil representatives regularly comment on public policy proposals57 as they affect the
company and the oil industry and participate in various industry trade and lobbying groups.
Company commentary usually assesses actions that might be adverse to the company’s
interests in areas that include taxation of oil industry profits58 and policy toward climate
change. The company has opposed certain climate-related initiatives, such as the Kyoto
Protocol, which was adopted in 1997 but never ratified by the U.S., and the Waxman Markey
cap-and-trade American Clean Energy Security Act, which was defeated in 2010.59
ExxonMobil regularly contributes to political campaigns60 through a system of direct
corporate and Political Action Committee expenditures. Those expenditures, with some
exceptions, are approved by the chairman of the board and reviewed periodically by the
full board.61
The company engages frequently with federal financial regulatory agencies like the
Securities and Exchange Commission over issues including booked reserves,62 oil sands
classification and the company’s conduct of its global affairs.
The company has been involved in a series of social controversies over the years that include
local environmental impacts, climate change, human rights, and lobbying practices.
These issues are often brought to the attention of the board of directors through shareholder
resolutions, especially when public policy debates and other forms of conflict resolution have
proven inadequate. The company’s 2016 proxy includes an illustrative combination of such
issues, including climate change, lobbying practices, hydraulic fracturing, fair compensation
of women employees, and shareholder distributions.
ExxonMobil’s management generally opposes shareholder initiatives. The company has
received a fair share of criticism over the years regarding climate change, corporate
governance, executive compensation, oil spills, and its treatment of shareholders.63
Management reluctance to engage with shareholders has sometimes caused difficulties,
Blackrock, which is the world’s largest single asset manager and owns 5.8% of the shares of
ExxonMobil,64 has taken the extraordinary step of voting against two of management’s
proposed appointments to the board. (Blackrock had evidently objected to certain capital-
allocation and strategy decisions.65)
The company’s CEO and management team are held by the board to performance and
executive compensation policies and practices. Executive compensation is broadly set
around seven benchmarks: Safety, Return on Average Capital Employed, Total Shareholder
57 http://corporate.exxonmobil.com/en/current-issues/accountability/political-contributions-and-lobbying/political-contributions-
and-lobbying 58 http://www.exxonmobilperspectives.com/2011/04/28/exxonmobil-earnings-the-real-story-you-wont-hear-in-washington/ 59 http://www.exxonmobilperspectives.com/2015/11/19/more-backtracking-by-insideclimate-news/ 60 Shareholder interest in the political contributions of companies has grown in recent years, see:
https://www.osc.state.ny.us/press/releases/mar15/032315.htm 61 http://corporate.exxonmobil.com/en/current-issues/accountability/political-contributions-and-lobbying/political-contributions-
and-lobbying 62 For some of the history of ExxonMobil’s history with the SEC and the substantive regulatory involved see: Coll, p. 188-
194. 63 http://www.washingtonpost.com/wp-dyn/content/article/2006/05/31/AR2006053102050.html 64 http://cdn.exxonmobil.com/~/media/global/files/investor-reports/2016/2016_proxy_statement.pdf 65 http://www.reuters.com/article/us-exxon-directors-blackrock-idUSKCN11417F

Returns, Free Cash Flow, Shareholder Distributions, Strategic Business Results and Project
Execution.66
The board and staff manage investor relations, suppliers, finance, research and
development, and relations with elected officials, heads of state and regulators. The board is
organized into seven committees: Executive, Audit, Compensation, Public Issues and
Contributions, Finance and Board Affairs.
ExxonMobil, like the New York State Attorney General and the Securities and Exchange
Commission carries out its business mission in a particular operating environment. Each
institution has a mission and governing philosophy rooted in its history and role in society.
Each institution is held accountable: the NYS Attorney General to the people of New York
State and ExxonMobil to its employees, shareholders and community at large.
ExxonMobil’s financial distress has sent one red flag to investors. The climate issue has
mushroomed and sends a second red flag. The recently announced investigations and the
company’s response have sent a third red flag.
How have the company’s finances deteriorated so dramatically? How has the company
now drawn securities regulators to scrutinize its operations? What management actions have
led up to these twin controversies?
While ExxonMobil is defending its rights, shareholders have rights also. Two lines of investor
inquiry are strongly indicated at this time: first, into ExxonMobil’s finances, which show clear
evidence of current and ongoing stress; and second, into revelations regarding the
company’s research on climate change and the investor risk this issue raises.
66 An extended discussion of Exxon’s executive compensation and corporate performance issues can be found in
http://cdn.exxonmobil.com/~/media/global/files/investor-reports/2016/2016_proxy_statement.pdf

a. The CEO of Imperial Oil (an ExxonMobil subsidiary) is preparing for a world in
which oil will price at $50 to $60 per barrel.67 Please provide appropriate
memoranda and spreadsheets to document the basis for this assumption.
b. Please provide appropriate memoranda and spreadsheets that demonstrate
how a $50 to $60 per barrel long-term price will impact ExxonMobil’s overall
production, revenues, cost of production, net income, capital expenditures,
long-term debt, cash balances, free cash flow, and shareholder distributions
(share buybacks and shareholder dividends).
c. How will ExxonMobil’s capital spending be affected by a long-term oil price
range of $50 to $60 per barrel? What levels of spending are to be expected
under such circumstances? How would ExxonMobil’s project pipeline be
affected? Please provide appropriate background documents.
d. Please provide a series of scenarios for ExxonMobil's production and price
forecasts in the face of solar and wind adoption at increasing levels of market
penetration and at more rapid growth rates than currently acknowledged by
the company in its 2040 outlook.
e. Please provide a set of scenarios for ExxonMobil’s production that
accommodate the implementation of the Paris Agreement on climate
change. This should include a range of expectations for electric vehicle and
other non-fossil-fuel transportation technology adoption rates and solar, wind,
storage and demand response strategies that lead to the emissions reductions
required to meet the Paris goals of keeping global average temperatures “well
below 2 OC and pursuing 1.5 OC.”
a. ExxonMobil’s revenues peaked in 2012 at $468 billion. In 2015, revenues fell to $268
billion. Based on the first two quarters of this year, 2016 will likely finish with weak
revenue performance. What specific actions is management taking to turn around
the revenue picture in the areas of crude oil, natural gas, bitumen and synthetics?
b. Please provide a one-, three-, five- and ten-year scenario on ExxonMobil’s forecast
for prices it will receive for its products and relevant market benchmarks.
67 http://business.financialpost.com/news/energy/imperial-oil-predicts-demand?__lsa=7de6-e976

c. Please provide ExxonMobil’s analysis of the decline in the cost of production over
the past year, the drivers of the decline and the outlook for future savings.
d. Recently the CEO of Imperial Oil 68 announced two oil sands projects that would
produce profits at $50-$60 per barrel. The two projects are expected to be
commercially operational in 2020. Please provide a memorandum with charts that
estimate the cost of production for ExxonMobil’s entire bitumen portfolio.
e. ExxonMobil has announced reduction in its capital spending through at least
2020.69 Please identify which areas of the planned expenditures are likely to be
reduced, listed by operational units, project name and location.
f. Has ExxonMobil responded directly to the recent downgrades by Standard and
Poor’s and Moody’s? Please provide any and all written documents ExxonMobil
sent to these credit agencies in response to the downgrades. Please also provide
any and all presentations made to the Board of Directors on these downgrades
and any related to long-term debt in general.
g. ExxonMobil has recently identified its long-term outlook as a key element in
determining the valuation of its proven and probable reserves. Please provide a
statement as to the company’s definition of “long term” when as it applies to
company accounts for its proven and probable reserves.
h. ExxonMobil has recently stated that its valuation methods are more conservative
than those of its competitors. Although its competitors have written off the value of
their assets in the down market, ExxonMobil’s internal valuation assessments
apparently do not indicate any need to write down its oil and gas reserves. Please
provide detailed memorandums, board presentations, spreadsheets and legal
opinions that support ExxonMobil’s valuation methodologies and those of its
competitors.
a. ExxonMobil over the past 10 years has produced on average $30 billion per year in
shareholder distributions with approximately $20 billion in share buybacks and the
remainder in dividends. In 2016 the company announced it would no longer buy
back shares of stock. Please provide memoranda and spreadsheets that outline
what impact the loss of stock buybacks will have on per-share earnings for
investors. Are per-share earnings for the coming decade likely to be lower than
were for the previous decade?
b. Does ExxonMobil recognize any risks to its stock value from the policy to end stock
buybacks? If so, please provide documentation.
c. Company management has stated that it remains committed to dividend
payments for investors.70 The company has maintained its dividend payment at a
68 http://www.cbc.ca/news/canada/calgary/imperial-oil-oilsands-plants-aspen-cold-lake-1.3773167 69 http://www.bloomberg.com/news/articles/2016-03-02/exxon-mobil-plans-to-reduce-capital-spending-through-end-of-2017 70 http://www.bloomberg.com/news/articles/2016-03-02/exxon-mobil-plans-to-reduce-capital-spending-through-end-of-2017

time when net income and free cash flow has deteriorated. It has also increased
borrowing and asset sales during this period. The company’s second quarter
statement71 shows operating income does not cover both expenses and dividend
payments for the first six months of 2016. Please provide appropriate
documentation that demonstrates how this strategy of maintaining the dividend is
sustainable. Please include in any explanation whether ExxonMobil’s significant
increase in long-term borrowing is likely to result in a permanent increase in
ExxonMobil’s long term indebtedness. In addition, please describe if ExxonMobil
intends to maintain minimal end-of-year cash balances net of borrowed proceeds
in the future.
Since 2012, ExxonMobil has lagged the S&P 500 after having led the index over last several
decades. Please provide a detailed analysis of why the company’s position has slipped so
substantially. Please also discuss the company’s plan to move forward—if it has one—and to
improve its financial performance.
1. Investigative news reports suggest ExxonMobil knew privately of the impacts of climate
change but continued to espouse a public position that denied its existence and
impact.72 These reports have apparently led to investigations by the SEC and at least
two attorneys general. Please provide copies of all internal studies related to climate
change; any memorandum that has gone to the ExxonMobil board of directors on the
topic; and organizational charts that identify the individuals in the corporation who
analyzed this information.
2. Please provide a list of all parties to whom ExxonMobil has provided payments for the
purposes of creating a third-party spokesperson role on climate change. What is the
company’s rationale for engaging third-party validators to support statements about
climate change that are false? What impact would such a move have been
designed to have on investors? Please provide the legal basis used by company
management to justify adoption of this strategy and all payments made to support it.
3. Please provide a description of all of ExxonMobil’s capital or operational expenditures
that are based on projected changes in sea level, changes in the polar ice caps or
changes in global temperatures.
71 http://cdn.exxonmobil.com/~/media/Global/Files/Earnings/2016/news_presentation_2q16.pdf, p. 21. 72 http://www.bloomberg.com/news/articles/2016-09-07/will-exxonmobil-have-to-pay-for-misleading-the-public-on-climate-
change

4. How does the company account for the risk from climate change in its valuation of
proven reserves?
5. After passage of the Waxman-Markey cap-and-trade bill in the House of
Representatives in 2009, the Senate refrained from taking action on that bill or any
similar bill. The bill would have launched a series of initiatives to address climate
change. ExxonMobil and other opponents of climate legislation succeeded in
defeating the bill. Despite this legislative success, ExxonMobil’s finances today are
weak and the outlook for the company’s future indicates that the company is not
likely to become an outperforming global stock again anytime soon. Some observers
have asserted that ExxonMobil could have led an effort for compromise climate
legislation in 2009 and 2010 rather than merely oppose climate legislation and that, by
helping craft a compromise, ExxonMobil could have been assured of a healthy future.
In retrospect, was ExxonMobil’s decision to oppose climate legislation without seeking
a compromise a good strategy to assure the company’s future profitability?
6. Please provide all official statements made by the company regarding the Waxman
Markey bill and regarding any comparable Senate bills in 2009 and 2010.
7. The company has recently expressed its opposition to efforts by the New York Attorney
General to investigate climate change and financial disclosures of the company. The
company has stated that the NYS AG’s actions are politically motivated. Please
provide memorandum or analysis generated by management and/or submitted to
the board that substantiates this response.
8. Please provide a five-year look back of the activities of the Washington Office and all
ExxonMobil related policy, legal and political initiatives in Washington. Please provide
the current menu of activities for the Washington Office or ExxonMobil and all
ExxonMobil related policy, legal and political initiatives in Washington. Please provide
a list of all lobbyists, law firms and other contractors that have performed any services
for the company in Washington over the last five years. Please provide a list of all
campaign contributions to members of the House and Senate by ExxonMobil, its
employees, related Political Action Committees, member trade associations and third-
party actors.
9. ExxonMobil has stated that it supports a carbon tax.
a. What is the basis of the company’s policy position on a carbon tax?
b. Does ExxonMobil base this support upon an analysis that the atmosphere has a
limited capacity to safely absorb carbon emissions?
c. What efforts has ExxonMobil made either to support legislation or to oppose
attempts to block or undermine support for a carbon tax?
d. Did the company have a position on Congressman Steve Scalise’s resolution in
June 2016 to oppose a carbon tax? Did the company devote any resources to
this effort?
10. ExxonMobil has previously stated that the cost of carbon regulation would be
prohibitive, concluding that new carbon regulations would impose significant costs on
households worldwide, amounting to 44 percent of household median income.
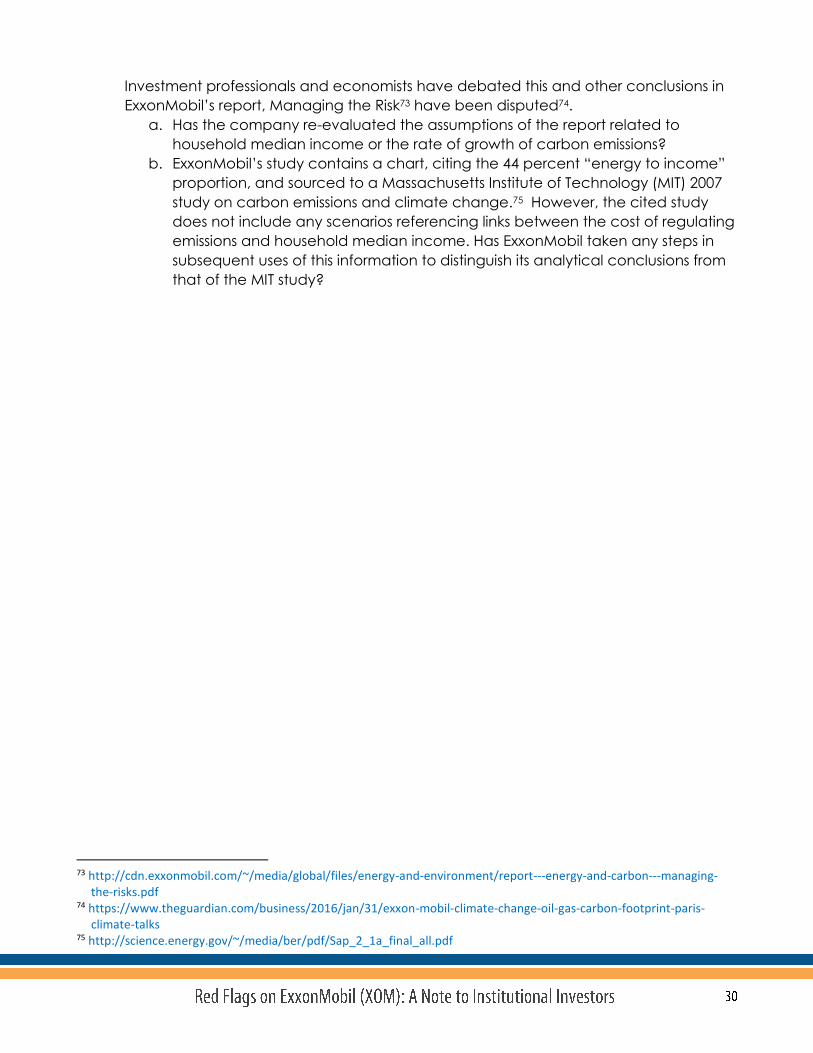
Investment professionals and economists have debated this and other conclusions in
ExxonMobil’s report, Managing the Risk73 have been disputed74.
a. Has the company re-evaluated the assumptions of the report related to
household median income or the rate of growth of carbon emissions?
b. ExxonMobil’s study contains a chart, citing the 44 percent “energy to income”
proportion, and sourced to a Massachusetts Institute of Technology (MIT) 2007
study on carbon emissions and climate change.75 However, the cited study
does not include any scenarios referencing links between the cost of regulating
emissions and household median income. Has ExxonMobil taken any steps in
subsequent uses of this information to distinguish its analytical conclusions from
that of the MIT study?
73 http://cdn.exxonmobil.com/~/media/global/files/energy-and-environment/report---energy-and-carbon---managing-
the-risks.pdf 74 https://www.theguardian.com/business/2016/jan/31/exxon-mobil-climate-change-oil-gas-carbon-footprint-paris-
climate-talks 75 http://science.energy.gov/~/media/ber/pdf/Sap_2_1a_final_all.pdf

The Institute for Energy Economics and Financial Analysis (IEEFA) conducts research and
analyses on financial and economic issues related to energy and the environment. The
Institute’s mission is to accelerate the transition to a diverse, sustainable and profitable
energy economy and to reduce dependence on coal and other non-renewable energy
resources. More can be found at www.ieefa.org.
Tom Sanzillo joined the Institute for Energy Economics and Financial Analysis (ieefa.org) as
Director of Finance in 2012. He is the president of T. R. Rose Associates, a company that has
served several clients working to create alternatives to fossil fuel use in the United States and
globally. It also served clients in the business, labor and nonprofit on a host of financial and
fiscal issues related and unrelated to energy.
Sanzillo’s analyses of the U.S. coal industry for IEEFA have resulted in multiple investigations by
federal oversight bodies including the Securities and Exchange Commission, Congress and
the Government Accountability Office (GAO) and the cancellation of several coal plants,
ports and mines. His studies related to coal and fossil fuel divestment, coal leases, transition
and oil sands have all been high impact.
From 1990 to 2007, Sanzillo served in senior management positions to the publicly elected
Chief Financial Officers of New York City and New York State. From 2003 to 2007, he served as
the First Deputy Comptroller for the State of New York. Among his responsibilities was the
supervision of a $150 billion globally invested public pension fund, with significant fossil fuel
holdings. Over this part of his career, Sanzillo was involved in asset allocation policy, pension
fund management, fund reporting, corporate governance, social responsibility, corporate
relations, shareholder litigation, legislative affairs and public relations.
Sanzillo continues to write on government and public finance issues, and authored a chapter
in the 2012 Oxford Handbook of New York State Government and Finance.

This report is for information and educational purposes only. The Institute for Energy
Economics and Financial Analysis (“IEEFA”) does not provide tax, legal, investment or
accounting advice. This report is not intended to provide, and should not be relied on for,
tax, legal, investment or accounting advice. Nothing in this report is intended as investment
advice, as an offer or solicitation of an offer to buy or sell, or as a recommendation,
endorsement, or sponsorship of any security, company, or fund. IEEFA is not responsible for
any investment decision made by you. You are responsible for your own investment research
and investment decisions. This report is not meant as a general guide to investing, nor as a
source of any specific investment recommendation. Unless attributed to others, any opinions
expressed are our current opinions only. Certain information presented may have been
provided by third parties. IEEFA believes that such third-party information is reliable, and has
checked public records to verify it wherever possible, but does not guarantee its accuracy,
timeliness or completeness; and it is subject to change without notice.
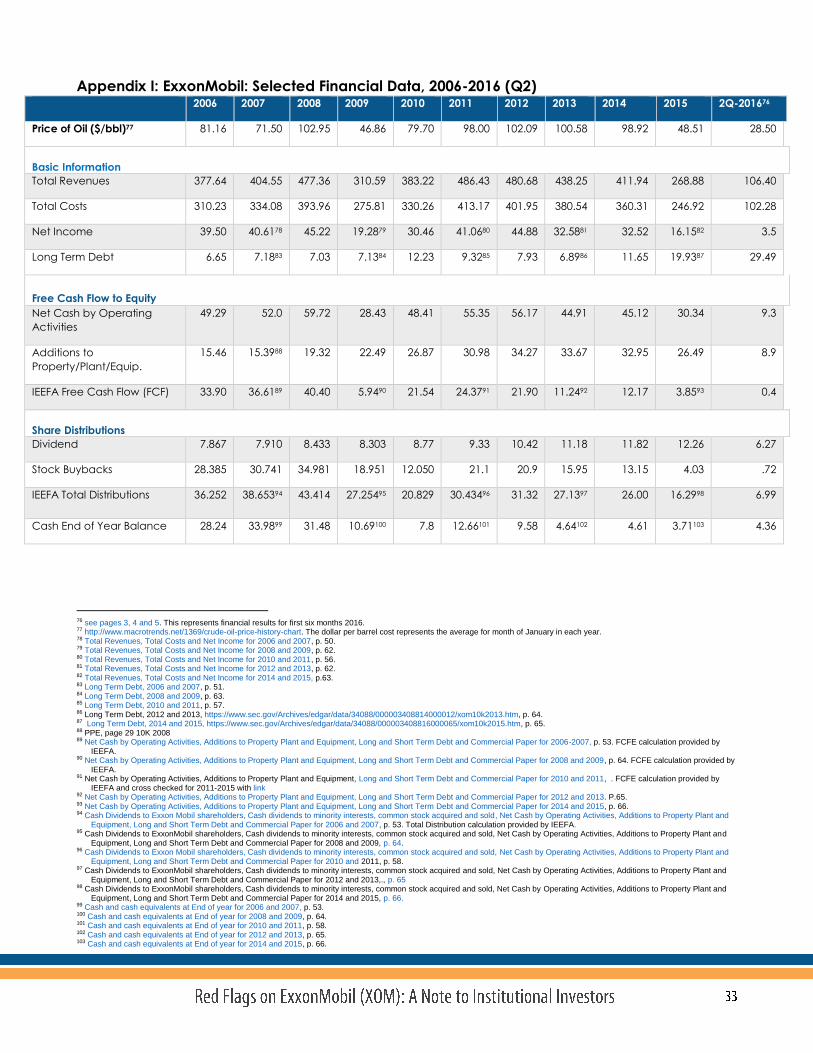
Appendix I: ExxonMobil: Selected Financial Data, 2006-2016 (Q2) 2006 2007 2008 2009 2010 2011 2012 2013 2014 2015 2Q-201676
Price of Oil ($/bbl)77 81.16 71.50 102.95 46.86 79.70 98.00 102.09 100.58 98.92 48.51 28.50
Basic Information
Total Revenues 377.64 404.55 477.36 310.59 383.22 486.43 480.68 438.25 411.94 268.88 106.40
Total Costs 310.23 334.08 393.96 275.81 330.26 413.17 401.95 380.54 360.31 246.92 102.28
Net Income 39.50 40.6178 45.22 19.2879 30.46 41.0680 44.88 32.5881 32.52 16.1582 3.5
Long Term Debt 6.65 7.1883 7.03 7.1384 12.23 9.3285 7.93 6.8986 11.65 19.9387 29.49
Free Cash Flow to Equity
Net Cash by Operating
Activities
49.29 52.0 59.72 28.43 48.41 55.35 56.17 44.91 45.12 30.34 9.3
Additions to
Property/Plant/Equip.
15.46 15.3988 19.32 22.49 26.87 30.98 34.27 33.67 32.95 26.49 8.9
IEEFA Free Cash Flow (FCF) 33.90 36.6189 40.40 5.9490 21.54 24.3791 21.90 11.2492 12.17 3.8593 0.4
Share Distributions
Dividend 7.867 7.910 8.433 8.303 8.77 9.33 10.42 11.18 11.82 12.26 6.27
Stock Buybacks 28.385 30.741 34.981 18.951 12.050 21.1 20.9 15.95 13.15 4.03 .72
IEEFA Total Distributions 36.252 38.65394 43.414 27.25495 20.829 30.43496 31.32 27.1397 26.00 16.2998 6.99
Cash End of Year Balance 28.24 33.9899 31.48 10.69100 7.8 12.66101 9.58 4.64102 4.61 3.71103 4.36
76 see pages 3, 4 and 5. This represents financial results for first six months 2016. 77 http://www.macrotrends.net/1369/crude-oil-price-history-chart. The dollar per barrel cost represents the average for month of January in each year. 78 Total Revenues, Total Costs and Net Income for 2006 and 2007, p. 50. 79 Total Revenues, Total Costs and Net Income for 2008 and 2009, p. 62. 80 Total Revenues, Total Costs and Net Income for 2010 and 2011, p. 56. 81 Total Revenues, Total Costs and Net Income for 2012 and 2013, p. 62. 82 Total Revenues, Total Costs and Net Income for 2014 and 2015, p.63. 83 Long Term Debt, 2006 and 2007, p. 51. 84 Long Term Debt, 2008 and 2009, p. 63. 85 Long Term Debt, 2010 and 2011, p. 57. 86 Long Term Debt, 2012 and 2013, https://www.sec.gov/Archives/edgar/data/34088/000003408814000012/xom10k2013.htm, p. 64. 87 Long Term Debt, 2014 and 2015, https://www.sec.gov/Archives/edgar/data/34088/000003408816000065/xom10k2015.htm, p. 65. 88 PPE, page 29 10K 2008 89 Net Cash by Operating Activities, Additions to Property Plant and Equipment, Long and Short Term Debt and Commercial Paper for 2006-2007, p. 53. FCFE calculation provided by
IEEFA. 90 Net Cash by Operating Activities, Additions to Property Plant and Equipment, Long and Short Term Debt and Commercial Paper for 2008 and 2009, p. 64. FCFE calculation provided by
IEEFA. 91 Net Cash by Operating Activities, Additions to Property Plant and Equipment, Long and Short Term Debt and Commercial Paper for 2010 and 2011, . FCFE calculation provided by
IEEFA and cross checked for 2011-2015 with link 92 Net Cash by Operating Activities, Additions to Property Plant and Equipment, Long and Short Term Debt and Commercial Paper for 2012 and 2013. P.65. 93 Net Cash by Operating Activities, Additions to Property Plant and Equipment, Long and Short Term Debt and Commercial Paper for 2014 and 2015, p. 66. 94 Cash Dividends to Exxon Mobil shareholders, Cash dividends to minority interests, common stock acquired and sold, Net Cash by Operating Activities, Additions to Property Plant and
Equipment, Long and Short Term Debt and Commercial Paper for 2006 and 2007, p. 53. Total Distribution calculation provided by IEEFA. 95 Cash Dividends to ExxonMobil shareholders, Cash dividends to minority interests, common stock acquired and sold, Net Cash by Operating Activities, Additions to Property Plant and
Equipment, Long and Short Term Debt and Commercial Paper for 2008 and 2009, p. 64. 96 Cash Dividends to Exxon Mobil shareholders, Cash dividends to minority interests, common stock acquired and sold, Net Cash by Operating Activities, Additions to Property Plant and
Equipment, Long and Short Term Debt and Commercial Paper for 2010 and 2011, p. 58. 97 Cash Dividends to ExxonMobil shareholders, Cash dividends to minority interests, common stock acquired and sold, Net Cash by Operating Activities, Additions to Property Plant and
Equipment, Long and Short Term Debt and Commercial Paper for 2012 and 2013,., p. 65 98 Cash Dividends to ExxonMobil shareholders, Cash dividends to minority interests, common stock acquired and sold, Net Cash by Operating Activities, Additions to Property Plant and
Equipment, Long and Short Term Debt and Commercial Paper for 2014 and 2015, p. 66. 99 Cash and cash equivalents at End of year for 2006 and 2007, p. 53. 100 Cash and cash equivalents at End of year for 2008 and 2009, p. 64. 101 Cash and cash equivalents at End of year for 2010 and 2011, p. 58. 102 Cash and cash equivalents at End of year for 2012 and 2013, p. 65. 103 Cash and cash equivalents at End of year for 2014 and 2015, p. 66.

Appendix II: Free Cash Flow (FCF) The basic definition of Free Cash Flow is the amount of revenue left after all expenses and
investments in property/plant and equipment (capex spending) are paid. It is the amount of
revenue left free to be distributed to shareholders. Different companies and different analysts use
different methodologies reflecting their professional judgements on how best to assess this metric.
Morningstar104
The FCF method utilized by IEEFA in this study is taken from an online presentation supported by
Morningstar. It is a simple FCF model. The model takes Net Income from Operating Activities and
reduces the amount by the company’s annual capex. The remaining revenue is referred to as the
Free Cash Flow. FCF is roughly what a company has left over after all expenses including new
investment have been paid. It is theoretically what senior management and the Board have in
cash that is available for paying shareholders.
ExxonMobil FCF105
ExxonMobil utilizes a more complex methodology to calculate the company’s FCF. The company
starts with net cash from operating activities and then subtracts capex spending. The company
then adds “additional investments and advances plus collection of advances”. These are items
from the company’s proceeds from investing activities contained in its cash flow accounting
presentation. IEEFA has not adopted this method because we prefer that revenues from
operations be calculated separately from revenues from investing activities for the purposes of
establishing free cash flow. IEEFA is trying to determine whether cash from operations covers
expenses.
ExxonMobil only began to carry an FCF calculation in their 2013 Financial and Operating
Review.106 Those calculations only go back to 2009. IEEFA, using Exxon’s method calculated the
FCF for 2006, 2007 and 2008. IEEFA found that in nine of the ten years covered by this survey
Exxon’s shareholder distributions exceeded its Free Cash Flow. When Exxon’s method is applied
the shareholder distributions exceeded Free Cash Flow in seven of the ten years.
Stock Analysis On Net107
Another treatment of Free Cash Flow is offered by Stock Analysis on Net, a web-based
compilation of individual company performance by selected financial metrics. Stock Analysis on
Net method starts with net cash from operating activities and then subtracts capex spending.
Stock Analysis on Net then adds/subtracts the company’s short, long and commercial paper
borrowings for the year. The level of borrowing or debt retirement during a year can have an
impact on the FCF bottom line. We did not adopt this method because we are seeking to
measure whether cash from operations cover company expenses. This method allowing for the
use of borrowed proceeds in the calculation while valid for cash management introduces a
distortion into the analysis. Using this method Exxon’s share distribution exceeded its free cash flow
in all ten of the years in the survey.
104 http://financials.morningstar.com/cash-flow/cf.html?t=XOM 105 http://cdn.exxonmobil.com/~/media/global/files/financial-review/2015_exxonmobil_financial_and_operating_review.pdf,
p.92 106 http://cdn.exxonmobil.com/~/media/Global/Files/Financial-
Review/2013_ExxonMobil_Financial_and_Operating_Review.pdf, p. 92. 107 https://www.stock-analysis-on.net/NYSE/Company/Exxon-Mobil-Corp/Valuation/Price-to-FCFE#FCFE

Appendix III: 50 Largest Shareholders in ExxonMobil Source: Thomson Reuters, September 26, 2016
Investor Ownership Pct of Exxon Stock Stock Holdings Value of Holdings ($)
The Vanguard Group, Inc. 6.62% 274,326,721.00 25,715,386,826.54
State Street Global Advisors (US) 4.46% 184,887,823.00 17,331,384,528.02
BlackRock Institutional Trust Company, N.A. 4.15% 172,235,537.00 16,145,359,238.38
Wellington Management Company, LLP 1.16% 48,128,739.00 4,511,587,993.86
Bank of America Merrill Lynch (US) 0.94% 39,166,402.00 3,671,458,523.48
T. Rowe Price Associates, Inc. 0.90% 37,303,332.00 3,496,814,341.68
State Farm Insurance Companies 0.90% 37,126,800.00 3,480,266,232.00
Norges Bank Investment Management (NBIM) 0.85% 35,225,433.00 2,745,822,502.35
Geode Capital Management, L.L.C. 0.84% 34,776,913.00 3,259,987,824.62
Northern Trust Investments, Inc. 0.81% 33,740,835.00 3,162,865,872.90
Dimensional Fund Advisors, L.P. 0.64% 26,458,481.00 2,480,218,008.94
Mellon Capital Management Corporation 0.57% 23,577,556.00 2,210,160,099.44
TIAA Global Asset Management 0.56% 23,248,912.00 2,179,353,010.88
Legal & General Investment Management Ltd. 0.52% 21,519,400.00 2,017,228,556.00
Columbia Threadneedle Investments (US) 0.48% 20,101,596.00 1,884,323,609.04
BlackRock Investment Management (UK) Ltd. 0.48% 20,010,007.00 1,875,738,056.18
BNY Mellon Wealth Management 0.46% 19,164,674.00 1,796,496,540.76
JP Morgan Asset Management 0.42% 17,600,290.00 1,649,851,184.60
AllianceBernstein L.P. 0.41% 17,123,892.00 1,605,193,636.08
Capital Research Global Investors 0.41% 16,964,063.00 1,590,211,265.62
Charles Schwab Investment Management, Inc. 0.41% 16,874,002.00 1,581,768,947.48
BlackRock Financial Management, Inc. 0.38% 15,842,106.00 1,485,039,016.44
Capital World Investors 0.37% 15,221,000.00 1,426,816,540.00
Fidelity Management & Research Company 0.35% 14,449,057.00 1,354,454,603.18
BNY Mellon Asset Management 0.33% 13,850,855.00 1,298,379,147.70
PNC Wealth Management 0.31% 12,860,925.00 1,205,583,109.50
JPMorgan Private Bank (United States) 0.31% 12,830,903.00 1,202,768,847.22
Schweizerische Nationalbank 0.30% 12,537,836.00 1,175,296,746.64
California Public Employees' Retirement System 0.30% 12,302,388.00 1,153,225,851.12
Northern Trust Global Investments Ltd. 0.29% 12,230,212.00 1,146,460,072.88
Wells Fargo Advisors 0.29% 12,082,137.00 1,132,579,522.38
Sumitomo Mitsui Trust Bank, Limited 0.29% 12,059,749.00 1,130,480,871.26
MFS Investment Management 0.29% 11,999,884.00 1,124,869,126.16
UBS Securities LLC 0.28% 11,798,138.00 1,105,957,456.12
Morgan Stanley Wealth Management 0.28% 11,793,232.00 1,105,497,567.68
New York State Common Retirement System 0.28% 11,719,201.00 1,098,557,901.74
BlackRock Investment Management, LLC 0.28% 11,490,231.00 1,077,094,253.94
Managed Account Advisors LLC 0.27% 11,056,550.00 1,036,440,997.00
BlackRock Asset Management Ireland Limited 0.25% 10,449,795.00 979,563,783.30
Quantitative Management Associates LLC 0.24% 9,892,267.00 927,301,108.58
LSV Asset Management 0.24% 9,778,866.00 916,670,898.84
Capital International Investors 0.23% 9,672,600.00 906,709,524.00
APG Asset Management 0.23% 9,577,044.00 897,752,104.56
Fayez Sarofim & Co. 0.22% 9,107,579.00 853,744,455.46
Goldman Sachs Asset Management (US) 0.22% 9,086,547.00 851,772,915.78
California State Teachers Retirement System 0.22% 9,053,529.00 848,677,808.46
Mitsubishi UFJ Trust and Banking Corporation 0.21% 8,793,054.00 824,260,881.96
Parametric Portfolio Associates LLC 0.21% 8,614,557.00 807,528,573.18
American Century Investment Management, Inc. 0.21% 8,588,518.00 805,087,677.32
Principal Global Investors (Equity) 0.20% 8,319,413.00 779,861,774.62