investor seminar 9 december 2005. disclaimer during this presentation we will be discussing yell’s...
TRANSCRIPT

INVESTOR SEMINAR
9 December 2005

Disclaimer
During this presentation we will be discussing Yell’s business outlook and making certain forward-looking statements. Any statements that are not historical facts are subject to a number of risks and uncertainties, and actual results may differ materially.
We urge you to read the Risk Factors and cautionary language in the annual report on Form 20-F of our subsidiary, Yell Finance BV, that was filed with the SEC in June 2005. We also draw your attention to our press release which is posted on our web site, for more information on the risks and uncertainties.
These slides are protected by the laws of copyright and Yell Group plc is the copyright owner. Unauthorised reproduction is a copyright infringement and is unlawful.

Investor Relations: Jill Sherratt +44 (0)118 950 6984
www.yellgroup.com
Yell, Queens Walk, Oxford Road, Reading, Berkshire RG1 7PT
™Trade mark of Yell Limited

US MARKET AND STRATEGY
Joe WalshPresident / CEO, Yellow Book

#1 Independent
Founded in 1930
400 offices in 46 States
900 directories
100+ million circulation
7,700 employees
36% COMPOUND ANNUAL GROWTH FY01-FY05OVER 60% SHARE OF INDEPENDENTS’ REVENUE

Leads for less
BuyersSellers
Low cost business leads from a “Ready-to-Buy” audience
Efficient link

Trends in US market share
Source: The Kelsey Group with Yell estimates for 2002 to 2004. Independents include online-only publishers. 2005 estimates from Association of Directory Publishers' (ADP's) Yellow Pages Data Center
% Revenue growth for publishers
% Independents’ market share
4.0 4.03.0 2.0
25
20
25
1314
20
16
13
-0.5 -1.5 -2.0 -1.3
1998 1999 2000 2001 2002 2003 2004 2005(proj)
Inc umbents Independents
8
1011
12 12
15
17 20
1998 1999 2000 2001 2002 2003 2004 2005
Independents' market share
* Projected
* *

Our philosophy
Focus, simplicity, discipline
The user first – virtuous circle
Passionate about usage and brand
Win, Keep, Grow strategy
Sharing of best practice across the States and the Atlantic

TransWestern publishing integration
Meet the people – July – Joe Walsh & senior team traveled the country and met all
employees within first two weeks
Executives retire– Chairman, President / CEO, CFO, CPO retired the day of the
closing
Parallel period
Common system – DIAD
Sales integration completed in October

TransWestern publishing integration (continued)
All functions integrated by March
Overlapping directory coverage addressed
Rebranding underway
Market relaunches beginning
Momentum building

Competitive landscape
Over-directorying of markets– Over 1,000 new directories last three years
Companion books
Selective dealing – price by heading
Local search

Yellow Book growth
Double-digit organic growth– Same market growth
– New launches
– Online
Acquisitions
Margin expansion
Excellent execution

US SALES
Victoria SharrarChief Sales Officer, Yellow Book

Vision of the sales organization
High energy, talented “go-go” sales force
“Best in class” sales leadership
Caught up in The Cause
Conviction in our value story
Intensely customer focused
Winning culture
Career driven

Sales structure and techniques
Structure
5,058 field sales; 120 telesales; 634 sales management
Recruitment – take less than 10% of applicants
Training approach – best people share best practise
Remuneration – 60% fixed salaries
Low sales churn
Techniques
Need-based sale
Customer service

Win, Keep, Grow
Demonstrating value for money– Proving value
– Cost per call
FREDERICK COUNTY, MARYLAND
YELLOW BOOK VERIZON
Investment per month $185 $435.80
Total calls 378 329
Average calls per month 32 27
Cost per lead $5.78 $16.11Additional information available upon request Metered calls from
November 2003-October 2004Metered calls from
November 2003-October 2004

Win, Keep, Grow
Demonstrating value for money– Proving value
– Cost per call
QUAD CITIES, IOWA / ILLINOIS
YELLOW BOOK SBC
Investment per month $1,504 $3,462
Total calls 1,342 858
Average calls per month 112 72
Cost per lead $13.43 $48.08Additional information available upon request
Metered calls from
September 2004-August 2005
Metered calls from
November 2004-October 2005

Win, Keep, Grow (continued)
Credit policies– 12 months payment for most customers
National customers – Demonstrating value to Certified Marketing Representatives

Customer testimonials
Note: 1-800-FLOWERS is listed on the NASDAQ with revenues of $670M in FY05
“We do a lot of marketing on-line, on TV, on radio, of course with directory advertising, but of all the vehicles that we have, Yellow Book is the strongest in terms of new customer acquisition. We also track our marketing investment very closely and we know for a fact that the directory advertising in Yellow Book has lifted our sales significantly and that’s why we’re very happy with it.”
Margaret WooChief Marketing and
Merchandising Officer1-800-FLOWERS*

Organic revenue growth
9.3%11.1%
9.0%
2.2%
3.1%10.4%
FY04 FY05 H1 FY06
New launches
Same market
11.5%
19.4%
14.2%
Contribution to growth

0%
50%
100%
150%
SuburbanMaryland
Philadelphia Allentown Sarasota FL
FY02 FY03 FY04 FY05
Examples of more developed books Same market growth
All 4 years plus
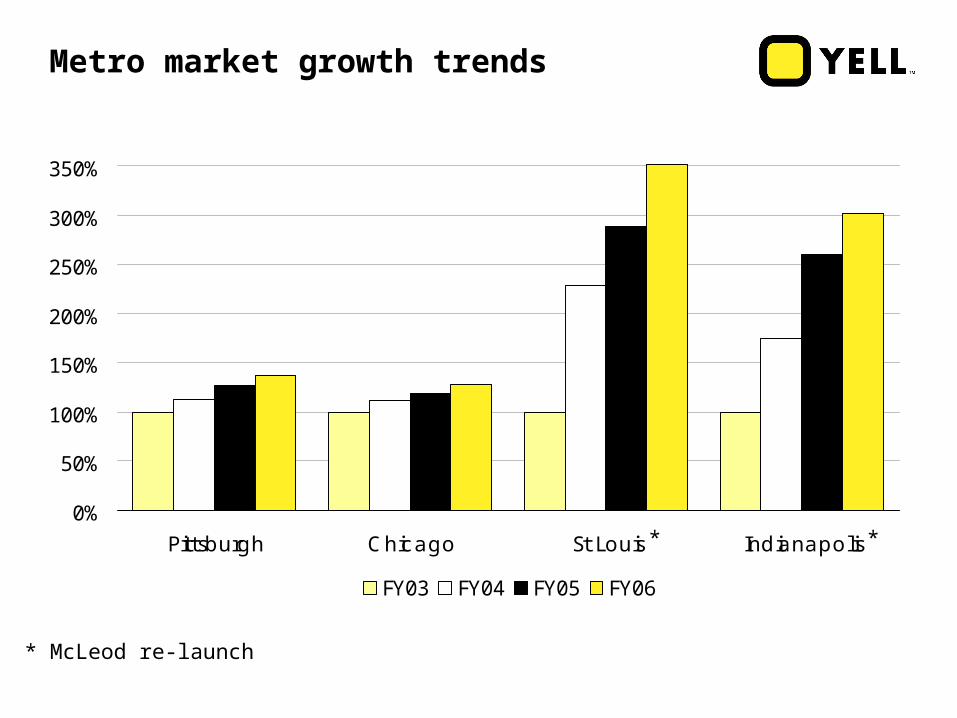
Metro market growth trends
0%
50%
100%
150%
200%
250%
300%
350%
Pittsburgh Chicago St Louis Indianapolis
FY03 FY04 FY05 FY06
* McLeod re-launch
* *

New launches - criteria
Market size and growth
Proximity to existing sales; sales capacity
A set process that involves:– Sales planning and marketing
– Advertising and PR
– Production
– HR, training and sales

TOTAL FY06 NEW LAUNCHES : 32 MARKETS Average revenue per copy $12
Piedmont VA
Syracuse NY
Tri Cities VA
Eastern Shore MD
Sanger/Reedley CA
S Hampton Roads VA
Suffolk NY
Williamson Cty TN
Cape Cod MA
Las Vegas NV
Narragansett RI
Santa Fe NM
Hudson Valley NY
West Palm FL
Kent/Sussex DE
Lynchburg VA
Watertown NY
Jackson MI
Merrimack/Salem MA
N Hampton Roads VA
San Bernardino CA
Staunton/Harrisonburg VA
Columbia/Montour PA
Henderson NV
Rochester NY
South Orange NY
Waterbury CT
Citrus Cty FL
Hartford CT
Roanoke VA
Shenandoah Valley VA
Ayer/Fitch MA
FY06 new launches

New launches
Yellow Book markets
New launches
TransWestern acquisition

TWP sales integration
Sales leadership reorganization– Completed November 1st
Major Metro re-launches – 7 markets identified
Sales training & recruiting – Integration complete
Sales process “Boot Camps” and Leadership Development Course – Well received by TWP sales force and sales managers
Sales churn – Yellow Book style compensation and sales deployment being
implemented

Summary
Acquisition integrations adding value
Back office support a key strength
Brand strength and national footprint a powerful component
Growth prospects continue to be outstanding

US MARKETING & INTERNET
Gordon Henry Chief Marketing Officer
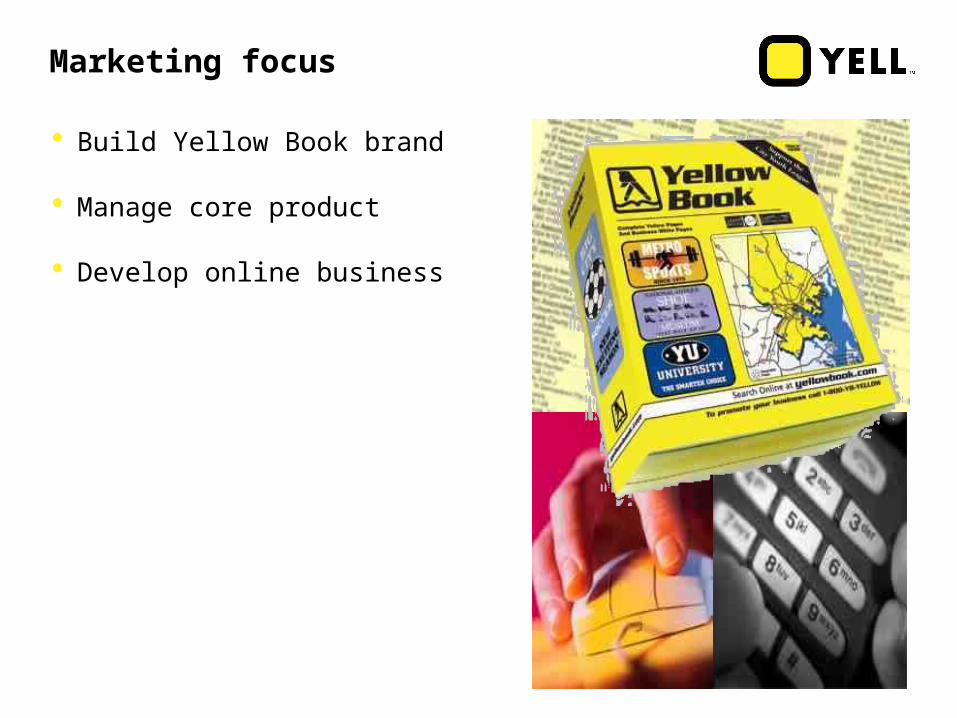
Marketing focus
Build Yellow Book brand
Manage core product
Develop online business
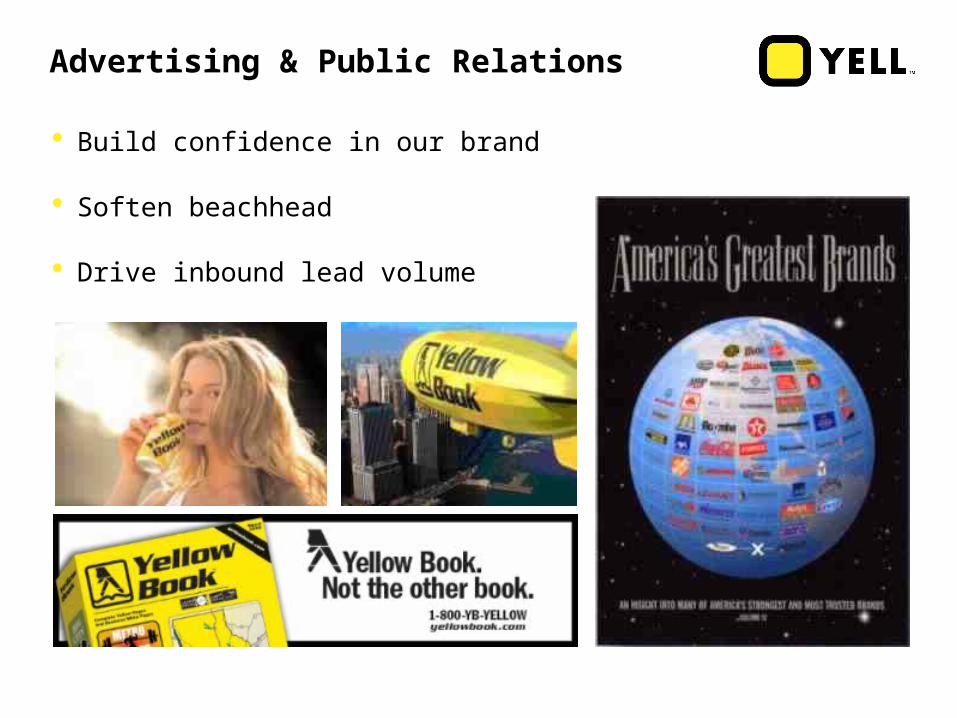
Advertising & Public Relations
Build confidence in our brand
Soften beachhead
Drive inbound lead volume

Product planning
Thump factor – building content
Display ad count growth
Rates about 50% of incumbent
Usage research
DISPLAY AD COUNT COMPARISON WITH PRIMARY COMPETITOR
YBUSA marketYBUSA
FY04YBUSA
FY05YBUSA FY06
Competitor Current
issue
Manhattan NY 3,209 3,291 3,499 3,287
Charlotte NC 2,534 2,729 2,776 2,365
Kansas City KS 2,001 2,088 4,060 3,450
Wilmington DE 2,927 3,401 3,414 2,396
Gtr Indianapolis IN 2,505 3,816 3,974 2,645

Internet ad count & revenue growing
Content
Largest ad volume
Keyword searchable
Intelligent results
Monetization
Strong revenue growth
AVA still modest
Room for increase
228,000375,000
562,000 621,500
372,000
31 Mar 03 31 Mar 04 31 Mar 05 30 Sep 05
TransWesternYellow Book
Ad count growthAds online
$9.7m$12.8m
$22.2m
$15.2m
$2.7m
FY03 FY04 FY05 FY06 H1
TransWesternYellow Book
Revenue growth*
993,500
* Recognized
$17.9m

Ad penetration growing
Strong penetration of print advertiser base– TransWestern penetration online similar to Yellow Book’s
Retention of online customers broadly in line with print retention
0
200
400
600
800OnlinePrint
Customer base (000s)
10/03-9/04YB only
10/04-9/05with TWP

Traffic growth
* Comscore, Sept 2005 ** Webtrends
Consistent traffic increases– 2.7 Million Unique Visitors*
Traffic Growth Index**Index: March 2003 = 100%
0%
200%
400%
600%
800%
1000%
1200%
1400%
1600%
1800%
2000%
Mar 03 Mar 04 Mar 05 Sep 05
Unique Visitors (m)

Online growth strategy
Grow AVA (product staircase)– Introduce products of increasing value to enable growth in
customer spend
Steady build of site usage
Develop proven value
Broaden customer acquisition
Yellow Book Direct– Customer-accessible account information online

Yellowbook.com site redesign
Home page

Yellowbook.com site redesign
Results page
Proven value
Yellow Book Direct will include:
1. Site Traffic
2. Heading and Book Reports
3. Individual Performance Reports

US IT AND CHANGE MANAGEMENT
Gary ShawChief Information Officer, Yellow Book

IT infrastructure metrics
5000 desktops and laptops
7000+ telephones
100+ terabytes disk storage in 2 major data centers
270 networked offices
400 facilities

Yellowbook USA US network
Twin DS3 Dual Data Center
AT&T BackboneATM
Cedar Rapids
King of Prussia
Uniondale
Birmingham
Tustin
65 Connected Offices
20 Connected Offices
25 Connected Offices
25 Connected Offices
19 Connected Offices
VPN Backup
VPN Backup
VPN Bac
kup
Effingham
VPN Backup
Wichita6 Connected
Offices
San Diego
VPN
100 ConnectedOffices

Yellowbook USA International network
Scarborough
Bangalore 1
CedarRapids
2560
Bangalore 2
2004King of Prussia
2mb E1 TransAtlantic
Gig Fiber
1.5mb TransAtlantic45mb DS3
2mb E1 Satellite
45mbDS3
2mb E1
2mb E1Birmingham
CellStream

Example IT infrastructure cost savings indicators
Average costs of support FY04 FY05 FY06Saving
s
Average cost of server support
$1,740 $1,514 $1,493 -14.2%
Average cost per workstation support
$429 $378 $351 -18.8%
Average cost per help desk call
$7.05 $6.79 $6.43 -8.8%
Average cost of facilities support
$2,893 $2,721 $2,573 -11.0%
* FY06 is based on current reforecast
Best practices
Disaster recovery / business continuity
Sarbanes Oxley
Focus on integrated systems

Key projects in process and going forward
Yellowbook.com 4.0 New look & feel Yell.com Thesaurus Technology 10X capacity increase
Market data base National business listing data base Maintained history Single source of data for leads, print, on-line, and distribution
Business intelligence / data warehouse Rapid development and access to business data
and performance
Customer / Rep facing eProducts ICE Yellowbookdirect


Yellow Book Direct

TransWestern integration
July, 2005 Closed
October, 2005 Organization integration
November, 2005 DIAD data bases moved to YB data centers
January, 2006 * YB IT standards implementation ICEroll out Worldpages.com integrationto Yellowbook.com
March, 2006 * DIAD data base integration
* Future dates represent current project targets

US PUBLISHING
Mark CairnsChief Publishing Officer, Yellow Book

US growth FY00 – FY05 – FY07
FY00 FY05 FY07
Titles 254 565 953
Impressions (billions)
19 117 170
Ads (& changes) 317,000 1,840,000 2,500,000
Paper usage (tons) 30 160 235
Circulation 17.5m 82m 121m
Acquisitions 35 to Nov 2005

US publishing strategies
Integration
Scalable mirrored Production centers
Process Simplification
Continuous Improvement
Small number of Key Vendor Partnerships
Supply Chain Integration

Integration Progress
Yellow Book product standards and processes
Common system platform
Production centers– King of Prussia
– Cedar Rapids
– San Diego* (2006)
TWP integration complete in 2006
* 3rd center post technical conversion

Key supply chain partners
Pre-press Pindar Set, Inc.
Print R.R. Donnelley
Quebecor
Paper UPM
Fraser
Catalyst

US cost performance – FY00 to FY05
Cost reduction %
Cost per Ad 61%
Cost per Page 34%
Paper cost / ton 10%
Print cost / billion impressions
40%

US Publishing
Forward look
TWP integration
Market database
Open systems on line
Automation and cost reduction

US FINANCIALS
Jim HaddadCFO, Yellow Book
FY01 FY02 FY03 FY04 FY05
Proforma Transwestern FY05
Acquired
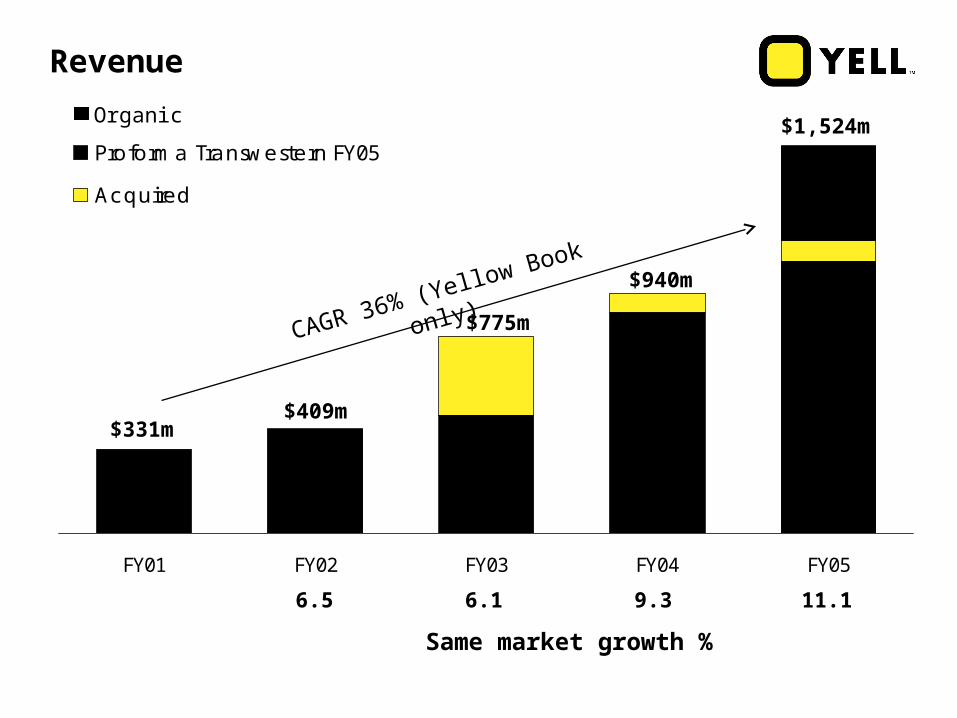
Revenue
CAGR 36% (Yellow Book only)
$331m$409m
$775m
$940m
$1,524m
Same market growth %
6.5 6.1 9.3 11.1
Organic

Contribution to revenue growth (%)
9.0
10.4
2.3
14.8
0.4
32.331.9
Same marketgrowth
Newlaunc hes
Resc heduling Ac quisitions Growthbefore FX
Exc hangeimpac t
Total growth
FY06 half year revenue growth
Organic growth 19.4%

FY01 FY02 FY03 FY04 FY05
Acquired
Adjusted EBITDA
CAGR 64%
$41m $50m
$151m
$216m
$300m
EBITDA margin %
12.5
12.3
19.4
23.0 26.1
Organic

3%
16%
32%
26%
1 Year 2-3 Years 4+ Years All Directories
Building US margins
EBITDA margin of new directories since launch
Share of revenue FY05
3% 31%
66%
100%
Major initiatives
Sarbanes Oxley compliance
Credit review project
Employee welfare
– Constant monitoring and adaptation of benefit plans and compensation systems
– Employee stock ownership

Major initiatives
Transwestern integration
Full consolidation of all finance functions by March 31, 2006
All Yellow Book employment procedures and practices already implemented except benefits which will be phased in over next 6 months
Yellow Book credit policy implemented on a phased-in basis

YELL UK
Steve ChambersChief Commercial Officer

Creating an edge
UserFirst
Value to
Advertiser
Delivering the Value Story
The People Factor
Salesforce
Alignment
Simple, focused strategy and execution

Competing for the SME £
• Johnston Press• Independent
news and media• Trinity Mirror
• Local search• Google• Yahoo• MSN• Ask Jeeves• Specialists
• BT re-entry• Trinity Mirror entry• Thomson• Strong Community
players
LOCAL PRESS
SEARCH ENGINESDIRECTORIES
CUSTOMERS
We thrive by building relationships with SMEs and by delivering better value than our competition

Committed to driving usage
Reach Delivered to virtually every
house and business
Boundaries reviewed to reflect local buying patterns
Content Classification development Lifestyle / event guides Easier to use
Brand Building Yellow Pages - Superbrand YP 118 24 7 rated UK No 1 for
past 2 years Portfolio investment

Delivering value at point of sale
7 out of 10 usages resulted in a lead
Two thirds of these contacts resulted in a sale
Classification
Average new leads per
month
New business generated by
every £1 invested
Builders 33 £448
Plumbers 51 £142
Restaurants 27 £60
Sports Goods Shops
14 £48
Take Away Food 18 £10
Source: Saville Rossiter Base

UK growth strategy – Win, Keep and Grow
418438 451
480 478
FY01 FY02 FY03 FY04 FY05
543k new print advertisers over 5 years
14% growth in print advertisers over 5 years
3% increase in print yield over 5 years – Average Yellow Pages price reduction of 2.5% pa over 5
years
Rapid growth in Yell.com
UK directories unique advertisers (000s)
83 80 78 77 75
Retention %
ARPA (£)
1239 12341272
12371280
FY01 FY02 FY03 FY04 FY05+0.6 -0.4 -4.4 -4.8 -3.3
Growth In ARPA over 3 Years (£)
442714
1768
Year 1 Year 2 Year 3plus
Yell.com revenue (£m)
815
2026
36
FY01 FY02 FY03 FY04 FY05
Effective YP rate card reduction %

Win, Keep and Grow – targeting future growth opportunities
First year
renewal
Semi display
Display
Colour
Portfolio
£435
£173
£363
£2,079
£3,665
69.4%
72.4%
85.4%
90.7%
52.1%>100k new advertisers
AVERAGE ADVERTISER SPEND
Targeted customer programmes
RETENTION
Source: 2005 regional campaign customer performance trends excluding national accounts and Corporate Advertising Scheme

Driving colour penetration
‘NORMAL’ TREATMENT FY04/05 All channels Not flagged No specialist focus No additional support
PERFORMANCE Conversion rate 21% Retention rate 74%
FULL SUPPORT FY05/06
Specialist Sales Channel Flagged Sales Support Reward
PERFORMANCE
Conversion rate 34% Retention rate 82%
“YP users are six times more likely to choose a colour ad than a mono ad”
“Colour advertisers claim their new YP ad has helped increased enquiries by 42% since the previous year”Source: Insight Report 9318 – “Directory Colour Performance by Edition Accounting
Cycle”

Aligning the salesforce
Identifycustomersegments
Developcustomer
programmes
Align Salesforce
Deliver value
to customers
Over 1 million one-on-one sales contacts annually

‘Cut them and they bleed yellow’ – the People Factor
Rigorous recruitment process
On target earnings – top quartile for UK media sector
Open ended earnings opportunity – Top performers earn >£100,000
90% Leadership appointments from internal candidates
Highly regarded Training and Development
Flexible working policies
National Accounts
Face to Face Telephone
Average age 43 years 36 years 33 years
Average service 12 years 5 years 4 years
Turnover 5% 19% 26%
On target earnings
£54k to £67k £41k £32k
Job satisfaction 87% (67%)* 79% (67%)* 86% (67%)*
Headcount 83 1041 532
* SRI high performing norm

Using sales pay to drive service levels
Source: *Customer Service Monitor Jan 04 to June 05
CUSTOMER SATISFACTION UP 18%*
Major errors down
Inbound call volumes down
Customer complaints down
Waivers down
Production cycle time down
Back office headcount down

‘Cut them and they bleed yellow’ – the People Factor
Rigorous recruitment process
On target earnings – top quartile for UK media sector
Open ended earnings opportunity – Top performers earn >£100,000
90% Leadership appointments from internal candidates
Highly regarded Training and Development
Flexible working policies
National Accounts
Face to Face Telephone
Average age 43 years 36 years 33 years
Average service 12 years 5 years 4 years
Turnover 5% 19% 26%
On target earnings
£54k to £67k £41k £32k
Job satisfaction 87% (67%)* 79% (67%)* 86% (67%)*
Headcount 83 1041 532
* SRI high performing norm

Year-round service for National advertisers
Campaign-based, multi-book approach for SMEs
Campaign duration – 6 months face to face, 2 months telesales
Multi-product sale - specialist roles sell additional products during and outside main campaign
Market approach
PJan Feb Mar Apr May Jun Jul Aug Sep Oct Nov Dec Jan Feb Mar Apr May Jun Jul
P P
P P
Brighton
Portsmouth
Portsmouth sales campaign
Brighton sales campaign
P Publication

Delivering the value story - sales process and support tools
Needs-based, 2-call sales process
Annual sales accreditation for all salespeople
Graphics package and studio-produced visuals
Marketing information, mapping, proven value data
Customised electronic planning and presentation
State-of-the-art computerisation
Finaliseprogramme
Propose and provide solutions
Test intention
Conduct business review
Plan andprepareSales Process

Sales automation – adding value, supporting revenue and driving productivity Error reduction
Process efficiency – reduction in back office heads
Adding value at point of sale
Home-based salesforce
Internet literacy
Sales productivity

Summary
Value story – usage, brands, innovative customer programmes
Highly effective sales operation
Execution, execution, execution
Strong relationships with UK SMEs

YELL.COM
Eddie ChengeBusiness Director and President of Yell.com

Agenda
Performance
Products
Strategy

Growth of search volumes
Source – Internal
0m
20m
40m
60m
80m
100m
Mar 04 J un 04 Sep 04 Dec-04 Mar 05 J un 05 Sep 05
Page ImpressionsSearches

Growth of searchable advertisers
Source – Internal
0
20,000
40,000
60,000
80,000
100,000
120,000
140,000
160,000
180,000
Sep 03 Mar 04 Sep 04 Mar 05 Sep 05

Revenue* per Average Searchable Advertiser (RASA)
£260
£270
£280
£290
£300
£310
£320
£330
Sep 03 Mar 04 Sep 04 Mar 05 Sep 05
* 12 months
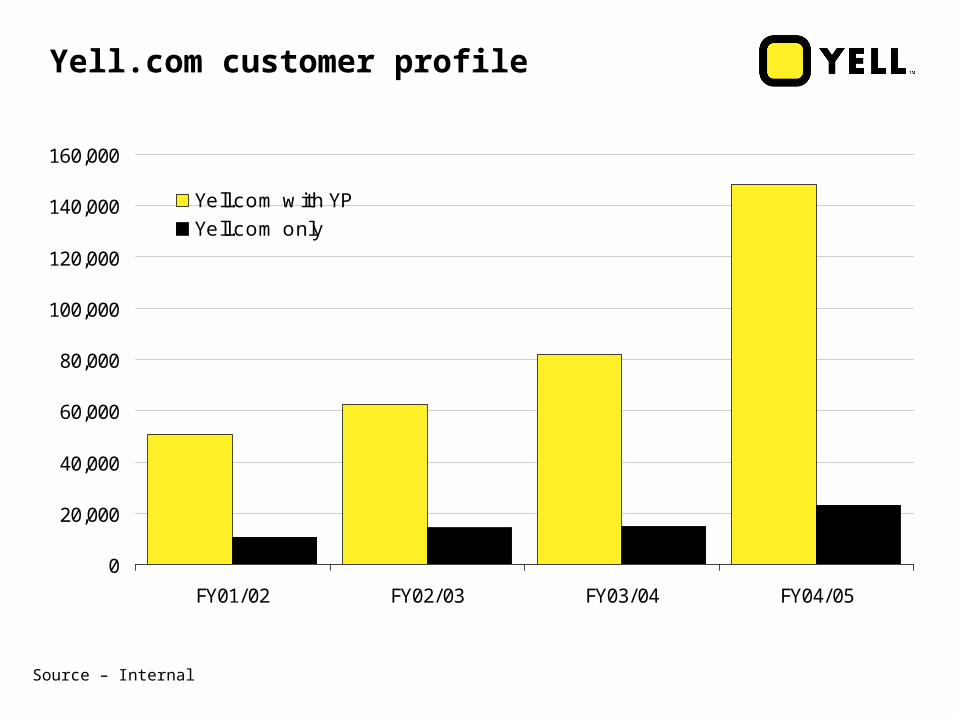
Yell.com customer profile
0
20,000
40,000
60,000
80,000
100,000
120,000
140,000
160,000
FY01/02 FY02/03 FY03/04 FY04/05
Yell.com with YPYell.com only
Source – Internal

Product

Monetization of a page
Ratecard correct as at November 2005

Sponsored listings – new product
National sponsored listings 38 location neutral
classifications 3 rotations per position Served nationally
Local sponsored listings All other classifications 1 rotation per classification
and YP book area Served locally

Sponsored listing Average Value of Account comparison
ADVERT TYPE INDEXED
Yell.com searchable advertisers
(12 month contracts)100
Local sponsored listings(12 month contracts)
655
National sponsored listings(6 month contracts)
5,009

Enhanced listing info page – new product

Active Hotel
Launched in October ’04
Yell.com receives commission on the booking– internet
– by phone
Over 2000 UK hotels participate in the scheme
Hotel data include description, facilities, directions, local attractions, photographs, rating and booking facilities

Active Hotel

Active Hotels 2005 booking revenue (indexed)
0
100
200
300
400
500
600
J an Feb Mar Apr May J un J ul Aug Sep Oct
Active booking line published
on the enhanced listing

Strategy

Growth strategy – users(User centric is key to our approach) Search and maps
– Single search (keyword search) in 2006
– Intuitive (intelligent search) in 2006
– Continue with content upfront (not click through)
– Improve location thesaurus
– Company name search
– Proximity search
User registration (470,000+)– Benefit package to encourage registration and loyalty
Key investment– Search and maps
– Brand
– Mobile delivery of information
Content– B2B
– Verticals

New maps (December 2005)
New display
Vector (draggable) maps
Capable of super-imposing image
Car park
Search for advertisers
By map

A comparison of UK sites with maps
Prepared: 30th Nov 05
Large images
Vector maps
Routing options
Car parks
Diagonal pan
Dragable (Ajax
or Flash)
Aerial images
Printer friendly
Google.co.uk YES YES NO NO NO YES YES YES
Yahoo.co.uk YES YES YES YES NO YES NO NO
Multimap YES YES YES NO YES NO YES YES
Thomsonlocal.com
NO YES YES NO NO NO NO YES
AskJeeves YES YES YES NO YES NO NO YES
Microsoft search YES YES YES NO YES NO NO YES
Yell.com (Dec 05) YES YES YES YES YES YES YES YES

Growth strategy - advertisers
Flexible return and rate card (flexible period)– Non classification based search (expand market)
– Capture new advertiser e.g. brand
New sectors– B2B
– Verticals (aggregate via web link)
Sales– Traditional sales channel
– Agency Sales
– Yell Direct (www.Yelldirect.com)
– Proven Value

Yell.com proven value
For every Yell.com customer we collect:– Number of times their ad is
viewed ‘in area’
– Number of times their ad is viewed ‘out of area’
– Number of clickthroughs
– Number of location maps viewed
– Performance against National and Regional averages
All of these stats are available for use by Sales, Customer Services and Marketing
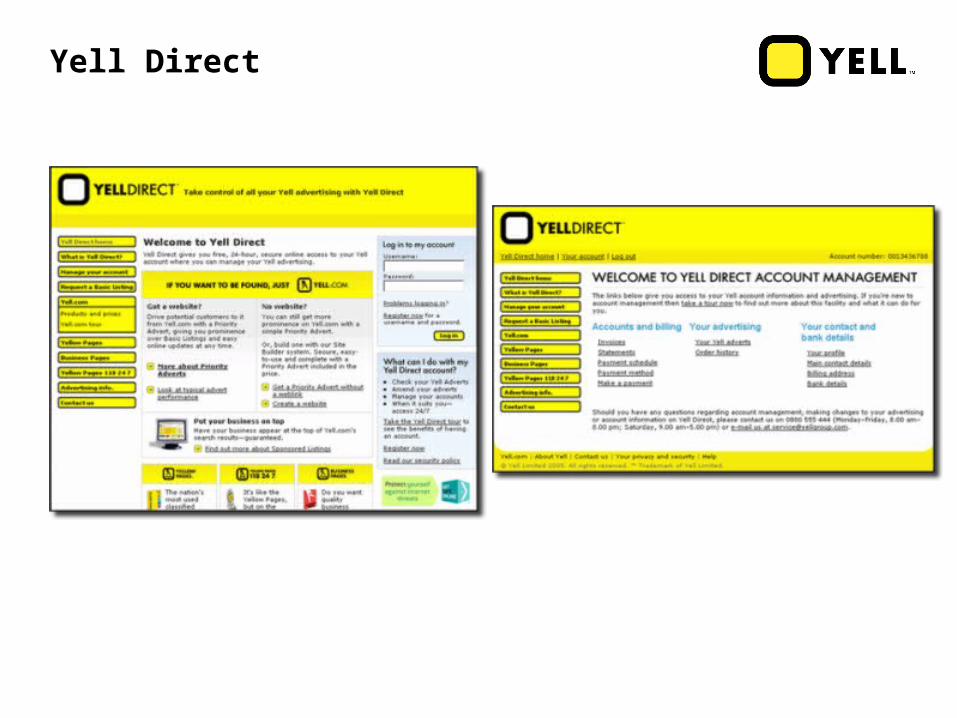
Yell Direct

Conclusion
Yell.com is positioned
To attract usage and advertising
To maintain growth
To move into new markets