investor presentation - the andersons, inc
TRANSCRIPT

Investor Presentation November 2019

Forward Looking Statements
2
Certain information discussed today constitutes forward-looking statements. Actual resultscould differ materially from those presented in the forward looking statements as a result ofmany factors including general economic conditions, weather, competitive conditions in theCompany’s industries, both in the U.S. and internationally, and additional factors that aredescribed in the Company’s publicly-filed documents, including its ’34 Act filings and theprospectuses prepared in connection with the Company’s offerings.
This presentation includes financial information which the Company’s independent auditorshave not completely reviewed. Although the Company believes that the assumptions uponwhich the financial information and its forward looking statements are based arereasonable, it can give no assurances that these assumptions will prove to be accurate.
This presentation contain non-GAAP financial measures. The Company believes adjustedpretax income, adjusted pretax income attributable to The Andersons, adjusted net income,adjusted EPS, EBITDA and adjusted EBITDA provide additional information to investors andothers about its operations, allowing an evaluation of underlying operating performanceand better period-to-period comparability. Adjusted pretax income, adjusted pretax incomeattributable to The Andersons, adjusted net income, adjusted EPS, EBITDA and adjustedEBITDA do not and should not be considered as alternatives to net income or incomebefore income taxes as determined by generally accepted accounting principles.Reconciliations of the GAAP to non-GAAP measures may be found within the appendix ofthis presentation.

Company and Financial Overview 4
Trade (and formerly Grain) Group 12
Ethanol Group 18
Plant Nutrient Group 24
Rail Group 30
2019 Outlook 35
Appendix 36
3
Table of Contents

The Andersons
$44MGrain (23%)
2014-2018 Average Adjusted EBITDA by Business3
Lansing Trade Group Acquisition and ELEMENT to Significantly Boost EBITDA
Founded Listed (NASDAQ) Market Cap1 Employees U.S. Locations Dividend History2
1947 1996, ANDE ~$620M ~2,600 ~140 22 Years
1 As of 11/1/19. 2 Consecutive years of paying a dividend. 3 Excludes Retail Group (closed in June 2017). Ethanol and Grain results exclude ratable portion of IDA adjustments on equity income from affiliates. Non-GAAP measure. See reconciliation tables in Appendix.
4
$48MPlant Nutrient (24%)
$43MEthanol (22%)
$60MRail (31%)
Top 10 U.S. Player in All Four Sectors
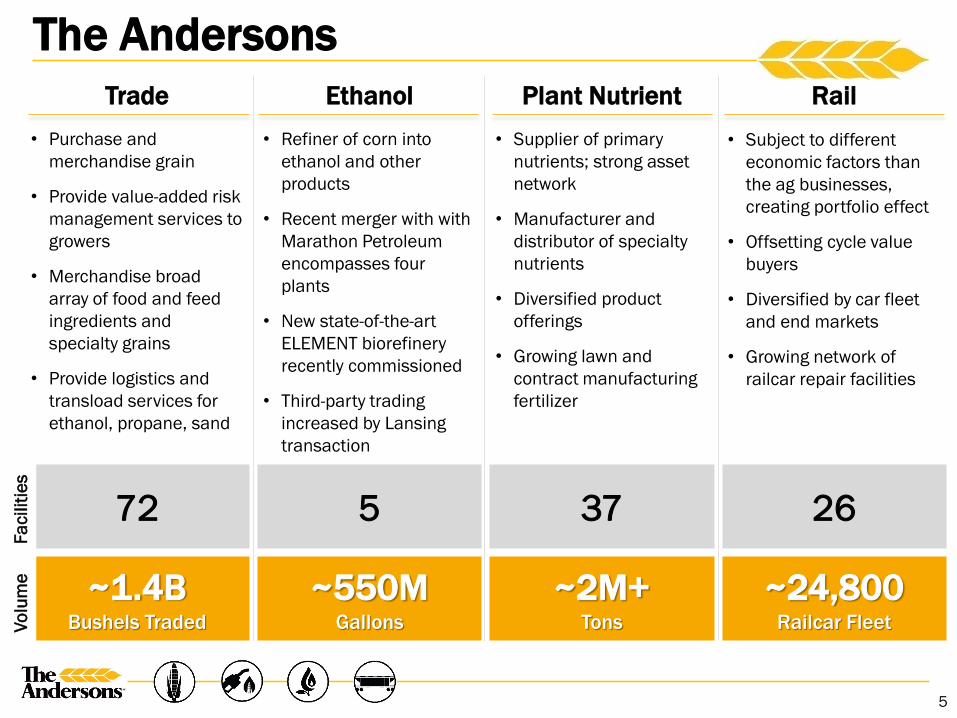
The AndersonsTrade Ethanol Plant Nutrient Rail
• Purchase and merchandise grain
• Provide value-added risk management services to growers
• Merchandise broad array of food and feed ingredients and specialty grains
• Provide logistics and transload services for ethanol, propane, sand
• Refiner of corn into ethanol and other products
• Recent merger with with Marathon Petroleum encompasses four plants
• New state-of-the-art ELEMENT biorefinery recently commissioned
• Third-party trading increased by Lansing transaction
• Supplier of primary nutrients; strong asset network
• Manufacturer and distributor of specialty nutrients
• Diversified product offerings
• Growing lawn and contract manufacturing fertilizer
72 5 37 26
~1.4B Bushels Traded
~550MGallons
~2M+Tons
~24,800Railcar Fleet
Faci
litie
sVo
lum
e
5
• Subject to different economic factors than the ag businesses, creating portfolio effect
• Offsetting cycle value buyers
• Diversified by car fleet and end markets
• Growing network of railcar repair facilities

6
Strong Geographic Footprint
~140 Locations Across the U.S., Canada, Puerto Rico & England
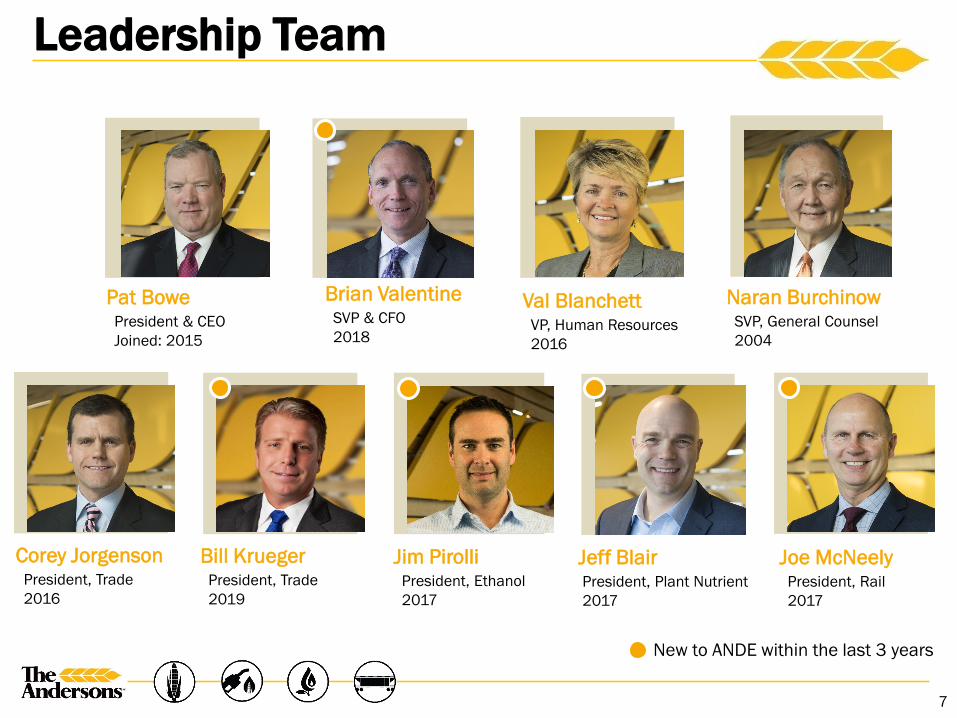
Leadership Team
Pat BowePresident & CEOJoined: 2015
Corey JorgensonPresident, Trade2016
Jeff BlairPresident, Plant Nutrient2017
Joe McNeelyPresident, Rail2017
New to ANDE within the last 3 years
Val BlanchettVP, Human Resources2016
Brian ValentineSVP & CFO2018
Naran BurchinowSVP, General Counsel2004
Jim PirolliPresident, Ethanol2017
7
Bill KruegerPresident, Trade2019

Leveraging Our Solid Foundation
CORE STRENGTHSCOMPETITIVE DIFFERENTIATORS
70+ years of market expertise and ingenuity with unique assets in place to provide customer solutions
Well respected history as partner of choice with deep customer relationships
Strong market presence in Eastern Corn Belt
Solid reputation due to nimble and customized approach
Experienced, dedicated leadership focused on profitable growth
Culture built on strong values and community stewardship
Focus on safety and operational efficiency
Merchandising, plant operations, logistics and risk management
Strong portfolio and balance sheet to weather industry cycles
8

9
Q3 ‘19 Highlights
Continued benefits from the Lansing acquisition and stronger merchandising income drove improved results
Remained profitable despite difficult margin environment; ELEMENT began production; created single legal entity with Marathon to hold our 4 existing plants
Posted year-over-year improvement on weather-delayed volume increase tempered by lower margin per ton due to product mix
Lower leasing income and negligible car sale income led to a decline in year-over-year results
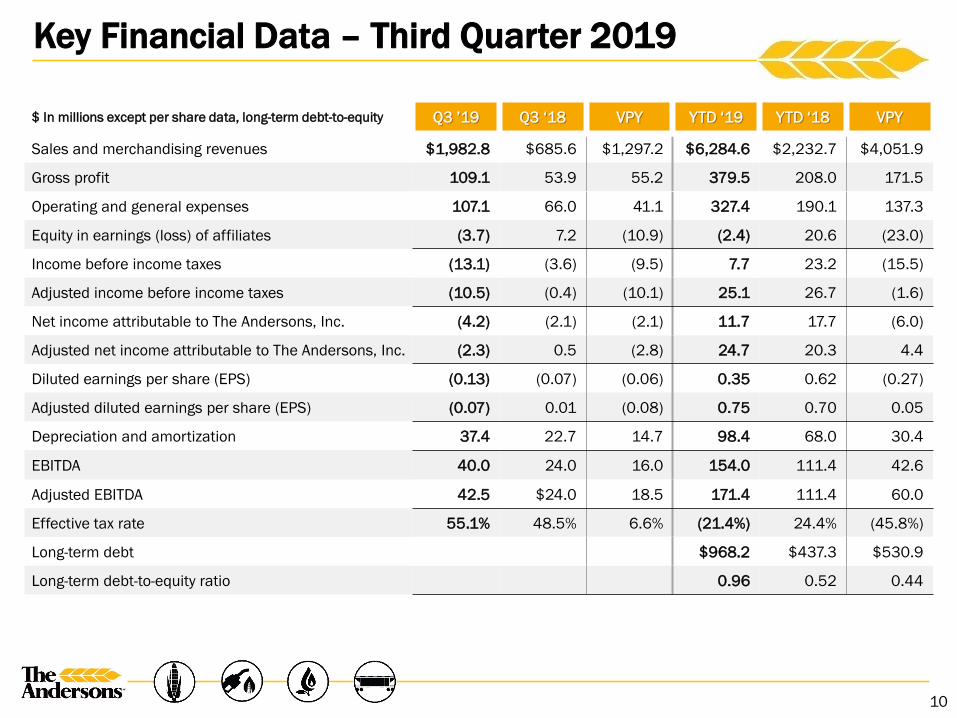
Key Financial Data – Third Quarter 2019
10
$ In millions except per share data, long-term debt-to-equity Q3 ’19 Q3 ‘18 VPY YTD ‘19 YTD ‘18 VPY
Sales and merchandising revenues $1,982.8 $685.6 $1,297.2 $6,284.6 $2,232.7 $4,051.9
Gross profit 109.1 53.9 55.2 379.5 208.0 171.5
Operating and general expenses 107.1 66.0 41.1 327.4 190.1 137.3
Equity in earnings (loss) of affiliates (3.7) 7.2 (10.9) (2.4) 20.6 (23.0)
Income before income taxes (13.1) (3.6) (9.5) 7.7 23.2 (15.5)
Adjusted income before income taxes (10.5) (0.4) (10.1) 25.1 26.7 (1.6)
Net income attributable to The Andersons, Inc. (4.2) (2.1) (2.1) 11.7 17.7 (6.0)
Adjusted net income attributable to The Andersons, Inc. (2.3) 0.5 (2.8) 24.7 20.3 4.4
Diluted earnings per share (EPS) (0.13) (0.07) (0.06) 0.35 0.62 (0.27)
Adjusted diluted earnings per share (EPS) (0.07) 0.01 (0.08) 0.75 0.70 0.05
Depreciation and amortization 37.4 22.7 14.7 98.4 68.0 30.4
EBITDA 40.0 24.0 16.0 154.0 111.4 42.6
Adjusted EBITDA 42.5 $24.0 18.5 171.4 111.4 60.0
Effective tax rate 55.1% 48.5% 6.6% (21.4%) 24.4% (45.8%)
Long-term debt $968.2 $437.3 $530.9
Long-term debt-to-equity ratio 0.96 0.52 0.44

11
Pretax IncomeQ3 ’18 Adjusted Pretax Income to Q3 ’19 Adjusted Pretax Income Q3 ‘19 Reconciliation
($00
0)
Note: Amounts above exclude net income (loss) attributable to the noncontrolling interests of $223 in Q3 ’18 and ($1,633) in Q3 ‘19.
($14,000)
($12,000)
($10,000)
($8,000)
($6,000)
($4,000)
($2,000)
$0
$2,000
$4,000
$6,000
$8,000
$10,000
$12,000
($176)
$10,468
$536
($2,595)
($11,260)
($7,500) ($10,527) ($10,527)
($13,081) $2,554

12
Pretax IncomeYTD ’18 Adjusted Income to YTD ’19 Adjusted Pretax Income YTD ‘19 Reconciliation
Note: Amounts above exclude net income (loss) attributable to the noncontrolling interests of ($175) in YTD ’18 and ($2,265) in YTD ‘19.
$0
$5,000
$10,000
$15,000
$20,000
$25,000
$30,000
$35,000
$40,000
$45,000
$50,000
$55,000
$26,688 ($3,705)
($5,328)
($16,624)
$25,077
$7,735
$25,077($16)
$24,062
($00
0)
$17,342

Trade (formerly Grain) Group at a Glance
Champaign, IL Melfort, SK Toledo, OH
13
Bliss, ID
Top 5 U.S. Grain and Ingredients Merchant
~1.4B Bushels
~216MBushels
96MBushels
4MTonnes
1.7MTonnes
Total GrainTraded Total Space Capacity Risk Management
Products Feed Ingredients Specialty Ingredients

Complementary Geographic Assets & Footprint
Expanded Geographic Footprint
• Geographic expansion into Western Corn Belt/Great Plains, and Eastern Canada
• Further diversification of activities outside of traditional product and geographic regions
• Greater scale in the agricultural marketplace
Andersons facilitiesFormer Lansing facilitiesThompsons facilities
IA IL
SK
NM
ID
NE
MN
TX
IN
NY
OH
TN NC
VA
LA
MI
ON
MB
14

Trade Group
15
Q3 ‘19 Highlights
Adj. Pretax Income ($M)
• Strong results from western assets offset by impacts of planting-related issues in the Eastern Corn Belt• Solid merchandising results considering market backdrop• More than $10 million in run-rate synergies identified and being implemented
2015 2016 2017 2018 2019
Q1 Q2 Q3 Q4
3
$14 ($16)
$24 $22
1 Excludes gain of $23.1 from partial redemptions of our investment in Lansing Trade Group and goodwill impairment charges of $46.4. 2 Excludes asset impairment charges of $10.9. 3 Excludes acquisition costs of $14.3 and asset impairment charges of $3.1.
1 2
$27
Unaudited in $M Q3 ‘19 Q3 ‘18 VPY YTD ‘19 YTD ’18 VPY
Revenues $1,580.1 $342.6 $1,237.5 $4,944.5 $983.7 $3,960.8
Gross Profit $74.8 $15.8 $59.0 $246.6 $74.9 $171.7
Pretax Income (loss) ($2.0) ($9.9) $7.9 $4.3 ($2.5) $6.8
Adjusted PretaxIncome (loss) $0.6 ($9.9) $10.5 $21.6 ($2.5) $24.1
EBITDA $18.4 ($3.7) $22.1 $70.8 $18.8 $52.1
Adjusted EBITDA $20.9 ($3.7) $24.6 $88.2 $18.8 $69.4

Executing on Growth Initiatives to Improve Earnings Capacity
2019 -2020 2021 - 2022
• Exceed stated $10M run-rate synergy goal by end 2020
• Successfully complete all Integration Management Office milestones
• Aggressively capture commercial synergies to drive earnings growth
• Identify and execute on organic growth opportunities across the business
• $5 to $7M incremental run-rate synergies by end 2021
• Grow Food and Specialty Ingredients earnings capacity
• Grow risk management products (Freedom)
• Generate annual adjusted EBITDA of $125M to $135M
16
Near- and Long-term Goals

17
This page left intentionally blank

Greenville, OH
Albion, MI
Denison, IA
Top 10 U.S. Ethanol Producer
Strategically Located Ethanol Plants
ELEMENT LLCOpened August 2019
MI
IA
OHIN
KS
Clymers, IN
18
Ethanol Group Overview
The Andersons Marathon Holdings LLCEffective October 2019

• 70 million gallons per year ethanol capacity
• $175 million joint investment
• The Andersons (51% owner) provides grain origination; ethanol and RIN marketing; and risk management and other support services; to provide carbon credit marketing
• ICM (49% owner) provides plant construction, engineering, manufacturing, operations and management services
• Significantly enhanced margins ($0.10 to $0.25 per gallon)
Project Summary Timeline• Construction began March 2018
• Production began August 2019
• Expect to be fully operational by the end of 2019
• Expected to begin generating carbon credits and cellulosic RINs in mid-2020
ELEMENT™, Colwich, Kansas, September 2019
ELEMENT, LLC
19

Improved ethanol and corn oil production and yield
Production of low carbon intensity ethanol, generating carbon credits
Production of cellulosic ethanol, generating cellulosic RINs
Production of higher value feed products
Significant energy usage reduction in both natural gas and electricity
Technology Innovations
ICM’s technologies will help ELEMENTmake these advancements
™
ELEMENT, LLC
20

Production Capacity Attributable to ANDE: ~275MGY
Plant Open Date Capacity(MGY)
Ownership
The Andersons Marathon Holdings LLC 50.1%
Albion, MI Aug. 2006 140
Clymer, IN Apr. 2007 135
Greenville, OH Feb. 2008 140
Denison, IA May 2012 60
ELEMENT, LLC 51%
Colwich, KS Aug. 2019 70
Key Benefits• Stable service fee income• Strategic partnerships with
largest end user in the U.S. and foremost technology provider in the world
• Diversified geographic footprint
• Negotiation leverage to drive production costs lower
• Technology vetting opportunities
• Improved benchmarking and market intelligence
Ethanol Group
21

Ethanol Group
22
• Group remained profitable, but pretax income down sharply on weak margins due to elevated corn basis
• Increased ethanol trading boosted results
• ELEMENT startup expenses added to year-over-year shortfall
2015 2016 2017 2018 2019
Q1 Q2 Q3 Q4
$29 $25
$19
$22
Pretax Income Attributable to The Andersons, Inc. ($M)
$6
Q3 ‘19 Highlights
Unaudited in $M Q3 ‘19 Q3 ‘18 VPY YTD ‘19 YTD ‘18 VPY
Revenues $254.1 $195.7 $58.4 $708.0 $571.1 $136.9
Equity in Earnings of Affiliates ($3.6) $4.8 ($8.4) ($0.5) $10.7 ($11.2)
Consolidated Operations and Services Fees $2.9 $5.8 ($2.9) $4.4 $9.8 ($5.4)
Pretax Income (Loss) ($0.7) $10.6 ($11.3) $3.9 $20.5 ($16.6)
Attributable to Noncontrolling Interest ($1.6) $0.2 ($1.8) ($2.3) ($0.2) ($2.1)
Pretax Income Attributable to The Andersons, Inc. $0.9 $10.4 ($9.5) $6.2 $20.7 ($14.5)

Executing on Growth Initiatives to Improve Earnings Capacity
• Produce cellulosic ethanol from corn kernel fiber
• Add high-protein DDGs production at 1 to 2 plants
• Increase gallons under management from ~475M to 550M+
• Add high-protein DDGs production at all plants
• Increase gallons under management to 660M+
• Generate annual EBITDA attributable to the company of $85M to $95M
2019 - 2020 2021 - 2022
Near- and Long-term Goals
23

MN
IA
WI
NE
NC
AL
IL INOH
MI
Wholesale Fertilizer Facility Farm Center Facility Lawn Facility Cob Facility
Puerto Rico
• Natural adjacency to the Grain business, leveraging grower relationships and intelligence and a drive to bring growers value sustainability
• Founded in wholesale distribution of basic row crop fertilizer (NPK)
• Significant expansion of specialty nutrient capabilities
Plant Nutrient Foundation with a Value-added Focus…
Creates value for Farmers and Shareholders
• Delivers sustainable and precision agriculture solutions
• Specialty nutrients helps maximize yields and minimize environmental impact
• Improves economics for growers
Plant Nutrient Group Overview
24

Committed to Growth of Specialty Nutrients
• 2.2M tons sold is about 4.5% of total ~50M ton fertilizer market
• Our market share is 15% to 18%1
in our core areas
• Maintaining our market share Volumes steady, lower margins Wholesale entitlement radius
100 miles, retail 30 miles
Background Tons Sold (000s)2
254 214287
109108
95
1513
13
Q3 '17 Q3 '18 Q3 '19
Primary Nutrients Specialty Nutrients Other Tons
1 Based on Company estimates. 2 Primary nutrients = nitrogen, phosphorous, potassium (including those sold by farm centers); specialty nutrients = low-salt liquid starter fertilizers, and micro-nutrient (including those sold by farm centers) and lawn fertilizers; other tons = cob products.
Plant Nutrient Group
25
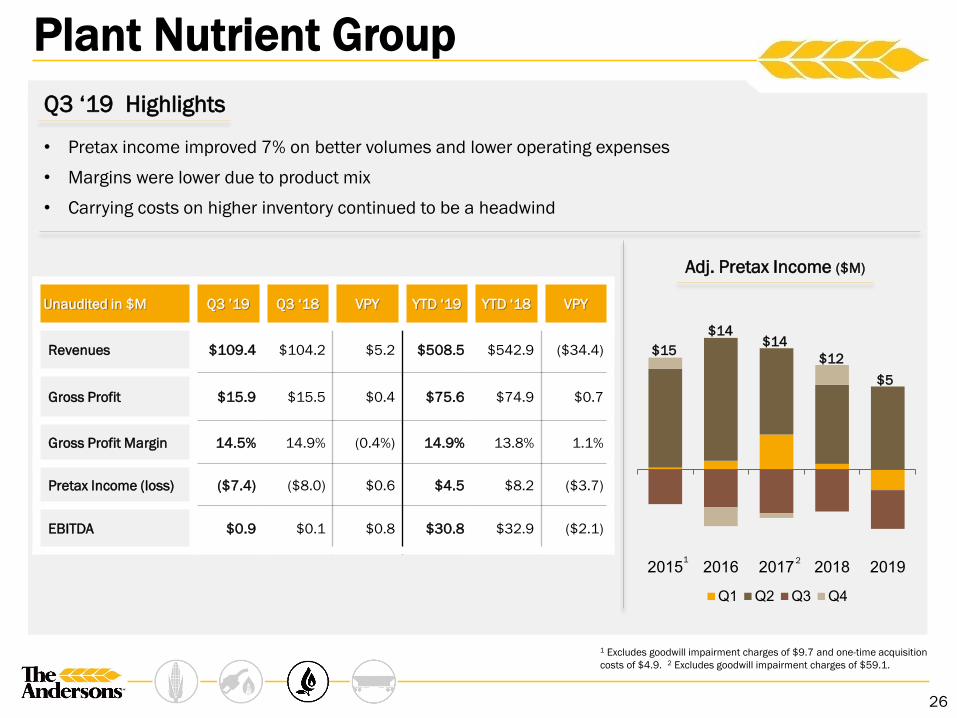
Plant Nutrient Group
Adj. Pretax Income ($M)
• Pretax income improved 7% on better volumes and lower operating expenses
• Margins were lower due to product mix
• Carrying costs on higher inventory continued to be a headwind
2015 2016 2017 2018 2019
Q1 Q2 Q3 Q4
$15$14
$14
$5$12
1 Excludes goodwill impairment charges of $9.7 and one-time acquisition costs of $4.9. 2 Excludes goodwill impairment charges of $59.1.
1 2
Q3 ‘19 Highlights
26
Unaudited in $M Q3 ’19 Q3 ‘18 VPY YTD ‘19 YTD ‘18 VPY
Revenues $109.4 $104.2 $5.2 $508.5 $542.9 ($34.4)
Gross Profit $15.9 $15.5 $0.4 $75.6 $74.9 $0.7
Gross Profit Margin 14.5% 14.9% (0.4%) 14.9% 13.8% 1.1%
Pretax Income (loss) ($7.4) ($8.0) $0.6 $4.5 $8.2 ($3.7)
EBITDA $0.9 $0.1 $0.8 $30.8 $32.9 ($2.1)

Physical Product Flow: Factory to Field
Wholesale Distribution Capacity is Critical to Ag Supply Chain
75% of Supply Moves through Distributors Like ANDE
Storage(Distribution)Manufacturers Farmers
Retailers, Dealers and
Co-ops
27

Executing on Growth Initiatives to Improve Earnings Capacity
• Continue the turnaround
• Re-energize sales organization
• Implement new IT system successfully
• Align organizational structure for productivity and future growth
• Broaden operational excellence
• Continue to establish strategic alliances with customers and suppliers
• Develop new products that are sustainable and environmentally friendly
• Grow specialty tons by 3% to 5% per year
• Generate annual EBITDA of $60M to $65M
28
2019 - 2020 2021 - 2022
Near- and Long-term Goals

29
This page left intentionally blank

Key Metrics
~24,800 Railcars
90.3% Average Utilization Rate1
~22,500 Cars on Lease2
26 Railcar Repair Facilities2
Railcar Fleet by Commodity2
~150 Commodities Handled
Rail Group Overview
30
1 Average of Q3 ’19. 2 As of 9/30/19.
28%
3%
4%
5%
5%
6%
7%
8%
11%
23%
Other
Aggregates & Limestone
Chemicals
Metals & Products
Ethanol & Gasoline
Wood & Forestry/Paper
Plastics
Sand/Sand Products
Fertilizer/Minerals
Grain/Grain Products
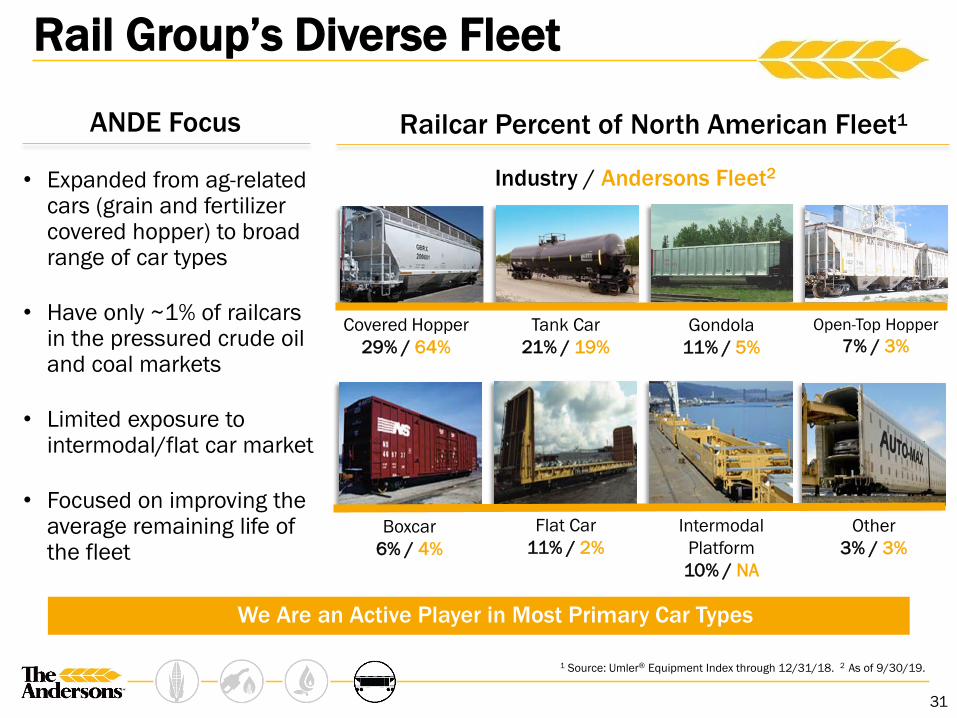
We Are an Active Player in Most Primary Car Types
• Expanded from ag-related cars (grain and fertilizer covered hopper) to broad range of car types
• Have only ~1% of railcars in the pressured crude oil and coal markets
• Limited exposure to intermodal/flat car market
• Focused on improving the average remaining life of the fleet
Railcar Percent of North American Fleet1
Covered Hopper29% / 64%
Open-Top Hopper7% / 3%
Gondola11% / 5%
Boxcar6% / 4%
Flat Car11% / 2%
Other3% / 3%
Intermodal Platform10% / NA
Tank Car21% / 19%
Industry / Andersons Fleet2
ANDE Focus
1 Source: Umler® Equipment Index through 12/31/18. 2 As of 9/30/19.
Rail Group’s Diverse Fleet
31
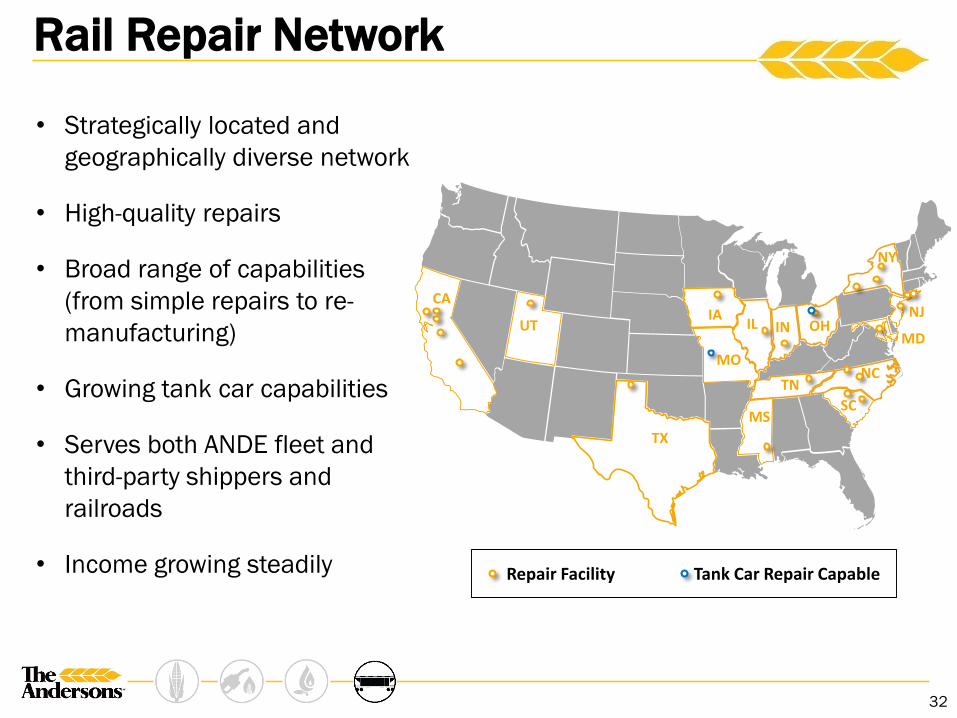
• Strategically located and geographically diverse network
• High-quality repairs
• Broad range of capabilities (from simple repairs to re-manufacturing)
• Growing tank car capabilities
• Serves both ANDE fleet and third-party shippers and railroads
• Income growing steadily Repair Facility Tank Car Repair Capable
CA
UT
SCMS
IAIN
MO
NY
OHMD
TX
ILNJ
NC
Rail Repair Network
32
TN

Rail Group
33
• Lease income fell due to lower lease rates and utilization and headwinds in grain, frac sand and ethanol markets
• Income from car sales was negligible as planned
• Repair business results lagged prior year on higher labor and benefits expenses
2015 2016 2017 2018 2019
Q1 Q2 Q3 Q4
$17
$51
$25
$32
$11
Q3 ‘19 Highlights
Unaudited in $M Q3 ‘19 Q3 ‘18 VPY YTD ‘19 YTD ‘18 VPY
Revenues $39.1 $43.1 ($4.0) $123.5 $135.0 ($11.5)
Gross Profit $11.8 $14.8 ($3.0) $42.5 $40.9 $1.6
Gross Profit Margin 30.3% 34.3% (4.0%) 34.4% 30.3% 4.1%
Lease Income $2.0 $2.5 ($0.5) $8.0 $6.7 $1.3
Railcar Sales Income $0.1 $1.9 ($1.8) $1.1 $1.2 ($0.1)
Service and Other Income $1.0 $1.3 ($0.3) $1.5 $2.7 ($1.2)
Pretax Income $3.1 $5.7 ($2.6) $10.6 $10.6 $ -
EBITDA $16.1 $15.7 $0.4 $48.1 $40.0 $8.1
Pretax Income ($M)

Executing on Initiatives to Grow Earnings and Operating Cash Capacity
• Grow railcar fleet from 23,000+ to 24,000 cars
• Add 2 to 3 repair facilities per year
• Generate Annual EBITDA of $55M to $65M
• Grow railcar fleet to 25,000 to 26,000 cars
• Add 2 to 3 repair facilities per year
• Generate annual EBITDA of $65M to $75M
2019 - 2020 2021 - 2022
Near- and Long-term Goals
34

2019 Outlook
35
Lower production in our core eastern footprint will reduce volume; merchandising opportunities are solid across the remainder of the portfolio
Near-term margin picture has allowed hedging opportunities that should improve results; ELEMENT plant will bring new products online
Full-year year view unchanged; results to fall well below those of the prior year due to the impact of the wet planting season
Utilization rates should stay above 90 percent; cars under lease should continue to increase

Appendix
36
Definitions
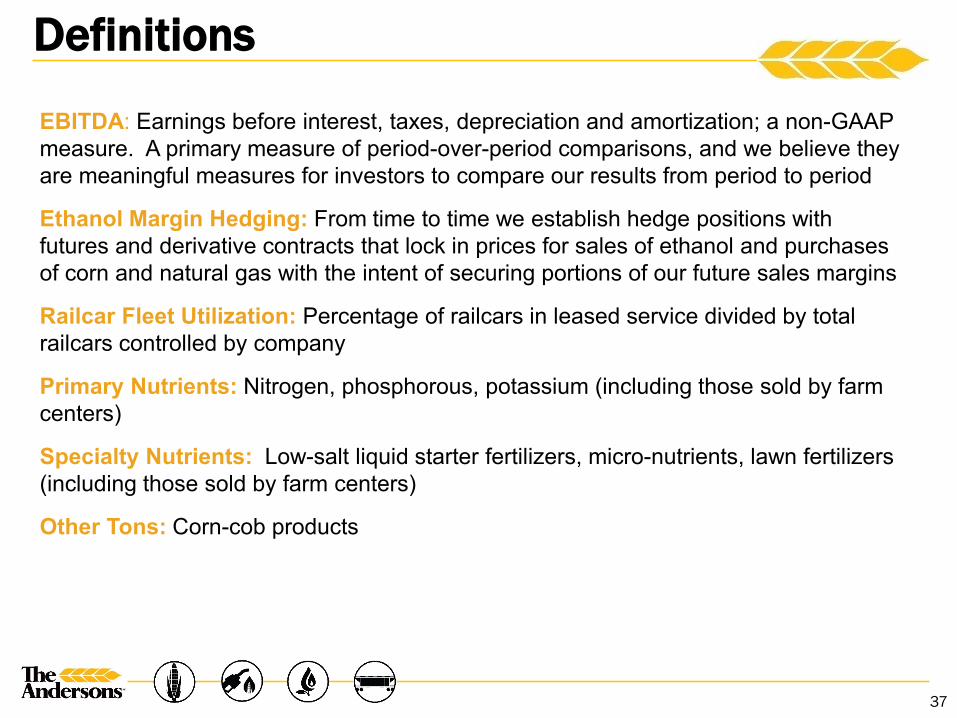
EBITDA: Earnings before interest, taxes, depreciation and amortization; a non-GAAP measure. A primary measure of period-over-period comparisons, and we believe they are meaningful measures for investors to compare our results from period to period
Ethanol Margin Hedging: From time to time we establish hedge positions with futures and derivative contracts that lock in prices for sales of ethanol and purchases of corn and natural gas with the intent of securing portions of our future sales margins
Railcar Fleet Utilization: Percentage of railcars in leased service divided by total railcars controlled by company
Primary Nutrients: Nitrogen, phosphorous, potassium (including those sold by farm centers)
Specialty Nutrients: Low-salt liquid starter fertilizers, micro-nutrients, lawn fertilizers (including those sold by farm centers)
Other Tons: Corn-cob products
37

Historical Performance ($M)
Gross Profit Adj. EBITDA1 Adj. Pretax Income1 Capital Investments2
$397 $376
$346
$319 $302
2014 2015 2016 2017 2018
$238
$175
$124
$157
$178
2014 2015 2016 2017 2018
$154
$76
$19
$49
$60
2014 2015 2016 2017 2018
$118 $111 $106
$141
$251
2014 2015 2016 2017 2018
1 Non-GAAP measure. See reconciliation tables in Appendix. 2 Investments in PP&E and net investments in Rail Group assets as disclosed in statement of cashflows.
38

$M Trade Ethanol Plant Nutrient Rail Other Total
Nine Months Ended September 30, 2019
Income (loss) before income taxes $ 4.3 $ 3.9 $ 4.5 $ 10.6 $ (15.6) $ 7.7
Income (loss) attributable to the noncontrolling interests - (2.3) - - - (2.3)
Income (loss) before income taxes attributable to The Andersons, Inc.1 4.3 6.2 4.5 10.6 (15.6) 10.0
Interest expense 29.0 (1.5) 6.5 12.1 (0.4) 45.6
Deprecation and amortization 37.5 7.1 19.8 25.4 8.6 98.4
Earnings before interest, taxes, depreciation and amortization (EBTIDA) 70.8 11.7 30.8 48.1 (7.4) 154.0
Adjusting items impacting EBITDA:
One time acquisition costs 6.9 - - - - 6.9
Transaction related stock compensation 7.3 - - - - 4.8
Asset impairment 3.1 3.1
Total adjusting items 17.3 - - - - 14.8
Adjusted EBITDA $ 88.2 $ 11.7 $ 30.8 $ 48.1 $ (7.4) $ 171.4
Reconciliation to EBITDA and Adjusted EBITDA
1 Income (loss) before income taxes attributable to The Andersons, Inc. for each Group is defined as net sales and merchandising revenues plus identifiable other income less all identifiable operating expenses, including interest expense for carrying working capital and long-term assets and is reported net of the noncontrolling interest share of income (loss).
39

$M Grain Ethanol Plant Nutrient Rail Other Total
Nine Months Ended September 30, 2018
Income (loss) before income taxes $ (2.5) $ 20.5 $ 8.2 $ 10.6 $ (13.6) $ 23.2
Income (loss) attributable to the noncontrollinginterests - (0.2) - - - (0.2)
Income (loss) before income taxes attributable to The Andersons, Inc.1 (2.5) 20.7 8.2 10.6 (13.6) 23.4
Interest expense 9.0 (1.1) 4.4 7.7 - 20.0
Deprecation and amortization 12.3 4.6 20.3 21.7 9.1 68.0
Earnings before interest, taxes, depreciation and amortization (EBTIDA) $ 18.8 $ 24.2 $ 32.9 $ 40.0 $ (4.5) $ 111.4
Adjusting items impacting EBITDA:
Acquisition costs - - - - 3.5 3.5
Adjusted EBITDA $ 18.8 $ 24.2 $ 32.9 $ 40.0 $ (1.1) $ 114.8
Reconciliation to EBITDA and Adjusted EBITDA
1 Income (loss) before income taxes attributable to The Andersons, Inc. for each Group is defined as net sales and merchandising revenues plus identifiable other income less all identifiable operating expenses, including interest expense for carrying working capital and long-term assets and is reported net of the noncontrolling interest share of income (loss).
40

$M Grain Ethanol Plant Nutrient Rail Other Total
Year Ended December 31, 2018
Income (loss) before income taxes $ 26.7 $ 21.9 $ 12.0 $ 17.4 $ (24.8) $ 53.2
Income (loss) attributable to the noncontrolling interests - (0.2) - - - (0.2)
Income (loss) before income taxes attributable to The Andersons, Inc.1 26.7 22.1 12.0 17.4 (24.8) 53.4
Interest expense 11.8 (1.9) 6.5 11.3 - 27.8
Depreciation and amortization 16.1 6.1 26.9 29.2 12.1 90.4
Earnings before interest, taxes, depreciation and amortization (EBITDA) 54.6 26.4 45.4 57.9 (12.7) 171.6
Adjusting items impacting EBITDA
Acquisition costs - - - - 6.5 6.5
Earnings before interest, taxes, depreciation and amortization (EBTIDA) $ 54.6 $ 26.4 $ 45.4 $ 57.9 $ (6.2) $ 178.1
Reconciliation to EBITDA and Adjusted EBITDA
1 Income (loss) before income taxes attributable to The Andersons, Inc. for each Group is defined as net sales and merchandising revenues plus identifiable other income less all identifiable operating expenses, including interest expense for carrying working capital and long-term assets and is reported net of the noncontrolling interest share of income (loss).
41
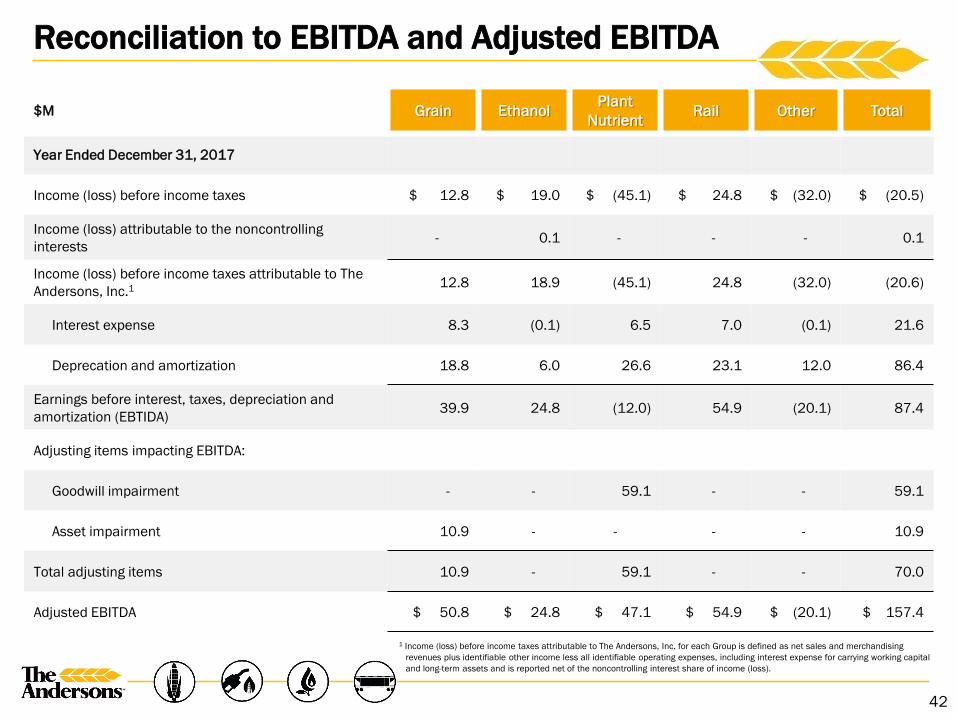
$M Grain Ethanol Plant Nutrient Rail Other Total
Year Ended December 31, 2017
Income (loss) before income taxes $ 12.8 $ 19.0 $ (45.1) $ 24.8 $ (32.0) $ (20.5)
Income (loss) attributable to the noncontrolling interests - 0.1 - - - 0.1
Income (loss) before income taxes attributable to The Andersons, Inc.1 12.8 18.9 (45.1) 24.8 (32.0) (20.6)
Interest expense 8.3 (0.1) 6.5 7.0 (0.1) 21.6
Deprecation and amortization 18.8 6.0 26.6 23.1 12.0 86.4
Earnings before interest, taxes, depreciation and amortization (EBTIDA) 39.9 24.8 (12.0) 54.9 (20.1) 87.4
Adjusting items impacting EBITDA:
Goodwill impairment - - 59.1 - - 59.1
Asset impairment 10.9 - - - - 10.9
Total adjusting items 10.9 - 59.1 - - 70.0
Adjusted EBITDA $ 50.8 $ 24.8 $ 47.1 $ 54.9 $ (20.1) $ 157.4
Reconciliation to EBITDA and Adjusted EBITDA
1 Income (loss) before income taxes attributable to The Andersons, Inc. for each Group is defined as net sales and merchandising revenues plus identifiable other income less all identifiable operating expenses, including interest expense for carrying working capital and long-term assets and is reported net of the noncontrolling interest share of income (loss).
42

$M Grain Ethanol Plant Nutrient Rail Retail Other Total
Year Ended December 31, 2016
Income (loss) before income taxes $ (15.7) $ 27.6 $ 14.2 $ 32.4 $ (8.8) $ (28.3) $ 21.4
Income (loss) attributable to the noncontrolling interests - 2.9 - - - - 2.9
Income (loss) before income taxes attributable to The Andersons, Inc.1 (15.7) 24.7 14.2 32.4 (8.8) (28.3) 18.5
Interest expense 8.0 - 6.4 6.5 0.5 (0.3) 21.1
Deprecation and amortization 18.2 5.9 28.7 20.1 2.4 9.0 84.3
Earnings before interest, taxes, depreciation and amortization (EBTIDA) 10.5 30.6 49.3 59.0 (5.9) (19.6) 123.9
Adjusting items impacting EBITDA:
Total adjusting items - - - - - - -
Adjusted EBITDA $ 10.5 $ 30.6 $ 49.3 $ 59.0 $ (5.9) $ (19.6) $ 123.9
Reconciliation to EBITDA and Adjusted EBITDA
1 Income (loss) before income taxes attributable to The Andersons, Inc. for each Group is defined as net sales and merchandising revenues plus identifiable other income less all identifiable operating expenses, including interest expense for carrying working capital and long-term assets and is reported net of the noncontrolling interest share of income (loss).
43

$M Grain Ethanol Plant Nutrient Rail Retail Other Total
Year Ended December 31, 2015
Income (loss) before income taxes $ (9.5) $ 30.3 $ 0.1 $ 50.7 $ (0.5) $ (82.7)
$ (11.6)
Income (loss) attributable to the noncontrolling interests - 1.8 - - - - 1.8
Income (loss) before income taxes attributable to The Andersons, Inc.1 (9.5) 28.5 0.1 50.7 (0.5) (82.7) (13.4)
Interest expense 5.8 0.1 7.2 7.0 0.4 (0.4) 20.1
Deprecation and amortization 19.2 5.9 25.2 18.5 2.5 7.2 78.5
Earnings before interest, taxes, depreciation and amortization (EBTIDA) 15.5 34.5 32.5 76.2 2.4 (75.9) 85.2
Adjusting items impacting EBITDA:
Goodwill impairment 46.4 - 9.7 - - - 56.1
Pension adjustment - - - - - 51.4 51.4
Partial redemption of investment in Lansing Trade Group (23.1) - - - - - (23.1)
One-time acquisition costs - - 4.9 - - - 4.9
Total adjusting items 23.3 - 14.6 - - 51.4 89.3
Adjusted EBITDA $ 38.8 $ 34.5 $ 47.1 $ 76.2 $ 2.4 $ (24.5) $ 174.5
Reconciliation to EBITDA and Adjusted EBITDA
1 Income (loss) before income taxes attributable to The Andersons, Inc. for each Group is defined as net sales and merchandising revenues plus identifiable other income less all identifiable operating expenses, including interest expense for carrying working capital and long-term assets and is reported net of the noncontrolling interest share of income (loss).
44

$M Grain Ethanol Plant Nutrient Rail Retail Other Total
Year Ended December 31, 2014
Income (loss) before income taxes $ 58.1 $ 105.2 $ 24.5 $ 31.4 $ (0.6) $ (34.5) $ 184.1
Income (loss) attributable to the noncontrolling interests - 12.9 - - - - 12.9
Income (loss) before income taxes attributable to The Andersons, Inc.1 58.1 92.3 24.5 31.4 (0.6) (34.5) 171.2
Interest expense 8.8 0.3 5.3 7.2 0.7 (0.5) 21.8
Deprecation and amortization 16.5 5.7 19.6 13.3 2.7 4.2 62.0
Earnings before interest, taxes, depreciation and amortization (EBTIDA) 83.4 98.3 49.4 51.9 2.8 (30.8) 255.0
Adjusting items impacting EBITDA:
Partial redemption of investment in Lansing Trading Group (17.1) - - - - - (17.1)
Total adjusting items (17.1) - - - - - (17.1)
Adjusted EBITDA $ 66.3 $ 98.3 $ 49.4 $ 51.9 $ 2.8 $ (30.8) $ 237.9
Reconciliation to EBITDA and Adjusted EBITDA
1 Income (loss) before income taxes attributable to The Andersons, Inc. for each Group is defined as net sales and merchandising revenues plus identifiable other income less all identifiable operating expenses, including interest expense for carrying working capital and long-term assets and is reported net of the noncontrolling interest share of income (loss).
45

Implemented Leverage and Liquidity Strategy…
…To Ensure Financial Flexibility
• Long-term Debt to Equity
− < 1:1 for Trade, Ethanol and Plant Nutrient
− < 3:1 for Rail
• No more than 20% of long-term debt maturing in any single year
• Working capital >$250M
• Net Debt to Adjusted EBITDA expected to remain < 4.0x
($M) 9/30/19 9/30/18
Cash $ 21 $ 17
Other Current Assets 1,453 861
Non-Current Assets 1,795 1,274
Total Assets $ 3,269 $ 2,152
Current Liabilities, excluding Current Portion of Long-Term Debt $ 984 $ 675
Long-Term Debt, Including Current Portion 1,035 453
Other Noncurrent Liabilities 239 181
Equity 1,011 843
Total Liabilities & Equity $ 3,269 $ 2,152
Noncurrent Long-Term Debt / Equity 0.96 0.52
46

M&A Strategy
S T R A T E G I C F I L T E R S F I N A N C I A L C R I T E R I A
Accretive to EPS within Two Years
ROIC Above Cost of Capital by Year 3
(risk-adjusted)
Payback Period on Long-lived Assets < 10 Years
Addresses Validated Customer Needs
Strengthens Geographic Footprint
Increases Scale
Provides Differentiation: Enables Ability to “Move Up Value Chain”
Fits Strategically; Core Or Adjacent
Disciplined, Focused and Strategic Approach
47

Capital Allocation Framework
77.2%
8.1%
9.7%5.0%
Uses of Cash: 2014 to 2018
$852M
Capital Investments
Acquisitions and Investments
Dividends
Share Repurchases
INVEST IN ORGANIC GROWTH
RETURN CASH TO
SHAREHOLDERS
PURSUE STRATEGIC
ACQUISITIONS
• Invest in adjacencies to increase penetration of existing service offerings and expand footprint
• Seek strategic, bolt-on targets
• Selectively use minority partner capital
• 22+ years of consecutive dividend payout, totaling more than $80M over the past five years
1 Acquisitions of businesses, purchases of investments (including investments in affiliates) and distributions to noncontrolling interests, net of proceeds from return on investments in affiliates, as disclosed in the statement of cash flows. 2 Purchases of treasury stock, offset by proceeds from sale of treasury shares to employees and directors and excess tax benefit from share-based payment arrangements, as disclosed in the statement of cash flows.
1
2
48

U.S. Corn HarvestGold states = ahead of 2018 harvestGray states = behind 2018 harvest
November 4, 2019
52%
November 4, 2018
74%
75%
Five Year Average
Percentage Harvested
49
October 19-20
168.2
October 19-19
176.4
Yield (Bushel/Acre)
Source: USDA crop progress report 11/4/19
Source: USDA 10/10/19
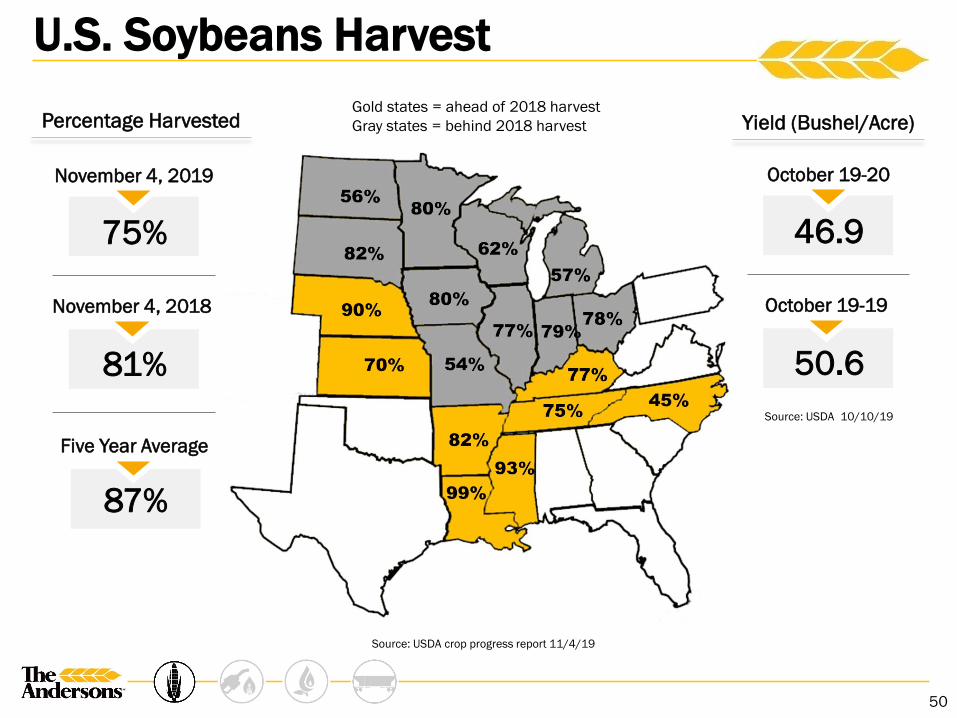
U.S. Soybeans Harvest
50
Gold states = ahead of 2018 harvestGray states = behind 2018 harvest
November 4, 2019
75%
November 4, 2018
81%
87%
Five Year Average
Percentage Harvested
October 19-20
46.9
October 19-19
50.6
Yield (Bushel/Acre)
Source: USDA crop progress report 11/4/19
Source: USDA 10/10/19

USDA Supply/Demand
Source: USDA 10/10/19
51

State ANDE2 ANDE % of Total
Illinois 16.2 1.1%
Iowa 2.6 0.2%
Nebraska 15.4 1.6%
Texas 7.2 1.1%
Indiana 27.1 5.0%
Ohio 42.3 9.1%
Michigan 32.5 14.1%
Louisiana 25.6 20.0%
Idaho 15.6 12.6%
Tennessee 3.6 4.8%
New York 1.4 2.9%
Total U.S.3 189.5 1.6%4
U.S. Grain Storage Capacity
Total U.S. commercial (off-farm) storage capacity of 11,473 million bushels, and 13,518 million on-farm storage
48
75
124
128
230
465
545
640
950
1,500
1,500
New York
Tennessee
Idaho
Louisiana
Michigan
Ohio
Indiana
Texas
Nebraska
Iowa
Illinois
U.S. Off Farm Storage Capacity1 ANDE U.S. Storage Capacity In millions of bushels In millions of bushels
1 Sources: USDA 2/1/19 Grain Storage Capacity 2 As of 2/15/19; includes temporary pile storage 3 Doesn’t include 26.5 million bushels in Canada 4 ANDE percent of total U.S. off-farm storage capacity
52

Crop Year ‘07-’08 ‘08-’09 ’09-’10 ‘10-’11 ‘11-’12 ‘12-’13 ‘13-’14 ’14-’15 ‘15-’16 ’16-’17 ‘17-’18 ‘18-’19
Supply1 20.3 19.8 21.3 21.0 19.8 18.3 21.3 22.3 22.5 24.9 24.7 24.7
Capacity 20.9 21.4 21.8 22.3 22.9 23.2 23.5 23.8 24.2 24.3 24.7 25.0
Utilization2 97% 93% 98% 94% 86% 79% 91% 94% 93% 100% 102% 99%
Carryout 2.1 2.5 2.8 2.2 1.9 1.7 1.9 2.7 2.9 4.0 3.7 3.7
U.S. Storage Capacity/Supply Impact
Industry Has Grown Into New On-farm Storage Capacity
9.1 9.4 9.5 9.7 10.1 10.3 10.4 10.7 10.9 11.1 11.2 11.5
11.8 12.0 12.3 12.5 12.8 12.9 13.0 13.1 13.2 13.3 13.5 13.5
0
10
20
'07-'08 '08-'09 '09-'10 '10-'11 '11-'12 '12-'13 '13-'14 '14-'15 '15-'16 '16-'17 17-'18 18-'19
Off-Farm On-Farm
Grains Are Harvested Once and Needed
throughout Each Year;
Total Supply Growing
Faster than Capacity
(B) of bushels
(B) o
f bus
hels
U.S. Grain Storage Will Continue to Have Value Based on Strong Market Demand
Sources: PRX (The ProExporter Network) as of 2/9/19, USDA 2/1/19 Grain Storage Capacity, USDA Supply & Demand 2/8/19.1 Total supply = corn, soybeans, wheat. 2 Storage capacity utilization = Total supply/total storage capacity.
53

Sources of Octane
84
92
101 103106
110113 115
75
80
85
90
95
100
105
110
115
120
125
Sub-octane Butane Benzene Toluene Xylene MTBE Ethanol Methanol
Premium Gasoline
Regular Gasoline
Extremely high RVP
Limited to 1% of the blend
Banned in 26 states. No liability protection for producers
Not covered by OEM warranties
Ethanol Demand Driven by Economic, Clean Source of Octane
Source: U.S Department of Energy, National Renewable Energy Lab
54

Ethanol Group
Production Capacity
Ethanol 482M Gal.
E85 Flex Fuel 60M+ Gal.
DDGs 1.3M Tons
Corn Oil 115M+ lbs.
• Ethanol is a low cost, clean burning, high octane, renewable fuel product
• E85, Distillers Dried Grains (DDGs), Corn Oil and CO2
• We market the CO2produced as part of the process at 3 out of our 4 plants
• Our ethanol customers are primarily refiners and fuel blenders
Overview of Ethanol
Contribution Margin Per Gallon of Ethanol Produced
RevenueStreams
InputCosts
MARGIN
Ethanol Corn
DDGsVariable
Gas & Electric
DepreciationFixed
Corn OilCO2
55

Brazil, 25%
Canada, 21%
India, 13%
Korea, 6%
Philippines, 5%
Colombia, 5%
Peru, 3%
Netherlands, 3%
Oman, 3%
Mexico, 2%UK, 2%
Jamaica, 2% Other, 9%
U.S. Ethanol Exports Expected to Fall from 2018 Peak
Exports Expected to Decline Until Trade Dispute with China Is Resolved
U.S. Ethanol Exports (MGY)
Source: Pro Exporter Network 10/21/19
YTD through August 2019
56
Source: EIA as of 10/31/19
397
1,193
740620
836 836
1,046
1,367
1,705
1,447
2010 2011 2012 2013 2014 2015 2016 2017 2018 2019E

Corn Oil Pounds Shipped
Ethanol Group Production
Ethanol Gallons Produced DDG Tons SoldE-85 Gallons Shipped
Charts include activity at nonconsolidated ethanol plants
in millions in millions in thousands in millions
57
116.3 121.9 118.1
330.6
360.1 354.8
2017 2018 2019Q3 YTD
12.5 16.0
14.0
32.4
47.5
36.4
2017 2018 2019Q3 YTD
315.0 312.0 304.0
917.9 941.0 915.0
2017 2018 2019Q3 YTD
27.5 29.5 29.2
74.4
85.087.7
2017 2018 2019Q3 YTD

Life Cycle of NutrientsPre-Season:
• Agronomy Testing
• Base load of Nitrogen, Phosphorus and Potassium (NPK) Application
• Micro-Nutrient Application
Post-Season:• Agronomy Testing
• Base load of Phosphorous and Potassium Application
• Micro-Nutrient Applications: Zinc and Manganese
Spring & Summer Growing Season:
• Planting: Starter, Low Salt
• Side Dressing: Nitrogen supports yields
• Protecting: Pesticides
Mar Apr May Jun Jul Aug Sept Oct
Spring Pre-Planting Spring & Summer Growing Season Fall Post Harvest
Emergence Tassel & Ear Initiation Pollination Tasseling Silking Maturity
58

Nutrient DemandCrop nutrient (N,P,K) use is highest for Corn
Strong corn acreage supports NPK demand
44%
17%
2% 5%
41%
15% 14%
5%
43%
5%
19%
6%
Corn Wheat Soybeans Cotton Corn Wheat Soybeans Cotton Corn Wheat Soybeans Cotton
Nitrogen Phosphorous K Potassium
59

2019 U.S. Farm Income Expected to Remain Very Low
51 55
39
61
8779
5770
78
62
77
114
97
124
9281
62
7884 88
57 6251
7284 87
6877
8574
96
123135 136 131
10796
103 105113
0
20
40
60
80
100
120
140
160
2000 2001 2002 2003 2004 2005 2006 2007 2008 2009 2010 2011 2012 2013 2014 2015 2016 2017 2018 2019F
Net Farm Income Net Cash Income
Over the Cycle, Farmer Income Is a Key Driver
Average since 2000: $77B $93B
$ billion
60
Source: USDA Farm Sector Indicators, August 2019

Rail Group Top 10 Player Background
• ~1.6M U.S. railcars
65% private owners
35% railroad owned
• More nimble than larger players, providing speed and flexibility
• More cars than smaller players to provide us with scale advantage
Top 25 Private Railcar Owners
374,000 169,305
102,174 102,140 102,849
87,734 86,210 83,918
29,989 23,951
16,838 15,068 13,320 12,245 11,665 11,345 11,226 10,417 8,900 8,164 7,151 6,665 6,366 5,546 5,429
- 50,0 00 100 ,000 150 ,000 200 ,000 250 ,000 300 ,000 350 ,000 400 ,000
Greenbrier Management ServicesTTX Co.
Union Tank CarTrinity Industries Leasing
Wells Fargo RailThe CIT Group/Equipment Financing
GATX*SMBC Rail Services/ARL LLC
ProcorThe Andersons
ExxonMobilAmerican Railcar Industries
ADM TransportationMidwest Railcar
Progress Rail LeasingEquistar Chemicals
Chicago Freight Car LeasingDow Chemical
Greenbrier LeasingHalliburton Energy Services
CargillGeorgia Power
CAI RailDavid J. Joseph
Mitsui Rail Capital
1.2.
25.
9.
3.4.5.6.7.8.
11.12.13.14.15.16.17.18.19.20.21.22.23.24.
10.
Well Positioned in Industry with Strong Customer Service Focus
Lessor
ManufacturerShipper
Source: The Official Railway Equipment Register® April 2019
* SMBC purchased American Railcar Leasing, LLC (ARL, LLC)
61
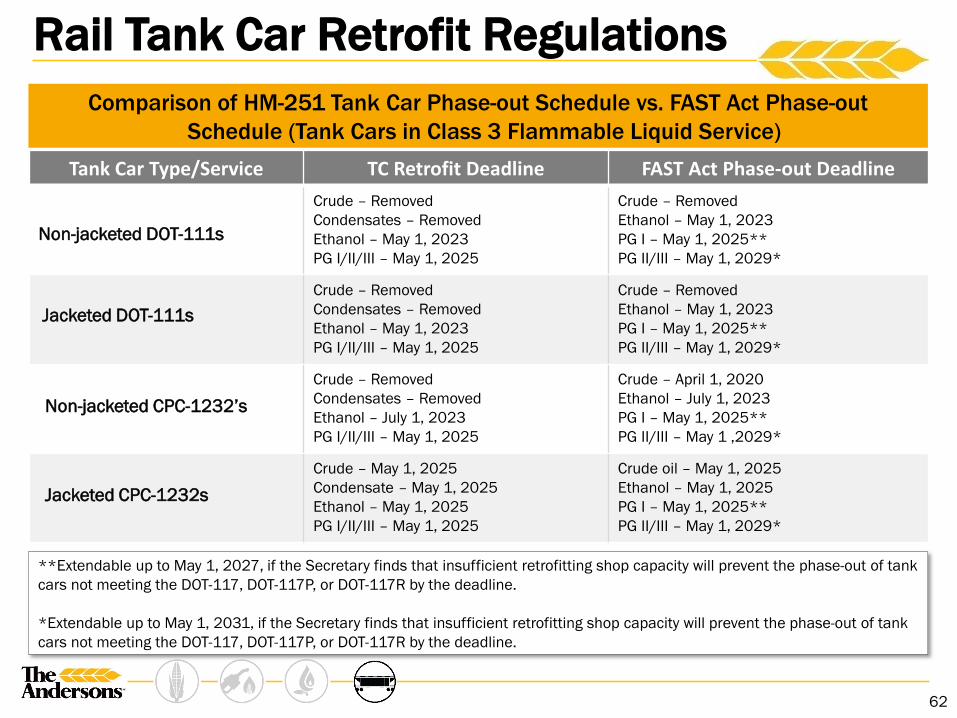
Tank Car Type/Service TC Retrofit Deadline FAST Act Phase-out DeadlineCrude – RemovedCondensates – Removed Ethanol – May 1, 2023 PG I/II/III – May 1, 2025
Crude – RemovedEthanol – May 1, 2023PG I – May 1, 2025**PG II/III – May 1, 2029*
Crude – RemovedCondensates – RemovedEthanol – May 1, 2023PG I/II/III – May 1, 2025
Crude – Removed Ethanol – May 1, 2023PG I – May 1, 2025**PG II/III – May 1, 2029*
Crude – RemovedCondensates – RemovedEthanol – July 1, 2023PG I/II/III – May 1, 2025
Crude – April 1, 2020Ethanol – July 1, 2023PG I – May 1, 2025**PG II/III – May 1 ,2029*
Crude – May 1, 2025Condensate – May 1, 2025Ethanol – May 1, 2025PG I/II/III – May 1, 2025
Crude oil – May 1, 2025Ethanol – May 1, 2025PG I – May 1, 2025**PG II/III – May 1, 2029*
Comparison of HM-251 Tank Car Phase-out Schedule vs. FAST Act Phase-out Schedule (Tank Cars in Class 3 Flammable Liquid Service)
**Extendable up to May 1, 2027, if the Secretary finds that insufficient retrofitting shop capacity will prevent the phase-out of tank cars not meeting the DOT-117, DOT-117P, or DOT-117R by the deadline.
*Extendable up to May 1, 2031, if the Secretary finds that insufficient retrofitting shop capacity will prevent the phase-out of tank cars not meeting the DOT-117, DOT-117P, or DOT-117R by the deadline.
Non-jacketed DOT-111s
Jacketed DOT-111s
Non-jacketed CPC-1232’s
Jacketed CPC-1232s
Rail Tank Car Retrofit Regulations
62

Rail Group Earning Power
Sources of Income
• Generates lease income from long-lived assets
• Maximizes value by remarketing assets opportunistically
• Provides repair services embedded in leases and to third parties
Total Rail
$ in millions YE 2015 YE 2016 YE 2017 YE 2018 YTD 2019
Average # of Assets 23,017 23,057 23,314 22,693 24,041
Beg. $ on Bal. Sheet $297.7 $338.1 $327.2 $521.8 $660.5
Average % Utilization 92.4% 87.8% 85.0% 90.3% 93.5%
$ in millions YE 2015 YE 2016 YE 2017 YE 2018 YTD 2019
Revenue $170.8 $163.7 $172.1 $174.2 $123.5
Gross Profit $67.7 $55.9 $52.5 $54.8 $42.5
Gross Profit % 39.6% 34.1% 30.5% 31.5% 34.4%
Pretax Income $50.7 $32.4 $24.8 $17.4 $10.6
63
Income$ in millions FY 2015 FY 2016 FY 2017 FY 2018 YTD 2019
Lease Income $31.5 $13.2 $8.9 $8.1 $8.0
Railcar Sale Income $13.3 $11.0 $11.0 $2.4 $1.1
Services & Other Income $5.9 $8.2 $4.9 $6.9 $1.5