investor presentation - november 2020
TRANSCRIPT

MARCH 2021
INVESTOR PRESENTATION

WALLONIA KEY FIGURES 62
BUDGET OVERVIEW 113
DEBT MANAGEMENT & FUNDING PLAN 144
Table of contents
2
BOND ISSUANCES 205
BELGIUM FEDERAL STRUCTURE 31
SUSTAINABILITY DEVELOPMENT STRATEGY 226

3
1. BELGIUM FEDERAL STRUCTURE

Wallonia in Belgium – Key political acts
4
3 REGIONSCOMPETENCES :
Territory, Economy, Social
Services & Local Authorities
3 COMMUNITIESCOMPETENCES :
Education, Culture & Sport

Wallonia in Belgium – Key political acts
The Sixth State Reform enhances the fiscal autonomy of the federated entities
and transfers the majority of powers from the federal level to the regional /
community levels.
❑ Increased fiscal autonomy : regional personal income tax (IPP regional) and
fiscal expenses (ex: mortgage credits).
❑ List of new transferred powers : family benefits, healthcare, labour market,
road safety, tenancy regulation, driving education, technical inspection, houses
of justice ...
❑ Article 49 of the Special Finance Act organizes and supervises the delegation
of debt management in the federated entities. For example, the role of the CSF
(Conseil Supérieur des Finances) is to evaluate the financial plans of the
federated entities, to formulate recommendations and in some cases to decide
to cap the entity’s lending capacity.
❑ Article 54 §2 of the Special Finance Act specifies that in case of an insufficient
payment or in the event of delay of payment by the federal state, the
Communities and the Regions can contract a loan guaranteed by the
Federal State and interest costs are taken on by the Federal State.
The Sixth State
Reform
(2014)
1
Special Finance
Act
(1989, 1993, 2014)
2
5

2. WALLONIA KEY FIGURES

3,633,795Inhabitants(33%)
Wallonia in Europe
16,901 km²(55.1% of Belgian
territory)
French speaking,
German speaking
450 km of waterways
81,207 km of roads
2 airports (Charleroi, Liège)
1,605kmof rail network
GDP growth rate evolution 2015-2020F
Wallonia in a nutshell
7
0.0
0.5
1.0
1.5
2.0
2.5
3.0
2015 2016 2017 2018 2019 2020
Wallonia Belgium Euro Zone
(Source : IWEPS)

Source : Walloon regionSources : ICN, IWEPS
Total exports in 2018 (€48Mds) Export dynamics by economic sector in 2018
France29%
Germany15%
USA8%
Netherlands7%
UK6%
Italy5%
Spain4%
Luxembourg3%
Poland2%
Canada1%
Others 19%
36%
15%
10%
7% 6%
26%
Chemicals &pharmaceutical
products
Metals Mechanical,electrical and
electronicproducts
Plastic & rubber Food andbeverage
Other
❑ More than 50% of the region’s exports are generated from 3 countries: France, Germany and the US.
❑ Exports to the US have spiked by +53.1% in 2018 as a result of strong customer spending, notably in
pharmaceuticals (+73.9%) and Food & Beverages (+47.9%), representing 90% of the region’s US shipments.
❑ Notice : the concept of export covers only international trade and therefore does not cover trade between Belgian
regions. In this case, we speak of inter-regional flows rather than exports.
Wallonia – Commercial dynamics
8

Equipment and
TransportMobility - Waterways - Sport Facilities - Heritage
Environment - Water - Agriculture - Conservation of Nature
Municipalities - Provinces - School Buildings - Public Center for
Social Assistance
Town and Country Planning - Housing - Integration of Disabled
People - Social Action - Health - Energy - Rural Renovation -
Waste
Economy - Employment & Professional Training - Foreign Trade
- International Relationships - Development Cooperation –
Research - Technologies - Tourism - EU Structural Funds
Wallonia – Regional competencies within Belgium Federal State
9
Natural Resources
Quality of Life
Local Authorities
Economic Activities

Parliament of
Wallonia
Government of
WalloniaWallonia Services Entities (SPW - UAP)
SPW General Secretary
SPW Budget, Logistic & TIC
SPW Mobility & Infrastructure
SPW Agriculture, Natural Resources & Environment
SPW Territory, Housing, Heritage & Energy
SPW Interior & Social Action
SPW Economy, Employment & Research
SPW Tax system
The legislative assembly
of Wallonia is composed
of 75 members who are
directly elected by
universal suffrage for a
five years term.
They sit in plenary
sessions and in
committees with the aim
to:
❑ Adopt decrees
(regional laws);
❑ Express positions
(resolutions) on
social issues;
❑ Exercise
supervision over
the Government
(through questions).
The Government is led
by the Minister-
President, currently
supported by 7 ministers,
each in charge of several
domains of activity.
In order to execute its
missions, the
Government delegates
the operational activities
to:
❑ SPW (Service Public
de Wallonie) - the
regional
administration
❑ UAP (Unités
d’Administration
Publiques wallonne)
- a number of Public
Administration Units
Wallonia - Institutions and Public Services Entities
10
➢ Logo’s of Public Administration Units are placed in their areas of competence

3. BUDGET OVERVIEW

Total Expenditure evolution (in € million) Expenditures breakdown by source (2019-2020)
33%
17%13%
10%
8%
5%
5%4%
3% 1% 0.4%
33%
17%13%
8%
8%
6%
5%
4%3% 2%1.8%
2019 (
rea
lize
d)
2020 (
ad
juste
d)
Health
Employment &Training
Local authorities &social actions
Mobility &infrastructure
Debt amortization &costs
Parliament,Government services,Admin
Land use planning,housing, heritage &energy
Economy & Research
Agriculture, naturalresources &environment
New investment plan
Others
Focus on Wallonia Budget Figures
To address its recurrent deficit, Wallonia has launched a unique exercise to assess and justify all current /
new budget expenditures. ZERO BASED BUDGETING exercise was launched in early 2020 and is
expected to produce incremental results, starting mid 2021 (see definition on slide 13).
12
73%
71%
8 830.70
9 447.63
13 589.40
14 687.94
16 961.90
16 329.65
16 914.07
16 883.64
2017 2018 2019 2020 2021 2022 2023 2024
Reported ForecastsInitial
Initial
Total Revenue evolution (in € million)
7 858.99
8 738.9311 313.44
11 328.19
12 965.10
14 155.14
14 563.82
14 714.98
2017 2018 2019 2020 2021 2022 2023 2024
Reported Forecasts

Main goals of “zero based budgeting” What is “zero based budgeting” exercise ?
Zero based budgeting
❑ Expenditures will be 100% screened (€ 16
billion expenditures to be analyzed in 12-18
months).
❑ All tax cuts will be screened (€ 1.8 billion tax
deductions).
❑ All spending units within the Region (SPW –
UAP) concerned by the exercise.
13
• First decision taken following the elaboration of budget 2020
• Methodology put in place with help of external consultants
• Implementation started as of end of 2020
• Referring to the structural reform support program, the European Commission is
advising the Region on the added value of completing a spending review
• Impact not yet included in the forecasted figures (2021-2024)
❑ Improve the quality and efficiency of public
expenditures.
❑ Check each individual type of expenditure
in terms of timely spending.
❑ Grow / increase sustainability investments
❑ Break away from aged budgeting methods
based on previous year’s spending.

4. DEBY MANAGEMENT & FUNDING PLAN
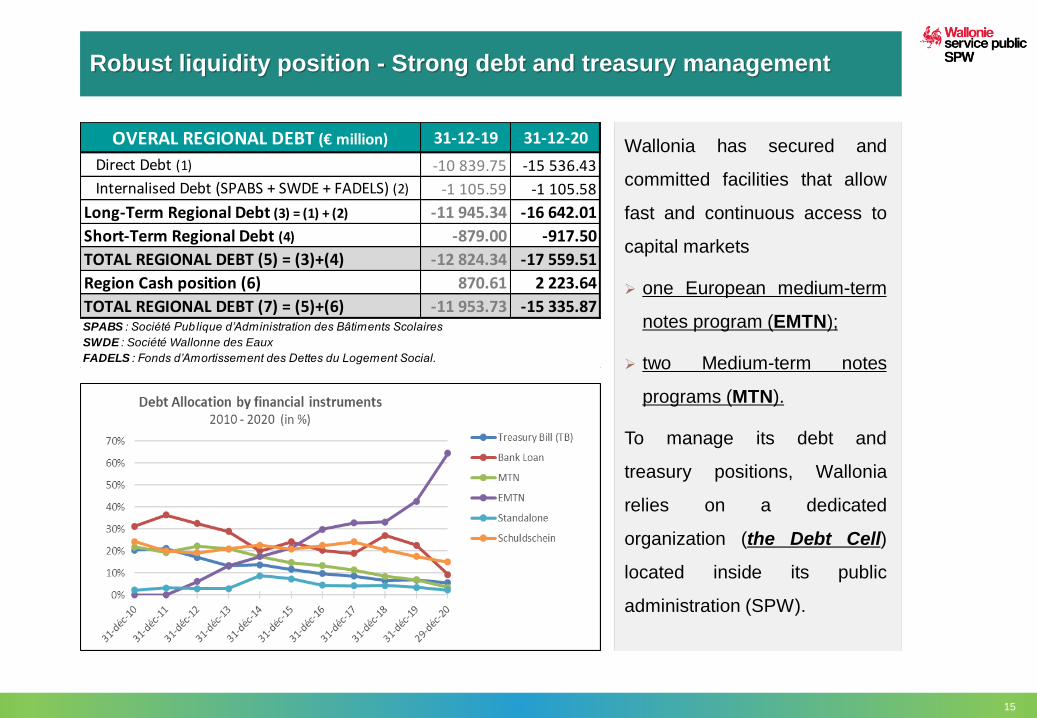
Wallonia has secured and
committed facilities that allow
fast and continuous access to
capital markets
➢ one European medium-term
notes program (EMTN);
➢ two Medium-term notes
programs (MTN).
To manage its debt and
treasury positions, Wallonia
relies on a dedicated
organization (the Debt Cell)
located inside its public
administration (SPW).
Robust liquidity position - Strong debt and treasury management
15
OVERAL REGIONAL DEBT (€ million) 31-12-19 31-12-20
Direct Debt (1) -10 839.75 -15 536.43
Internalised Debt (SPABS + SWDE + FADELS) (2) -1 105.59 -1 105.58
Long-Term Regional Debt (3) = (1) + (2) -11 945.34 -16 642.01
Short-Term Regional Debt (4) -879.00 -917.50
TOTAL REGIONAL DEBT (5) = (3)+(4) -12 824.34 -17 559.51
Region Cash position (6) 870.61 2 223.64
TOTAL REGIONAL DEBT (7) = (5)+(6) -11 953.73 -15 335.87SPABS : Société Publique d’Administration des Bâtiments Scolaires
SWDE : Société Wallonne des Eaux
FADELS : Fonds d’Amortissement des Dettes du Logement Social.

Outstanding Debt - Annual redemption profile and Ratios
16
REGIONAL DIRECT DEBT - KEY RATIOS 31-12-19 31-12-20
Regional long term debt value (€ million) -12 824.38 -16 642.01
Implicit rate (all in) 2.15% 1.66%
Average life span (years) 17.95 19.81
Fixed rate ratio 87.48% 90.58%
Duration (years) 10.54 13.84

2021 Initial Funding Needs
COVID-19 pandemic and unprecedented related economic crisis affected Wallonia funding
needs in 2020. Potential new impact on funding plan in 2021 still needs to be assessed.
17
FUNDING PLAN 2021 (€ million) 1 March 2021
Amortizations -926.70
Funding gap (initial) -3 996.82
INITIAL FUNDING NEEDS -4 923.52Budget Buffer (2021) 371.00
EU Financing Plan (SURE) 396.00
Pre-financing completed in 2020 * 1 525.57
FUNDING COMPLETED IN 2021 323.00 100.00%
EMTN 323.00
Private placement 323.00 100.00%
Benchmark (sustainability bond) 0.00 0.00%
MTN 0.00
Private placement 0.00 0.00%
Commercial paper 0.00 0.00%
Schuldschein 0.00 0.00%
OUTSTANDING FUNDING PLAN -2 307.95
(*pending amount to be confirmed)

18
Overview of Regional Consolidated Debt (2020)
❑ In order to assess the credit profile of Wallonia as a borrower, the credit rating agencies (such as Moody’s) also
look into the so-called consolidated debt (Maastricht concept), by adding to the regional direct debt the regional
indirect debts (SEC 2010), made of guaranteed debt of the consolidated organic companies, but also debt from
alternative financing mechanism and financial leasing.
Amortization Financial DeficitFADEL / SWDE /
SPABS Debts
Direct Debt Internalized Debt
Regional Direct Debt
Regional Consolidated Debt
(SEC 2010 Format)
Guaranteed debt
from consolidated
organizations
€27.2bn
€16.6bn
Consolidated
Indirect Debt
(SEC 2010)
Debt from
alternative
financing
mechanism
Financial Leasing
Regional Indirect Debt
€10.6bn

❑ Région wallonne ranks 4th out of 30 among European Local
Authorities sector
❑ Région wallonne demonstrates a consistent performance, with
scores above the sector average in all six assessed domains
▲The local authority’s performance is ranked advanced in
Community Development and good in four other domains:
Environment, Human Resources, Human Rights and
Governance
▼The performance in Procurement and Services is only limited
Credit Strengths
▲Mature and robust legislative background with well-defined
responsibilities amid a complex Belgian institutional system.
▲Revenue flexibility is high and is supportive of the region’s
credit profile
▲Prudent but sophisticated debt management underpins
unquestioned market access.
Credit Challenges
▼Persistent financing and operating deficits
▼A high and increasing debt burden
▼An economy which compares unfavorably with national and
European peers
Last credit opinion update : December 2020
Long Term Rating: A2 – Negative Outlook
Prime-1 short-term rating of its Treasury notes
Date of report: April 2018
ESG rating: 55/100
Key ratings considerations
19
Financial rating Non-Financial rating

5. BOND ISSUANCES

21
Summary of Wallonia current benchmark size issues
Current IssuesSUSTAINABILITY
2026 Bond (7y)
SUSTAINABILITY
2034 Bond (15y)
SUSTAINABILITY
2030 Bond (10y)
SUSTAINABILITY
2034 Bond Tap
CONVENTIONAL
2025 Bond (5y)
SOCIAL
2040 Bond (20y)
CONVENTIONAL
2051 Bond (30y)
Amount € 500 million € 500 million € 500 million € 200 million € 1 000 million € 1 000 million € 1 000 million
Launch Date 25 th April 2019 25 th April 2019 1 st April 2020 1 st April 2020 28 th May 2020 28 th May 2020 25 th Nov. 2020
Maturity Date 3rd
May 2026 3rd
May 2034 8th
April 2030 3rd
May 2034 22nd
June 2025 22nd
June 2040 16th
Jan. 2051
Coupon 0.250% 1.250% 0.500% 0.777% 0.050% 1.050% 0.650%
Rate (all-in) 0.382% 1.265% 0.540% 0.797% 0.061% 1.118% 0.703%
Spread versus OLO
(all-in)OLO + 32.3 bps OLO + 37.6 bps OLO + 47 bps OLO + 50 bps OLO + 43 bps OLO + 56.4 bps OLO + 38 bps
Total 2019 : € 1 billion Total 2020 : € 3.7 billion

22
6. SUSTAINABILITY DEVELOPMENT STRATEGY
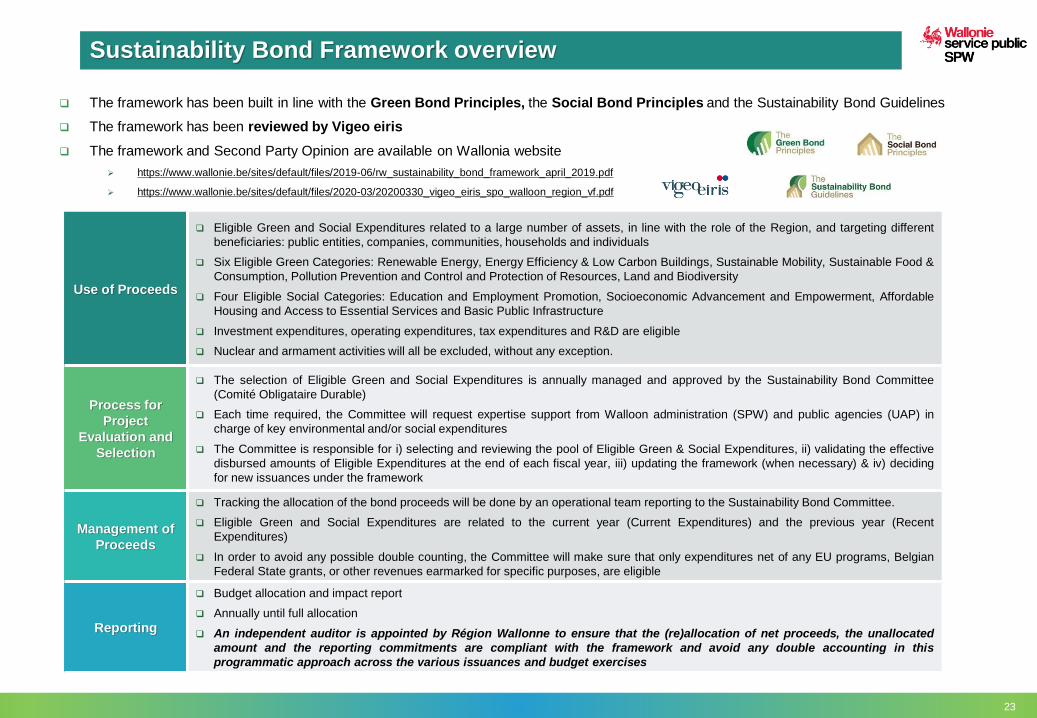
Sustainability Bond Framework overview
23
Use of Proceeds
❑ Eligible Green and Social Expenditures related to a large number of assets, in line with the role of the Region, and targeting different
beneficiaries: public entities, companies, communities, households and individuals
❑ Six Eligible Green Categories: Renewable Energy, Energy Efficiency & Low Carbon Buildings, Sustainable Mobility, Sustainable Food &
Consumption, Pollution Prevention and Control and Protection of Resources, Land and Biodiversity
❑ Four Eligible Social Categories: Education and Employment Promotion, Socioeconomic Advancement and Empowerment, Affordable
Housing and Access to Essential Services and Basic Public Infrastructure
❑ Investment expenditures, operating expenditures, tax expenditures and R&D are eligible
❑ Nuclear and armament activities will all be excluded, without any exception.
Process for
Project
Evaluation and
Selection
❑ The selection of Eligible Green and Social Expenditures is annually managed and approved by the Sustainability Bond Committee
(Comité Obligataire Durable)
❑ Each time required, the Committee will request expertise support from Walloon administration (SPW) and public agencies (UAP) in
charge of key environmental and/or social expenditures
❑ The Committee is responsible for i) selecting and reviewing the pool of Eligible Green & Social Expenditures, ii) validating the effective
disbursed amounts of Eligible Expenditures at the end of each fiscal year, iii) updating the framework (when necessary) & iv) deciding
for new issuances under the framework
Management of
Proceeds
❑ Tracking the allocation of the bond proceeds will be done by an operational team reporting to the Sustainability Bond Committee.
❑ Eligible Green and Social Expenditures are related to the current year (Current Expenditures) and the previous year (Recent
Expenditures)
❑ In order to avoid any possible double counting, the Committee will make sure that only expenditures net of any EU programs, Belgian
Federal State grants, or other revenues earmarked for specific purposes, are eligible
Reporting
❑ Budget allocation and impact report
❑ Annually until full allocation
❑ An independent auditor is appointed by Région Wallonne to ensure that the (re)allocation of net proceeds, the unallocated
amount and the reporting commitments are compliant with the framework and avoid any double accounting in this
programmatic approach across the various issuances and budget exercises
❑ The framework has been built in line with the Green Bond Principles, the Social Bond Principles and the Sustainability Bond Guidelines
❑ The framework has been reviewed by Vigeo eiris
❑ The framework and Second Party Opinion are available on Wallonia website
➢ https://www.wallonie.be/sites/default/files/2019-06/rw_sustainability_bond_framework_april_2019.pdf
➢ https://www.wallonie.be/sites/default/files/2020-03/20200330_vigeo_eiris_spo_walloon_region_vf.pdf

24
Overview of Sustainability & Social Bond Issues in 2019 – 2020
CATEGORIES OF EXPENSES
(EUR million)
Sustainability
2019 Bond *
Sustainability
2020 Bond
Social
2020 BondTOTALS
GREEN CATEGORIES
Renewable Energy 2.7 5.0 7.7
Energy Efficiency & low carbon buildings 180.5 140.0 320.5
Sustainable Mobility 121.4 180.0 321.4
Sustainable Food & Consumption / 78.0 78.0
Pollution Prevention & Control / 12.0 12.0
Protection of Resources, Land, Biodiversity, Soil
Decontamination & Climate Change Adaptation26.9 85.0 111.9
SUB-TOTALS 331.5 500.0 831.5
SOCIAL CATEGORIES
Education & Employment Generation 273.0 200.0 / 473.0
Socio-Economic Advancement & Empowerment / / 518.0 518.0
Affordable Housing 383.3 / 300.0 683.3
Access to Essential Services & Basic Public
Infrastructure12.2 / 300.0 312.2
SUB-TOTALS 668.5 200.0 1 118.0 1 986.5
TOTALS 1 000.0 700.0 1 118.0 2 818.0
(* First annual report published in September 2020 – SB2019 Budget allocation & impact analysis)
https://www.wallonie.be/sites/default/files/2020-09/wallonia_sb2019-budget_allocation_report_impact_report-30thseptember2020.pdf

25
Wallonia Sustainability & Social Bonds – Split by Category

26
Debt Cell Walloon Region – Contact details
DEVEUX Etienne – Managing Expert 0032 (0)81 77 25 20 [email protected]
DESSAUCY Cédric – Middle office 0032 (0)81 77 25 10 [email protected]
DORIGATO Marie – Middle office / UAP 0032 (0)81 77 25 16 [email protected]
FIZAINE Christian – Middle office 0032 (0)81 77 25 17 [email protected]
MAASKANT Serge – Back office 0032 (0)81 77 25 09 [email protected]
POLIART Vincent – Middle office 0032 (0)81 77 25 03 [email protected]
WALCH Arnaud – Front office 0032 (0)81 77 25 02 [email protected]
https://www.wallonie.be/en/discover-wallonia/few-figures/financing

IMPORTANT NOTICE
27
March 2021 – Wallonia – All rights reserved