investor presentation march 2020 · 2020-03-20 · 1 investor presentation –march 2020 disclaimer...
TRANSCRIPT

Investor Presentation – March 2020

Investor Presentation – March 2020 1
Disclaimer
This presentation contains forward-looking statements within the meaning of the Private Securities Litigation Reform Act of 1995
and other federal securities laws. These forward-looking statements can be identified by the use of words such as “expect,”
“plan,” "will," “estimate,” “project,” “intend,” “believe,” “guidance,” and other similar expressions that do not relate to historical
matters. These forward-looking statements are subject to known and unknown risks and uncertainties that can cause actual
results to differ materially from those currently anticipated due to a number of factors, which include, but are not limited to, our
continued ability to source new investments, risks associated with using debt and equity financing to fund our business activities
(including refinancing and interest rate risks, changes in interest rates and/or credit spreads, changes in the price of our common
shares, and conditions of the equity and debt capital markets, generally), unknown liabilities acquired in connection with acquired
properties or interests in real-estate related entities, general risks affecting the real estate industry and local real estate markets
(including, without limitation, the market value of our properties, the inability to enter into or renew leases at favorable rates,
portfolio occupancy varying from our expectations, dependence on tenants’ financial condition and operating performance, and
competition from other developers, owners and operators of real estate), the financial performance of our retail tenants and the
demand for retail space, particularly with respect to challenges being experienced by general merchandise retailers, potential
fluctuations in the consumer price index, risks associated with our failure to maintain our status as a REIT under the Internal
Revenue Code of 1986, as amended, and other additional risks discussed in our filings with the Securities and Exchange
Commission. We expressly disclaim any responsibility to update or revise forward-looking statements, whether as a result of new
information, future events or otherwise, except as required by law.
Essential Properties Realty Trust, Inc. and the Essential Properties Realty Trust REIT are not affiliated with or sponsored by
Griffin Capital Essential Asset Operating Partnership, L.P. or the Griffin Capital Essential Asset REIT, information about which can
be obtained at (https://www.gcear.com).
Investor Presentation – March 2020 2
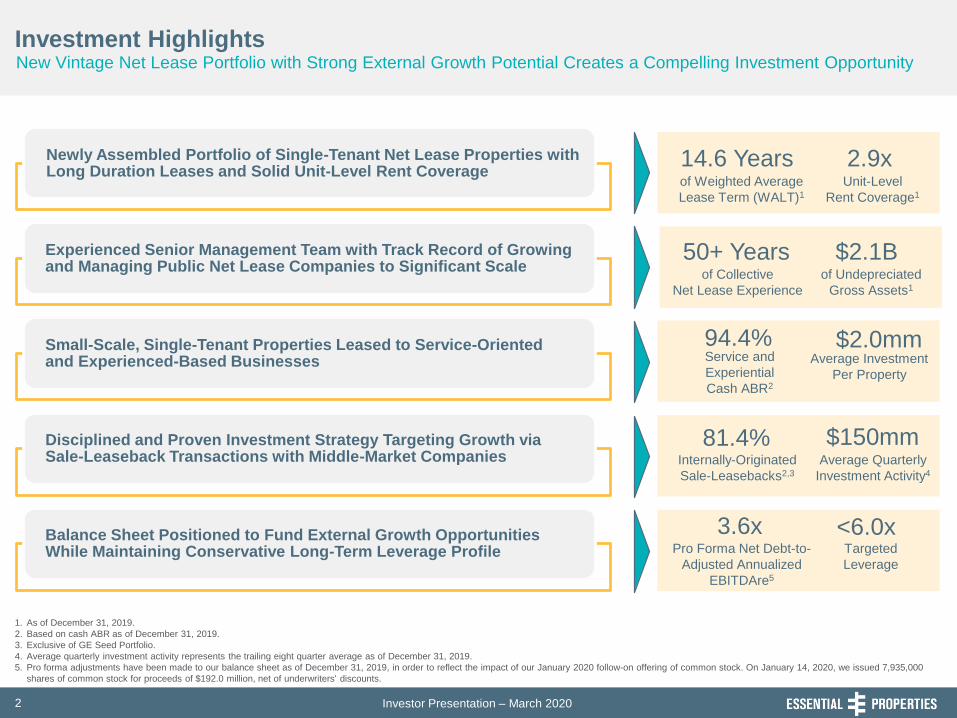
Investment Highlights
Newly Assembled Portfolio of Single-Tenant Net Lease Properties with Long Duration Leases and Solid Unit-Level Rent Coverage
Experienced Senior Management Team with Track Record of Growing and Managing Public Net Lease Companies to Significant Scale
Small-Scale, Single-Tenant Properties Leased to Service-Oriented and Experienced-Based Businesses
Disciplined and Proven Investment Strategy Targeting Growth via Sale-Leaseback Transactions with Middle-Market Companies
Balance Sheet Positioned to Fund External Growth Opportunities While Maintaining Conservative Long-Term Leverage Profile
Service and
Experiential
Cash ABR2
94.4%Average Investment
Per Property
$2.0mm
Internally-Originated
Sale-Leasebacks2,3
81.4%Average Quarterly
Investment Activity4
$150mm
1. As of December 31, 2019.
2. Based on cash ABR as of December 31, 2019.
3. Exclusive of GE Seed Portfolio.
4. Average quarterly investment activity represents the trailing eight quarter average as of December 31, 2019.
5. Pro forma adjustments have been made to our balance sheet as of December 31, 2019, in order to reflect the impact of our January 2020 follow-on offering of common stock. On January 14, 2020, we issued 7,935,000
shares of common stock for proceeds of $192.0 million, net of underwriters' discounts.
Unit-Level
Rent Coverage1
2.9xof Weighted Average
Lease Term (WALT)1
14.6 Years
of Collective
Net Lease Experience
50+ Years
New Vintage Net Lease Portfolio with Strong External Growth Potential Creates a Compelling Investment Opportunity
Pro Forma Net Debt-to-
Adjusted Annualized
EBITDAre5
3.6xTargeted
Leverage
<6.0x
of Undepreciated
Gross Assets1
$2.1B

Investor Presentation – March 2020 3
Experienced and Proven Management Team
Pete MavoidesPresident & CEO
• +20 years of experience in the single-tenant net
lease industry and has overseen $8 billion of
aggregate acquisitions
• Previously served as President and Chief Operating
Officer of Spirit Realty Capital (SRC) and was there
from September 2011 to February 2015
• Helped transition SRC from a privately-held
company with $3.2 billion of total assets to a public
company with $8.0 billion of total assets
• Prior to SRC, served as President and Chief
Executive Officer of Sovereign Investment
Company and was there from May 2003 to January
2011
Gregg SeibertExecutive Vice President & COO
• +25 years experience in the single-tenant net
lease industry
• Previously served as Executive Vice President and
Chief Investment Officer of SRC and was there from
September 2003 to May 2016
• Helped establish and implement SRC’s investment
sourcing, tenant underwriting, asset management
and capital markets activities
• Prior to SRC, held positions as Vice President and
Senior Vice President of Underwriting and Research
as well as Senior Vice President of Acquisitions at
Franchise Finance Corporation of America (FFCA)
Anthony Dobkin Interim CFO
• Member of the EPRT Board and former member
of the Audit Committee
• Previously worked at Surveyor Capital as a
Portfolio Manager investing in REITs
• Prior to Surveyor, was an Analyst and Principal at
Wesley Capital Management, a real estate
securities fund
• Prior to Wesley, worked at Vornado Realty Trust
(VNO-NYSE) in its acquisitions and capital
markets groups and at Credit Suisse First Boston
in its real estate investment banking group
• Graduated with a BS in Economics from the
Wharton School at the University of Pennsylvania
Dan DonlanSenior Vice President & Head of Capital Markets
• +12 years covering the single-tenant net lease REIT
sector as a sell-side equity research analyst
• Previously worked at Ladenburg Thalmann & Co. as
a Managing Director and senior REIT analyst
• Prior to Ladenburg, served as Vice President and
senior REIT analyst at Janney Capital Markets
• Before Janney, was an associate analyst at BB&T
Capital Markets
• Graduated with a BBA from the University of Notre
Dame
Senior Management Has Over 50+ Years of Collective Experience Managing and Investing in Net Lease Real Estate
Investor Presentation – March 2020 4
Oct 2019 Nov 2019
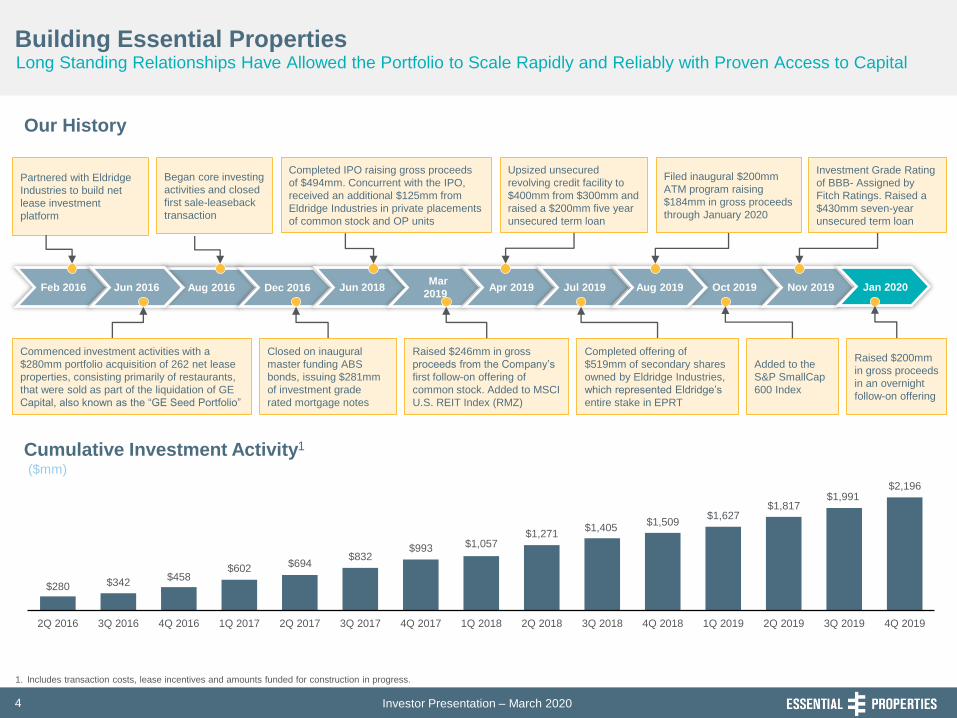
Building Essential Properties
Our History
Cumulative Investment Activity1
Partnered with Eldridge
Industries to build net
lease investment
platform
Feb 2016 Aug 2016 Dec 2016 Jun 2018Mar
2019Apr 2019 Jul 2019 Aug 2019Jun 2016
Began core investing
activities and closed
first sale-leaseback
transaction
Completed IPO raising gross proceeds
of $494mm. Concurrent with the IPO,
received an additional $125mm from
Eldridge Industries in private placements
of common stock and OP units
Upsized unsecured
revolving credit facility to
$400mm from $300mm and
raised a $200mm five year
unsecured term loan
Commenced investment activities with a
$280mm portfolio acquisition of 262 net lease
properties, consisting primarily of restaurants,
that were sold as part of the liquidation of GE
Capital, also known as the “GE Seed Portfolio”
Closed on inaugural
master funding ABS
bonds, issuing $281mm
of investment grade
rated mortgage notes
Raised $246mm in gross
proceeds from the Company’s
first follow-on offering of
common stock. Added to MSCI
U.S. REIT Index (RMZ)
($mm)
1. Includes transaction costs, lease incentives and amounts funded for construction in progress.
Completed offering of
$519mm of secondary shares
owned by Eldridge Industries,
which represented Eldridge’s
entire stake in EPRT
Added to the
S&P SmallCap
600 Index
Long Standing Relationships Have Allowed the Portfolio to Scale Rapidly and Reliably with Proven Access to Capital
Filed inaugural $200mm
ATM program raising
$184mm in gross proceeds
through January 2020
Investment Grade Rating
of BBB- Assigned by
Fitch Ratings. Raised a
$430mm seven-year
unsecured term loan
Raised $200mm
in gross proceeds
in an overnight
follow-on offering
Jan 2020
$280 $342 $458
$602 $694 $832
$993 $1,057 $1,271
$1,405 $1,509
$1,627 $1,817
$1,991 $2,196
2Q 2016 3Q 2016 4Q 2016 1Q 2017 2Q 2017 3Q 2017 4Q 2017 1Q 2018 2Q 2018 3Q 2018 4Q 2018 1Q 2019 2Q 2019 3Q 2019 4Q 2019

Investor Presentation – March 2020 5
Key Accomplishments Since IPO
Maintained Investment Discipline While Generating Compelling Growth
• Consistent Underwriting and Investment Growth: Over the trailing eight quarters1, EPRT has invested ~$150mm on avg.
per quarter at a 7.5% wgt. avg. cash cap rate with 80% of transactions being sale-leasebacks and 61% being subject to a
master lease; WALT was 16.1 years, wgt. avg. rent coverage ratio was 2.9x, and avg. investment per property was ~$2.0mm
• Compelling Growth Characteristics: AFFO/sh guidance midpoint for 2020 implies ~13% growth over 2019 AFFO/sh
Active Asset Management and New Investment Activity Have Improved Portfolio Metrics
• Top 10 Tenant Concentration Moderating: Top 10 tenant exposure declined to 23.4% at 4Q 2019 vs. 33.1% at 4Q 2018
• Steady Same-Store (SS) Rent Growth: Quarterly SS cash rents have grown 1.7%-1.9% yr/yr since coming public
• Grew Sector Leading WALT: 14.6 year WALT at 4Q 2019 increased from 14.2 years at 4Q 2018
• Sound Unit-Level Rent Coverage: Portfolio unit-level rent coverage has remained between 2.8x-2.9x since IPO
• Accretive Capital Recycling: Sold 145 properties for $203mm in net proceeds at a 6.7% wgt. avg. cash cap rate (only
includes leased properties) since inception vs. invest $2.2B into 1,000 properties at a 7.6% wgt. avg. cap rate
Demonstrated Access to Multiple Forms of Capital Since Coming Public
• Completed First Follow-On Offering in March 2019: Raised $246mm in gross proceeds from first follow-on offering
• Expanded Credit Facility and Raised Five-Year Term Loan in April 2019: Increased line of credit by $100mm to $400mm
and raised a $200mm five-year unsecured term loan
• Full Exit of Initial Capital Sponsor in July 2019: Sold $519mm of secondary shares in July 2019, which allowed our initial
capital sponsor to exit their entire position
• Filed $200mm ATM Program in August 2019: Issued $184mm of gross proceeds since instituting program
• Raised Seven-Year Term Loan in November 2019: Raised a $430mm seven-year unsecured term loan
• Completed Overnight Offering in January 2020: Raised $200mm in gross proceeds from second follow-on offering
1. Trailing eight quarters as of December 31, 2019.
Consistent Execution of the Business Plan Articulated at the Time of the IPO

Investor Presentation – March 2020 6
Service-Oriented &
Experience-Based
Industries
Sale-Leaseback Transactions
with Middle-Market Tenants
Small-Scale
Net Leased Properties
✓ E-commerce resistant
✓ Profit centers essential to tenant’s operations
✓ Customers must visit to receive service/experience
✓ Longer lease term
✓ Unit-level financial reporting
✓ Include contractual rent increases
✓ Increases diversification
✓ Deeper pool of potential buyers
✓ Greater alternative uses
Small-scale net
leased properties
are easier to divest
and re-let in
comparison to larger
properties
Service-oriented and
experience-based
businesses are performing
well in the current economic
environment and increasing
store counts
Targeted Investment Strategy Based on Decades of ExperienceManagement’s Investment Discipline Has Been Refined Over Multiple Decades of Managing Assets Through Various Credit Cycles
Access to growth
capital for middle-
market
businesses is
limited and results
in attractive risk-
adjusted returns

Investor Presentation – March 2020 7
Seek to be the Capital Provider of ChoiceMaintain Direct Relationships with Our Tenants and Actively Seek to Leverage Our Relationships to Identify New
Investment Opportunities
Relationship-Based Sourcing
1. Percentage of portfolio cash ABR as of December 31, 2019 that was acquired from parties who previously engaged in one or more transaction with a senior management team member. Exclusive of GE Seed Portfolio.
2. Percentage of portfolio cash ABR as of December 31, 2019 that was attributable to internally originated sale-leaseback transactions. Exclusive of GE Seed Portfolio.
Repeat Business Through
Existing Senior Management
Relationships1
86.4%
Internally Originated Sale-
Leaseback Transactions2
81.4%
Tenant Relationships
43.4%
Underwriting Methodology
Industry View
• Determine the relevant
competitive factors and
long-term viability of the
industry, avoiding
industries subject to
long-term functional
obsolescence
Credit of the Tenant
• Perform detailed
credit reviews of the
financial condition of
all proposed tenants
to determine their
financial strength and
flexibility
Unit-Level Profitability
• Evaluate the profitability
of the business
operated at our real
estate locations through
rent coverage ratios and
historical financials
Real Estate Valuation
• Identify whether the
underlying real estate
is commercially
desirable and
suitable for use by
different tenants

Investor Presentation – March 2020 8
New Vintage Portfolio is Focused on Targeted IndustriesOur Portfolio is the Result of a Disciplined Adherence to Investing in Properties Leased to Service-Oriented and
Experience-Based Businesses with Unit-Level Reporting
Investment Properties (#)1 1,000
Square Footage (mm) 7.9
Tenants (#) 205
Industries (#) 16
States (#) 44
Weighted Average Remaining Lease Term (Years) 14.6
Master Leases (% of Cash ABR) 60.3%
Sale-Leaseback (% of Cash ABR)2,3 81.4%
Unit-Level Rent Coverage 2.9x
Unit-Level Financial Reporting (% of Cash ABR) 98.2%
Leased (%) 100.0%
Top 10 Tenants (% of Cash ABR) 23.4%
Average Investment Per Property ($mm) $2.0
Average Transaction Size ($mm)2 $6.1
1. Includes one undeveloped land parcel and 91 properties that secure mortgage loans receivable.
2. Exclusive of GE Seed Portfolio.
3. Includes investments in mortgage loans receivable made in support of sale-leaseback transactions.
Portfolio Highlights December 31, 2019 Tenant Industry Diversification
• E-Commerce Resistant: 94.4% of cash ABR comes from service-oriented and experience-based tenants
• Focus on 16 Industries: Results in greater sector expertise and more efficient asset management
• 14.6 Year WALT Limits Near-Term Cash Flow Erosion: Only 2.7% of our cash ABR expires through 2023
• Highly Transparent with No Legacy Issues: 98.2% unit-level reporting; investment program started in June 2016
Quick Service14.2%
Early Childhood Education
11.1%
C-Stores11.2%
Car Washes12.5%
Medical / Dental 10.6%
Casual Dining5.8%
Auto Service4.8%
Family Dining 3.4% Other
Services3.3%
Pet Care Services
3.2%
Health and Fitness
6.6%
Entertainment4.7%
Movie Theatres
2.9%
Home Furnishings
3.5%
Grocery 0.3%
Building Materials1.8%
Service
80.2%

Investor Presentation – March 2020 9
Top 10 Tenant ConcentrationEPRT Has 205 Tenants Across 1,000 Properties with the Top 10 Representing 189 Properties and 23.4% of Cash ABR
Top 10 Tenant1 Properties
% of
Cash
ABR
74 3.4%
13 2.8%
4 2.5%
5 2.5%
34 2.4%
12 2.1%
13 2.1%
26 2.0%
5 1.9%
3 1.8%
Top 10
Tenants189 23.4%
Total 1,000 100.0%
Top 10 Tenant Exposure
Notes: Statistics as of December 31, 2019. Property count includes one undeveloped land parcel and 91 properties that secure mortgage loans receivable.
1. Represents tenant, guarantor or parent company.

Investor Presentation – March 2020 10
Net Lease Risk Factor Mitigation by Essential Properties
Challenged Retail Categories No exposure to big-box apparel, electronics, sporting goods or department stores
At-Risk Retail Categories No exposure to pharmacy, dollar stores or discount retailers; de minimis exposure to grocers
Asset ConcentrationNo large office, manufacturing or high-dollar special-purpose properties; primarily target smaller asset size
(average investment per property of $2.0 million) in service-based and experience-oriented industries
Tenant Concentration No single tenant represents more than 3.4% of cash ABR
Industry ConcentrationFocus on 16 industries allows balance of deep industry expertise and diversification, while avoiding at-risk
categories
Opaque Credit Deterioration 98% of leases1 obligate tenant to provide unit-level financial reporting
Lack of Organic Revenue Growth99% of leases1 provide for increases with 1.5% weighted average annual escalation rate2 assuming 0.0%
change in annual CPI
Low Rent Recapture at
Expiration / Default
Focus on smaller-box properties with alternative uses and well-located real estate with at or below market
rents
1. Based on cash ABR as of December 31, 2019.
2. Represents the weighted average annual escalation rate of the entire portfolio as if all escalations occur annually. For leases in which rent escalates by the greater of a stated fixed percentage or CPI, we have assumed an
escalation equal to the stated fixed percentage in the lease. As any future increase in CPI is unknowable at this time, we have not included an increase in the rent pursuant to these leases in the weighted average annual
escalation rate presented.
Portfolio Built to Mitigate Specific Net Lease Investment Risk FactorsThe Company Has Purposefully Developed Business Practices and Constructed a Portfolio Designed to Mitigate Key
Identifiable Net Lease Risk Factors
Investor Presentation – March 2020 11
0.0%
2.0%
4.0%
6.0%
8.0%
10.0%
12.0%
14.0%
16.0%
CC
C+ B- B
B+
BB
-
BB
BB
+
BB
B-
BB
B
BB
B+ A- A
A+
AA
-
% o
f C
ash
AB
R
< 1.00x 1.00 to 1.49x 1.50 to 1.99x ≥ 2.00x NR
0.0%
2.0%
4.0%
6.0%
8.0%
10.0%
12.0%
14.0%
16.0%
2020
2021
2022
2023
2024
2025
2026
2027
2028
2029
2030
2031
2032
2033
2034
2035
2036
Th
ere
after
% o
f C
ash
AB
R
< 1.00x 1.00 to 1.49x 1.50 to 1.99x ≥ 2.00x NR
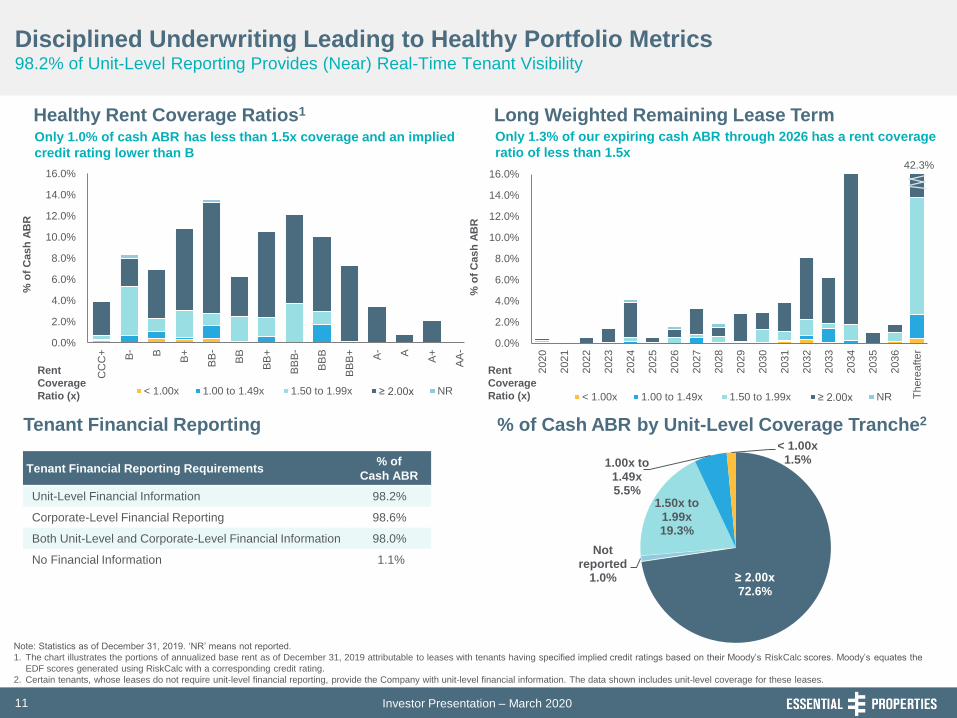
42.3%
Disciplined Underwriting Leading to Healthy Portfolio Metrics98.2% of Unit-Level Reporting Provides (Near) Real-Time Tenant Visibility
Tenant Financial Reporting % of Cash ABR by Unit-Level Coverage Tranche2
Long Weighted Remaining Lease TermHealthy Rent Coverage Ratios1
Only 1.0% of cash ABR has less than 1.5x coverage and an implied
credit rating lower than B
Only 1.3% of our expiring cash ABR through 2026 has a rent coverage
ratio of less than 1.5x
Tenant Financial Reporting Requirements% of
Cash ABR
Unit-Level Financial Information 98.2%
Corporate-Level Financial Reporting 98.6%
Both Unit-Level and Corporate-Level Financial Information 98.0%
No Financial Information 1.1%
Note: Statistics as of December 31, 2019. ‘NR’ means not reported.
1. The chart illustrates the portions of annualized base rent as of December 31, 2019 attributable to leases with tenants having specified implied credit ratings based on their Moody’s RiskCalc scores. Moody’s equates the
EDF scores generated using RiskCalc with a corresponding credit rating.
2. Certain tenants, whose leases do not require unit-level financial reporting, provide the Company with unit-level financial information. The data shown includes unit-level coverage for these leases.
Rent
Coverage
Ratio (x)
Rent
Coverage
Ratio (x)
≥ 2.00x72.6%
Not reported
1.0%
1.50x to 1.99x19.3%
1.00x to 1.49x5.5%
< 1.00x1.5%

Investor Presentation – March 2020 12
Established and Proven Investment InfrastructureScalable Platform Allows for Consistent Sourcing of Investment Activity at Attractive Yields without Sacrificing
Underwriting Standards and Investment Focus
Investment activity has averaged ~$150mm per quarter over the last eight quarters
1. Cash ABR for the first full month after the investment divided by the purchase price for the property.
2. GAAP rent for the first twelve months after the investment divided by the purchase price for the property.
3. As a percentage of cash ABR for that particular quarter.
4. Includes investments in mortgage loan receivables collateralized by more than one property.
5. Includes investments in mortgage loans receivable made in support of sale-leaseback transactions.
6. Includes three properties that secured $16.8 million of mortgage loans receivable.
7. Includes 71 properties that secured $35.3 million of mortgage loans receivable.
8. Includes 18 properties that secured $34.6 million of mortgage loans receivable.
Investments 1Q 2018 2Q 2018 3Q 2018 4Q 2018 1Q 2019 2Q 20196 3Q 20197 4Q 20198
Number of Transactions 16 23 34 24 35 32 28 41
Property Count 28 86 62 39 51 91 139 94
Avg. Investment per Unit (in 000s) $2,195 $2,438 $2,042 $2,572 $2,303 $2,015 $1,174 $2,049
Cash Cap Rates1 7.8% 7.6% 7.6% 7.6% 7.5% 7.3% 7.5% 7.3%
GAAP Cap Rates2 8.3% 8.7% 8.5% 8.5% 8.4% 8.1% 8.2% 8.0%
Master Lease %3,4 33% 82% 58% 57% 47% 67% 73% 41%
Sale-Leaseback %3,5 68% 90% 77% 83% 78% 65% 88% 81%
% of Financial Reporting3 100% 96% 100% 90% 100% 100% 100% 99%
Rent Coverage Ratio 2.3x 2.4x 2.7x 2.8x 3.2x 3.2x 3.2x 3.1x
Lease Term Years 14.1 17.2 16.1 16.6 15.1 15.3 16.6 16.3
$64,098
$214,427
$133,745
$103,660 $118,187
$190,280 $173,590
$204,709
$0
$40,000
$80,000
$120,000
$160,000
$200,000
$240,000
Inve
stm
en
t
Ac
tivit
y (
$0
00
s)

Investor Presentation – March 2020 13
• Dispositions Have Traded at Attractive Cap Rates: Since inception in 2016 through 2019, we have sold 145 properties for
$203mm and achieved a weighted average cash cap rate of 6.7% on the sale of 104 leased properties8
• Trailing 12-Month (TTM) Sales Came from a Diverse Mix of Industries: No single industry was overrepresented among
our dispositions in the trailing 12 month period, which we believe provides visibility into the value of our diverse portfolio
Active Asset ManagementProactive Asset Management Mitigates Risk and Maximizes Risk-Adjusted Returns
1. Net of transaction costs.
2. Gains/(losses) based on our aggregate allocated purchase price.
3. Cash ABR at time of sale divided by gross sale price (excluding transaction costs) for the property.
4. Property count excludes dispositions in which only a portion of the owned parcel is sold.
5. Excludes one property sold pursuant to an existing tenant purchase option.
6. Excludes the sale of one leasehold property.
7. Excludes the prepayment of two mortgage loans receivable for $4.6 million.
8. Excludes two leasehold properties and one property sold pursuant to an existing tenant purchase option.
9. Percentages are based on cash ABR; trailing 12 months (TTM) period ended December 31, 2019.
TTM Sales9
Since
Dispositions 1Q 2018 2Q 2018 3Q 2018 4Q 2018 1Q 2019 2Q 20197 3Q 2019 4Q 2019 Inception
Realized Gain/(Loss)1,2 (1.7%) 9.7%5 (6.6%)6 0.4% 2.9% 1.3% 17.8% 8.5% 4.8%8
Cash Cap Rate on Leased
Assets36.7% 7.1%5 6.8%6 6.9% 6.6% 7.0% 6.7% 6.9% 6.7%8
Leased Properties Sold4 5 8 17 7 7 10 9 7 107
Vacant Properties Sold4 1 2 4 1 -- 1 1 1 38
Rent Coverage Ratio 0.8x 2.1x5 1.8x6 1.8x 1.8x 1.5x 1.1x 1.7x 1.7x8
$7,721
$13,799
$19,406 $19,542
$10,480
$26,804
$19,495
$15,229
$0
$5,000
$10,000
$15,000
$20,000
$25,000
$30,000
Dis
po
sit
ion
Ac
tivit
y($
00
0s
)1
Family Dining
5%
Quick Service
15%
Auto Service
13%
Casual Dining
17%
Car Washes
12%C-Stores3%
Child Care14%
Home Furnishings
20%
Investor Presentation – March 2020 14
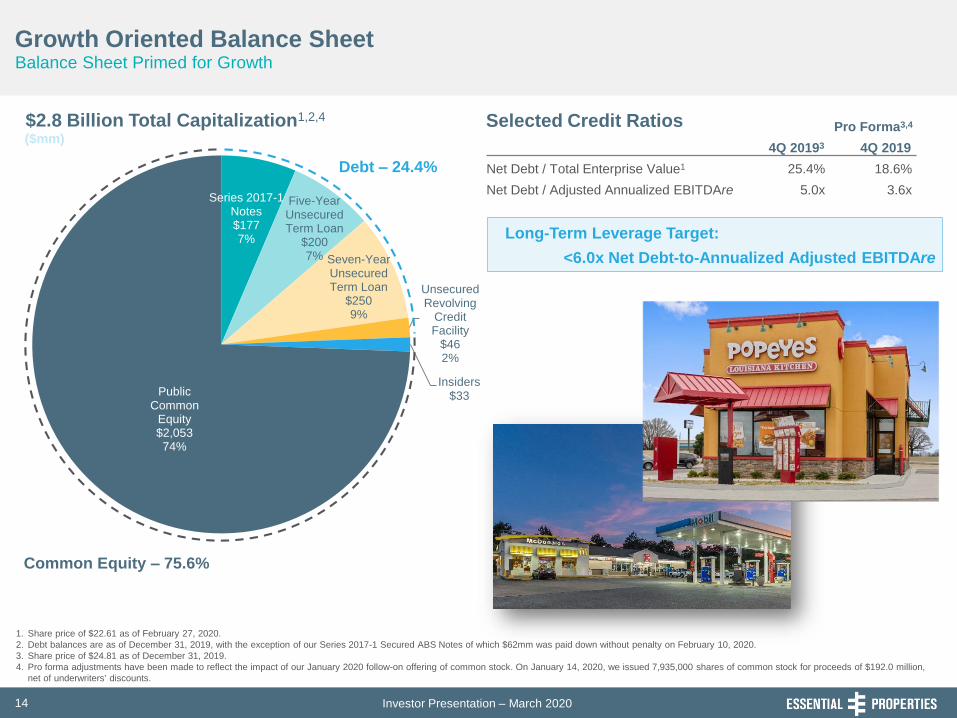
Series 2017-1 Notes$177 7%
Five-Year Unsecured Term Loan
$200 7% Seven-Year
Unsecured Term Loan
$250 9%
Unsecured Revolving
Credit Facility
$46 2%
Insiders$33 Public
Common Equity$2,053 74%
Growth Oriented Balance Sheet
$2.8 Billion Total Capitalization1,2,4 Selected Credit Ratios
1. Share price of $22.61 as of February 27, 2020.
2. Debt balances are as of December 31, 2019, with the exception of our Series 2017-1 Secured ABS Notes of which $62mm was paid down without penalty on February 10, 2020.
3. Share price of $24.81 as of December 31, 2019.
4. Pro forma adjustments have been made to reflect the impact of our January 2020 follow-on offering of common stock. On January 14, 2020, we issued 7,935,000 shares of common stock for proceeds of $192.0 million,
net of underwriters' discounts.
($mm)
Balance Sheet Primed for Growth
Long-Term Leverage Target:
<6.0x Net Debt-to-Annualized Adjusted EBITDAre
Pro Forma3,4
4Q 20193 4Q 2019
Net Debt / Total Enterprise Value1 25.4% 18.6%
Net Debt / Adjusted Annualized EBITDAre 5.0x 3.6x
Common Equity – 75.6%
Debt – 24.4%

Investor Presentation – March 2020 15
$0 $4 $4 $4 $5
$160
$200
$250
$46
$0
$100
$200
$300
$400
$500
2019 2020 2021 2022 2023 2024 2025 2026
Ma
turi
ng
Pri
ncip
al B
ala
nce
($
mm
)
Secured ABS Notes Five-Year Unsecured Term Loan Seven-Year Unsecured Term Loan
Revolving Credit Facility Availanility Outstanding Revolving Credit Facility
Debt Structure Allows for Capital Flexibility
Debt Maturity Schedule1,2,3
1. Debt balances are as of December 31, 2019, with the exception of our Series 2017-1 Secured ABS Notes of which $62mm was paid down without penalty on February 10, 2020.
2. Maturity figures for our secured debt are based off of our anticipated repayment schedule.
3. The Series 2017-1 notes mature in June 2047 but have an anticipated repayment date of June 2024. The Series 2017-1 notes can be prepaid without penalty starting on November 26, 2021.
No Significant Debt Maturities Until 2024
• The Series 2017-1 Secured ABS notes: Anticipated repayment date is June 2024, but the notes can be prepaid without
penalty starting on November 26, 2021. The weighted average interest rate on the notes is 4.16%. On February 10, the
Company paid down $62mm of the Class A portion of the these notes without penalty
Our Unsecured Revolving Line of
Credit has $400mm of capacity
Our $430mm Unsecured Seven-Year
Term Loan facility has an additional
$180mm available for use
$430$400

Investor Presentation – March 2020 16
4.7x
3.7x
2.9x 2.8x 2.7x 2.6x 2.6x 2.3x
1.9x
NR2% 3% 3%
9% 9% 10%
14%
19% 21%
24%
100% 100% 100% 94%
72% 65%
51% 48% 39%
21%
Differentiated Net Lease Investment Opportunity
Strong Unit-Level Coverage2 & Transparency
Service-Oriented & Experience-Based
Industries
Limited Immediate-Term Lease Maturities
✓
✓✓
Source: Public filings and press releases.
Note: Essential Properties data as of December 31, 2019. Public net lease REIT data as of most recent reported quarter. ‘NR’ means not reported. Companies may define service-oriented and experienced-based tenants
differently, may calculate weighted average remaining lease term differently, may calculate unit-level coverage differently (including peers on a mean or median basis with EPRT representing a weighted average) and
may calculate the percentage of their tenants reporting differently than EPRT. Accordingly, such data for these companies and EPRT may not be comparable.
1. Designations entitled “other” are counted as one industry, even though the “other” segment could represent multiple industries.
2. EPRT, GTY, NNN, O, SRC and STOR coverage based on four-wall; EPR and FCPT coverage based on EBITDAR.
3. VER property level sales data was collected for 79.5% of retail and restaurant properties required to provide unit level sales reports, representing 49.6% of retail and restaurant properties owned.
90%
% Unit-Level Financial Reporting3
98% NR 98% 50% 51% NR80% NR NR 14.0
Weighted Average Lease Term (# of Years)
11.0 14.6 10.0 10.0 13.0 11.2 9.8 9.2 8.3
2
Total Number of Tenant Industries1
3 10 16 37 112 50 28 41 16
Portfolio Mix and Underlying Fundamentals are Favorable Relative to Peers
(% of ABR)
(% of Rent Expiring through 2023)
Less Reliance on Top 10 Tenancy with Smaller
Scale Properties✓ (% of ABR)
91%
81%
65%
37% 35% 33% 27% 23% 22%
18%
$3.5
Average Investment Per Property ($mm)
$3.3 $2.0 $3.8 $2.9 $2.7 $3.0 $19.3 $1.3 $2.8
Investor Presentation – March 2020 17
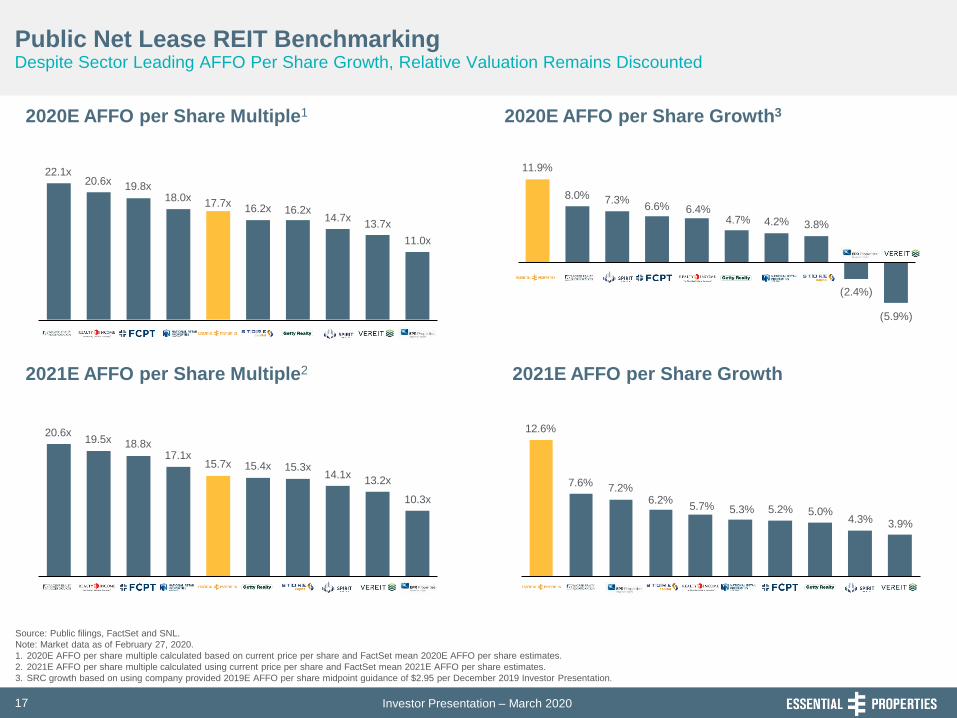
11.9%
8.0% 7.3% 6.6% 6.4%
4.7% 4.2% 3.8%
(2.4%)
(5.9%)
12.6%
7.6% 7.2%
6.2% 5.7% 5.3% 5.2% 5.0%
4.3% 3.9%
22.1x 20.6x
19.8x 18.0x
17.7x 16.2x 16.2x
14.7x 13.7x
11.0x
20.6x 19.5x 18.8x
17.1x 15.7x 15.4x 15.3x
14.1x 13.2x
10.3x
Public Net Lease REIT Benchmarking
2020E AFFO per Share Multiple1 2020E AFFO per Share Growth3
Source: Public filings, FactSet and SNL.
Note: Market data as of February 27, 2020.
1. 2020E AFFO per share multiple calculated based on current price per share and FactSet mean 2020E AFFO per share estimates.
2. 2021E AFFO per share multiple calculated using current price per share and FactSet mean 2021E AFFO per share estimates.
3. SRC growth based on using company provided 2019E AFFO per share midpoint guidance of $2.95 per December 2019 Investor Presentation.
Despite Sector Leading AFFO Per Share Growth, Relative Valuation Remains Discounted
2021E AFFO per Share Multiple2 2021E AFFO per Share Growth

Investor Presentation – March 2020 18
3.6x
4.4x 4.5x
5.1x 5.2x 5.3x 5.4x 5.5x 5.5x
6.3x
3.2% 3.7% 3.9% 4.1% 4.2% 4.2%
5.1% 5.4%
6.2%
7.7%
20% 20% 22%
25% 27% 27%
30% 33%
39% 40%
Public Net Lease REIT Benchmarking
2020E AFFO Payout Ratio3
Net Debt + Preferred / EBITDAre Net Debt + Preferred / Enterprise Value
Dividend Yield2
Source: Public filings, FactSet and SNL.
Note: Market data as of February 27, 2020. Companies may define adjusted annualized EBITDAre differently. Accordingly, such data for these companies and EPRT may not be comparable.
1. For EPRT, pro forma adjustments have been made to reflect the impact of our January 2020 follow-on offering of common stock, which raised $192.0 million of proceeds, net of underwriters' discounts.
2. Adjusted annualized EBITDAre of public net lease REITs is for the most recently reported three months ended, as adjusted for subsequent events. ADC, EPR, EPRT, SRC and STOR include adjustments for intra-
quarter acquisition and disposition activity..
3. Dividend yield calculated based on current price per share and declared dividend per share, annualized, for the most recent quarter.
4. 2021E AFFO payout ratio calculated based on FactSet mean 2021E dividend per share over FactSet mean 2021E AFFO per share estimates.
Low Leverage and Healthy Payout Ratio Underscore Capacity for Growth
(Net Debt1 plus Preferred-to-Adjusted Annualized EBITDAre2)
68.1% 68.7% 69.9% 70.6% 75.1% 77.2% 78.7%
82.6% 83.9% 85.2%
Investor Presentation – March 2020 19
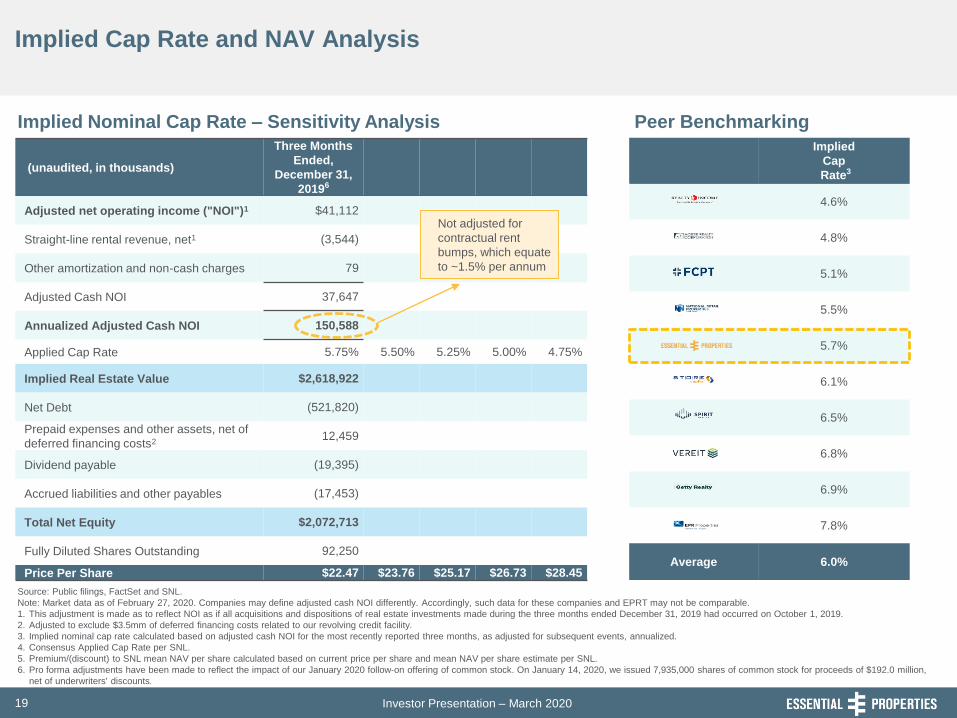
Implied
Cap
Rate3
4.6%
4.8%
5.1%
5.5%
5.7%
6.1%
6.5%
6.8%
6.9%
7.8%
Average 6.0%
(unaudited, in thousands)
Three Months
Ended,
December 31,
20196
Adjusted net operating income ("NOI")1 $41,112
Straight-line rental revenue, net1 (3,544)
Other amortization and non-cash charges 79
Adjusted Cash NOI 37,647
Annualized Adjusted Cash NOI 150,588
Applied Cap Rate 5.75% 5.50% 5.25% 5.00% 4.75%
Implied Real Estate Value $2,618,922
Net Debt (521,820)
Prepaid expenses and other assets, net of
deferred financing costs212,459
Dividend payable (19,395)
Accrued liabilities and other payables (17,453)
Total Net Equity $2,072,713
Fully Diluted Shares Outstanding 92,250
Price Per Share $22.47 $23.76 $25.17 $26.73 $28.45
Implied Nominal Cap Rate – Sensitivity Analysis
Source: Public filings, FactSet and SNL.
Note: Market data as of February 27, 2020. Companies may define adjusted cash NOI differently. Accordingly, such data for these companies and EPRT may not be comparable.
1. This adjustment is made as to reflect NOI as if all acquisitions and dispositions of real estate investments made during the three months ended December 31, 2019 had occurred on October 1, 2019.
2. Adjusted to exclude $3.5mm of deferred financing costs related to our revolving credit facility.
3. Implied nominal cap rate calculated based on adjusted cash NOI for the most recently reported three months, as adjusted for subsequent events, annualized.
4. Consensus Applied Cap Rate per SNL.
5. Premium/(discount) to SNL mean NAV per share calculated based on current price per share and mean NAV per share estimate per SNL.
6. Pro forma adjustments have been made to reflect the impact of our January 2020 follow-on offering of common stock. On January 14, 2020, we issued 7,935,000 shares of common stock for proceeds of $192.0 million,
net of underwriters' discounts.
Not adjusted for
contractual rent
bumps, which equate
to ~1.5% per annum
Implied Cap Rate and NAV Analysis
Peer Benchmarking

Appendix

Investor Presentation – March 2020 21
Leasing SummarySame-Store Analysis
Same-Store Portfolio:
All properties owned, excluding new sites
under construction, for the entire same-store
measurement period, which is October 1,
2018 through December 31, 2019. The
same-store portfolio for 4Q 2019 is
comprised of 590 properties and
represented 62% of our current portfolio as
measured by contractual cash rent divided
by our cash ABR at December 31, 2019.
Contractual Cash Rent:
The amount of cash rent our tenants are
contractually obligated to pay per the in-
place lease as of December 31, 2019;
excludes percentage rent that is subject to
sales breakpoints per the lease.
Defined Terms Same-Store Portfolio PerformanceContractual Cash Rent ($000s) %
Type of Business 4Q 2019 4Q 2018 Change
Service $ 18,170 $ 17,796 2.1%
Experience 3,521 3,529 -0.2%
Retail 1,300 1,282 1.4%
Industrial 674 661 2.0%
Total Same-Store Rent $ 23,664 $ 23,268 1.7%
- Property Operating Expense1 258 230 12.1%
Total Same-Store NOI $ 23,407 $ 23,038 1.6%
1. Excludes reimbursable property operating expenses.

Investor Presentation – March 2020 22
Leasing SummaryLease Escalations
• Leases contributing 99% of cash ABR provided for base rent escalation, generally ranging from 1.0% to 3.0% annually, with a
weighted average annual escalation rate of 1.5%, which assumes 0.0% change in annual CPI
• 6% of contractual rent escalations by cash ABR are CPI-based, while 93% are based on fixed percentage or scheduled
increases
• 72% of cash ABR derived from flat leases is attributable to leases that provide for contingent rent based on a percentage of the
tenant’s gross sales at the leased property
1. Based on cash ABR as of December 31, 2019.
2. Represents the weighted average annual escalation rate of the entire portfolio as if all escalations occur annually. For leases in which rent escalates by the greater of a stated fixed percentage or CPI, we have assumed an
escalation equal to the stated fixed percentage in the lease. As any future increase in CPI is unknowable at this time, we have not included an increase in the rent pursuant to these leases in the weighted average annual
escalation rate presented.
Lease Escalation Frequency Lease Escalation Type
Weighted Average
Lease Escalation Frequency % of Cash ABR Annual Escalation Rate1,2
Annually 79.4% 1.6%
Every 2 years 2.5 1.4
Every 3 years 0.4 1.2
Every 4 years 0.5 0.8
Every 5 years 13.6 1.3
Other escalation frequencies 2.2 1.4
Flat 1.4 NA
Total / Weighted Average 100.0% 1.5%
Contractual Fixed93%
CPI-Based
6%
Flat1%

Investor Presentation – March 2020 23
$52
$33 $30
$21 $19
$15 $14 $14 $14
$9
Focused on Highly Fungible and Liquid Real Estate
Lower ABR per Property2,3
Smaller Average Property SizeSmaller-Scale Net Leased Investments✓ ✓
✓
Source: Public filings and press releases.
Note: Essential Properties data as of December 31, 2019. Public net lease REIT data as of most recent reported quarter.
1. EPR, SRC and VER statistics calculated based on (i) total cash ABR for the three months ended December 31, 2019 and (ii) the average square footage during such time.
2. GTY is calculated using GAAP ABR.
3. EPR, SRC and VER statistics calculated based on (i) total cash ABR for the three months ended December 31, 2019 and (ii) the average property count during such time.
(Average Investment per Property ($mm))
Smaller-Scale Real Estate is Inherently More Liquid and Fungible
(Average square feet, in thousands)
Appropriate Rent per Square Foot1,2
✓ (Cash ABR per property, in thousands)
$1.3
$2.0
$2.7 $2.8 $2.9 $3.0
$3.3 $3.5
$3.8
$19.3
55.7
31.5
22.9 19.2 17.8 16.4
10.4 7.9 6.6
2.5
$311 $290
$273 $254 $250
$218 $207
$152 $132
$1,678 (Cash ABR per square foot)

Investor Presentation – March 2020 24
$2.6 $3.6 $4.1
$6.3 $6.6 $7.4 $7.8
$13.4
$16.3
45.4x 44.6x
24.2x 22.7x 22.0x 20.6x 17.7x 17.4x
14.7x
3.2x 3.6x 3.8x
4.8x 5.1x 5.8x 5.8x
7.2x 7.9x
Public REIT Benchmarking
Enterprise Value
2020E - 2021E AFFO per Share Growth CAGR
Attractively Valued and Positioned Relative to AFFO per Share Growth Leaders in Other REIT Sectors
2020E AFFO per Share Multiple1
Source: Public filings, FactSet and SNL.
Note: Market data as of February 27, 2020.
1. 2020E AFFO per share multiple calculated based on current price per share and FactSet mean 2020E AFFO per share estimates.
2. Adjusted annualized EBITDAR of public net lease REITs is for the most recently reported three months ended, as adjusted for subsequent events.
3. NSA, ROIC, and FRT 2019 AFFO per share based on FactSet consensus due to lack of actual metric reported by company.
Net Debt + Preferred / EBITDAre(Net Debt plus Preferred-to-Adjusted Annualized EBITDAre2) ($ in billions)
(2019A – 2021E Two Year CAGR3)
12.2%
11.0% 10.8% 10.6%
8.9%
6.6% 6.5%
4.8%
0.8%
Investor Presentation – March 2020 25
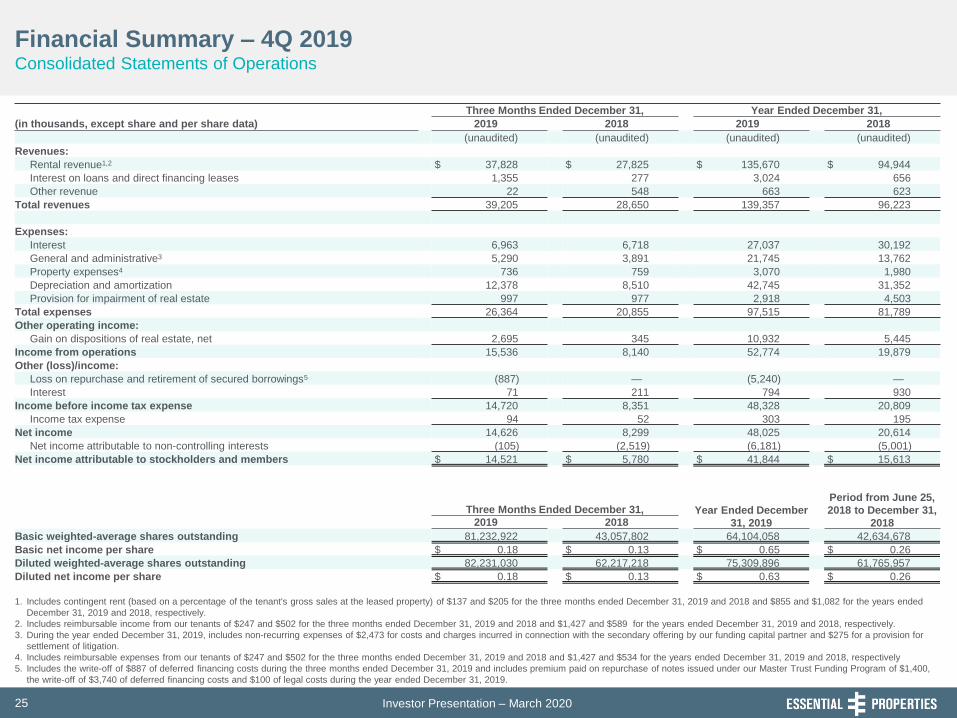
Financial Summary – 4Q 2019Consolidated Statements of Operations
1. Includes contingent rent (based on a percentage of the tenant's gross sales at the leased property) of $137 and $205 for the three months ended December 31, 2019 and 2018 and $855 and $1,082 for the years ended
December 31, 2019 and 2018, respectively.
2. Includes reimbursable income from our tenants of $247 and $502 for the three months ended December 31, 2019 and 2018 and $1,427 and $589 for the years ended December 31, 2019 and 2018, respectively.
3. During the year ended December 31, 2019, includes non-recurring expenses of $2,473 for costs and charges incurred in connection with the secondary offering by our funding capital partner and $275 for a provision for
settlement of litigation.
4. Includes reimbursable expenses from our tenants of $247 and $502 for the three months ended December 31, 2019 and 2018 and $1,427 and $534 for the years ended December 31, 2019 and 2018, respectively
5. Includes the write-off of $887 of deferred financing costs during the three months ended December 31, 2019 and includes premium paid on repurchase of notes issued under our Master Trust Funding Program of $1,400,
the write-off of $3,740 of deferred financing costs and $100 of legal costs during the year ended December 31, 2019.
Three Months Ended December 31, Year Ended December 31,
(in thousands, except share and per share data) 2019 2018 2019 2018
(unaudited) (unaudited) (unaudited) (unaudited)
Revenues:
Rental revenue1,2 $ 37,828 $ 27,825 $ 135,670 $ 94,944
Interest on loans and direct financing leases 1,355 277 3,024 656
Other revenue 22 548 663 623
Total revenues 39,205 28,650 139,357 96,223
Expenses:
Interest 6,963 6,718 27,037 30,192
General and administrative3 5,290 3,891 21,745 13,762
Property expenses4 736 759 3,070 1,980
Depreciation and amortization 12,378 8,510 42,745 31,352
Provision for impairment of real estate 997 977 2,918 4,503
Total expenses 26,364 20,855 97,515 81,789
Other operating income:
Gain on dispositions of real estate, net 2,695 345 10,932 5,445
Income from operations 15,536 8,140 52,774 19,879
Other (loss)/income:
Loss on repurchase and retirement of secured borrowings5 (887) — (5,240) —
Interest 71 211 794 930
Income before income tax expense 14,720 8,351 48,328 20,809
Income tax expense 94 52 303 195
Net income 14,626 8,299 48,025 20,614
Net income attributable to non-controlling interests (105) (2,519) (6,181) (5,001)
Net income attributable to stockholders and members $ 14,521 $ 5,780 $ 41,844 $ 15,613
Three Months Ended December 31, Year Ended December
31, 2019
Period from June 25,
2018 to December 31,
20182019 2018
Basic weighted-average shares outstanding 81,232,922 43,057,802 64,104,058 42,634,678
Basic net income per share $ 0.18 $ 0.13 $ 0.65 $ 0.26
Diluted weighted-average shares outstanding 82,231,030 62,217,218 75,309,896 61,765,957
Diluted net income per share $ 0.18 $ 0.13 $ 0.63 $ 0.26

Investor Presentation – March 2020 26
Financial Summary – 4Q 2019Funds from Operations (FFO) and Adjusted Funds from Operations (AFFO)
1. Includes non-recurring expenses of $887 related to our retirement of secured borrowings during the three months ended December 31, 2019 and $2,473 for costs and charges incurred in connection with the secondary
offering by our funding capital partner, our $5,240 loss on repurchase and retirement of secured borrowings and $275 for a provision for settlement of litigation during the year ended December 31, 2019.
2. Calculations exclude $116, $145 and $494 from the numerator for the three months ended December 31, 2019 and 2018 and the year ended December 31, 2019, respectively, related to dividends paid on unvested
restricted share awards and restricted share units.
Three Months Ended December 31, Year Ended December 31,
(unaudited, in thousands except per share amounts) 2019 2018 2019 2018
Net income $ 14,626 $ 8,299 $ 48,025 $ 20,614
Depreciation and amortization of real estate 12,354 8,496 42,649 31,335
Provision for impairment of real estate 997 977 2,918 4,503
Gain on dispositions of real estate, net (2,695) (345) (10,932) (5,445)
Funds from Operations 25,282 17,427 82,660 51,007
Other non-recurring expenses1 887 — 7,988 —
Core Funds from Operations 26,169 17,427 90,648 51,007
Adjustments:
Straight-line rental revenue, net (3,336) (2,499) (12,215) (8,214)
Non-cash interest expense 603 816 2,738 2,798
Non-cash compensation expense 1,022 1,042 4,546 2,440
Other amortization and non-cash charges 81 179 824 579
Capitalized interest expense (125) (11) (290) (225)
Transaction costs — (1) — 57
Adjusted Funds from Operations $ 24,414 $ 16,953 $ 86,251 $ 48,442
Net income per share2:
Basic $ 0.18 $ 0.13 $ 0.65
Diluted $ 0.18 $ 0.13 $ 0.63
FFO per share2:
Basic $ 0.31 $ 0.28 $ 1.11
Diluted $ 0.31 $ 0.28 $ 1.09
Core FFO per share2:
Basic $ 0.32 $ 0.28 $ 1.21
Diluted $ 0.32 $ 0.28 $ 1.20
AFFO per share2:
Basic $ 0.30 $ 0.27 $ 1.15
Diluted $ 0.30 $ 0.27 $ 1.14
Investor Presentation – March 2020 27
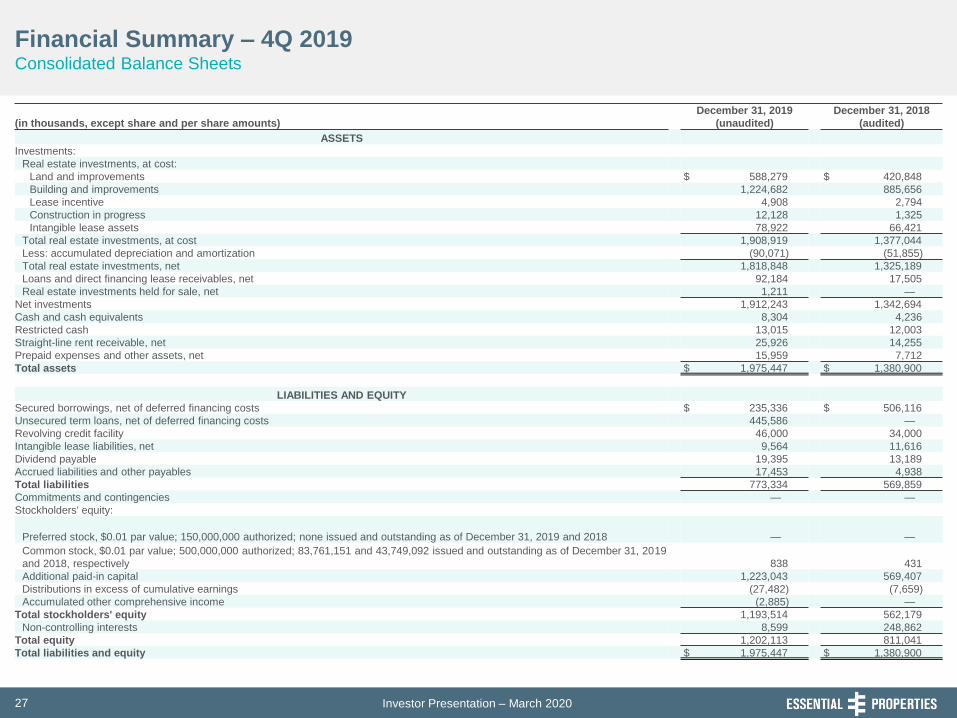
Financial Summary – 4Q 2019Consolidated Balance Sheets
December 31, 2019 December 31, 2018
(in thousands, except share and per share amounts) (unaudited) (audited)
ASSETS
Investments:
Real estate investments, at cost:
Land and improvements $ 588,279 $ 420,848
Building and improvements 1,224,682 885,656
Lease incentive 4,908 2,794
Construction in progress 12,128 1,325
Intangible lease assets 78,922 66,421
Total real estate investments, at cost 1,908,919 1,377,044
Less: accumulated depreciation and amortization (90,071) (51,855)
Total real estate investments, net 1,818,848 1,325,189
Loans and direct financing lease receivables, net 92,184 17,505
Real estate investments held for sale, net 1,211 —
Net investments 1,912,243 1,342,694
Cash and cash equivalents 8,304 4,236
Restricted cash 13,015 12,003
Straight-line rent receivable, net 25,926 14,255
Prepaid expenses and other assets, net 15,959 7,712
Total assets $ 1,975,447 $ 1,380,900
LIABILITIES AND EQUITY
Secured borrowings, net of deferred financing costs $ 235,336 $ 506,116
Unsecured term loans, net of deferred financing costs 445,586 —
Revolving credit facility 46,000 34,000
Intangible lease liabilities, net 9,564 11,616
Dividend payable 19,395 13,189
Accrued liabilities and other payables 17,453 4,938
Total liabilities 773,334 569,859
Commitments and contingencies — —
Stockholders' equity:
Preferred stock, $0.01 par value; 150,000,000 authorized; none issued and outstanding as of December 31, 2019 and 2018 — —
Common stock, $0.01 par value; 500,000,000 authorized; 83,761,151 and 43,749,092 issued and outstanding as of December 31, 2019
and 2018, respectively 838 431
Additional paid-in capital 1,223,043 569,407
Distributions in excess of cumulative earnings (27,482) (7,659)
Accumulated other comprehensive income (2,885) —
Total stockholders' equity 1,193,514 562,179
Non-controlling interests 8,599 248,862
Total equity 1,202,113 811,041
Total liabilities and equity $ 1,975,447 $ 1,380,900

Investor Presentation – March 2020 28
Financial Summary – 4Q 2019GAAP Reconciliations to EBITDAre, GAAP NOI, Cash NOI and Estimated Run Rate Metrics
1. These adjustments are made to reflect EBITDAre, NOI and Cash NOI as if all investments in and dispositions of real estate made during the three months ended December 31, 2019 had occurred on October 1, 2019.
2. Adjustment excludes $887 of non-core expenses added back to compute Core FFO and a $541 write-off of receivables.
3. Adjustment excludes contingent rent (based on a percentage of the tenant's gross sales at the leased property) where payment is subject to exceeding a sales threshold specified in the lease and lease termination fees.
Three Months Ended
(unaudited, in thousands) December 31, 2019
Net income $ 14,626
Depreciation and amortization 12,378
Interest expense 6,963
Interest income (71)
Income tax expense 94
EBITDA 33,990
Provision for impairment of real estate 997
Gain on dispositions of real estate, net (2,695)
EBITDAre 32,292
Adjustment for current quarter acquisition and disposition activity1 2,121
Adjustment to exclude other non-recurring expenses2 1,428
Adjustment to exclude lease termination fees and certain percentage rent3 (19)
Adjusted EBITDAre - Current Estimated Run Rate 35,822
General and administrative 5,290
Adjusted net operating income ("NOI") 41,112
Straight-line rental revenue, net1 (3,544)
Other amortization and non-cash charges 79
Adjusted Cash NOI $ 37,647
Annualized EBITDAre $ 129,168
Annualized Adjusted EBITDAre $ 143,288
Annualized Adjusted NOI $ 164,448
Annualized Adjusted Cash NOI $ 150,588

Investor Presentation – March 2020 29
Financial Summary – 4Q 2019Market Capitalization, Debt Summary and Leverage Metrics
1. Maturity figures for our secured debt are based off of our anticipated repayment schedule. The Series 2016-1 notes were due to mature in November 2046 but were fully repaid in November 2019. The Series 2017-1 notes
mature in June 2047 but have an anticipated repayment date of June 2024.
2. Our revolving credit facility provides a maximum aggregate initial original principal amount of up to $400 million and includes an accordion feature to increase, subject to certain conditions, the maximum availability of the
facility by up to $200 million.
3. Common equity & units as of December 31, 2019, based on 83,761,151 common shares outstanding (including unvested restricted share awards) and 553,847 OP units held by non-controlling interests.
4. Pro forma adjustments have been made to reflect the impact of our January 2020 follow-on offering of common stock. On January 14, 2020, we issued 7,935,000 shares of common stock for proceeds of $192.0 million, net
of underwriters' discounts.
(dollars in thousands, except share and per share amounts) December 31, 2019 Rate Maturity1
Secured debt:
Series 2017-1, Class A 223,434 4.10% 4.5 years
Series 2017-1, Class B 15,669 5.11% 4.5 years
Total secured debt 239,103 4.17% 4.5 years
Unsecured debt:
$200mm term loan 200,000 3.31% 4.3 years
$430mm term loan 250,000 3.11% 6.9 years
Revolving credit facility2 46,000 LIBOR plus 1.25% to 1.85% 3.3 years
Total unsecured debt 496,000 3.19% 5.5 years
Gross debt 735,103 3.50% 5.2 years
Less: cash & cash equivalents (8,304)
Less: restricted cash deposits held for the benefit of lenders (13,015)
Net debt 713,784
Equity:
Preferred stock —
Common stock & OP units (84,314,998 shares @ $24.81/share as of 12/31/19)3 2,091,855
Total equity 2,091,855
Total enterprise value ("TEV") $ 2,805,639
Pro forma adjustments to Net Debt and TEV4:
Net debt $ 713,784
Less: cash received - January 2020 follow-on offering (191,964)
Pro forma net debt 521,820
Total equity 2,091,855
Common stock - January 2020 follow-on offering (7,935,000 shares @ $24.81/share as of 12/31/19) 196,867
Pro forma TEV $ 2,810,543
Net Debt / TEV 25.4%
Pro Forma Net Debt / Pro Forma TEV 18.6%
Net Debt / Annualized Adjusted EBITDAre 5.0x
Pro Forma Net Debt / Annualized Adjusted EBITDAre 3.6x

Investor Presentation – March 2020 30
GlossarySupplemental Reporting Measures and Other Terms
FFO, Core FFO and AFFO
Our reported results are presented in accordance with U.S. generally
accepted accounting principles ("GAAP"). We also disclose funds from
operations (“FFO”), core funds from operations (“Core FFO”) and adjusted
funds from operations (“AFFO”), each of which is a non-GAAP financial
measures. We believe these non-GAAP financial measures are industry
measures used by analysts and investors to compare the operating
performance of REITs.
We compute FFO in accordance with the definition adopted by the Board
of Governors of the National Association of Real Estate Investment Trusts
("NAREIT"). NAREIT defines FFO as GAAP net income or loss adjusted to
exclude extraordinary items (as defined by GAAP), net gain or loss from
sales of depreciable real estate assets, impairment write-downs
associated with depreciable real estate assets and real estate-related
depreciation and amortization (excluding amortization of deferred
financing costs and depreciation of non-real estate assets), including the
pro rata share of such adjustments of unconsolidated subsidiaries. FFO is
used by management, and may be useful to investors and analysts, to
facilitate meaningful comparisons of operating performance between
periods and among our peers primarily because it excludes the effect of
real estate depreciation and amortization and net gains and losses on
sales (which are dependent on historical costs and implicitly assume that
the value of real estate diminishes predictably over time, rather than
fluctuating based on existing market conditions).
We compute Core FFO by adjusting FFO, as defined by NAREIT, to
exclude certain GAAP income and expense amounts that we believe are
infrequent and unusual in nature and/or not related to our core real estate
operations. Exclusion of these items from similar FFO-type metrics is
common within the equity REIT industry, and management believes that
presentation of Core FFO provides investors with a metric to assist in their
evaluation of our operating performance across multiple periods and in
comparison to the operating performance of our peers, because it
removes the effect of unusual items that are not expected to impact our
operating performance on an ongoing basis. Core FFO is used by
management in evaluating the performance of our core business
operations. Items included in calculating FFO that may be excluded in
calculating Core FFO include items like certain transaction related gains,
losses, income or expense or other non-core amounts as they occur.
To derive AFFO, we modify the NAREIT computation of FFO to include
other adjustments to GAAP net income related to certain items that we
believe are not indicative of our operating performance, including straight-
line rental revenue, non-cash interest expense, non-cash compensation
expense, other amortization and non-cash charges, capitalized interest
expense and transaction costs. Such items may cause short-term
fluctuations in net income but have no impact on operating cash flows or
long-term operating performance. We believe that AFFO is an additional
useful supplemental measure for investors to consider to assess our
operating performance without the distortions created by non-cash and
certain other revenues and expenses.
FFO, Core FFO and AFFO do not include all items of revenue and
expense included in net income, they do not represent cash generated
from operating activities, and they are not necessarily indicative of cash
available to fund cash requirements; accordingly, they should not be
considered alternatives to net income as a performance measure or cash
flows from operations as a liquidity measure and should be considered in
addition to, and not in lieu of, GAAP financial measures. Additionally, our
computation of FFO, Core FFO and AFFO may differ from the
methodology for calculating these metrics used by other equity REITs and,
therefore, may not be comparable to similarly titled measures reported by
other equity REITs.
Investor Presentation – March 2020 31
GlossarySupplemental Reporting Measures and Other Terms
We also present our earnings before interest, taxes and depreciation and
amortization for real estate (“EBITDA”), EBITDA further adjusted to
exclude gains (or losses) on sales of depreciable property and real estate
impairment losses (“EBITDAre”), net debt, net operating income (“NOI”)
and cash NOI (“Cash NOI”), all of which are non-GAAP financial
measures. We believe these non-GAAP financial measures are accepted
industry measures used by analysts and investors to compare the
operating performance of REITs.
EBITDA and EBITDAre
We compute EBITDA as earnings before interest, income taxes and
depreciation and amortization. In 2017, NAREIT issued a white paper
recommending that companies that report EBITDA also report EBITDAre.
We compute EBITDAre in accordance with the definition adopted by
NAREIT. NAREIT defines EBITDAre as EBITDA (as defined above)
excluding gains (or losses) from the sales of depreciable property and real
estate impairment losses. We present EBITDA and EBITDAre as they are
measures commonly used in our industry and we believe that these
measures are useful to investors and analysts because they provide
important supplemental information concerning our operating
performance, exclusive of certain non-cash and other costs. We use
EBITDA and EBITDAre as measures of our operating performance and
not as measures of liquidity.
EBITDA and EBITDAre do not include all items of revenue and expense
included in net income, they do not represent cash generated from
operating activities and they are not necessarily indicative of cash
available to fund cash requirements; accordingly, the should not be
considered alternatives to net income as a performance measure or cash
flows from operations as a liquidity measure and should be considered in
addition to, and not in lieu of, GAAP financial measures. Additionally, our
computation of EBITDA and EBITDAre may differ from the methodology
for calculating these metrics used by other equity REITs and, therefore,
may not be comparable to similarly titled measures reported by other
equity REITs.
Net Debt
We calculate our net debt as our gross debt (defined as total debt plus net
deferred financing costs on our secured borrowings) less cash and cash
equivalents and restricted cash deposits held for the benefit of lenders.
We believe excluding cash and cash equivalents and restricted cash
deposits held for the benefit of lenders from gross debt, all of which could
be used to repay debt, provides an estimate of the net contractual amount
of borrowed capital to be repaid, which we believe is a beneficial
disclosure to investors and analysts.
NOI and Cash NOI
We compute NOI as total revenues less property expenses. NOI excludes
all other items of expense and income included in the financial statements
in calculating net income or loss. Cash NOI further excludes non-cash
items included in total revenues and property expenses, such as straight-
line rental revenue and other amortization and non-cash charges. We
believe NOI and Cash NOI provide useful and relevant information
because they reflect only those income and expense items that are
incurred at the property level and present such items on an unlevered
basis.
NOI and Cash NOI are not measurements of financial performance under
GAAP. You should not consider our NOI and Cash NOI as alternatives to
net income or cash flows from operating activities determined in
accordance with GAAP. Additionally, our computation of NOI and Cash
NOI may differ from the methodology for calculating these metrics used by
other equity REITs and, therefore, may not be comparable to similarly
titled measures reported by other equity REITs.

Investor Presentation – March 2020 32
GlossarySupplemental Reporting Measures and Other Terms
Adjusted EBITDAre / Adjusted NOI / Adjusted Cash NOI
We further adjust EBITDAre, NOI and Cash NOI i) based on an estimate
calculated as if all investment and disposition activity that took place
during the quarter had been made on the first day of the quarter, ii) to
exclude certain GAAP income and expense amounts that we believe are
infrequent and unusual in nature and iii) to eliminate the impact of lease
termination fees and contingent rental revenue from our tenants which is
subject to sales thresholds specified in the lease. We then annualize these
estimates for the current quarter by multiplying them by four, which we
believe provides a meaningful estimate of our current run rate for all
investments as of the end of the current quarter. You should not unduly
rely on these measures, as they are based on assumptions and estimates
that may prove to be inaccurate. Our actual reported EBITDAre, NOI and
Cash NOI for future periods may be significantly less than these estimates
of current run rates.
Cash ABR
Cash ABR means annualized contractually specified cash base rent in
effect as of the end of the current quarter for all of our leases (including
those accounted for as direct financing leases) commenced as of that date
and annualized cash interest on our mortgage loans receivable as of that
date.
Rent Coverage Ratio
Rent coverage ratio means the ratio of tenant-reported or, when
unavailable, management’s estimate based on tenant-reported financial
information, annual EBITDA and cash rent attributable to the leased
property (or properties, in the case of a master lease) to the annualized
base rental obligation as of a specified date.
GE Seed Portfolio
GE seed portfolio means our acquisition of a portfolio of 262 net leased
properties on June 16, 2016, consisting primarily of restaurants, that were
being sold as part of the liquidation of General Electric Capital Corporation
for an aggregate purchase price of $279.8 million (including transaction
costs).
GAAP Cap Rate
GAAP Cap Rate means annualized rental income computed in
accordance with GAAP for the first full month after investment divided by
the purchase price, as applicable, for the property.
Cash Cap Rate
Cash Cap Rate means annualized contractually specified cash base rent
for the first full month after investment or disposition divided by the
purchase or sale price, as applicable, for the property.
Disclaimer
Essential Properties Realty Trust, Inc. and the Essential Properties Realty
Trust REIT are not affiliated with or sponsored by Griffin Capital Essential
Asset Operating Partnership, L.P. or the Griffin Capital Essential Asset
REIT, information about which can be obtained at
(https://www.gcear.com).