investor presentation april 2020 - sonoco
TRANSCRIPT

Sonoco First Quarter ResultsInvestor PresentationApril 2020
Forward Looking Statements/Non-GAAP Financial Measures
2
Today’s presentation contains a number of forward-looking statements based on current expectations, estimates and projections. These statements are not guarantees of future performance and are subject to certain risks and uncertainties. Therefore, actual results may differ materially.
Information about the Company’s use of non-GAAP financial measures, why management believes presentation of non-GAAP financial measures provides useful information to investors about the Company’s financial condition and results of operations, and the purposes for which management uses non-GAAP financial measures is included in the Company’s Annual Report and on the Company’s website at sonoco.com under Investor Relations, Webcasts & Presentations, Non-GAAP Reconciliations for Q1 2020 Earnings Presentation.
Pursuant to the requirements of Regulation G, the Company has provided definitions of the non-GAAP measures discussed during this presentation as well as reconciliations of those measures to the most closely related GAAP measure on its website at sonoco.com.
This presentation does not constitute the solicitation of the purchase or sale of any securities.

Sonoco is a Global Essential Service Provider
3
• 80% of Sonoco’s Consumer Packaging is for food
• Paper/Tubes and Cores provide carriers for essential goods• Tissue/Towel paperboard
• Tubes/Cores paperboard: plastic film for food (products), drugs and medical equipment
• Medical Packaging
• Sonoco ThermoSafe temperature-assured packaging

Sonoco is Aiding in Virus Testing and Protection
4
• Sonoco Alloyd is producing two million face shields
• Sonoco ThermoSafe is partnering with logistics and medical
companies to ship testing kits across the country
• Tube and Core operations in Spain are helping an automotive supplier
produce face masks for local hospitals
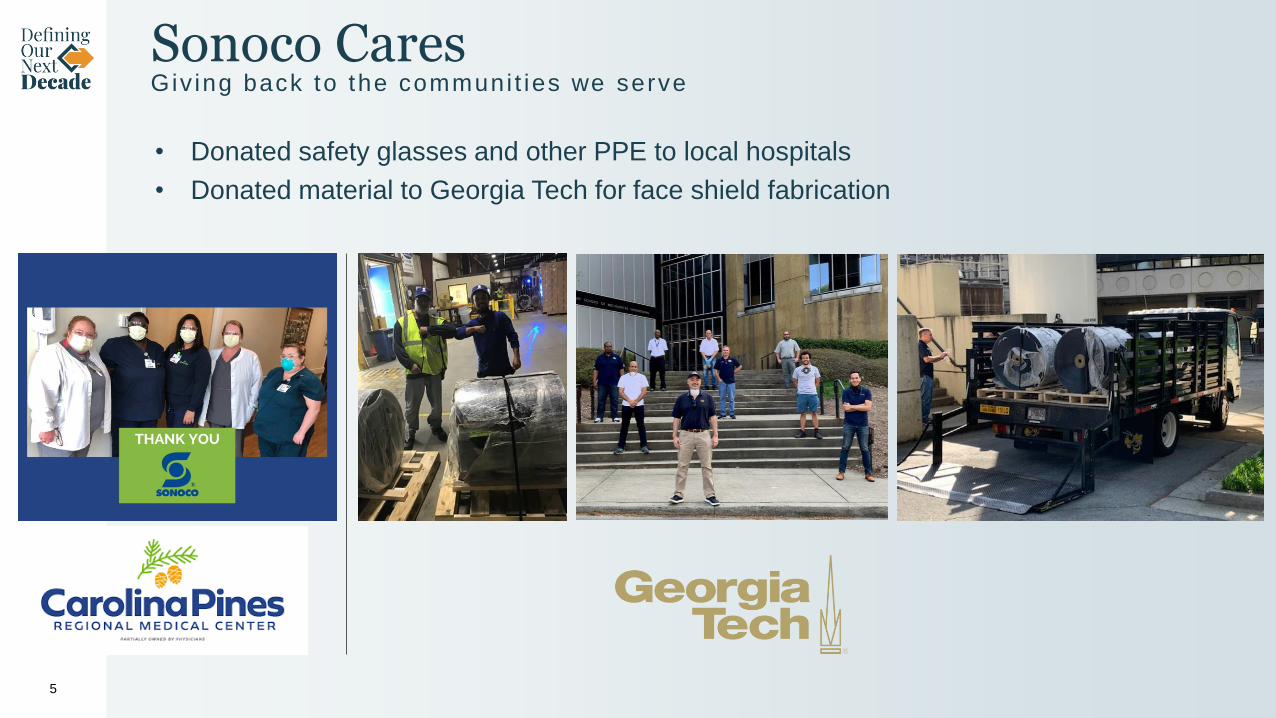
Sonoco CaresGiv ing back to the communi t ies we serve
5
• Donated safety glasses and other PPE to local hospitals
• Donated material to Georgia Tech for face shield fabrication

6
EPS Summary1st Quarter: 2020 Vs. 2019
1st Quarter
2020 2019
Actual EPS $ 0.80 $ 0.73
Addback for:
Restructuring & Asset Impairment, Net 0.09 0.08
Non-operating Pension Costs 0.06 0.04Deferred Tax Adjustments / M&A Transaction Costs (0.01) —
Base EPS* $ 0.94 $ 0.85
*Due to rounding individual items may not sum down

7
P&L Summary (Base)1st Quarter: 2020 Vs. 2019
(Dollars in millions)
Better / (Worse)
2020 2019 $ %
Net sales $ 1,303 $ 1,352 $ (48) (3.6)%
Gross profit 267 270 (4) (1.3)%
SG&A expenses (123) (142) 19 13.7%
Operating profit 144 128 16 12.5%
Net interest (16) (15) (1) (4.3)%
Provision for income taxes (33) (27) (6) (22.6)%
Net income, after tax 95 85 9 10.7%
Equity in Affiliates and Minority Interest 1 1 — (6.0)%
Net income attributable to Sonoco $ 95 $ 86 $ 9 10.6%
Operating profit before D&A 206 187 19 10.3%
Gross profit % 20.5% 20.0%
SG&A % 9.4% 10.5%
OP % 11.0% 9.5%
OPBDA% 15.8% 13.8%
Effective tax rate 26.0% 24.1%
Note: Due to rounding individual items may not sum down. Percentages shown are based on amounts that are not rounded

8
Sales Bridge1st Quarter: 2020 Vs. 2019
(Dollars in millions)

9
Base Operating Profit Bridge1st Quarter: 2020 Vs. 2019
(Dollars in millions)

10
Segment Analysis1st Quarter: 2020 Vs. 2019
(Dollars in millions) NET SALES BASE OPERATING PROFIT
2020 2019 % Chg 2020 2019 % Chg
Consumer Packaging $ 588 $ 590 (0.2)% $ 68 $ 62 9.2%
Display & Packaging 121 138 (11.8)% 8 6 25.4%
Paper & Ind Conv Prods 475 496 (4.2)% 54 48 11.6%
Protective Solutions 119 128 (7.7)% 14 11 27.3%
$ 1,303 $ 1,352 (3.6)% $ 144 $ 128 12.5%
OPERATING PROFIT AS % OF SALES
MARGINCHANGE
Consumer Packaging 11.5% 10.5% 1.0%
Display & Packaging 6.7% 4.7% 2.0%
Paper & Ind Conv Prods 11.4% 9.8% 1.6%
Protective Solutions 11.8% 8.6% 3.2%
11.0% 9.5% 1.6%
Note: Due to rounding individual items may not sum down. Percentages shown are based on amounts that are not rounded

11
Cash Flow1st Quarter 2020 Vs. 2019
(Dollars in millions)
Q1 2020 Q1 2019
Net income $ 80 $ 74
Asset impairment charges / Losses on disposition of assets 1 4
Depreciation and amortization expense 61 59
Pension and postretirement plan contributions, net of expenses
(10) (10)
Changes in working capital (68) (46)
Changes in tax accounts 12 10
Other operating activity 13 2
Operating cash flow $ 88 $ 92
Capital expenditures, net of dispositions (31) (42)
Cash dividends (43) (41)
Free cash flow $ 14 $ 10
Note: Due to rounding individual items may not sum down.

Earnings Guidance
12
1st Qtr 2nd Qtr 3rd Qtr 4th Qtr Full Year
2019Base EPS
$0.85 $0.95 $0.97 $0.75 $3.53
2020Base EPS
$0.94
2020Guidance
$0.83 -$0.89
$0.73 -$0.83
2020 Full-year Base EPS and Cash Flow Guidance Withdrawn
Due to COVID-19 Impact Uncertainty

Key Drivers to Q2 Guidance
13
• COVID-19 Impact• Demand for our products – Mixed impact (+/-)
• Mitigating actions – Cost reductions
• Price / Cost Impact• Significantly negative due to increasing OCC costs
• Other Impacts• Foreign exchange translation – Negative due to stronger US Dollar
• Interest expense – Higher due to increased borrowings (liquidity actions)
• 2020 Cash Flow Drivers• Updated capital spending outlook = $170 million
• Reduced spending plans by $45 million ($195 million to $150 million)
• Added capital spending for Project Horizon ($15 million to $20 million)
• Pension termination related contribution deferred to 2021• ~$150 million not in original cash flow guidance

Liquidity – Recent Actions
14
Recent Liquidity Actions• New $150 million Term Loan (364-day, mid-March funding)
• New $100 million Term Loan (364-day, early April funding)
• Borrowed $250 million on Revolver • $250 million remaining availability; Matures July 2022
• Gave notice to extend existing $200 million term loan until May 2021
Result of Above Actions• Fully repaid Commercial Paper borrowings
• Investing $250 - $300 million at Sonoco (US)• Q1-2020 consolidated cash = $123 million
• Total Liquidity (Total Cash + Revolver availability) = Approx $650 million
• Considering additional financing activities
Cash (3/29 Balance Sheet) 123$
Cash Invested (new) 275$
Revolver Availability 250$
648$
Current Liquidity

U.S./Canada URB Optimization Investment Plan
15
Capital Investment $83 Million
• 2020-2021 – Build new Hartsville Fiber Operation
• Stock prep system for entire complex using mixed paper/OCC
• 2021-2022 – Rebuild #10 Machine to Produce URB
• Meet internal and customers wide-range of URB grades
• Wisconsin Rapids Expansion
• Increase capacity by 7%

U.S./Canada URB Optimization Investment Plan
16
Annualized Cost Savings $24 Million
• Fixed-variable cost reduction – future capacity rationalization
• Permanently shut No. 3 Hartsville URB machine
• Close Trent Valley, Ontario, Canada mill
• Return on investment well above the cost of capital
Other cost savings
• Reduce commodity input costs (mixed paper/OCC)
• Improve supply chain/system integration
• Lower energy, chemicals, freight costs

Lowest Cost URB System
17
Sonoco’s URB costs expected to be 18% lower than nearest supplier
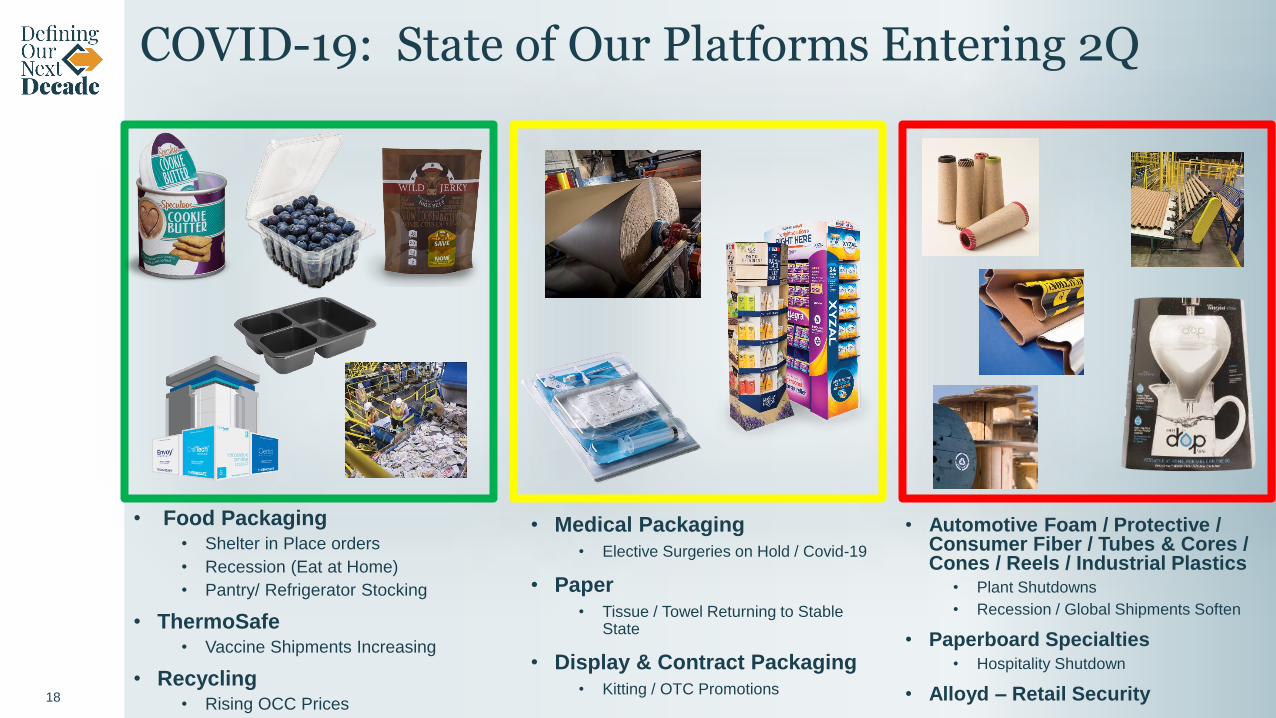
COVID-19: State of Our Platforms Entering 2Q
• Food Packaging• Shelter in Place orders
• Recession (Eat at Home)
• Pantry/ Refrigerator Stocking
• ThermoSafe• Vaccine Shipments Increasing
• Recycling• Rising OCC Prices
• Medical Packaging
• Elective Surgeries on Hold / Covid-19
• Paper
• Tissue / Towel Returning to Stable State
• Display & Contract Packaging
• Kitting / OTC Promotions
• Automotive Foam / Protective / Consumer Fiber / Tubes & Cores / Cones / Reels / Industrial Plastics
• Plant Shutdowns
• Recession / Global Shipments Soften
• Paperboard Specialties• Hospitality Shutdown
• Alloyd – Retail Security18
Appendix

20
Balance Sheet(Dollars in millions)
3/29/2020 12/31/2019 Change $
Cash and cash equivalents $ 123 $ 145 $ (22)
Trade accounts receivable, net of allowances 738 698 40
Other receivables 99 114 (15)
Inventories 500 504 (4)
Prepaid expenses and deferred income taxes 54 60 (6)
Current Assets $ 1,514 $ 1,521 $ (7)
Property, plant and equipment, net 1,237 1,287 (50)
Goodwill 1,412 1,429 (17)
Other intangible assets, net 373 388 (15)
Other assets 477 501 (24)
Total Assets $ 5,012 $ 5,126 $ (114)
Payable to suppliers and others 894 905 (10)
Income taxes payable 17 11 6
Total debt 1,641 1,681 (40)
Pension and other postretirement benefits 304 305 (1)
Deferred income taxes and other 401 408 (8)
Total equity 1,755 1,816 (61)
Total Liabilities and Shareholders' Equity $ 5,012 $ 5,126 $ (114)
Net debt / Total capital 46.4% 45.8%
Net debt = Total debt minus cash and cash equivalents. Total capital = Net debt plus total equity
Note: Due to rounding individual items may not sum down. Percentages shown are based on amounts that are not rounded

21
OCC: Official Board Market1st Quarter: 2020 Vs. 2019 Vs. 2018
(Price/Ton)
1st Quarter 2nd Quarter 3rd Quarter 4th Quarter
J F M Avg A M J Avg J A S Avg O N D Avg
2018 115 110 95 107 85 80 80 82 85 90 90 88 90 90 85 88
2019 85 75 65 75 50 40 35 42 35 35 35 35 35 35 35 35
2020 35 40 50 42 85*
*As of April 6, 2020

Howard Coker
R. Howard Coker, 57, is President and CEO of Sonoco. In this role, Coker has
global leadership, sales and operating responsibility for all of the Company’s
diversified consumer, industrial and protective packaging businesses. He
previously served as Senior Vice President, Global Paper/Industrial Converted
Products.
Coker also served as Senior Vice President, Rigid Paper Containers and
Paper/Engineered Carriers International, where he had responsibility for the
Company’s global composite can operations in North America, South America,
Europe and Asia, as well as paper, tube and core operations in Europe, Latin
America and Australasia.
Prior to that, Coker served as Vice President, Rigid Paper and Closures, North
America. In this role, he had responsibility for Sonoco's 21 rigid paper container
and seven metal and peelable membrane closure operations in the United States,
Canada and Mexico. He was also elected a Corporate Officer in February 2009.
He also served as Group Vice President and held several leadership positions
running global consumer-related and industrial businesses.
Coker joined Sonoco in 1985.
He is a 1985 graduate of Wofford College with a B.A. in Business Administration,
and he received an MBA from Wake Forest University in 1990.
He is married, has three children and lives in Hartsville, SC.
President and CEO
22

Rodger Fuller
Rodger Fuller, 59, is Executive Vice President of Sonoco. In this role, he is
responsible for all Industrial and Consumer operations globally, which includes
the Company’s Display and Packaging and Protective Solutions segments.
Fuller previously served as Senior Vice President, Global Consumer
Packaging, Display & Packaging and Protective Solutions, responsible for all of
Sonoco’s Consumer-related businesses, including Global Rigid Paper and
Closures; Global Plastics; Global Flexible Packaging; Display & Packaging;
and Protective Solutions.
He also previously served as Senior Vice President, Paper/Engineered Carriers
U.S./Canada & Display and Packaging. Prior to this, he was Group Vice
President, Paper and Industrial Converting, U.S. and Canada, and Vice
President, Global Primary Materials Group. Rodger began his career at Sonoco
in 1985 in the Consumer sector of Sonoco, having held several senior
leadership positions, including Vice President, Global Rigid Paper & Closures
and Global Plastics.
He has a BS degree in Business from Berry College and MBA from Emory
University. He is active in industry and community service organizations,
including serving on the board of the Paper and Packaging Board, American
Forest and Paper Association and the Hartsville United Way.
He and his wife have two grown children and reside in Hartsville.
Executive Vice President
23

Julie Albrecht
Julie Albrecht, 52, is Vice President and Chief Financial Officer.
She was promoted to VP and CFO in March 2019. In this role, Albrecht
has global leadership for all of the Company’s finance operations and
teams. She joined Sonoco in March 2017 as Corporate VP, Treasurer
and Assistant CFO, holding responsibility for the Company’s treasury, tax
and risk management functions. In that role, she was responsible for the
Company’s relationships with the credit rating agencies and commercial
banks and has handled financings for four acquisitions totaling
approximately $690 million. She also has been instrumental in the
Company’s efforts to drive significant improvement in cash flow from
operations in 2018 and 2019 and has been responsible for risk
management of the Company’s retirement benefit plans.
She is a graduate of Wake Forest University with a B.S. in Accounting.
Julie, her husband and their two children live in Columbia, SC.
Vice President and Chief Financial Officer
24