investor presentation 3q »2017
TRANSCRIPT

INVESTOR PRESENTATION3Q »2017
March 2019 Presentation

2
Forward Looking & Cautionary Statements
Forward-Looking StatementsThe information in this presentation includes “forward-looking statements” that are made pursuant to the Safe Harbor Provisions of the Private Securities Litigation ReformAct of 1995. All statements, other than statements of historical fact included in this presentation, regarding our strategy, future operations, financial position, estimatedrevenues and losses, projected costs, prospects, plans and objectives of management are forward-looking statements. When used in this presentation, the words “could,”“believe,” “anticipate,” “intend,” “estimate,” “expect,” “project” and similar expressions are intended to identify forward-looking statements, although not all forward-lookingstatements contain such identifying words. These forward-looking statements are based on Parsley Energy, Inc.’s (“Parsley Energy,” “Parsley,” or the “Company”) currentexpectations and assumptions about future events and are based on currently available information as to the outcome and timing of future events. We caution you that theseforward-looking statements are subject to all of the risks and uncertainties, most of which are difficult to predict and many of which are beyond our control, incident to theexploration for and development, production, gathering and sale of oil and natural gas. These risks include, but are not limited to, commodity price volatility, inflation, lack ofavailability of drilling and production equipment and services, environmental risks, drilling and other operating risks, regulatory changes, the uncertainty inherent inestimating reserves and in projecting future rates of production, the production potential of our undeveloped acreage, cash flow and access to capital, the timing ofdevelopment expenditures and the risk factors discussed in or referenced in our filings with the United States Securities and Exchange Commission (“SEC”), including ourAnnual Report on Form 10-K and our subsequent Quarterly Reports on Form 10-Q and Current Reports on Form 8-K.
You are cautioned not to place undue reliance on any forward-looking statements, which speak only as of the date of this presentation. Except as otherwise required byapplicable law, we disclaim any duty to update any forward-looking statements, all of which are expressly qualified by the statements in this section, to reflect events orcircumstances after the date of this presentation.
Our production forecasts and expectations for future periods are dependent upon many assumptions, including estimates of production decline rates from existing wells andthe undertaking and outcome of future drilling activity, which may be affected by significant commodity price declines or cost increases.
Industry and Market DataThis presentation has been prepared by Parsley and includes market data and other statistical information from third-party sources, including independent industrypublications, government publications or other published independent sources. Although Parsley believes these third-party sources are reliable as of their respective dates,Parsley has not independently verified the accuracy or completeness of this information. Some data are also based on Parsley’s good faith estimates, which are derivedfrom its review of internal sources as well as the third-party sources described above.
Accounting Standards Codification Topic 606, Revenue from Contracts with Customers (“ASC 606”)Natural gas and natural gas liquids (“NGLs”) sales and associated production volumes for the three months and year ended December 31, 2018 reflect adjustmentsassociated with Parsley’s adoption of Accounting Standards Codification Topic 606, Revenue from Contracts with Customers (“ASC 606”), effective January 1, 2018. Unlessotherwise noted, all references to 4Q18 production volumes and per Boe unit costs likewise reflect this adoption, which has the effect of increasing certain natural gas andNGLs volumes and revenues, offset by a corresponding transportation and processing cost such that there is no change to reported net income. The recognition andpresentation of oil volumes and associated revenues and expenses are unaffected by the adoption of ASC 606. For more information on ASC 606 and a reconciliation of4Q18 production and unit costs under ASC 605 and as adjusted under ASC 606, please see the Supplementary Slides.

3
Parsley Energy Overview
► Posted strong operating cash margin(1)
► Furthered operational efficiency gains
► Showcased top-tier technical ability
► Unveiled disciplined 2019 program
► Economies of scale and core inventory depth
► Elite return profile
► Efficient and sustainable growth
► Advantaged production flow and pricing
► Financial flexibility with strong balance sheet
► Economic uplift from minerals ownership
ANDREWS
MARTIN
ECTOR
LEA
WINKLER
WARD
CRANE
REEVESPECOS
UPTON
MIDLAND
GLASSCOCK
REAGAN
HOWARD
DelawareBasin
CentralBasin
Platform
MidlandBasinPremier Permian Pure-Play
4Q18 Highlights
NYSE Symbol: PEMarket Cap: $5,783 MM Net Debt: $2,021 MMEnterprise Value: $7,804 MMShare Count: 317 MM
Market Snapshot(3)
Permian Basin Net Net Leasehold Acreage: ~192,000(2)
(97% Operated)Midland Basin: ~150,000Delaware Basin: ~42,000
Net Royalty Acreage: ~7,600
Parsley Energy Acreage
Parsley Acreage
(1) Operating cash margin percentage is not presented in accordance with generally accepted accounting principles in the United States (“GAAP”). For a reconciliation of operating cash margin to the most directly comparable GAAPfinancial measure, please see the Supplementary Slides; (2) As of 12/31/2018 pro forma for 2019 acreage expirations associated with 4Q18 non-cash leasehold impairment expense; (3) Market capitalization calculated using fullydiluted share count of 317 MM shares (280 MM Class A shares plus 37 MM Class B shares) as of 2/21/2019 and closing price as of 3/22/2019. Net debt as of 12/31/2018. Net Debt is a non-GAAP financial measure defined as totaldebt less cash and cash equivalents. Enterprise value is calculated as market capitalization plus net debt, where market capitalization is calculated as share price times the sum of Class A shares outstanding and Class B sharesoutstanding. Because non-controlling interest represents the portion of total book value of equity allocated to Class B shareholders, it is already represented in the enterprise value calculation by the inclusion of Class B shares in thecalculation of market capitalization, and should not be added separately as a component of enterprise value.

$53
$54
$55
$56
$57
$58
$59
$60
$61
PE Peer 1 Peer 2 Peer 3 Peer 4 Peer 5 Peer 6 Peer 7 Peer 8 Peer 9
2018
Unh
edge
d O
il P
rice
R
ealiz
atio
n ($
/Bo)
40%
45%
50%
55%
60%
65%
70%
75%
80%
$8
$9
$10
$11
$12
$13
$14
$15
$16
2015 2016 2017 2018
Operating C
ash Margin (%
)
Per
-Uni
t Ope
ratin
g C
osts
($/B
oe)
Per-Unit Operating Costs ($/Boe) Operating Cash Margin (%)
Leading Oil Price Realizations(2)
Robust Operating Cash Margin
4
2018 Highlights
(1) Operational day measured as days equipment is active and does not include mobilization or other idle time; (2) Company filings. PE realized prices shown net of gathering fees; (3) Peers include CDEV, CPE, CXO, FANG, HK, JAG, LPI,MTDR, and SM. Permian only oil realizations shown where applicable; (4) Per-unit operating costs include lease operating expenses, cash based general and administrative expenses (exclusive of stock-based compensation), andproduction and ad valorem taxes. Transportation and processing costs are excluded from 2018 to normalize for the period over period impacts of adopting ASC 606; (5) Operating cash margin percentage is a non-GAAP financial measure.For a reconciliation to the most directly comparable GAAP financial measure, please see the Supplementary Slides. Operating cash margin percentage calculated as operating cash margin per Boe divided by realized price per Boeexcluding hedges. Operating cash margin defined as realized price per Boe excluding hedges less per-unit operating costs including transportation and processing costs.
Enhanced Drilling and Completion Efficiency
► Expanded margins through marketing advantages, operating cost compression, and scale benefits
Proactive marketing strategy delivered flow assurance and strong realized pricing
Compressed operating costs, including company-record LOE per Boe and cash G&A per Boe
► Optimized acreage portfolio through integration efforts, accretive acreage trades, and opportunistic divestitures
► Set new efficiency thresholds, enabling more wells to be drilled and completed with less equipment
(4) (5)
0
200
400
600
800
1,000
1,200
1,400
Drilled Feet per OperationalDay per Rig
Stimulated Lateral Feet per OperationalDay per Crew
Feet
2017 2018
(1) (1)
Drilling efficiency improved 13% YoYCompletion efficiency improved 27% YoY
Parsley realized positive pricing uplift versus local Midland prices in 2018

Leverage legacy water infrastructure investments
Increase 3rd party water revenues and/or explore strategic alternatives
Exercise patience on incremental crude transport agreements
Deliver healthy long-term realized oil prices while limiting minimum volume commitments (MVCs)
Rate of Return (“ROR”)-driven approach to well selection
Improve capital efficiency by 8-10%+ YoY(1)
Accelerate timeline to self-funded growth
Outspend by less than $250 million in any oil price environment(2)
Further increase visibility on management and shareholder alignment
Addition of corporate returns metric to 2019 incentive plan
Defend and extend operational efficiency gains
Increase footage drilled/completed per rig/crew over 2018 levels
Work with high-performing service partners on pricing and contracting
Improve capital efficiency by 8-10%+ YoY(1)
Hedge to protect cash flow and balance sheet while retaining oil price upside
Outspend by less than $250 million in any oil price environment(2)
Sustain culture that promotes and prioritizes community stewardship
Collaborate with Permian Strategic Partnership; publish Sustainability Report by year-end 2019
5
Setting the Course for 2019 & Beyond
Discipline
Guiding Principles provided foundation…
Foresight
Stability
For an optimal2019 Action Plan
And Accountabilitywill help achieve goals and…
Compelling Long-Term Targets
Health, Safety, & Environmental
Excellence
Top-Tier Corporate Returns
Increasing Free
Cash Flow
Differentiated Cash Flow
Growth per Share
(1) Capital efficiency calculated as barrels of organic oil production added (Q41/Q40, adjusted for proved developed producing (“PDP”) oil base decline) per million dollars of development capital expenditures. Assumes 4Q18/4Q17 PDPoil base decline of ~45% and 4Q19/4Q18 PDP oil base decline of ~43%. Adjusted for divestitures closed in 4Q18; (2) Outspend is a non-GAAP financial measure and is defined as (cash flow from operations before changes inoperating assets and liabilities less development capital expenditures).

6
Organic Path to Self-Funded Growth
(1) Free cash flow is a non-GAAP financial measure and is defined as cash flow from operations before changes in operating assets and liabilities less development capital expenditures; (2) At NYMEX WTI price of $50-$55/Bbl in 2019;(3) Capital efficiency calculated as barrels of organic oil production added (Q41/Q40, adjusted for PDP oil base decline) per million dollars of development capital expenditures. Assumes 4Q18/4Q17 PDP oil base decline of ~45% and4Q19/4Q18 PDP oil base decline of ~43%. Adjusted for divestitures closed in 4Q18.
Productivity Improvements
► Optimizing completions
Increasing average
proppant loading
10-15% YoY
Wider spacing in
select targets
Compressed stage
follow-up trials
► Shifting mix to northern
Midland Basin
Accelerating Free Cash Flow by Prioritizing ROR Boosting Capital Efficiency
Expected Capex Savings
► Lower service and
equipment costs
► ~15% increase in
average lateral length
► ~75% of proppant
sourced from regional
sand mines
► Fewer new-build
facilities; more
add-ons
2019 Action Plan targets 8-10%+ YoY increase
in capital efficiency(3)
ROR
Increasing Density
(Wells / Section / Bench)
Free Cash Flow Timing(1)(2)
2019 Action Plan
2017-2018 Development Approach
4Q19 1H20
Inventory depth enables shift in development approach
ROR focus pulls forward timing of sustainable free cash flow(1)

7
Long Reinvestment Runway Provides Development Optionality
(1) Leasehold where Parsley can drill or propose drilling horizontal wells with lateral lengths equal to or greater than 1-mile; (2) As of 12/31/2018 pro forma for 2019 acreage expirations associated with 4Q18 abandonment costs;(3) Development inventory includes operated locations in Lower Spraberry, Wolfcamp A, Wolfcamp B, and Wolfcamp C zones in defined DSUs. As of 12/31/2018. Darker shade of blue represents actual 2018 development program;(4) Based on 2019E activity levels in each development area as of 2/21/2019; (5) Bottom of inventory range represents development of inventory in defined DSUs utilizing increased proppant and wider spacing configuration, consistentwith 2019 development approach and is comprised of 26 million gross (22 million net) lateral feet in proven formations (Lower Spraberry, Wolfcamp A, Wolfcamp B, and Wolfcamp C zones). Top of inventory range represents fulldevelopment inventory in defined DSUs and is comprised of 35 million gross (30 million net) lateral feet in proven formations.
MARTINHOWARD
MIDLAND
GLASSCOCK
REAGANUPTONREEVES
PECOS
CentralBasin
Platform
► Durable, geographically balanced inventory enables shift to a more ROR-focused development approach in 2019
Higher concentration of activity in Martin, Midland, and Upton Counties
Combination of upsized fracs and wider spacing in select areas
Over a decade of running room in each distinct core geography at 2019 development patterns
WARD
Development Inventory Drilled(1)
2019E Development Program(2)
Inventory Life at 2019E Pace(3)
ANDREWS
ECTOR
CRANE
2019 Action Plan targets 8-10%+ YoY increase in capital efficiency
Parsley Drill Spacing Unit (“DSU”)(1) Other Parsley Acreage(167,000 net acres)(2) (25,000 net acres)(2)
DSU Development Inventory Drilled(3)
2018 DSU Development Program(3)
2019E Development Program(4)
Remaining DSU Inventory Life at 2019E Pace(4)(5)
► Geographically balanced program
► Emphasis on resource discovery and delineation
2017-2018 Development Approach
HOWARD

$3.00
$3.50
$4.00
$4.50
$5.00
$5.50
1Q17 2Q17 3Q17 4Q17 1Q18 2Q18 3Q18 4Q18
Leas
e O
pera
ting
Exp
ense
($/B
oe)
Peer Average Parsley Energy
400
600
800
1,000
1,200
1,400
1H17 2H17 1H18 2H18
Feet
Stimulated Lateral Feet per Operational Day per Crew
Drilled Feet per Operational Day per Rig
8
Setting a More Efficient Leading Edge
(1) Operational day measured as days equipment is active. Does not include mobilization or other idle time; (2) Public fillings. Peers include CDEV, CPE, CXO, FANG, JAG, LPI, and PXD. Includes impacts of ASC 606 in 2018.
(1)
Stringent cost control aided by water infrastructure and the sale of
higher-cost vertical wells
► High-grade crews and equipment under reduced activity plan
12 high-spec AC rigs, all capable of drilling 2+ mile laterals
3-4 experienced, high-performing completions crews
► Bolster dedicated data analytics group
► Utilize technology and scale to maintain top-tier operating costs as well count grows
2019 Action Plan targets increased footage drilled/completed per rig/crew over 2018 levels
(1)
Recalibrating Operational Velocity Defend and Extend Efficiency Gains
Top-Tier Per-Unit LOE(2)

-
2,000
4,000
6,000
8,000
10,000
12,000
14,000
16,0000 1 2 3 4 5 6 7 8 9 10
Feet
Days
► Close collaboration and solid execution across multiple disciplines
► Showcases strong technical capability
Recently drilled one of the longest laterals in the Permian in only 25 days
► Encouraging recent results from long lateral wells
Three-well Massey pad completed with an upsized frac of 2,800 lbs/ft
Producing ~1,900 Boe/d (82% oil) after 50+ days
9
Operational Spotlight – Northern Midland County
Lease NameProject
Size Target Zone Productivity
Hogan 3 Wells LS, WCA,and WCB Average IP30 of 1,480 Boe/d (81% oil)
Ranchland 6 Wells LS and WCB Average IP24 of 1,267 Boe/d (81% oil); has not reached peak 30-day rate
Massey 3 Wells LS, WCA,and WCB
Average IP24 of 1,949 Boe/d (81% oil); has not reached peak 30-day rate
Efficient Long Lateral Development Lays Foundation For Success
Ramping Northern Midland County Development
REEVES Parsley AcreageMidland Focus Area
MARTIN
ECTORWINKLER
WARD
CRANE
PECOS
UPTON
MIDLAND
GLASSCOCK
REAGAN
HOWARD
CentralBasin
Platform
MidlandBasin
DelawareBasin
Three-mile lateral drilled in less than 9 days
Plans for increased Northern Midland County development highlight cohesion of operating team and top-tier rock quality

► Proactive build-out of water infrastructure network with nearly $150 million of cumulative capital investment
Saved $12 million on water sourcing, handling, and disposal costs in 4Q18
Permitted disposal capacity provides ample running room for future growth
Water A&D Activity Picking UpRobust Water Infrastructure Network
10
Operational Spotlight – Water Assets
Water Management Statistics Company-WideTotal Salt Water Disposal (“SWD”) Permitted Volume (Bbl/d)(1) 1.3 million
Percent of Produced Water Transported by Pipeline 96%
Surface Acres 38,000
► Reduce water infrastructure capital expenditures YoY
► Increase revenue from third party water volumes
► Review strategic alternatives
2019 Action Plan
Date Buyer Seller Description
1/3/2019 Private Company
Concho Resources
100% interest in 3 SWDs with 44 miles of gathering pipeline in Southern Delaware
12/20/2018 Private Company
NGL Energy Partners
9 SWDs and associate pipelines along with additional permits in Southern Delaware
11/8/2018 Western Gas Partners
Anadarko Petroleum
17 SWDs with 505 MBbls/d capacity and 620 miles of gathering pipelines in Delaware Basin
10/31/2018 Private Company
HalcónResources
All water facilities including gathering lines, SWDs, freshwater wells, and recycling facilities
Parsley Energy AcreageParsley Energy SWD(1)
Delaware Basin
1
2
3
1
2
4
4
DelawareBasin Midland
Basin
PECOS
REEVES
WARDMARTIN
HOWARD
GLASSCOCK
REAGANUPTON
MIDLAND
Midland Basin
3
4
33
(1) Includes existing and permitted SWDs.

2018A 2019E
Production
Net Oil Production (MBo/d) 69.5 80.0 - 85.0
Net Production (MBoe/d) 109.4 124.0 - 134.0
Capital Program
Total Development Expenditures ($MM) $1,762 $1,350 - $1,550
Drilling & Completion (% of Total) ~85% ~85%
Facilities, Infrastructure & Other (% of Total)
~15% ~15%
Activity
Gross Operated Horizontal POPs(1) 175 130 - 140
Midland Basin (% of Total) ~75% ~85%
Delaware Basin (% of Total) ~25% ~15%
Average Lateral Length ~9,100' 10,000’ - 10,500'
Gross Operated Lateral Footage (000's) ~1,595' 1,350' - 1,470'
Average Working Interest 97% ~90%
Units Costs
Lease Operating Expenses ($/Boe) $3.61 $3.50 - $4.50
Cash G&A ($/Boe) $3.28 $2.75 - $3.25
Production & Ad Valorem Taxes (% of Total Revenue)
6% 6% - 7%
11
Guidance Summary
Note: All guidance as of 2/21/2019. (1) Wells placed on production; (2) Capital efficiency calculated as barrels of organic oil production added (Q41/Q40, adjusted for PDP oil base decline) per million dollars of development capitalexpenditures. Assumes 4Q18/4Q17 PDP oil base decline of ~45% and 4Q19/4Q18 PDP oil base decline of ~43%. Adjusted for divestitures closed in 4Q18; (3) Adjusted for divestitures closed in 2018.
► Meaningful progress toward sustainable free cash flow
Outspend by less than $250 million in any commodity price environment
► 8-10%+ YoY improvement in capital efficiency(2)
► Preservation of operational efficiency gains at reduced activity level
12 high-spec rigs; 3-4 high-performing completions crews
► Disciplined organic oil growth
~20% YoY at midpoint(3)
2019 Guidance HighlightsBudgeting off of $50 WTI with priorities including:
► Expect net 1Q19 oil production of 75.5 - 78.0 MBo/d
1Q19 Guidance

0%
3%
6%
9%
12%
15%
18%
21%
$0
$200
$400
$600
$800
$1,000
$1,200
$1,400
PE Peer 1 Peer 2 Peer 3 Peer 4
Percent D
rawn on R
evolver
Liqu
idity
($M
M)
Cash on Hand Borrowing Base Availability Drawn on Revolver (%)
Favorable Debt Maturity Schedule
Advantaged Liquidity Profile(1)
12
Strong, Flexible Financial Position
$1,000
$1,300
$400 $650
$700 $450
2018 2019 2020 2021 2022 2023 2024 2025 2026 2027Revolving Credit Facility ($MM) Senior Notes ($MM)
Committed Amount
Remaining Borrowing
Base
1H25
2H25
$1,100
$2,300
(2)
►Peer-leading(1) liquidity of ~$1.2 billion(2)
►Healthy leverage ratio of 1.5x(3) LTM Adj. EBITDAX
(1) Permian SMID-Cap peers include CDEV, CPE, JAG, and LPI. Calculated as availability on committed portion of borrowing base plus cash and cash equivalents. Peer data obtained from 3Q18 filings and pro forma for subsequentdebt offerings, acquisitions, and divestitures; (2) As of 12/31/2018; (3) Leverage ratio calculated as net debt at 12/31/2018 divided by last twelve-month Adjusted EBITDAX. Adjusted EBITDAX is a non-GAAP financial measure. For areconciliation of the non-GAAP financial measure of adjusted EBITDAX to the most directly comparable GAAP financial measure, please see the Supplementary Slides.
► Favorable debt maturity schedule with earliest notes maturity in 2024
► Weighted average cost of debt has dropped ~200 bps since mid-2016
► In 4Q18, Moody’s upgraded Parsley’s Corporate Family Rating to Ba3 from B1
► Active hedge program helps protect cash flow and balance sheet while retaining oil price upside

(1) Organic reserves replacement ratio calculated as total 2018 reserve additions and revisions (technical and pricing) divided by total 2018 production. Excludes acquisitions and divestitures; (2) Drillbit F&D cost is calculated as total2018 capital expenditures (including Infrastructure and Other) divided by total 2018 reserves additions and revisions (technical and pricing). Excludes acquisitions and divestitures; (3) Proved Developed F&D (“PD F&D”) cost iscalculated as total 2018 capital expenditures (including Infrastructure and Other) divided by total 2018 proved developed reserves additions and revisions (technical and pricing). Excludes acquisitions and divestitures; (4) Recycle ratiocalculated as 4Q18 Operating cash margin divided by PD F&D ($11.63/Boe). Oil and Gas PD F&D cost (excluding water handling infrastructure spend) was $11.29/Boe; (5) Reserve summary as of 12/31/2018 and audited by NSAI.
Proved Reserves Summary(5)
Strong Growth in Proved Reserves
Consistently Efficient Reserve Growth
► YE18 total proved reserves up 25% YoY (oil up 18% YoY)
YE18 PD reserves up 49% YoY (oil up 43% YoY)
Three-year proved reserve CAGR of 61%
► Organic reserves replacement ratio of 406%(1)
► Drillbit F&D(2) of $10.87/Boe displays quality and depth of asset base
► PD F&D of $11.63/Boe(3) supports top-tier recycle ratio of 2.6x(4)
YE 2018Oil
(MMBo)Gas(Bcf)
NGL (MMBoe)
Total (MMBoe)
PDP 169.8 357.4 80.6 310.0
PNP 0.7 1.3 0.4 1.3
PUD 123.9 213.3 50.9 210.4
Total Proved 294.4 572.0 131.9 521.7
91 124
222
416
522
-
100
200
300
400
500
600
YE14 YE15 YE16 YE17 Production Revisions Divestitures Acq. Additions YE18
Pro
ved
Res
erve
s (M
MB
oe)
-40+2 -22 +6
+160
+25%
13

CLICK TO ADD TEXT
• SUPPLEMENTARY
SLIDESSUPPLEMENTARY SLIDES
Supplementary Slides

Recycle Ratio(2)(6)
15
High Rankings on Key Value Drivers
(1) Seaport Global Securities as of 3/19/19; (2) Seaport Global Securities as of 3/19/19. Recycle ratio is equal to 4Q18 operating margin divided by 2018 PD F&D. PE recycle ratio includes actual 2018 PD F&D/Boe of $11.63; (3)FactSet. Based on 4Q18 reported production; (4) DrillingInfo as of 3/19/2019; (5) Debt-adjusted per share (DAPS) production growth CAGR 2014 to 2018. Evercore ISI 3/19/19. Peers include APA, APC, CLR, COG, CPE, CXO, DVN,ECA, EOG, EQT, FANG, MRO, MTDR, NBL, OAS, PXD, QEP, WLL, WPX, and XEC; (6) Peers include APA, APC, AXAS, BBG, CDEV, CHK, CLR, COG, CPE, CRK, CXO, DVN, ECA, ECR, EOG, EQT, ESTE, FANG, HK, JAG, LPI,MRO, MTDR, NBL, OAS, OXY, PDCE, PXD, QEP, REI, SM, SN, WLL, WPX, and XEC; (7) Valuations from FactSet as of 3/19/19 and defined as Enterprise Value divided by consensus 2019 EBITDAX estimate.
Operators with Top Quartile Valuation(7)
Operating Margin(1)(6) % Oil(3)(6)
2014-2018DAPS Growth(5)
Horizontal Rigs In Lower-48(4)(6)
Rel
ativ
e R
ank
Asset Quality & Operational Efficiency
Commodity Weighting Scale & Growth
Parsley Energy
Average Rank of Operators with Top Quartile Valuation(7)
Average Rank of Operators with Bottom Quartile Valuation(7)
Operators with Interquartile Valuation(7)
Operators with Bottom Quartile Valuation(7)

MS Monitor peer results (Midland/Martin)
JM Monitor peer results (Midland/Martin)
LS Initial Parsley operated test (Upton) Increased proppant (Midland/Martin)
UWCA Initial test (Upton)
WCA Test lower proppant loadings Increased proppant (All Counties)
UWCBStacked configuration (Upton/Reagan); 330’ density tests (Reagan)
Stacked configuration (Upton/Reagan) and lower proppant tests
Stagger configuration (Upton/Reagan) and increased proppantLWCB
WCC Initial success (Reagan) Delineation work (Reagan/Glasscock) Defer activity (low Waha prices)
WCD Monitor peer results (Midland/Reagan)
3BS Initial test (Reeves) Monitor peer results
UWCA Initial test (Pecos) Stagger configuration
LWCA Increased proppant (Pecos)
UWCB Initial test (Pecos) Monitor peer results
Achieve scale
Large rig ramp and delineation-heavy development program
~8-16 across
Recapture operational efficiency
Steady development pace across geographically balanced program
Boost capital efficiency by 8-10%+ and accelerate progress to self-funded growth
Reduce activity, increase proppant, high-grade development approach
~8 across ~4-8 across
16
Optimizing the 2019 Plan
“Transformational” 2017 “Simplified” 2018 2019 Action Plan
Agenda
Program Details
Midland Basin
Well Selection
Delaware Basin
Well Selection
Spacing Pattern(Wells/Section/Bench)
“NPV-Focused” “ROR-Focused”
Primary Development Focus Secondary Development Focus (1-2 wells) Future Development Potential

17
Hedge Position
► Methodical, consistent approach
► Protect cash flow stream in weaker oil price environment
► Preserve meaningful upside exposure in stronger oil price environment
► Align hedges with regional price exposure
Hedge positions as of 3/22/2019. Prices represent the weighted average price of contracts scheduled for settlement during the period; (1) When the reference price (WTI, Midland, MEH, or Henry Hub) is above the long put price,Parsley receives the reference price. When the reference price is between the long put price and the short put price, Parsley receives the long put price. When the reference price is below the short put price, Parsley receives thereference price plus the difference between the short put price and the long put price; (2) Functions similarly to put spreads except when the reference price is at or above the call price, Parsley receives the call price; (3) When thereference price (WTI) is above the call price, Parsley receives the call price. When the reference price is below the long put price, Parsley receives the long put price. When the reference price is between the short call and long putprices, Parsley receives the reference price; (4) Premium realizations represent net premiums paid (including deferred premiums), which are recognized as a loss in the period of settlement; (5) Parsley receives the swap price.
Open Crude Oil Derivatives Positions1Q19 2Q19 3Q19 4Q19 1Q20 2Q20
OPTION CONTRACTS
CUSHING
Put Spreads – Cushing (MBbls/d)(1) 11.7 11.5 19.6 19.6 Long Put Price ($/Bbl) $51.43 $51.43 $59.79 $59.79
Short Put Price ($/Bbl) $44.29 $44.29 $49.79 $49.79
Three Way Collars - Cushing (MBbls/d)(2) 23.3 21.4 26.1 26.1 Short Call Price ($/Bbl) $70.48 $70.89 $72.69 $72.69
Long Put Price ($/Bbl) $48.21 $48.85 $51.88 $51.88
Short Put Price ($/Bbl) $40.71 $41.15 $42.81 $42.81
Collars – Cushing (MBbls/d)(3) 3.3 24.7 21.2 21.2 Short Call Price ($/Bbl) $56.30 $57.67 $58.26 $58.37
Long Put Price ($/Bbl) $52.70 $53.94 $54.50 $54.56
MIDLAND
Put Spreads – Midland (MBbls/d)(1) 11.7 14.8 4.9 4.9 Long Put Price ($/Bbl) $50.71 $50.56 $60.00 $60.00
Short Put Price ($/Bbl) $40.71 $40.56 $50.00 $50.00
Three Way Colloars - Midland (MBbls/d)(2) 4.9 4.9 Short Call Price ($/Bbl) $64.65 $64.65 Long Put Price ($/Bbl) $50.00 $50.00 Short Put Price ($/Bbl) $45.00 $45.00
MAGELLAN EAST HOUSTON ("MEH")
Put Spreads – MEH (MBbls/d)(1) 3.3 3.3 8.2 8.2 5.0 4.9 Long Put Price ($/Bbl) $70.00 $70.00 $64.00 $64.00 $70.00 $70.00
Short Put Price ($/Bbl) $60.00 $60.00 $54.00 $54.00 $60.00 $60.00
Three Way Colloars - MEH (MBbls/d)(2) 20.0 19.8 Short Call Price ($/Bbl) $74.50 $74.50
Long Put Price ($/Bbl) $59.58 $59.58
Short Put Price ($/Bbl) $49.60 $49.60
Total Option Contracts (MBbls/d) 53.3 75.7 84.9 84.9 25.0 24.7
Premium Realization ($MM)(4) ($6.3) ($10.2) ($14.5) ($14.5) ($5.2) ($5.2)
BASIS SWAPS
Midland-Cushing Basis Swaps (MBbls/d)(5) 31.7 25.4 35.9 35.9 5.0 4.9 Swap Price ($/Bbl) ($7.51) ($5.10) ($1.63) ($0.78) $0.25 $0.25
MEH-Cushing Basis Swaps (MBbls/d)(5) 2.2 2.1 2.1 2.1 Swap Price ($/Bbl) $5.10 $5.10 $5.10 $5.10
Open Natural Gas Derivatives Positions
1Q19 2Q19 3Q19 4Q19OPTION CONTRACTS
HENRY HUB
Three Way Collars - Henry Hub (MMBtu/d)(2) 33,333 32,967 32,609 32,609 Short Call Price ($/MMBtu) $3.93 $3.93 $3.93 $3.93
Long Put Price ($/MMBtu) $3.00 $3.00 $3.00 $3.00
Short Put Price ($/MMBtu) $2.50 $2.50 $2.50 $2.50
Total Option Contracts (MMBtu/d) 33,333 32,967 32,609 32,609
BASIS SWAPS
Waha-Henry Hub Basis Swaps (MMBtu/d)(5) 28,889 32,967 32,609 32,609 Swap Price ($/MMBtu) ($1.84) ($1.92) ($1.78) ($1.64)
Hedging Strategy
18
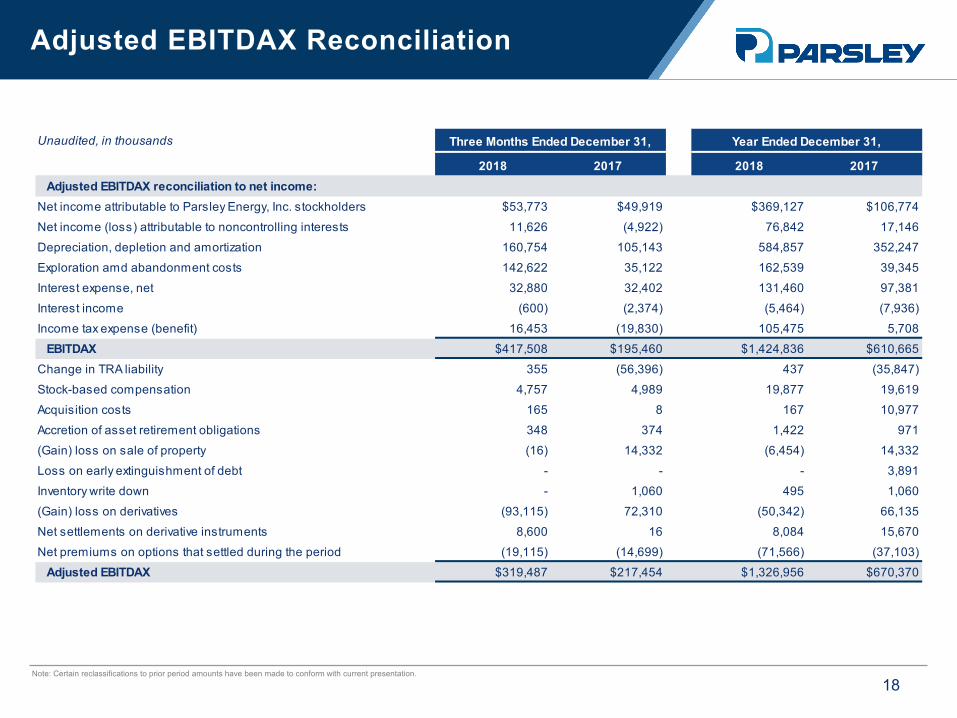
Adjusted EBITDAX Reconciliation
Note: Certain reclassifications to prior period amounts have been made to conform with current presentation.
Unaudited, in thousands
2018 2017 2018 2017Adjusted EBITDAX reconciliation to net income:
Net income attributable to Parsley Energy, Inc. stockholders $53,773 $49,919 $369,127 $106,774
Net income (loss) attributable to noncontrolling interests 11,626 (4,922) 76,842 17,146
Depreciation, depletion and amortization 160,754 105,143 584,857 352,247
Exploration amd abandonment costs 142,622 35,122 162,539 39,345
Interest expense, net 32,880 32,402 131,460 97,381
Interest income (600) (2,374) (5,464) (7,936)
Income tax expense (benefit) 16,453 (19,830) 105,475 5,708
EBITDAX $417,508 $195,460 $1,424,836 $610,665
Change in TRA liability 355 (56,396) 437 (35,847)
Stock-based compensation 4,757 4,989 19,877 19,619
Acquisition costs 165 8 167 10,977
Accretion of asset retirement obligations 348 374 1,422 971
(Gain) loss on sale of property (16) 14,332 (6,454) 14,332
Loss on early extinguishment of debt - - - 3,891
Inventory write down - 1,060 495 1,060
(Gain) loss on derivatives (93,115) 72,310 (50,342) 66,135
Net settlements on derivative instruments 8,600 16 8,084 15,670
Net premiums on options that settled during the period (19,115) (14,699) (71,566) (37,103)
Adjusted EBITDAX $319,487 $217,454 $1,326,956 $670,370
Three Months Ended December 31, Year Ended December 31,

19
Operating Cash Margin Reconciliation
Unaudited, in thousands
2018 2017 2018 2017
Net income attributable to Parsley Energy, Inc. stockholders $53,773 $49,919 $369,127 $106,774
Net income (loss) attributable to noncontrolling interests 11,626 (4,922) 76,842 17,146
Income tax expense (benefit) 16,453 (19,830) 105,475 5,708
Other revenues (3,768) (1,517) (11,684) (5,050)
Depreciation, depletion and amortization 160,754 105,143 584,857 352,247
Exploration and abandonment costs 142,622 35,122 162,539 39,345
Stock-based compensation 4,757 4,989 19,877 19,619
Acquisition costs 165 8 167 10,977
Accretion of asset retirement obligations 348 374 1,422 971
Other operating expenses 9,082 2,363 19,863 10,638
Interest expense, net 32,880 32,402 131,460 97,381
(Gain) loss on sale of property (16) 14,332 (6,454) 14,332
Prepayment premium on extinguishment of debt - - - 3,891
Derivative (gain) loss (93,115) 72,310 (50,342) 66,135
Change in TRA liability 355 (56,396) 437 (35,847)
Interest income (600) (2,374) (5,464) (7,936)
Other expense (income) 799 498 340 (783)
Operating cash margin $336,115 $232,421 $1,398,462 $695,548
Operating cash margin per Boe $30.48 $31.45 $35.02 $28.06
Average price per Boe, without realized derivatives $40.91 $41.94 $45.44 $38.80
Operating cash margin percentage 75% 75% 77% 72%
Three Months Ended December 31, Year Ended December 31,

20
Impact of ASC 606 Adoption – 4Q18
ASC 605 Adjustment ASC 606
Production revenues (in thousands):Oil sales $384,267 -- $384,267 Natural gas sales 6,843 1,919 8,762Natural gas liquids sales 48,662 9,421 58,083 Total production revenues 439,772 11,340 451,112Operating expensesTransportation and processing costs -- 11,340 11,340Production revenues less transportation and processing costs $439,772 -- $439,772
Net income attributable to Parsley, Inc. stockholders (in thousands) $53,773 -- $53,773
Production:Oil (MBbls) 7,087 -- 7,087
Natural gas (MMcf) 8,432 1,264 9,696
Natural gas liquids (MBbls) 2,027 296 2,323
Total (MBoe) 10,519 507 11,026
Average daily production volume:Oil (Bbls) 77,033 -- 77,033Natural gas (Mcf) 91,652 13,739 105,391Natural gas liquids (Bbls) 22,033 3,217 25,250Total (Boe) 114,337 5,511 119,848
Certain unit costs (per Boe):Lease operating expenses $3.78 ($0.17) $3.61 Transportation and processing costs -- $1.03 $1.03 Production and ad valorem taxes $2.49 ($0.11) $2.38 Depreciation, depletion and amortization $15.28 ($0.70) $14.58 General and administrative expenses (including stock-based compensation) $4.03 ($0.18) $3.85 General and administrative expenses (cash based) $3.58 ($0.16) $3.42
Three Months Ended December 31, 2018

21
Impact of ASC 606 Adoption – FY18
ASC 605 Adjustment ASC 606
Production revenues (in thousands):Oil sales $1,536,244 -- $1,536,244 Natural gas sales 45,032 6,199 51,231Natural gas liquids sales 200,898 26,374 227,272 Total production revenues 1,782,174 32,573 1,814,747Operating expensesTransportation and processing costs -- 32,573 32,573Production revenues less transportation and processing costs $1,782,174 -- $1,782,174
Net income attributable to Parsley, Inc. stockholders (in thousands) $369,127 -- $369,127
Production:Oil (MBbls) 25,356 -- 25,356
Natural gas (MMcf) 33,492 3,873 37,365
Natural gas liquids (MBbls) 7,356 997 8,353
Total (MBoe) 38,293 1,644 39,937
Average daily production volume:Oil (Bbls) 69,468 -- 69,468Natural gas (Mcf) 91,759 10,611 102,370Natural gas liquids (Bbls) 20,153 2,732 22,885Total (Boe) 104,912 4,504 109,416
Certain unit costs (per Boe):Lease operating expenses $3.77 ($0.16) $3.61 Transportation and processing costs -- $0.82 $0.82 Production and ad valorem taxes $2.83 ($0.12) $2.71 Depreciation, depletion and amortization $15.27 ($0.63) $14.64 General and administrative expenses (including stock-based compensation) $3.94 ($0.16) $3.78 General and administrative expenses (cash based) $3.42 ($0.14) $3.28
Year Ended December 31, 2018

22
Reserves Disclosure
Oil & Gas ReservesThis presentation provides disclosure of Parsley’s proved reserves, which are those quantities of oil and gas, which, by analysis of geoscience and engineering data, can be estimated withreasonable certainty to be economically producible—from a given date forward, from known reservoirs, and under existing economic conditions (using unweighted average 12-month first day ofthe month prices), operating methods, and government regulations—prior to the time at which contracts providing the right to operate expire, unless evidence indicates that renewal is reasonablycertain, regardless of whether deterministic or probabilistic methods are used for the estimation.
In this presentation, proved reserves attributable to Parsley as of 12/31/2018 are estimated utilizing SEC reserve recognition standards and pricing assumptions based on an unweighted first dayof the month average 12-month WTI Phillips 66 posted price, net of differentials, of $61.88/Bbl for oil and $28.05/Bbl for NGLs and a WAHA spot natural gas price, net of differential, of$1.64/MMBtu for natural gas. References to our estimated proved reserves as of 12/31/2018 are derived from our proved reserve report audited by Netherland, Sewell & Associates, Inc. (“NSAI”).
We may use the term “expected ultimate recoveries” (“EURs”) or other descriptions of volumes of reserves, which terms include quantities of oil and gas that may not meet the SEC’s definitions ofproved, probable and possible reserves, and which the SEC's guidelines strictly prohibit Parsley from including in filings with the SEC. Unless otherwise stated in this presentation, such estimateshave been prepared internally by our engineers and management without review by independent engineers. These estimates are by their nature more speculative than estimates of proved,probable and possible reserves and accordingly are subject to substantially greater risk of being actually realized, particularly in areas or zones where there has been limited or no drilling history.We include these estimates to demonstrate what we believe to be the potential for future drilling and production by the Company. Actual locations drilled and quantities that may be ultimatelyrecovered from our properties will differ substantially. In addition, we have made no commitment to drill all of the drilling locations we identify. Ultimate recoveries will be dependent uponnumerous factors including actual encountered geological conditions, the impact of future oil and gas pricing, exploration and development costs, and our future drilling decisions and budgetsbased upon our future evaluation of risk, returns and the availability of capital and, in many areas, the outcome of negotiation of drilling arrangements with holders of adjacent or fractional interestleases. Our estimates may change significantly as development of our properties provides additional data and therefore actual quantities that may ultimately be recovered will likely differ fromthese estimates. Our related expectations for future periods are dependent upon many assumptions, including estimates of production decline rates from existing wells, the undertaking andoutcome of future drilling activity and activity that may be affected by significant commodity price declines or drilling cost increases.
Unless otherwise noted, Net Present Value (“NPV”) estimates are before taxes and assume the Company generated EUR and decline curve estimates based on Company drilling and completioncost estimates that do not include facilities, land, seismic, general and administrative (“G&A”) or other corporate level costs.
Organic Reserves Replacement RatioParsley uses the organic reserves replacement ratio as an indicator of the Company's ability to replace the reserves that it has developed and to increase its reserves over time. The ratio is not arepresentation of value creation and has a number of limitations that should be considered. For example, the ratio does not incorporate the costs or timing of developing future reserves. Theorganic reserves replacement ratio is calculated as total reserve additions and revisions (technical and pricing), divided by total production. The ratio calculation excludes acquisitions anddivestitures.
Proved Developed Finding and Development (“F&D”) CostsParsley uses proved developed F&D, oil and gas proved developed F&D, and drillbit F&D costs as an indicator of capital efficiency, in that it measures Parsley’s costs to add proved developed reserves on a per Boe basis. Proved developed F&D is calculated as total 2018 capital expenditures (including Infrastructure and Other) divided by total 2018 proved developed reserves additions and revisions (technical and pricing). Drillbit F&D is calculated as total 2018 capital expenditures (including Infrastructure and Other), divided by total 2018 reserves additions and revisions (technical and pricing). Both calculations exclude acquisitions and divestitures and are subject to limitations, including the uncertainty of future costs to develop the company’s reserves. Oil and gas PD F&D cost is calculated by dividing annual development capital expenditures by year-over-year proved developed producing and proved developed non-producing reserve additions, and includes reclassifications and technical and pricing revisions, but excludes acquisitions and divestitures.
Recycle RatioParsley uses recycle ratio as a measure of its capital efficiency based on its finding and development costs. Recycle ratio is calculated as operating cash margin divided by all costs PD F&D.