investor overview | leggett & platt
TRANSCRIPT

UNITED STATESSECURITIES AND EXCHANGE COMMISSION
Washington, D.C. 20549
Form 10-Q
(Mark One)x QUARTERLY REPORT PURSUANT TO SECTION 13 OR 15(d) OF THE SECURITIES EXCHANGE ACT
OF 1934
For the quarterly period ended June 30, 2012
OR ¨ TRANSITION REPORT PURSUANT TO SECTION 13 OR 15(d) OF THE SECURITIES EXCHANGE ACT
OF 1934
for the transition period from to
Commission File Number 001-07845
LEGGETT & PLATT, INCORPORATED(Exact name of registrant as specified in its charter)
Missouri 44-0324630(State or other jurisdiction of
incorporation or organization) (I.R.S. Employer
Identification No.)
No. 1 Leggett RoadCarthage, Missouri 64836
(Address of principal executive offices) (Zip Code)
Registrant’s telephone number, including area code (417) 358-8131
Indicate by check mark whether the registrant (1) has filed all reports required to be filed by Section 13 or 15(d) of the Securities Exchange Act of 1934
during the preceding 12 months (or for such shorter period that the registrant was required to file such reports), and (2) has been subject to such filingrequirements for the past 90 days. Yes x No ¨
Indicate by check mark whether the registrant has submitted electronically and posted on its corporate Web site, if any, every Interactive Data Filerequired to be submitted and posted pursuant to Rule 405 of Regulation S-T (§ 232.405 of this chapter) during the preceding 12 months (or for such shorterperiod that the registrant was required to submit and post such files). Yes x No ¨
Indicate by check mark whether the registrant is a large accelerated filer, an accelerated filer, a non-accelerated filer, or a smaller reporting company. Seethe definitions of “large accelerated filer,” “accelerated filer” and “smaller reporting company” in Rule 12b-2 of the Exchange Act. Large accelerated filer x Accelerated filer ¨
Non-accelerated filer ¨ (Do not check if a smaller reporting company) Smaller reporting company ¨
Indicate by check mark whether the registrant is a shell company (as defined in Rule 12b-2 of the Exchange Act). Yes ¨ No x
Common stock outstanding as of August 2, 2012: 140,594,658

PART I. FINANCIAL INFORMATION
Item 1. Financial Statements
LEGGETT & PLATT, INCORPORATEDCONSOLIDATED CONDENSED BALANCE SHEETS
(Unaudited)
(Amounts in millions) June 30,
2012 December 31,
2011 CURRENT ASSETS
Cash and cash equivalents $ 254.5 $ 236.3 Accounts and other receivables, net 557.6 503.6 Inventories
Finished goods 292.7 261.3 Work in process 55.8 41.5 Raw materials and supplies 252.7 223.9 LIFO reserve (83.6) (85.7)
Total inventories, net 517.6 441.0 Other current assets 53.7 43.1
Total current assets 1,383.4 1,224.0 PROPERTY, PLANT AND EQUIPMENT—AT COST
Machinery and equipment 1,130.4 1,120.1 Buildings and other 614.1 608.5 Land 45.9 45.2
Total property, plant and equipment 1,790.4 1,773.8 Less accumulated depreciation 1,209.3 1,193.2
Net property, plant and equipment 581.1 580.6 OTHER ASSETS
Goodwill 976.6 926.6 Other intangibles, less accumulated amortization of $118.8 and $106.2 as of June 30, 2012 and December 31, 2011,
respectively 209.1 116.6 Sundry 73.2 67.3
Total other assets 1,258.9 1,110.5 TOTAL ASSETS $ 3,223.4 $2,915.1 CURRENT LIABILITIES
Current maturities of long-term debt $ 201.9 $ 2.5 Accounts payable 320.2 256.6 Accrued expenses 223.3 209.6 Other current liabilities 118.7 117.3
Total current liabilities 864.1 586.0 LONG-TERM LIABILITIES
Long-term debt 821.0 833.3 Other long-term liabilities 130.9 130.3 Deferred income taxes 60.4 57.8
Total long-term liabilities 1,012.3 1,021.4 COMMITMENTS AND CONTINGENCIES EQUITY
Common stock 2.0 2.0 Additional contributed capital 455.2 456.9 Retained earnings 2,055.6 2,027.4 Accumulated other comprehensive income 55.4 65.2 Treasury stock (1,232.6) (1,254.3)
Total Leggett & Platt, Inc. equity 1,335.6 1,297.2 Noncontrolling interest 11.4 10.5
Total equity 1,347.0 1,307.7 TOTAL LIABILITIES AND EQUITY $ 3,223.4 $2,915.1
See accompanying notes to consolidated condensed financial statements.
2

LEGGETT & PLATT, INCORPORATEDCONSOLIDATED CONDENSED STATEMENTS OF OPERATIONS
(Unaudited)
Six Months Ended
June 30, Three Months Ended
June 30, (Amounts in millions, except per share data) 2012 2011 2012 2011 Net sales $1,885.6 $ 1,841.0 $ 938.8 $945.2 Cost of goods sold 1,520.1 1,489.1 751.6 763.3
Gross profit 365.5 351.9 187.2 181.9 Selling and administrative expenses 190.4 193.9 92.5 98.1 Amortization of intangibles 12.6 9.7 6.4 4.9 Other expense (income), net 1.7 (5.0) 2.1 (.2)
Earnings from continuing operations before interest and income taxes 160.8 153.3 86.2 79.1 Interest expense 19.1 18.9 9.6 9.4 Interest income 3.3 3.8 1.6 2.3
Earnings from continuing operations before income taxes 145.0 138.2 78.2 72.0 Income taxes 37.5 36.4 15.2 16.5
Earnings from continuing operations 107.5 101.8 63.0 55.5 Earnings from discontinued operations (net of tax) 2.4 — 2.4 —
Net earnings 109.9 101.8 65.4 55.5 (Earnings) loss attributable to noncontrolling interest, net of tax (1.0) (2.1) (.5) (.8)
Net earnings attributable to Leggett & Platt, Inc. common shareholders $ 108.9 $ 99.7 $ 64.9 $ 54.7 Earnings per share from continuing operations attributable to Leggett & Platt, Inc. common shareholders
Basic $ .74 $ .68 $ .43 $ .38 Diluted $ .73 $ .67 $ .43 $ .37
Earnings per share from discontinued operations attributable to Leggett & Platt, Inc. commonshareholders
Basic $ .02 $ .00 $ .02 $ .00 Diluted $ .02 $ .00 $ .02 $ .00
Net Earnings per share attributable to Leggett & Platt, Inc. common shareholders Basic $ .76 $ .68 $ .45 $ .38 Diluted $ .75 $ .67 $ .45 $ .37
Cash dividends declared per share $ .56 $ .54 $ .28 $ .27 Average shares outstanding
Basic 143.8 147.4 144.1 145.6 Diluted 145.3 149.1 145.4 147.4
See accompanying notes to consolidated condensed financial statements.
3

LEGGETT & PLATT, INCORPORATEDConsolidated Statements of Comprehensive Income
(Unaudited)
Six Months Ended
June 30, Three Months Ended
June 30, (Amounts in millions) 2012 2011 2012 2011 Net earnings $109.9 $ 101.8 $ 65.4 $55.5 Other comprehensive income (loss), net of tax:
Foreign currency translation adjustments (7.4) 36.8 (23.6) 15.3 Cash flow hedges (4.3) (3.7) (7.2) (4.5) Defined benefit pension plans 1.8 .8 1.0 .5
Other comprehensive income (loss) (9.9) 33.9 (29.8) 11.3 Comprehensive income 100.0 135.7 35.6 66.8
Less: comprehensive (income) loss attributable to noncontrolling interest (.9) (2.5) (.4) (1.0) Comprehensive income attributable to Leggett & Platt, Inc. $ 99.1 $ 133.2 $ 35.2 $ 65.8
See accompanying notes to consolidated condensed financial statements.
4

LEGGETT & PLATT, INCORPORATEDCONSOLIDATED CONDENSED STATEMENTS OF CASH FLOWS
(Unaudited)
Six Months Ended
June 30, (Amounts in millions) 2012 2011 OPERATING ACTIVITIES Net earnings $ 109.9 $ 101.8 Adjustments to reconcile net earnings to net cash provided by operating activities:
Depreciation 45.1 50.6 Amortization 12.6 9.7 Provision for losses on accounts and notes receivable 3.5 5.4 Writedown of inventory 5.7 5.3 Asset impairment charges 1.0 3.4 Net gain from sales of assets and businesses (2.6) (8.8) Deferred income tax (income) expense (5.2) 7.4 Stock-based compensation 18.3 21.1 Other 4.7 (2.9) Other changes, excluding effects from acquisitions and divestitures:
Increase in accounts and other receivables (45.1) (82.4) Increase in inventories (66.0) (71.0) Increase in other current assets (3.9) (1.8) Increase in accounts payable 65.1 52.0 Increase in accrued expenses and other current liabilities 3.2 11.2
NET CASH PROVIDED BY OPERATING ACTIVITIES 146.3 101.0 INVESTING ACTIVITIES
Additions to property, plant and equipment (37.3) (37.8) Purchases of companies, net of cash acquired (189.8) (4.7) Proceeds from sales of assets and businesses 7.4 18.6 Maturity of short-term investments — 22.8 Other (5.8) (1.9)
NET CASH USED FOR INVESTING ACTIVITIES (225.5) (3.0) FINANCING ACTIVITIES
Additions to debt 216.1 98.4 Payments on debt (36.4) (14.3) Dividends paid (78.2) (78.8) Issuances of common stock 4.4 15.7 Purchases of common stock (7.2) (172.8) Excess tax benefits from stock-based compensation 1.3 5.8
NET CASH PROVIDED BY (USED FOR) FINANCING ACTIVITIES 100.0 (146.0) EFFECT OF EXCHANGE RATE CHANGES ON CASH (2.6) 6.8
INCREASE (DECREASE) IN CASH AND CASH EQUIVALENTS 18.2 (41.2) CASH AND CASH EQUIVALENTS—January 1, 236.3 244.5 CASH AND CASH EQUIVALENTS—June 30, $ 254.5 $ 203.3
See accompanying notes to consolidated condensed financial statements.
5

LEGGETT & PLATT, INCORPORATEDNOTES TO CONSOLIDATED CONDENSED FINANCIAL STATEMENTS
(Unaudited)
(Amounts in millions, except per share data)1. INTERIM PRESENTATION
The interim financial statements of Leggett & Platt, Incorporated (“we”, “us” or “our”) included herein have not been audited by an independentregistered public accounting firm. The statements include all adjustments, including normal recurring accruals, which management considers necessary for afair presentation of our financial position and operating results for the periods presented. We have prepared the statements pursuant to the rules and regulationsof the Securities and Exchange Commission. Accordingly, certain information and footnote disclosures normally included in financial statements prepared inconformity with generally accepted accounting principles have been condensed or omitted pursuant to such rules and regulations. The operating results forinterim periods are not necessarily indicative of results to be expected for an entire year.
The December 31, 2011 financial position data included herein was derived from the audited consolidated financial statements included in Form 10-K,but does not include all disclosures required by accounting principles generally accepted in the United States of America. For further information, refer to thefinancial statements and footnotes included in our annual report on Form 10-K for the year ended December 31, 2011.
2. NEW ACCOUNTING GUIDANCEThe Financial Accounting Standards Board (FASB) has issued accounting guidance effective for current and future periods (that we have not yet
adopted), but we do not believe any of the new guidance will have a material impact on our current or future financial statements.
3. INVENTORIESAbout 60% of our inventories are valued using the Last-In, First-Out (LIFO) cost method and the remainder using the First-In, First-Out (FIFO) cost
method.
We calculate our LIFO reserve (the excess of FIFO cost over LIFO cost) on an annual basis. During interim periods, we estimate the current year annualchange in the LIFO reserve (i.e., the annual LIFO expense or benefit) and allocate that change ratably to the four quarters. Because accurately predictinginventory prices for the year is difficult, the change in the LIFO reserve for the full year could be significantly different from the amount currently estimated.In addition, a variation in expected ending inventory levels could also impact total change in the LIFO reserve for the year. Any change in the annual LIFOestimate will be reflected in the remaining quarters.
The following table contains the LIFO (income) expense included in earnings for each of the periods presented.
Six Months Ended
June 30, Three Months Ended
June 30, 2012 2011 2012 2011 LIFO (income) expense $ (2.1) $ 9.0 $ (2.6) $ 3.5
4. SEGMENT INFORMATIONWe have four operating segments that are generally focused on broad end-user markets for our diversified products.
• Residential Furnishings—components for bedding, furniture and other furnishings, as well as related consumer products
• Commercial Fixturing & Components—retail store fixtures, displays and components for office and institutional furnishings
• Industrial Materials—drawn steel wire, specialty wire products, titanium and nickel tubing for the aerospace industry and welded steel tubing
sold to trade customers as well as other Leggett segments
• Specialized Products—automotive seating components, specialized machinery and equipment, and commercial vehicle interiors
Our reportable segments are the same as our operating segments, which also correspond with our management organizational structure. Each reportablesegment has a senior operating vice-president that reports to the chief operating decision maker. The operating results and financial information reportedthrough the segment structure are regularly reviewed and used by the chief operating decision maker to evaluate segment performance, allocate overall resourcesand determine management incentive compensation.
6

LEGGETT & PLATT, INCORPORATEDNOTES TO CONSOLIDATED CONDENSED FINANCIAL STATEMENTS—(Continued)
(Unaudited) 4. SEGMENT INFORMATION (continued)
Separately, we also utilize a role-based approach (Grow, Core, Fix or Divest) as a supplemental management tool to ensure capital (which is a subset ofthe overall resources referred to above) is efficiently allocated within the reportable segment structure.
The accounting principles used in the preparation of the segment information are the same as those used for the consolidated financial statements, exceptthat the segment assets and income reflect the FIFO basis of accounting for inventory. Certain inventories are accounted for using the LIFO basis in theconsolidated financial statements. We evaluate performance based on earnings from operations before interest and income taxes (EBIT). Intersegment sales aremade primarily at prices that approximate market-based selling prices. Centrally incurred costs are allocated to the segments based on estimates of servicesused by the segment. Certain of our general and administrative costs and miscellaneous corporate income and expenses are allocated to the segments based onsales. These allocated corporate costs include depreciation and other costs and income related to assets that are not allocated or otherwise included in thesegment assets.
A summary of segment results from continuing operations are shown in the following tables.
External
Sales
Inter-Segment
Sales TotalSales EBIT
Six Months ended June 30, 2012: Residential Furnishings $ 963.0 $ 4.3 $ 967.3 $ 80.2 Commercial Fixturing & Components 226.9 2.2 229.1 10.3 Industrial Materials 338.0 135.7 473.7 29.6 Specialized Products 357.7 23.5 381.2 43.8 Intersegment eliminations (5.2) Change in LIFO reserve 2.1
$1,885.6 $165.7 $ 2,051.3 $160.8 Six Months ended June 30, 2011: Residential Furnishings $ 922.8 $ 4.6 $ 927.4 $ 83.3 Commercial Fixturing & Components 265.1 2.7 267.8 15.7 Industrial Materials 311.8 127.6 439.4 27.6 Specialized Products 341.3 20.1 361.4 39.5 Intersegment eliminations (3.8) Change in LIFO reserve (9.0)
$ 1,841.0 $ 155.0 $1,996.0 $ 153.3 Three Months ended June 30, 2012: Residential Furnishings $ 472.4 $ 2.3 $ 474.7 $ 40.0 Commercial Fixturing & Components 113.7 1.2 114.9 3.1 Industrial Materials 170.5 65.5 236.0 17.8 Specialized Products 182.2 13.7 195.9 25.9 Intersegment eliminations (3.2) Change in LIFO reserve 2.6
$ 938.8 $ 82.7 $ 1,021.5 $ 86.2 Three Months ended June 30 , 2011: Residential Furnishings $ 465.4 $ 2.3 $ 467.7 $ 41.2 Commercial Fixturing & Components 137.3 1.5 138.8 7.5 Industrial Materials 166.3 62.8 229.1 13.6 Specialized Products 176.2 10.3 186.5 21.4 Intersegment eliminations (1.1) Change in LIFO reserve (3.5)
$ 945.2 $ 76.9 $ 1,022.1 $ 79.1
7

LEGGETT & PLATT, INCORPORATEDNOTES TO CONSOLIDATED CONDENSED FINANCIAL STATEMENTS—(Continued)
(Unaudited) 4. SEGMENT INFORMATION (continued)
Average assets for our segments are shown in the table below and reflect the basis for return measures used by management to evaluate segmentperformance. These segment totals include working capital (all current assets and current liabilities) plus net property, plant and equipment. Segment assetsfor all years are reflected at their estimated average for the periods presented.
June 30,
2012 December 31,
2011 Residential Furnishings $ 611.6 $ 624.1 Commercial Fixturing & Components 156.2 176.1 Industrial Materials 236.4 218.1 Specialized Products 227.7 226.6 Average current liabilities included in segment numbers above 445.2 417.7 Assets held for sale 19.5 19.6 Unallocated assets (1) 1,462.5 1,328.3 Difference between average assets and period-end balance sheet 64.3 (95.4)
Total assets $ 3,223.4 $2,915.1 (1) Primarily goodwill, other intangibles, cash and notes receivable
5. DISCONTINUED OPERATIONSIn March 2007, we sold our Prime Foam Products Unit and reported the business as discontinued operations. This business was previously part of the
Residential Furnishings segment and produced foam primarily used for cushioning by upholstered furniture and bedding manufacturers. During the secondquarter of 2012, we received a litigation settlement related to this business as follows:
Six Months Ended
June 30, Three Months Ended
June 30, 2012 2011 2012 2011 Earnings before interest and income taxes:
Residential Furnishings—Prime Foam Products Unit $ 3.9 $ — $ 3.9 $ — Income tax expense (1.5) — (1.5) — Earnings from discontinued operations (net of tax) $ 2.4 $ — $ 2.4 $ —
6. RESTRUCTURINGWe have historically implemented various cost reduction initiatives to improve our operating cost structures. These cost initiatives have, among other
actions, included workforce reductions and the closure or consolidation of certain operations.
In December 2011, we adopted the 2011 Restructuring Plan, which included the closure of four underperforming manufacturing facilities. We incurred a$37 pre-tax (largely non-cash) charge in the 4 quarter of 2011 primarily related to this plan, which included $31 of long-lived asset impairments and $6 ofother restructuring-related costs. Approximately $1.5 in restructuring costs, and approximately $1 of long-lived asset impairments during the first six monthsof 2012 were related to this plan. We expect total 2012 restructuring and impairment costs for this plan to approximate $3, with plant closures complete by theend of the year.
Our total restructuring-related costs (excluding long-lived asset impairments) for the periods presented were comprised of:
Six Months Ended
June 30, Three Months Ended
June 30, 2012 2011 2012 2011 Charged to other expense (income), net:
Severance and other restructuring costs $ 4.4 $ 2.2 $ 2.9 $ 1.0 (Gain) loss from sale of assets (1.7) (.1) .1 (.2)
Total restructuring and restructuring-related costs $ 2.7 $ 2.1 $ 3.0 $ .8
8
th

LEGGETT & PLATT, INCORPORATEDNOTES TO CONSOLIDATED CONDENSED FINANCIAL STATEMENTS—(Continued)
(Unaudited) 7. EARNINGS PER SHARE
Basic and diluted earnings per share were calculated as follows:
Six Months Ended
June 30, Three Months Ended
June 30, 2012 2011 2012 2011 Earnings: Earnings from continuing operations $ 107.5 $ 101.8 $ 63.0 $ 55.5 (Earnings) loss attributable to noncontrolling interest, net of tax (1.0) (2.1) (.5) (.8) Net earnings from continuing operations attributable to Leggett & Platt, Inc. common
shareholders $106.5 $ 99.7 $ 62.5 $ 54.7 Earnings from discontinued operations, net of tax 2.4 — 2.4 — Net earnings attributable to Leggett & Platt, Inc. common shareholders $ 108.9 $ 99.7 $ 64.9 $ 54.7 Weighted average number of shares: Weighted average number of common shares used in basic EPS 143.8 147.4 144.1 145.6 Additional dilutive shares principally from the assumed exercise of outstanding stock
options 1.5 1.7 1.3 1.8 Weighted average number of common shares and dilutive potential common shares used
in diluted EPS 145.3 149.1 145.4 147.4 Basic and Diluted EPS: Basic EPS attributable to Leggett & Platt, Inc. common shareholders
Continuing operations $ .74 $ .68 $ .43 $ .38 Discontinued operations .02 — .02 —
Basic EPS attributable to Leggett & Platt, Inc. common shareholders $ .76 $ .68 $ .45 $ .38 Diluted EPS attributable to Leggett & Platt, Inc. common shareholders
Continuing operations $ .73 $ .67 $ .43 $ .37 Discontinued operations .02 — .02 —
Diluted EPS attributable to Leggett & Platt, Inc. common shareholders $ .75 $ .67 $ .45 $ .37 Other information: Shares issuable under employee and non-employee stock options 11.5 11.6 11.5 11.6 Anti-dilutive shares excluded from diluted EPS computation 3.0 2.0 3.3 1.7
9

LEGGETT & PLATT, INCORPORATEDNOTES TO CONSOLIDATED CONDENSED FINANCIAL STATEMENTS—(Continued)
(Unaudited) 8. ACCOUNTS AND OTHER RECEIVABLES
Accounts and other receivables consisted of the following:
June 30, 2012 December 31, 2011 Current Long-term Current Long-term Trade accounts receivable $ 530.9 $ — $ 461.3 $ — Notes receivable:
Customer-related .7 2.8 2.9 2.4 Notes received as partial payment for divestitures .5 10.2 3.5 10.4 Other 3.5 1.8 3.4 2.3
Income tax receivables 6.8 — 29.1 — Other receivables 34.8 — 27.7 —
Total accounts and other receivables 577.2 14.8 527.9 15.1 Allowance for doubtful accounts: Trade accounts receivable (19.2) — (21.9) — Notes receivable:
Customer-related — (.7) — (.7) Notes received as partial payment for divestitures — (.8) (2.3) (.4) Other (.4) (.6) (.1) (.6)
Total allowance for doubtful accounts (19.6) (2.1) (24.3) (1.7) Total net receivables $557.6 $ 12.7 $ 503.6 $ 13.4
Notes are evaluated individually for impairment, and we had no significant impaired notes for the periods presented.
Our investment in notes that were past due more than 90 days was less than $2.0 at June 30, 2012 and less than $5.0 at December 31, 2011, of whichapproximately $1.0 and $4.0 had been placed on non-accrual status, respectively.
Activity related to the allowance for doubtful accounts is reflected below:
Balance atDecember 31,
2011 2012
Charges
2012Charge-
offs,net of
recoveries
Balance atJune 30,
2012 Trade accounts receivable $ 21.9 $ 2.5 $ (5.2) $ 19.2 Notes receivable:
Customer-related .7 — — .7 Notes received as partial payment for divestitures 2.7 .7 (2.6) .8 Other .7 .3 — 1.0
$ 26.0 $ 3.5 $ (7.8) $ 21.7
10

LEGGETT & PLATT, INCORPORATEDNOTES TO CONSOLIDATED CONDENSED FINANCIAL STATEMENTS—(Continued)
(Unaudited) 9. STOCK-BASED COMPENSATION
The following table recaps the components of stock-based compensation for each period presented:
Six Months Ended
June 30, Three Months Ended
June 30, 2012 2011 2012 2011 Stock-based compensation expense:
Amortization of the grant date fair value of stock options (1) $ 3.2 $ 3.6 $ .9 $ .8 Stock-based retirement plans contributions (2) 3.3 3.5 1.4 1.4 Discounts on various stock awards:
Deferred Stock Compensation Program .6 .8 .1 .2 Stock-based retirement plans .7 1.2 .2 .3 Discount Stock Plan .5 .4 .3 .2
Performance Stock Unit awards (3) 3.3 3.6 1.6 1.8 Restricted Stock Unit awards 1.4 1.1 .6 .6 Other, primarily non-employee directors restricted stock .4 .6 .2 .2
Total stock-based compensation expense 13.4 14.8 5.3 5.5 Employee contributions for above stock plans 4.9 6.3 2.5 2.3
Total stock-based compensation $18.3 $21.1 $ 7.8 $ 7.8 Recognized tax benefits on stock-based compensation expense $ 5.1 $ 5.6 $ 2.0 $ 2.1
(1) Stock Option Grants
Our most significant stock options are granted annually on a discretionary basis to a broad group of employees.
We offer two different option choice programs. One group of employees is offered the choice to receive stock options or to receive a cash alternative beingequal to approximately one-half of the Black-Scholes value of the option grant foregone. Another group of employees, generally higher level employees, areoffered a choice between stock options or restricted stock units (RSUs), on a ratio of four options foregone for every one RSU offered. The RSUs vest in one-third increments at 12 months, 24 months and 36 months after the date of grant.
The following table summarizes fair values calculated (and assumptions utilized) using the Black-Scholes option pricing model for all options grantedin the periods presented:
Six Months Ended
June 30, 2012 2011 Options granted (in millions) .9 1.0 Aggregate grant date fair value $ 4.0 $ 4.9 Weighted-average per share grant date fair value $4.68 $4.91 Risk-free interest rate 1.9% 2.7% Expected life in years 7.2 7.1 Expected volatility (over expected life) 34.4% 33.3% Expected dividend yield (over expected life) 4.8% 4.7% Cash payments to employees elected in lieu of options $ .3 $ .3
11

LEGGETT & PLATT, INCORPORATEDNOTES TO CONSOLIDATED CONDENSED FINANCIAL STATEMENTS—(Continued)
(Unaudited) 9. STOCK-BASED COMPENSATION (continued) (2) Stock-Based Retirement Plans
We have two stock-based retirement plans: the tax-qualified Stock Bonus Plan (SBP) for non-highly compensated employees, and the non-qualifiedExecutive Stock Unit Program (ESUP) for highly compensated employees. We make matching contributions to both plans. In addition to the automatic 50%match, we will make another matching contribution of up to 50% of the employee’s contributions for the year if certain profitability levels as defined in theSBP and the ESUP are obtained.
SBP participants may direct their contributions into Company stock or several other investment options. Company matching contributions are investedin Company stock until the participant is vested. After vesting, the participant may re-direct company matching contributions into any of the investmentsoffered under the plan.
Since April 1, 2011, ESUP participant contributions are credited to a diversified investment account consisting of various mutual funds and retirementtarget funds selected by the participant. At every bi-weekly contribution date, we add a premium contribution equal to 17.65% of the participant’s contributionto the diversified investment accounts. Participants may change investment elections in the diversified investment accounts, but cannot purchase Companycommon stock or stock units in these accounts. All company matching contributions are credited to participant’s accounts in the form of Company stockunits. Participants may not diversify this portion of their accounts.
We have purchased investments intended to mirror the diversified investments selected by the participants that are a component of “Sundry” long-termassets in the accompanying Consolidated Condensed Balance Sheet. Investment experience of the actual funds, whether positive or negative, are eventuallypaid out in cash. All amounts deferred under this program are unfunded, unsecured obligations of the Company and are presented as a component of the“Other long-term liabilities” in the accompanying Consolidated Condensed Balance Sheet. Both the asset and liabilities associated with this program arepresented in Note 13 and are adjusted to fair value at each reporting period. (3) Performance Stock Unit Awards
We also grant Performance Stock Unit (PSU) awards in the first quarter of each year to selected officers and other key managers. These awards containthe following conditions:
• A service requirement—Awards generally “cliff” vest three years following the grant date; and
• A market condition—Awards are based on our Total Shareholder Return [TSR = (Change in Stock Price + Dividends) / Beginning Stock Price]as compared to the TSR of a group of peer companies. The peer group consists of all the companies in the Industrial, Materials and ConsumerDiscretionary sectors of the S&P 500 and S&P Midcap 400 (approximately 320 companies). Participants will earn from 0% to 175% of the baseaward depending upon how our Total Shareholder Return ranks within the peer group at the end of the 3-year performance period.
Grant date fair values are calculated using a Monte Carlo simulation of stock and volatility data for Leggett and each of the comparator companies andare based upon assumptions similar to those used for stock options. Grant date fair values are amortized using the straight-line method over the three-yearvesting period.
Below is a summary of the number of shares and related grant date fair value of PSU’s for the periods presented:
Six Months Ended
June 30, 2012 2011 Total shares base award (in millions) .3 .3 Grant date per share fair value $23.79 $25.41
The three-year performance cycle of the 2009 award was completed on December 31, 2011. Our TSR performance, relative to the peer group, ranked at51 percentile; accordingly, participants earned 73.6% of the base award and .4 million shares were distributed in January 2012.
12
st

LEGGETT & PLATT, INCORPORATEDNOTES TO CONSOLIDATED CONDENSED FINANCIAL STATEMENTS—(Continued)
(Unaudited) 9. STOCK-BASED COMPENSATION (continued)
Beginning with the 2010 award (that will be settled in 2013), thirty-five percent (35%) of awards will be paid out in cash. We intend to pay out theremaining sixty-five percent (65%) in shares of our common stock, although we reserve the right to pay up to one hundred percent (100%) in cash. The 35%portion is recorded as a liability and is adjusted to fair value at each reporting period.
June 30,
2012 December 31,
2011 PSU liability to be settled in cash $ 3.1 $ 3.1
10. ACQUISITIONS
On January 12, 2012, we acquired 100% of Western Pneumatic Tube Holding, LLC (Western). Western is a leading provider of integral components forcritical aircraft systems, and forms the new Aerospace Products business unit within the Tubing Group. Western specializes in fabricating thin-walled, largediameter, welded tubing and specialty formed products from titanium, nickel and other specialty materials for leading aerospace suppliers and OEMs. Thecash purchase price of $188 was financed with proceeds from the sale of commercial paper notes under our existing commercial paper program.
The following table summarizes the estimated fair values of the assets acquired and liabilities assumed at the date of acquisition during the periodspresented, and any additional consideration paid for prior years’ acquisitions:
Six Months Ended
June 30, 2012 2011 Accounts receivable $ 8.8 $— Inventory 18.9 .7 Property, plant and equipment 12.0 .9 Goodwill 54.3 1.4 Other intangible assets (average weighted amortization period of 16.5 years) 102.4 .1 Accounts payable and accrued liabilities (6.8) (.3) Other assets and liabilities, net .1 — Additional consideration for prior year’s acquisitions .1 1.9 Net cash consideration $189.8 $ 4.7
The following table presents acquisitions for the periods presented. We are finalizing all of the information required to complete the purchase priceallocations related to the most recent acquisitions and do not anticipate material modifications. Preliminary information used in the fair value assessments inthe Western acquisition is primarily related to certain accruals and contingencies and the tax basis of assets acquired.
Six Months Ended
Number ofAcquisitions
Segment
Product
Goodwill
In Year of
Acquisition
Adjustmentsto Prior
YearAcquisitions Total
Expected toProvideIncome
TaxBenefit
June 30, 2012
2
IndustrialMaterials
Tubing for theaerospace industry;
Tube fabrication
$ 54.3
$ —
$54.3
$ 54.3
June 30, 2011
1
ResidentialFurnishings
Furniture Hardware
$ 1.4
$ —
$ 1.4
$ 1.4
Factors that contributed to a purchase price resulting in the recognition of goodwill included Western’s competitive position, and its fit with our strategyto seek businesses with secure, leading positions in growing, profitable, attractive markets.
The results of operations of the above acquired companies have been included in the consolidated financial statements since the dates of acquisition.While we expect future activity to be incremental to the Industrial Materials segment, the unaudited pro forma consolidated net sales, net earnings and earningsper share as though the 2012 acquisitions had occurred on January 1 of the prior period presented is not materially different from the amounts reflected in theaccompanying financial statements.
13

LEGGETT & PLATT, INCORPORATEDNOTES TO CONSOLIDATED CONDENSED FINANCIAL STATEMENTS—(Continued)
(Unaudited) 10. ACQUISITIONS (continued)
Certain of our acquisition agreements provide for additional consideration to be paid in cash, at a later date and, are recorded as a liability at theacquisition date. At June 30, 2012, there is no substantial remaining consideration payable.
11. EMPLOYEE BENEFIT PLANS
The following table provides interim information as to our domestic and foreign defined benefit pension plans. Expected 2012 employer contributions arenot significantly different than the $7 previously reported at December 31, 2011.
Six Months Ended
June 30, Three Months Ended
June 30, 2012 2011 2012 2011 Components of net pension expense
Service cost $ 1.4 $ 1.2 $ .7 $ .6 Interest cost 6.3 6.7 3.1 3.3 Expected return on plan assets (7.3) (6.7) (3.6) (3.3) Recognized net actuarial loss 3.1 2.0 1.5 1.0
Net pension expense $ 3.5 $ 3.2 $ 1.7 $ 1.6
14

LEGGETT & PLATT, INCORPORATEDNOTES TO CONSOLIDATED CONDENSED FINANCIAL STATEMENTS—(Continued)
(Unaudited) 12. STATEMENT OF CHANGES IN EQUITY AND ACCUMULATED OTHER COMPREHENSIVE INCOME Six Months Ended June 30, 2012
Total
Equity RetainedEarnings
CommonStock &
AdditionalContributed
Capital Treasury
Stock Noncontrolling
Interest
AccumulatedOther
ComprehensiveIncome
Beginning balance, January 1, 2012 $1,307.7 $ 2,027.4 $ 458.9 $ (1,254.3) $ 10.5 $ 65.2 Net earnings 109.9 109.9 — — — — (Earnings) loss attributable to noncontrolling interest, net
of tax — (1.0) — — 1.0 — Dividends declared (78.6) (80.7) 2.1 — — — Treasury stock purchased (9.0) — — (9.0) — — Treasury stock issued 11.4 — (19.3) 30.7 — — Foreign currency translation adjustments (7.4) — — — (.1) (7.3) Cash flow hedges, net of tax (4.3) — — — — (4.3) Defined benefit pension plans, net of tax 1.8 — — — — 1.8 Stock options and benefit plan transactions, net of tax 15.5 — 15.5 — — —
Ending balance, June 30, 2012 $ 1,347.0 $2,055.6 $ 457.2 $(1,232.6) $ 11.4 $ 55.4 Six Months Ended June 30, 2011
Total
Equity RetainedEarnings
CommonStock &
AdditionalContributed
Capital Treasury
Stock Noncontrolling
Interest
AccumulatedOther
ComprehensiveIncome
Beginning balance, January 1, 2011 $1,524.4 $ 2,033.3 $ 465.2 $ (1,093.0) $ 17.1 $ 101.8 Net earnings 101.8 101.8 — — — — (Earnings) loss attributable to noncontrolling interest, net
of tax — (2.1) — — 2.1 — Dividends declared (77.4) (79.3) 1.9 — — — Treasury stock purchased (177.5) — — (177.5) — — Treasury stock issued 26.1 — (29.9) 56.0 — — Foreign currency translation adjustments 36.8 — — — .4 36.4 Cash flow hedges, net of tax (3.7) — — — — (3.7) Defined benefit pension plans, net of tax .8 — — — — .8 Stock options and benefit plan transactions, net of tax 23.4 — 23.4 — — —
Ending balance, June 30, 2011 $1,454.7 $2,053.7 $ 460.6 $(1,214.5) $ 19.6 $ 135.3
15

LEGGETT & PLATT, INCORPORATEDNOTES TO CONSOLIDATED CONDENSED FINANCIAL STATEMENTS—(Continued)
(Unaudited) 12. STATEMENT OF CHANGES IN EQUITY AND ACCUMULATED OTHER COMPREHENSIVE INCOME (continued)
The following tables set forth the components of and changes in each component of accumulated other comprehensive income (loss) for each of theperiods presented:
ForeignCurrency
TranslationAdjustments
CashFlow
Hedges
DefinedBenefitPensionPlans
AccumulatedOther
ComprehensiveIncome (Loss)
Balance January 1, 2012 $ 147.6 $(21.5) $ (60.9) $ 65.2 Period change—Gross (7.4) (7.0) 2.9 (11.5) Period change—Attributable to noncontrolling interest .1 — — .1
Period change—Income tax effect — 2.7 (1.1) 1.6 Balance June 30, 2012 $ 140.3 $(25.8) $(59.1) $ 55.4 Balance January 1, 2011 $ 151.1 $ 1.4 $ (50.7) $ 101.8
Period change—Gross 36.8 (5.9) 1.3 32.2 Period change—Attributable to noncontrolling interest (.4) — — (.4)
Period change—Income tax effect — 2.2 (.5) 1.7 Balance June 30, 2011 $ 187.5 $ (2.3) $ (49.9) $ 135.3
13. FAIR VALUE
Fair value measurements are established using a three level valuation hierarchy that prioritizes the inputs to valuation techniques used to measure fairvalue into the following categories:
• Level 1: Quoted prices for identical assets or liabilities in active markets.
• Level 2: Inputs other than quoted prices included in Level 1 that are observable for the asset or liability either directly or indirectly. Short-terminvestments in this category are valued using discounted cash flow techniques with all significant inputs derived from or corroborated byobservable market data. Derivative assets and liabilities in this category are valued using models that consider various assumptions andinformation from market-corroborated sources. The models used are primarily industry-standard models that consider items such as quotedprices, market interest rate curves applicable to the instruments being valued as of the end of each period, discounted cash flows, volatilityfactors, current market and contractual prices for the underlying instruments, as well as other relevant economic measures. Substantially all ofthese assumptions are observable in the marketplace, can be derived from observable data or are supported by observable levels at whichtransactions are executed in the marketplace.
• Level 3: Unobservable inputs that are not corroborated by market data.
Items measured at fair value on a recurring basis
As of June 30, 2012 Level 1 Level 2 Level 3 Total Assets:
Cash equivalents: Bank time deposits with original maturities of three months or less $— $112.5 $— $112.5
Derivative assets — .5 — .5 Diversified investments associated with the ESUP 5.2 — — 5.2
Total assets $ 5.2 $ 113.0 $— $ 118.2 Liabilities:
Derivative liabilities $ 1.5 $ 42.8 $— $ 44.3 Liabilities associated with the ESUP 5.2 — — 5.2
Total liabilities $ 6.7 $ 42.8 $— $ 49.5
16
LEGGETT & PLATT, INCORPORATEDNOTES TO CONSOLIDATED CONDENSED FINANCIAL STATEMENTS—(Continued)
(Unaudited) 13. FAIR VALUE (continued)
As of December 31, 2011 Level 1 Level 2 Level 3 Total Assets:
Cash equivalents: Bank time deposits with original maturities of three months or less $— $111.8 $— $ 111.8
Derivative assets — 3.2 — 3.2 Diversified investments associated with the ESUP 2.5 — — 2.5
Total assets $ 2.5 $115.0 $— $117.5 Liabilities:
Derivative liabilities $ 2.2 $ 34.8 $— $ 37.0 Liabilities associated with the ESUP 2.5 — — 2.5
Total liabilities $ 4.7 $ 34.8 $— $ 39.5
The fair value for fixed rate debt (Level 2) was greater than its $730.0 carrying value by $47.2 at June 30, 2012 and greater than its $730.0 carryingvalue by $29.2 at December 31, 2011. We value this debt using discounted cash flow and secondary market rates provided by Bloomberg.
Items measured at fair value on a non-recurring basisThe primary areas in which we use fair value measurements of non-financial assets and liabilities are allocating purchase price to the assets and
liabilities of acquired companies and evaluating long-term assets for potential impairment.
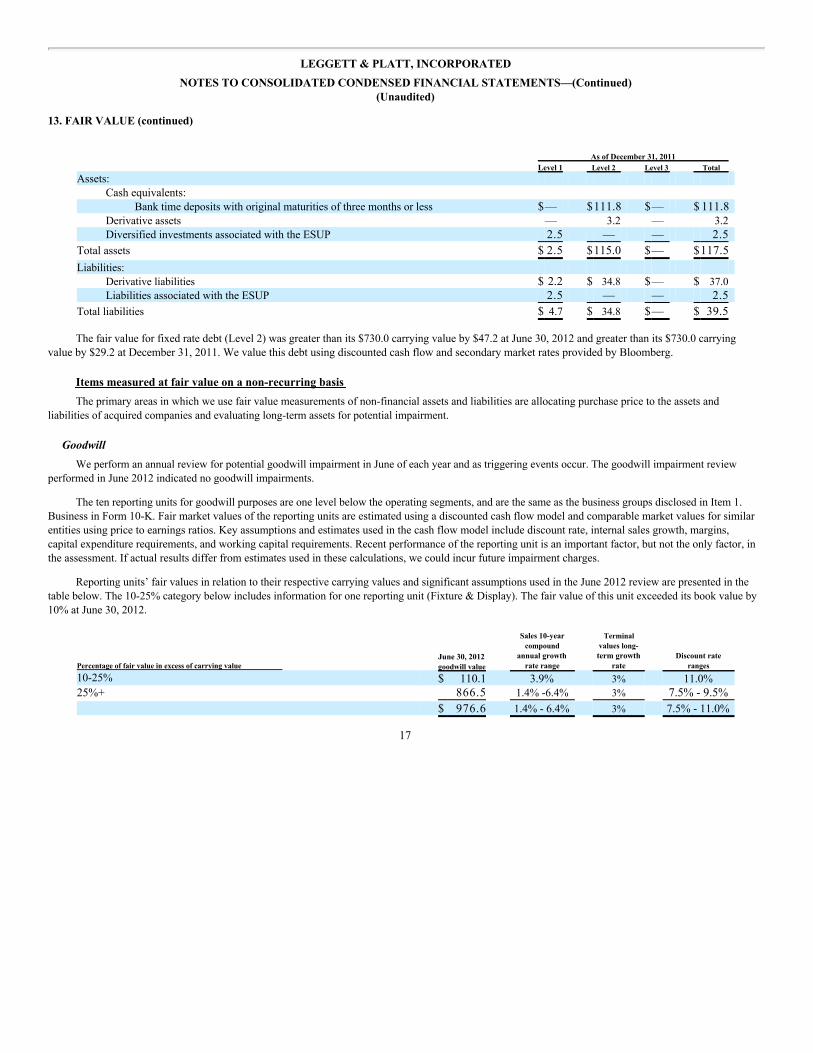
GoodwillWe perform an annual review for potential goodwill impairment in June of each year and as triggering events occur. The goodwill impairment review
performed in June 2012 indicated no goodwill impairments.
The ten reporting units for goodwill purposes are one level below the operating segments, and are the same as the business groups disclosed in Item 1.Business in Form 10-K. Fair market values of the reporting units are estimated using a discounted cash flow model and comparable market values for similarentities using price to earnings ratios. Key assumptions and estimates used in the cash flow model include discount rate, internal sales growth, margins,capital expenditure requirements, and working capital requirements. Recent performance of the reporting unit is an important factor, but not the only factor, inthe assessment. If actual results differ from estimates used in these calculations, we could incur future impairment charges.
Reporting units’ fair values in relation to their respective carrying values and significant assumptions used in the June 2012 review are presented in thetable below. The 10-25% category below includes information for one reporting unit (Fixture & Display). The fair value of this unit exceeded its book value by10% at June 30, 2012.
Percentage of fair value in excess of carrying value June 30, 2012goodwill value
Sales 10-yearcompound
annual growthrate range
Terminalvalues long-term growth
rate Discount rate
ranges
10-25% $ 110.1 3.9% 3% 11.0%25%+ 866.5 1.4% -6.4% 3% 7.5% - 9.5%
$ 976.6 1.4% - 6.4% 3% 7.5% - 11.0%
17

LEGGETT & PLATT, INCORPORATEDNOTES TO CONSOLIDATED CONDENSED FINANCIAL STATEMENTS—(Continued)
(Unaudited) 13. FAIR VALUE (continued)
Fixed AssetsWe test long-lived assets for recoverability at year-end and whenever events or changes in circumstances indicate the carrying value may not be
recoverable. The table below summarizes fixed asset impairments for the periods presented.
Six Months Ended
June 30, Three Months Ended
June 30, 2012 2011 2012 2011 Total asset impairments $ 1.0 $ 3.4 $ .9 $ .4
2012 impairments costs were primarily associated with the 2011 Restructuring Plan as discussed in Note 6. Fair value and the resulting impairmentcharges were based primarily upon offers from potential buyers or third party estimates of fair value less selling costs.
14. RISK MANAGEMENT AND DERIVATIVE FINANCIAL INSTRUMENTSRisk Management Strategy & Objectives
We are subject to market and financial risks related to interest rates, foreign currency, and commodities. In the normal course of business, we utilizederivative instruments (individually or in combinations) to manage these risks. We seek to use derivative contracts that qualify for hedge accountingtreatment; however, some instruments may not qualify for this treatment. It is our policy not to speculate using derivative instruments.
We have recorded the following assets and liabilities representing the fair value for our most significant derivative financial instruments. The fair valuesof the derivatives reflect the change in the market value of the derivative from the date of the trade execution, and do not consider the offsetting underlyinghedged item.
Total USDEquivalentNotionalAmount
As of June 30, 2012
Assets Liabilities
OtherCurrent
Assets Sundry Other Current
Liabilities Other Long-Term
Liabilities Derivatives designated as hedging instruments Cash flow hedges:
Commodity hedges $ 4.4 $ — $— $ 1.3 $ .2 Interest rate hedges 200.0 — — 40.6 — Currency Hedges:
- Future USD sales of Canadian subsidiaries 29.9 .1 — .2 — - Future USD cost of goods sold of Canadian subsidiaries 4.1 .2 — — — - Future USD cost of goods sold of European subsidiary 6.3 .2 — — —
Total cash flow hedges .5 — 42.1 .2 Fair value hedges:
USD inter-company note receivable on a Canadian subsidiary 11.5 — — .2 — USD inter-company note receivables on a Swiss subsidiary 14.5 — — 1.8 —
Total fair value hedges — — 2.0 — $ .5 $— $ 44.1 $ .2
18

LEGGETT & PLATT, INCORPORATEDNOTES TO CONSOLIDATED CONDENSED FINANCIAL STATEMENTS—(Continued)
(Unaudited) 14. RISK MANAGEMENT AND DERIVATIVE FINANCIAL INSTRUMENTS (continued) Total USD
EquivalentNotionalAmount
As of December 31, 2011
Assets Liabilities
Other Current
Assets Sundry Other Current
Liabilities Other Long-Term
Liabilities Derivatives designated as hedging instruments Cash flow hedges:
Commodity hedges $ 6.2 $ — $— $ 1.9 $ .3 Interest rate hedges 200.0 — — 32.4 — Currency hedges—Future USD cost of goods sold of
Canadian subsidiaries 7.6 .5 — — — -Future USD sales of a Chinese subsidiary 44.1 .1 — — — -Future MXP cost of goods sold of a US
subsidiary 1.1 — — .1 — -Future EUR cost of goods sold of a US
branch 1.6 — — .1 — -Future USD sales of Canadian subsidiaries 33.4 .1 — .5 —
Total cash flow hedges .7 — 35.0 .3 Fair value hedges:
USD inter-company note receivable on a Canadiansubsidiary 11.5 — — .1 —
USD inter-company note receivable on a Switzerlandsubsidiary 14.5 — — 1.6 —
Total fair value hedges — — 1.7 — Derivatives not designated as hedging instruments Hedge of EUR inter-company note receivable from a European
subsidiary 28.0 2.5 — — — $ 3.2 $— $ 36.7 $ .3
Cash Flow HedgesDerivative financial instruments that we use to hedge forecasted transactions and anticipated cash flows are as follows:
• Commodity Cash Flow Hedges—The commodity cash flow hedges manage natural gas commodity price risk. All commodity hedges at June 30,
2012 had maturities of less than two years. We are no longer hedging our commodity price risk so these hedges will continue to get smaller until allof the current hedges expire.
• Interest Rate Cash Flow Hedges—In anticipation of long-term debt maturing in April 2013, we entered into forward starting interest swaps in2010. The swap contracts manage benchmark interest rate risk associated with $200 of planned debt issuance in August 2012. The swaps have aweighted average interest rate of 4.0% and hedge the benchmark rate of an expected issuance of $200 of debt. The credit spread over thebenchmark bonds will continue to fluctuate until the time of issuance.
• Currency Cash Flow Hedges—The currency hedges manage risk associated with exchange rate volatility of various foreign currencies. The
currency cash flow hedges outstanding at June 30, 2012 had maturity dates within two years.
The effective changes in fair value of unexpired contracts are recorded in accumulated other comprehensive income and reclassified to income or expensein the period in which earnings are impacted and are presented as operating cash flows when the contracts are settled.
19

LEGGETT & PLATT, INCORPORATEDNOTES TO CONSOLIDATED CONDENSED FINANCIAL STATEMENTS—(Continued)
(Unaudited) 14. RISK MANAGEMENT AND DERIVATIVE FINANCIAL INSTRUMENTS (continued)
Fair Value HedgesOur fair value hedges manage foreign currency risk associated with subsidiaries’ inter-company assets and liabilities. Hedges designated as fair value
hedges recognize gain or loss currently in earnings and are presented as operating cash flows when the contracts are settled. These fair value hedges generallyhave a maturity date within one year.
Hedge EffectivenessWe have deemed all ineffectiveness to be immaterial, and as a result, have not recorded any amounts for ineffectiveness. If a hedge was not highly
effective, the portion of the change in fair value considered to be ineffective would be recognized immediately in the consolidated condensed statements ofoperations.
Derivatives Not Qualifying for Hedge Accounting TreatmentAt December 31, 2011, we had derivative transactions that did not qualify for hedge accounting treatment. Gains or losses on these transactions are
recorded directly to income and expense in the period impacted, and offset the majority of gains and losses on the underlying Euro inter-company debt.
The following table sets forth the pre-tax gains (losses) from continuing operations for our hedging activities for the years presented. This scheduleincludes reclassifications from accumulated other comprehensive income as well as derivative settlements recorded directly to income or expense.
Income StatementCaption
Amount of Gain (Loss)Recorded in IncomeSix Months Ended
June 30
Amount of Gain (Loss)Recorded in Income
Three Months EndedJune 30
2012 2011 2012 2011 Derivatives designated as hedging instruments Commodity cash flow hedges Cost of goods sold $ (1.5) $ (.6) $ (.7) $ (.2) Currency cash flow hedges Net Sales .2 .2 .1 .1 Currency cash flow hedges Cost of goods sold .2 — .2 — Currency cash flow hedges Other expense (income), net (.1) — — —
Total cash flow hedges (1.2) (.4) (.4) (.1) Fair value hedges Other expense (income), net — (.2) (.6) (.2) Derivatives not designated as hedging instruments Hedge of EUR cash—UK subsidiary Other expense (income), net — (.1) — (.1) Hedge of EUR inter-company note receivable- European subsidiary Other expense (income), net .8 (2.1) 1.4 (.6) Hedge of EUR inter-company note receivable- European subsidiary Interest expense (.1) (.1) (.1) — Total derivative instruments $ (.5) $ (2.9) $ .3 $ (1.0)
15. CONTINGENCIESWe are a defendant in various proceedings involving employment, antitrust, intellectual property, environmental, taxation and other laws. When it is
probable, in management’s judgment, that we may incur monetary damages or other costs resulting from these proceedings or other claims, and we canreasonably estimate the amounts, we record appropriate liabilities in the financial statements and make charges against earnings. For all periods presented, wehave recorded no material charges against earnings, and the total liabilities recorded are not material to our financial position.
20

LEGGETT & PLATT, INCORPORATEDNOTES TO CONSOLIDATED CONDENSED FINANCIAL STATEMENTS—(Continued)
(Unaudited) 15. CONTINGENCIES (continued) Shareholder Derivative Lawsuit
On August 10, 2010, a shareholder derivative suit was filed by the New England Carpenters Pension Fund in the Circuit Court of Jasper County,Missouri as Case No. 10AO-CC00284 (“2010 Suit”). The 2010 Suit was substantially similar to a prior suit filed by the same plaintiff, in the same court, onFebruary 5, 2009 (“2009 Suit”). The 2009 Suit was dismissed without prejudice based on the plaintiff’s failure to make demand on our Board andshareholders. As before, the plaintiff did not make such demand. On April 6, 2011, the 2010 Suit was dismissed without prejudice. On May 12, 2011, theplaintiff filed an appeal to the Missouri Court of Appeals. On January 17, 2012 plaintiff filed its appellate brief, and we filed our brief on March 21, 2012.Oral argument is expected to occur in the fall of 2012.
The 2010 Suit was purportedly brought on our behalf, naming us as a nominal defendant, and certain current and former officers and directors asindividual defendants including David S. Haffner, Karl G. Glassman, Matthew C. Flanigan, Ernest C. Jett, Harry M. Cornell, Jr., Felix E. Wright, RobertTed Enloe, III, Richard T. Fisher, Judy C. Odom, Maurice E. Purnell, Jr., Ralph W. Clark and Michael A. Glauber.
The plaintiff alleged, among other things, that the individual defendants: breached their fiduciary duties; backdated and received backdated stockoptions violating our stock plans; caused or allowed us to issue false and misleading financial statements and proxy statements; sold our stock whilepossessing material non-public information; committed gross mismanagement; wasted corporate assets; committed fraud; violated the Missouri SecuritiesAct; and were unjustly enriched.
The plaintiff was seeking, among other things: unspecified monetary damages against the individual defendants; certain equitable and other reliefrelating to the profits from the alleged improper conduct; the adoption of certain corporate governance proposals; the imposition of a constructive trust over thedefendants’ stock options and proceeds; punitive damages; the rescission of certain unexercised options; and the reimbursement of litigation costs. Theplaintiff was not seeking monetary relief from us. We have director and officer liability insurance in force subject to customary limits and exclusions.
We and the individual defendants filed motions to dismiss the 2010 Suit in late October 2010, asserting: the plaintiff failed to make demand on ourBoard and shareholders as required by Missouri law, and, consistent with the Court’s ruling in the 2009 Suit, this failure to make demand should not beexcused; the plaintiff is not a representative shareholder; the 2010 Suit was based on a statistical analysis of stock option grants and our stock prices that webelieve was flawed; the plaintiff failed to state a substantive claim; the common law fraud claim was not pled with sufficient particularity; and the statute oflimitations has expired on the fraud claim and all the alleged challenged grants except the December 30, 2005 grant. As to this grant, the motions to dismissadvised the Court that it was made under our Deferred Compensation Program, which (i) provided that options would be dated on the last business day ofDecember, and (ii) was filed with the SEC on December 2, 2005 setting out the pricing mechanism well before the grant date.
We do not expect that the outcome of this matter will have a material adverse effect on our financial condition, operating cash flows or results ofoperations.
Antitrust LawsuitsBeginning in August 2010, a series of civil lawsuits was initiated in several U.S. federal courts and in Canada against over 20 defendants alleging that
competitors of our carpet underlay business unit and other manufacturers of polyurethane foam products had engaged in price fixing in violation of U.S. andCanadian antitrust laws.
A number of these lawsuits have been voluntarily dismissed without prejudice. Of the U.S. cases remaining, we have been named as a defendant in(a) three direct purchaser class action cases (the first on November 15, 2010) and a consolidated amended class action complaint filed on February 28, 2011on behalf of a class of all direct purchasers of polyurethane foam products; (b) an indirect purchaser class consolidated amended complaint filed onMarch 21, 2011 (although the underlying lawsuits do not name us as a defendant); and an indirect purchaser class action case filed on May 23, 2011; and(c) 29 individual direct purchaser cases, (i) one filed March 22, 2011, (ii) another amended August 24, 2011 to remove class allegations, (iii) one amendedAugust 25, 2011 to name us as a defendant, (iv) three others filed October 31, 2011, (v) one filed November 4, 2011, (vi) three filed December 6, 19 and 30,respectively, (vii) one filed January 27, 2012, (viii) five filed March 19, 2012, (ix) one amended March 30, 2012 to name us as a defendant, (x) one filedApril 27, 2012, (xi) three filed April 30, 2012, (xii) two filed May 11, 2012, (xiii) one filed May 17, 2012, (xiv) four filed May 25, 2012, and (xv) one filedJune 12, 2012. All of the pending U.S. cases in which we have been named as a defendant, have been filed in or have been transferred to the U.S. DistrictCourt for the Northern District of Ohio under the name In re: Polyurethane Foam Antitrust Litigation, Case No. 1:10-MD-02196.
21

LEGGETT & PLATT, INCORPORATEDNOTES TO CONSOLIDATED CONDENSED FINANCIAL STATEMENTS—(Continued)
(Unaudited) 15. CONTINGENCIES (continued)
In the U.S. actions, the plaintiffs, on behalf of themselves and/or a class of purchasers, seek three times the amount of unspecified damages allegedlysuffered as a result of alleged overcharges in the price of polyurethane foam products from at least 1999 to the present. Each plaintiff also seeks attorney fees,pre-judgment and post-judgment interest, court costs, and injunctive relief against future violations. On April 15 and May 6, 2011, we filed motions todismiss the U.S. direct purchaser and indirect purchaser class actions in the consolidated case in Ohio, for failure to state a legally valid claim. On July 19,2011, the Ohio Court denied the motions to dismiss. Discovery is underway in the U.S. actions.
We have been named in two Canadian class action cases (for direct and indirect purchasers of polyurethane foam products), both under the name HiNeighbor Floor Covering Co. Limited and Hickory Springs Manufacturing Company, et.al. in the Ontario Superior Court of Justice (Windsor), Court FileNos. CV-10-15164 (amended November 2, 2011) and CV-11-17279 (issued December 30, 2011). In each of the Canadian cases, the plaintiffs, on behalf ofthemselves and/or a class of purchasers, seek from over 15 defendants restitution of the amount allegedly overcharged, general and special damages in theamount of $100, punitive damages of $10, pre-judgment and post-judgment interest, and the costs of the investigation and the action. We are not yet requiredto file our defenses in the Canadian actions. In addition, on July 10, 2012, plaintiff in a class action case (for direct and indirect purchasers of polyurethanefoam products) styled Option Consommateurs and Karine Robillard v. Produits Vitafoam Canada Limitée, et. al. in the Quebec Superior Court of Justice(Montréal), Court File No. 500-06-00524-104, filed an amended motion for authorization seeking to add us and other manufacturers of polyurethane foamproducts as defendants in this case.
On June 22, 2012, we were also made party to a lawsuit brought in the 16 Judicial Circuit Court, Jackson County, Missouri, Case Number 1216-CV15179 under the caption “Dennis Baker, on Behalf of Himself and all Others Similarly Situated vs. Leggett & Platt, Incorporated – Polyurethane FoamClass Action.” The plaintiff, on behalf of himself and/or a class of indirect purchasers of polyurethane foam products in the State of Missouri, alleged that weviolated the Missouri Merchandising Practices Act based upon our alleged illegal price inflation of flexible polyurethane foam products. The plaintiffs seekunspecified actual damages, punitive damages and the recovery of reasonable attorney fees. We have not yet filed our response to this action.
We deny all of the allegations in all of these actions and will vigorously defend ourselves. This contingency is subject to many uncertainties. Therefore,based on the information available to date, we cannot estimate the amount or range of potential loss, if any.
Brazilian Value-Added Tax MattersOn December 22, 2011, the Brazilian Finance Ministry, Federal Revenue Office issued a notice of violation against our wholly-owned subsidiary,
Leggett & Platt do Brasil Ltda. (“L&P Brazil”) in the amount of approximately $4, under Case No. 10855.724660/2011-43. The Brazilian Revenue Officeclaimed that for the period beginning November 2006 and continuing through December 2007, L&P Brazil used an incorrect tariff code for the collection andpayment of value-added tax primarily on the sale of mattress innerspring units in Brazil. The Brazilian Revenue Office has communicated that it will likelyexpand the audit to the tax years 2008 through January 2011. As a result, it is possible that we may receive an additional notice of violation on the same subjectmatter. L&P Brazil responded to the notice of violation on January 25, 2012 denying the violation.
In addition, L&P Brazil received assessments in July 2012 from the Brazilian Revenue Office where the Revenue Office challenged L&P Brazil’s use ofcertain tax credits in the years 2008 through 2010. Such credits are generated based upon the tariff classification and rate used by L&P Brazil for value-addedtax on the sale of mattress innersprings. Combined with prior assessments, L&P Brazil has received assessments totaling approximately $1 on the same orsimilar denial of tax credit matters.
L&P Brazil is also party to a proceeding involving the State of Sao Paulo, Brazil where the State of Sao Paulo, on April 16, 2009, issued a Notice ofTax Assessment and Imposition of Fine to L&P Brazil seeking approximately $3.3 for the tax years 2006 and 2007. The State of Sao Paulo argued that L&PBrazil was using an incorrect tax rate for the collection and payment of value-added tax on sales of mattress innerspring units in the State of Sao Paulo. OnSeptember 29, 2010, the Court of Tax and Fees of the State of Sao Paulo ruled in favor of L&P Brazil nullifying the tax assessment. The State filed a specialappeal and the Special Appeals court remanded the case back to the Court of Tax and Fees for further findings.
We deny all of the allegations in these actions. We believe that we have valid bases upon which to contest such actions and will vigorously defendourselves. However, these contingencies are subject to many uncertainties. At this time, we do not believe it is probable that this matter will have a materialadverse effect on our financial condition, operating cash flows or results of operations.
22
th

LEGGETT & PLATT, INCORPORATEDNOTES TO CONSOLIDATED CONDENSED FINANCIAL STATEMENTS—(Continued)
(Unaudited) 15. CONTINGENCIES (continued) Patent Infringement Claim
On January 24, 2012, in a case in the United States District Court for the Central District of California, the jury entered a verdict against us in theamount of $5 based upon an allegation by plaintiff that we infringed three patents on an automatic stapling machine and on methods used to assemble boxsprings. This action was originally filed on October 4, 2010, as case number CV10-07416 RGK (SSx) under the caption Imaginal Systematic, LLC v.Leggett & Platt, Incorporated; Simmons Bedding Company; and Does 1 through 10, inclusive. Leggett is contractually obligated to defend and indemnifySimmons Bedding Company against a claim for infringement.
On summary judgment motions, we unsuccessfully disputed each patent’s validity and denied that we infringed any patent. At the jury trial on damagesissues, the plaintiff alleged damages of $16.2. The plaintiff might also request royalties for post-verdict use of the machines. We intend to object to suchrequest. At a bench trial, the court denied plaintiff’s attempt to win triple damages and attorney fees.
On April 9, 2012 we appealed the case to the Federal Circuit Court of Appeals and believe we have valid bases upon which to appeal. We do not believethat it is probable that the judgment will be upheld on appeal in its current form.
We also filed reexamination proceedings in the Patent Office (Case Nos. 95/001,543 filed February 11, 2011; 95/001,546 and 95/001,547 filedFebruary 16, 2011), challenging the validity of each patent at issue. The Patent Office examiner twice ruled in our favor on the pertinent claims of one of thethree patents. (Plaintiff has yet to appeal.) The Patent Office examiner initially ruled in our favor on the pertinent claims of the second patent, but subsequentlyreversed that decision. We appealed this reversal. With respect to the third patent, we appealed the Patent Office examiner’s decision upholding validity;however, due to a change made to all of the machines we do not believe that the machines currently use the feature alleged to have infringed the third patent.
At this time, we do not believe it is probable that this matter will have a material adverse effect on our financial condition, operating cash flows or resultsof operations.
23

ITEM 2. MANAGEMENT’S DISCUSSION AND ANALYSIS OF FINANCIAL CONDITION AND RESULTS OF OPERATIONSWhat We Do
Leggett & Platt is a diversified manufacturer, and member of the S&P 500 index, that conceives, designs, and produces a wide range of engineeredcomponents and products found in most homes, offices, automobiles, and also in many airplanes and retail stores. We make components that are oftenhidden within, but integral to, our customers’ products.
We are the leading U.S. manufacturer of: components for residential furniture and bedding, adjustable bed bases, carpet underlay, components foroffice furniture, drawn steel wire, thin-walled titanium and nickel tubing for the aerospace industry, automotive seat support and lumbar systems, andbedding industry machinery.
Our SegmentsOur continuing operations are comprised of 20 business units in four segments, with approximately 18,000 employees, and 130 production facilities
located in 18 countries around the world. Our segments are described below.
Residential Furnishings: This segment supplies a variety of components mainly used by bedding and upholstered furniture manufacturers in theassembly of their finished products. We also sell carpet cushion, adjustable bed bases, bed frames, ornamental beds and geo components. This segmentgenerated approximately 47% of total sales during the first half of 2012.
Commercial Fixturing & Components: Operations in this segment, which contributed approximately 11% of first half 2012 total sales, manufactureand sell store fixtures and point-of-purchase displays used in retail stores. We also produce chair controls, bases, and other components for office furnituremanufacturers, as well as select lines of private-label finished furniture.
Industrial Materials: These operations primarily supply steel rod, drawn steel wire, steel billets, and welded steel tubing to our other operations and toexternal customers. Our customers use this wire and tubing to make bedding, furniture, automotive seats, mechanical springs, and many other end products.We also supply titanium and nickel tubing for the aerospace industry. This segment generated approximately 23% of our total sales during the first six monthsof 2012.
Specialized Products: From this segment we supply lumbar support systems and seat suspension systems used by automotive seating manufacturers.We manufacture and install the racks, shelving and cabinets used to outfit fleets of service vans. We also produce quilting, sewing, and wire formingmachinery, some of which is used by other Leggett operations as well as external customers, including bedding manufacturers. This segment contributedabout 19% of first half 2012 total sales.
Total Shareholder ReturnTotal Shareholder Return (TSR), relative to peer companies, is the key financial measure that we use to assess long-term performance. TSR is driven by
the change in our share price and the dividends we pay [TSR = (Change in Stock Price + Dividends) / Beginning Stock Price]. We seek to achieve TSR in thetop one-third of the S&P 500 over the long-term through a balanced approach that employs all four TSR sources: revenue growth, margin expansion,dividends, and share repurchases.
We monitor our TSR performance (relative to the S&P 500) on a rolling three-year basis. To date, for the three-year period that began January 1, 2010,we have so far (over the last 31 months) generated TSR of 8% per year on average, or slightly below the midpoint of the S&P 500 companies over that sametime period.
Senior executives participate in a TSR-based incentive program (based on our performance compared to the performance of a group of approximately320 peers). Business unit bonuses emphasize the achievement of higher returns on the assets under the unit’s direct control.
CustomersWe serve a broad suite of customers, with our largest customer representing less than 6% of our sales in 2011. Many are companies whose names are
widely recognized; they include most manufacturers of furniture and bedding, a variety of other manufacturers, and many major retailers.
Major Factors That Impact Our BusinessMany factors impact our business, but those that generally have the greatest impact are market demand, raw material cost trends, and competition.
24

Market Demand
Market demand (including product mix) is impacted by several economic factors, with consumer confidence being most significant. Other importantfactors include disposable income levels, employment levels, housing turnover, and interest rates. All these factors influence consumer spending on durablegoods, and therefore affect demand for our components and products. Some of these factors also influence business spending on facilities and equipment,which impacts approximately one-quarter of our sales.
Over the last few years we have significantly reduced our fixed cost structure, but purposely retained spare production capacity. Accordingly, unit salescan rebound appreciably without the need for large capital investment. We have meaningful operating leverage that should significantly benefit future earningsas market demand rebounds. Until our spare capacity is fully utilized, each additional $100 million of sales from incremental unit volume is expected togenerate approximately $25 million to $35 million of additional pre-tax earnings.
Raw Material Cost Trends
In many of our businesses, we enjoy a cost advantage from buying large quantities of raw materials. This purchasing leverage is a benefit that many ofour competitors generally do not have. Still, our costs can vary significantly as market prices for raw materials (many of which are commodities) fluctuate.
We typically have short-term commitments from our suppliers; accordingly, our raw material costs generally move with the market. Our ability torecover higher costs (through selling price increases) is crucial. When we experience significant increases in raw material costs, we typically implement priceincreases to recover the higher costs. Conversely, when costs decrease significantly, we generally pass those lower costs through to our customers. The timingof our price increases or decreases is important; we typically experience a lag in recovering higher costs, so we also expect to realize a lag as costs decline.
Steel is our principal raw material and at various times in past years we have experienced extreme cost fluctuations in this commodity. In most cases, themajor changes (both increases and decreases) were passed through to customers with selling price adjustments.
As a producer of steel rod, we are also impacted by volatility in metal margins (the difference in the cost of steel scrap and the market price for steel rod).Metal margins within the steel industry have been volatile during certain periods in recent years.
Our other raw materials include woven and non-woven fabrics, foam scrap, and chemicals. We have experienced changes in the cost of these materialsin recent years and, in most years, have been able to pass them through to our customers.
When we raise our prices to recover higher raw material costs, this sometimes causes customers to modify their product designs and replace higher costcomponents with lower cost components. We experienced this de-contenting effect in our Residential Furnishings segment in the last half of 2011 (however,selective selling price reductions helped contain this activity). As our customers changed the quantity and mix of components in their finished goods to addresscommodity inflation, our profit margins were negatively impacted. We must continue to find ways to assist our customers in improving the functionality andreducing the cost of their products, while providing higher margin and profit contribution for our operations.
Competition
Many of our markets are highly competitive with the number of competitors varying by product line. In general, our competitors tend to be smaller,private companies. Many of these companies (both domestic and foreign) compete primarily on the basis of price. Our success has stemmed from the ability toremain price competitive, while delivering product quality, innovation, and customer service.
We continue to face pressure from foreign competitors as some of our customers source a portion of their components and finished products offshore. Inaddition to lower labor rates, foreign competitors benefit (at times) from lower raw material costs. They may also benefit from currency factors and morelenient regulatory climates. We typically remain price competitive, even versus many foreign manufacturers, as a result of our highly efficient operations, lowlabor content, vertical integration in steel and wire, and large scale purchasing of raw materials and commodities. However, we have reacted to foreigncompetition in certain cases by selectively adjusting prices, and by developing new proprietary products that help our customers reduce total costs.
The margin pressure we experienced in the last half of 2011 resulted in part from price competition in certain of our businesses as we reduced prices(selectively) to maintain market share in light of depressed industry volume.
Premium non-innerspring mattresses (those that have either a foam or air core) have experienced rapid growth in the U.S. bedding market in recent years.While still a relatively small portion of the total market in units (approximately 10%-15%), these products represent a much larger portion of the total marketin dollars (approximately 25%-30%) due to their higher average selling prices. We expect these products to continue to grow. Some of our traditional beddingcustomers are beginning to offer mattresses that combine an innerspring core with top layers comprised of specialty foam and gel. These hybrid productsallow our bedding customers to address a consumer preference for the feel of a specialty mattress and the characteristics of an innerspring.
25

We filed an antidumping suit related to innerspring imports from China, South Africa and Vietnam which was brought to a favorable conclusion in2009. The current antidumping duty rates on innersprings from these countries are significant, ranging from 116% to 234%, and should remain in effect atleast until early 2014. Imported innersprings from these countries are now supposed to be sold at fair prices, however the duties on certain innersprings arebeing evaded by various means including shipping the goods through a third country and falsely identifying the country of origin. In 2009, Leggett, alongwith several U.S. manufacturers of products with active antidumping or antidumping/countervailing duty orders, formed a coalition and are working withMembers of Congress, the U.S. Department of Commerce, and U.S. Customs and Border Protection to seek stronger enforcement of existing antidumpingand/or countervailing duty orders.
2011 Restructuring PlanIn December 2011, we approved a restructuring plan to reduce our overhead costs and improve ongoing profitability. The activities primarily entailed the
closure of four underperforming facilities. We incurred a $37 million pre-tax (largely non-cash) charge in the 4 quarter of 2011 primarily related to this plan,which included $31 million of long-lived asset impairments and $6 million of other restructuring-related costs. During the first six months of 2012, weincurred an additional $2 million in restructuring costs and $1 million of long-lived asset impairments related to this plan. We expect plant closures to becomplete by the end of the year, with no additional material costs expected.
Earnings should benefit in 2012 from the cost savings associated with the 2011 Restructuring Plan and other restructuring activity initiated in the latterpart of 2011. Our 2012 forecast anticipates an approximate $15-$20 million pre-tax earnings benefit ($.07-$.10 per share, net of tax) from these activities.
RESULTS OF OPERATIONSDiscussion of Consolidated Results
Second Quarter:
Second quarter sales of $939 million were .7% lower than in the second quarter of 2011. Acquisitions, net of divestitures, increased sales by 1%. Samelocation sales declined approximately 2% due to lower trade sales at the steel rod mill, currency rates, and reduced store fixture sales. Apart from these threefactors, same location sales increased 2%, with unit volumes flat to positive across the majority of the company. The strongest growth continues to come fromthe automotive and adjustable bed businesses.
EBIT (earnings before interest and income taxes) improved as a result of unit volume growth in certain businesses, cost savings associated with ourfourth quarter 2011 restructuring activity, and strong operating performance from the Western Pneumatic Tube acquisition.
Earnings per share (EPS) for the quarter were $.45 per diluted share, compared to $.37 during the second quarter of last year. Second quarter 2012 EPSincludes a $.04 special tax benefit and a $.02 benefit in discontinued operations from a litigation settlement associated with a previously divested business.Second quarter 2011 EPS included a $.02 benefit from special tax items. Earnings are benefitting from higher unit volumes, cost savings associated with therestructuring activities initiated in late 2011, and the Western Pneumatic Tube acquisition.
Six Months Ended June 30, 2012:
Sales for the first half of 2012 were $1.9 billion, 2% higher than in the first half of 2011. Acquisitions, net of divestitures, increased sales by 1%, andsame location sales also grew 1% from higher unit volumes in certain of our businesses (primarily Automotive, and Adjustable Bed). The most notable volumedecline occurred in Store Fixtures.
EPS for the first half of 2012 were $.75 per diluted share, compared to $.67 in the first half of 2011. Current year EPS reflects a $.04 benefit from aspecial tax item and a $.02 benefit from discontinued operations (included in the second quarter discussion above.) EPS for the prior year included a $.02benefit from special tax items (in the second quarter) and a $.03 benefit from other items, including gains from building sales (in the first quarter). Theincrease in EPS primarily reflects higher unit volumes, cost savings associated with the restructuring activities initiated in late 2011, and the WesternPneumatic Tube acquisition.
LIFO/FIFO and the Effect of Changing PricesAll of our segments use the first-in, first-out (FIFO) method for valuing inventory. In our consolidated financials, an adjustment is made at the corporate
level (i.e., outside the segments) to convert about 60% of our inventories to the last-in, first-out (LIFO) method.
For the full year 2012, we estimate a LIFO benefit of $5 million. This estimate incorporates certain assumptions about year-end steel prices andinventory levels (both are very difficult to accurately predict). Therefore, the LIFO estimate for the full year could be significantly different from that currentlyestimated. Any further change in the annual estimate of LIFO will be reflected in the remaining quarters.
26
th

The following table contains the LIFO (income) expense included in earnings for each of the periods presented:
Six Months Ended
June 30, Three Months Ended
June 30, 2012 2011 2012 2011 LIFO (income) expense $ (2.1) $ 9.0 $ (2.6) $ 3.5
Interest Expense and Income TaxesSecond quarter 2012 interest expense from continuing operations was slightly higher than in the second quarter of 2011. Interest expense for the full year
2012 is expected to be higher than in 2011.
The reported second quarter consolidated worldwide effective tax rate was 19%, compared to 23% for the same quarter last year. The 2012 effective ratewas lower primarily due to the recording of a deferred tax asset (related to the tax basis of a subsidiary) which we now believe will be realized in the foreseeablefuture. We expect an additional tax benefit related to this subsidiary will be recognized within the next 12 months.
We anticipate that the effective rate for the remainder of 2012 will approximate 30%, but that is contingent upon factors such as our overall profitability,the mix of earnings among taxing jurisdictions, the type of income earned, the impact of tax audits and other discrete items, and the effect of any tax lawchanges.
Discussion of Segment ResultsSecond Quarter Discussion
A description of the products included in each segment, along with segment financial data, appear in Note 4 of the Notes to Consolidated CondensedFinancial Statements.
A summary of the segment results are shown in the following tables.
(Dollar amounts in millions)
Three Months endedJune 30, 2012
Net Sales
Three Months endedJune 30, 2011
Net Sales
Change in Net Sales % Change inSame Location
Sales(1) $ % Residential Furnishings $ 474.7 $ 467.7 $ 7.0 1.5% 1.0% Commercial Fixturing & Components 114.9 138.8 (23.9) (17.2) (10.4) Industrial Materials 236.0 229.1 6.9 3.0 (4.8) Specialized Products 195.9 186.5 9.4 5.0 5.1
Total 1,021.5 1,022.1 (.6) (.1) Intersegment sales (82.7) (76.9) (5.8) External sales $ 938.8 $ 945.2 $ (6.4) (.7)% (1.7)%
Three Months
endedJune 30,
2012EBIT
Three Monthsended
June 30,2011EBIT
Change in EBIT EBIT Margins(2)
(Dollar amounts in millions) $ %
Three Monthsended
June 30,2012
Three Monthsended
June 30,2011
Residential Furnishings $ 40.0 $ 41.2 $(1.2) (2.9)% 8.4% 8.8% Commercial Fixturing & Components 3.1 7.5 (4.4) (58.7) 2.7 5.4 Industrial Materials 17.8 13.6 4.2 30.9 7.5 5.9 Specialized Products 25.9 21.4 4.5 21.0 13.2 11.5 Intersegment eliminations & other (3.2) (1.1) (2.1) Change in LIFO reserve 2.6 (3.5) 6.1
Total $ 86.2 $ 79.1 $ 7.1 9.0% 9.2% 8.4% (1) The change in sales not attributable to acquisitions or divestitures. These are sales that come from the same plants and facilities that we owned one year
earlier.(2) Segment margins are calculated on total sales. Overall company margin is calculated on external sales.
27

Residential FurnishingsSecond quarter sales in this segment increased $7 million, or 2%. Same location sales in this segment increased 1%, with unit volume growth partially
offset by the impact of currency exchange rates.
In our U.S. Spring business, innerspring volumes increased 2% and boxspring units were down 3%; innerspring volumes in Europe also increased 2%.In Furniture Hardware, unit volumes were flat. We had significant growth in adjustable beds again this quarter, with unit shipments up 20%.
EBIT decreased $1 million, with the benefit from higher unit volumes more than offset by a shift in sales mix to lower margin products in certainbusinesses.
Commercial Fixturing & ComponentsTotal sales declined $24 million, or 17%; same location sales decreased 10% due to lower spending by key fixture and display customers, and our
decision to exit certain programs formerly supplied by operations we have closed or consolidated. Sales in office furniture components were flat during thequarter.
EBIT decreased $4 million primarily due to reduced sales, higher restructuring-related costs, and absence of earnings from the UK-based point-of-purchase business we divested in January. These impacts were partially offset by previous restructuring-related cost reductions and better overhead absorptionassociated with increased production for a major program that will ship in the 3 quarter of 2012.
The seasonality of our store fixtures business this year is expected to be consistent with the longer-term historical pattern in which third quarter is thesales peak, primarily due to a major initiative by one of our large retail customers. We anticipate an improvement in segment results in the third quarter as aresult of this additional volume.
Industrial MaterialsTotal sales increased $7 million, or 3%, with growth from the Western Pneumatic Tube acquisition partially offset by lower same location sales. Second
quarter same location sales decreased 5%, primarily due to lower trade sales from our steel rod mill, partially offset by increased unit volumes in both DrawnWire and Steel Tubing. The decrease in steel rod sales resulted from an equipment changeover at the rod mill, which was an investment in process and qualityimprovement. The installation of the new equipment occurred late in the first quarter, and production did not return to normal levels until early May.
EBIT improved by $4 million, as a result of the Western Pneumatic Tube acquisition and the plant consolidations announced in late 2011.
Specialized ProductsTotal sales increased $9 million, or 5%, with unit volume growth partially offset by the impact of currency exchange rates. The increase in unit
volumes resulted entirely from growth in Automotive. Sales in Commercial Vehicle Products were roughly flat and Machinery sales were down compared to thesecond quarter of last year.
EBIT improved $5 million, or 21%, largely due to higher sales.
Discontinued OperationsThe discontinued operations activity in second quarter of 2012 was related to a $2.4 million (after tax) gain from a litigation settlement associated with a
previously divested business.
Six-Month Discussion
A description of the products included in each segment, along with segment financial data, appear in Note 4 of the Notes to Consolidated CondensedFinancial Statements. A summary of the segment results are shown in the following tables.
(Dollar amounts in millions)
Six Months endedJune 30, 2012
Net Sales
Six Months endedJune 30, 2011
Net Sales
Change in Net Sales % Change inSame Location
Sales(1) $ % Residential Furnishings $ 967.3 $ 927.4 $ 39.9 4.3% 3.9% Commercial Fixturing & Components 229.1 267.8 (38.7) (14.5) (9.2) Industrial Materials 473.7 439.4 34.3 7.8 .4 Specialized Products 381.2 361.4 19.8 5.5 5.5
Total 2,051.3 1,996.0 55.3 2.8 Intersegment sales (165.7) (155.0) (10.7) External sales $ 1,885.6 $ 1,841.0 $ 44.6 2.4% 1.3%
28
rd

(Dollar amounts in millions)
Six Monthsended
June 30,2012EBIT
Six Monthsended
June 30,2011EBIT
Change in EBIT EBIT Margins(2)
$ %
Six Monthsended
June 30,2012
Six Monthsended
June 30,2011
Residential Furnishings $ 80.2 $ 83.3 $ (3.1) (3.7)% 8.3% 9.0% Commercial Fixturing & Components 10.3 15.7 (5.4) (34.4) 4.5 5.9 Industrial Materials 29.6 27.6 2.0 7.2 6.2 6.3 Specialized Products 43.8 39.5 4.3 10.9 11.5 10.9 Intersegment eliminations & other (5.2) (3.8) (1.4) Change in LIFO reserve 2.1 (9.0) 11.1
Total $ 160.8 $ 153.3 $ 7.5 4.9% 8.5% 8.3% (1) The change in sales not attributable to acquisitions or divestitures. These are sales that come from the same plants and facilities that we owned one year
earlier.(2) Segment margins are calculated on total sales. Overall company margin is calculated on external sales.
Residential FurnishingsSales in this segment grew 4% during the first six months of 2012, reflecting a combination of unit volume growth and raw material-related price
increases, partially offset by currency rate changes.
EBIT decreased $3 million versus the prior year, primarily due to the absence of a $4 million gain from a building sale that occurred in early 2011, anda shift in sales mix to lower margin products in certain businesses. These impacts were partially offset by higher unit volumes.
Commercial Fixturing & ComponentsTotal sales declined $39 million, or 15%. Same location sales decreased 9% and the remainder of the decline resulted from the divestiture of a UK-
based point-of-purchase operation in January 2012. The reduction in same location sales was due to lower spending by key fixture and display customers,and our decision to exit certain programs formerly supplied by operations we have closed or consolidated.
EBIT declined $5 million versus the first six months of 2011, primarily due to lower volume, the absence of a $4 million gain from a building sale thatoccurred early last year, and higher restructuring-related costs. These impacts were partially offset by benefits from restructuring activity and other costsavings.
Industrial MaterialsTotal sales increased $34 million, or 8%, from the Western Pneumatic Tube acquisition. Same location sales were essentially flat, with modest steel-
related price inflation offsetting lower unit volumes.
EBIT increased $2 million, or 7%, with earnings benefits from the Western acquisition and plant consolidations announced in late 2011, partiallyoffset by lower unit volumes and a $4 million acquisition-related fair value adjustment to Western’s inventory.
Specialized ProductsTotal sales increased $20 million, or 6%, reflecting continued strength in global automotive demand, partially offset by declines in Commercial Vehicle
Products and Machinery.
EBIT improved $4 million, or 11% during the first six months of 2012. This increase was due primarily to higher sales.
Discontinued OperationsThe discontinued operations activity in 2012 was related to a $2.4 million gain from a litigation settlement associated with a previously divested
business.
29

LIQUIDITY AND CAPITALIZATIONIn this section, we provide details about our:
• Uses of cash
• Cash from operations
• Working capital trends
• Debt position and total capitalization
We use cash for the following:
• Finance capital requirements (e.g. productivity, growth and acquisitions)
• Pay dividends
• Repurchase our stock
Our operations provide most of the cash we require, and debt may also be used to fund a portion of our needs. For 2012, we expect cash flow fromoperations to approximate $350 million. With the $188 million cash outlay to acquire Western Pneumatic Tube in January, net debt to net capital increasedfrom 29% at year-end 2011 to 33% as of June 30, 2012. Our long-term target is to have net debt as a percent of net capital in the 30%-40% range. Thecalculation of net debt as a percent of net capital at June 30, 2012 and December 31, 2011 is presented on page 32.
Uses of CashFinance Capital Requirements
Cash is readily available to fund selective growth, both internally (through capital expenditures) and externally (through acquisitions). Capitalexpenditures include investments we make to maintain, modernize, and expand manufacturing capacity; they should approximate $90 million in 2012. In allour businesses, we continue to invest in the maintenance of facilities and equipment. However, with excess productive capacity across our operations (fromcontinued low demand levels), we have reduced spending on expansion projects. The anticipated increase in 2012 relates primarily to specific new automotiveprograms that we have been awarded, and that should contribute to earnings and cash flow beginning in 2013.
Our strategic, long-term, 4-5% annual growth objective envisions periodic acquisitions. We are seeking acquisitions within our growth businesses, andare looking for opportunities to enter new, higher growth markets (carefully screened for sustainable competitive advantage). During the years 2008-2010,acquisitions were a lower priority as we primarily focused on completing the divestitures and improving margins and returns of our existing businesses.However, in 2011 we turned our focus again to acquisitions, as one of the levers we will use to achieve our TSR goal, and have begun actively solicitingopportunities while maintaining our screening discipline. In January 2012 we purchased Western Pneumatic Tube for $188 million. This acquisition alignsextremely well with our strategy to seek businesses with secure, leading positions in growing, profitable, attractive markets.
Pay DividendsWe expect to continue returning cash to shareholders through dividends and share repurchases. In 2012 we increased the first quarter dividend, to $.28
per share, and extended to 41 years our record of consecutive annual dividend increases, at an average compound growth rate of 13%. Our targeted dividendpayout is approximately 50-60% of net earnings, but actual payout has been higher recently and will likely remain above targeted levels in the near term.Maintaining and increasing the dividend remains a high priority. We anticipate spending approximately $160 million on dividends in 2012. Cash fromoperations has been, and is expected to continue to be, more than sufficient to readily fund both capital expenditures and dividends.
Repurchase StockShare repurchases are the other means by which we return cash to shareholders. During the second quarter of 2012, we repurchased .1 million shares of
our stock and issued .4 million shares through employee benefit and stock purchase plans. As a result, shares outstanding increased to 140.5 million. For thepast several years, we have made few acquisitions; instead, we used excess cash (including divestiture proceeds) largely to repurchase shares. Given the cashoutlay to acquire Western Pneumatic Tube, we did not conduct any open-market purchases of our stock during the second quarter. However, consistent withour often-stated priorities for use of excess cash flow, we expect eventually to resume buying back our stock, subject to the outlook for the economy, our levelof cash generation, and opportunities to strategically grow the company. We have been authorized by the Board to repurchase up to 10 million shares eachyear, but we have established no specific repurchase commitment or timetable.
30

Cash from OperationsCash from operations is our primary source of funds. Earnings and changes in working capital levels are the two broad factors that generally have the
greatest impact on our cash from operations.
Cash from operations for the six months ended June 30, 2012 was $146 million compared to $101 million for the same period last year. The increase in2012 operating cash was due primarily to the change in working capital levels. We continue to closely monitor our working capital levels, and ended thequarter with working capital as a percent of annualized sales, which was favorable to our target. For the full year 2012, we expect cash from operations toapproximate $350 million.
Working Capital TrendsThe following chart presents key working capital trends for the last five quarters:
(Dollar amounts in millions) Jun-11 Sep-11 Dec-11 Mar-12 Jun-12 Accounts Receivable, net $567.9 $576.7 $ 503.6 $571.6 $557.6 Inventory, net $ 507.1 $456.5 $ 441.0 $ 473.3 $ 517.6 Accounts Payable $ 282.3 $ 274.2 $256.6 $ 298.2 $ 320.2 (1) The accounts receivable ratio represents the days of sales outstanding calculated as: ending net accounts receivable ÷ (quarter-to-date net sales
÷ number of days in the quarter).(2) The inventory ratio represents days of inventory on hand calculated as: ending net inventory ÷ (quarter-to-date cost of goods sold ÷ number of
days in the quarter).(3) The accounts payable ratio represents the days of payables outstanding calculated as: ending accounts payable ÷ (quarter-to-date cost of goods
sold ÷ number of days in the quarter).
The dollar value (and days) of inventory and accounts payable increased in the second quarter of 2012 primarily due to increased production for amajor program in the Commercial Fixturing & Components segment that will ship in the third quarter of 2012, and normal seasonal trends.
• Accounts Receivable and Days Sales Outstanding (DSO): DSO fluctuates quarterly from normal differences in the timing of sales and cashreceipts. Changes in the DSO reflected in the table above are consistent with our historical range, and are not indicative of changes in paymenttrends or credit worthiness of customers. We continue to focus on collection efforts to ensure customer accounts are paid on time. As part of ouraccounts receivable review process, we evaluate individual customers’ payment histories, financial health, industry prospects, and currentmacroeconomic events in determining if outstanding amounts are collectible. In the second quarter of 2012, we incurred $.7 million of bad debtexpense as compared to $2.3 million in second quarter 2011.
• Inventory and Days Inventory on Hand (DIO): Our DIO typically fluctuates within a reasonably narrow range as a result of differences in thetiming of sales, production levels, and inventory purchases. During the second quarter of 2012, we recognized expense of $2.6 million associatedwith obsolete and slow moving inventories as compared to $2.2 million in the second quarter of 2011. We do not expect significant changes incustomer or industry trends that would materially increase our exposure to inventory obsolescence.
31

• Accounts Payable and Days Payable Outstanding (DPO): Changes in the DPO reflected in the table above are the result of normal fluctuation in
our operating activity. We actively strive to optimize payment terms with our vendors, and over the last few years, have increased our DPO bymore than ten days.
CapitalizationThe following table presents Leggett’s key debt and capitalization statistics:
(Dollar amounts in millions) June 30,
2012 December 31,
2011 Long-term debt outstanding:
Scheduled maturities $ 554 $ 763 Average interest rates* 4.6% 4.6% Average maturities in years* 3.3 3.8
Revolving credit/commercial paper 267 70 Total long-term debt 821 833
Deferred income taxes and other liabilities 191 188 Shareholders’ equity and noncontrolling interest 1,347 1,308
Total capitalization $2,359 $ 2,329 Unused committed credit:
Long-term $ 333 $ 530 Short-term — —
Total unused committed credit $ 333 $ 530 Current maturities of long-term debt $ 202 $ 3 Cash and cash equivalents $ 255 $ 236 Ratio of earnings to fixed charges** 6.3x 4.8x
* These calculations include current maturities, but exclude commercial paper to reflect the averages of outstanding debt with scheduled
maturities.** As presented in Exhibit 12, fixed charges include interest expense, capitalized interest, plus implied interest included in operating leases.
Earnings consist principally of income from continuing operations before income taxes, plus fixed charges less capitalized interest.
The next table shows the percent of long-term debt to total capitalization, calculated in two ways:
• Long-term debt to total capitalization as reported in the previous table.
• Long-term debt to total capitalization each reduced by total cash and increased by current maturities of long-term debt.
We believe that adjusting this measure for cash and current maturities allows a more meaningful comparison to periods during which cash fluctuatessignificantly. We use these adjusted measures to monitor our financial leverage.
(Amounts in millions) June 30,
2012 December 31,
2011 Debt to total capitalization: Long-term debt $ 821 $ 833
Current debt maturities 202 3 Cash and cash equivalents (255) (236)
Net debt $ 768 $ 600 Total Capitalization $2,359 $ 2,329
Current debt maturities 202 3 Cash and cash equivalents (255) (236)
Net capitalization $ 2,306 $ 2,096 Long-term debt to total capitalization 34.8% 35.8% Net debt to net capitalization 33.3% 28.6%
32

Total debt (which includes long-term debt and current debt maturities) increased $187 million from year-end 2011 levels, as a result of our increasedcommercial paper borrowings, partially offset by the payoff of an $8 million airplane lease.
In anticipation of long-term debt maturing in April 2013, we entered into forward starting interest rate swaps in 2010. The swap contracts managebenchmark interest rate risk associated with $200 million of planned debt issuance in August 2012. The swaps have a weighted average interest rate of 4.0%and hedge the benchmark rate of the future issuance of $200 million of debt. The credit spread over the benchmark bonds will continue to fluctuate until thecontracts are settled (either upon an issuance of debt or upon their expiration). For more information on our interest rate swaps, see Footnote 14 “RiskManagement and Derivative Financial Instruments” beginning on page 18.
Short Term Borrowings
We can raise cash by issuing up to $600 million in commercial paper through a program that is backed by a $600 million revolving credit agreementwith a syndicate of 13 lenders. This agreement was renewed in 2011, with a five-year term ending in 2016. The credit agreement allows us to issue letters ofcredit up to $250 million. When we issue letters of credit in this manner, our capacity under the agreement, and consequently, our ability to issue commercialpaper, is reduced by a corresponding amount. Amounts outstanding related to our commercial paper program were:
(Amounts in millions) June 30,
2012 December 31,
2011 Total program authorized $ 600 $ 600 Commercial paper outstanding (classified as long-term debt) (267) (70) Letters of credit issued under the credit agreement — — Total program usage (267) (70) Total program available $ 333 $ 530
The average and maximum amount of commercial paper outstanding during the second quarter of 2012 was $313 million and $338 million,respectively. The maximum amount reflects funds used to finance the acquisition of Western Pneumatic Tube (cash purchase price of $188 million), and alsofor ordinary working capital needs and other general purposes. Commercial paper amounts fluctuated during the quarter due to normal changes in workingcapital funding requirements. At quarter end, we had no letters of credit outstanding under the credit agreement, but we had $82 million of stand-by letters ofcredit outside the agreement to take advantage of more attractive fee pricing.
With anticipated operating cash flows, our commercial paper program, and our expected ability to issue debt in the capital markets, we believe we havesufficient funds available to support our ongoing operations, pay dividends, fund future growth, repurchase stock, and repay maturing debt.
Accessibility of CashAt June 30, 2012 we had cash and cash equivalents of $255 million primarily invested in interest-bearing bank accounts and in bank time deposits
with original maturities of three months or less.
A substantial portion of these funds are held in the international accounts of our foreign operations. Though we do not rely on this foreign cash as asource of funds to support our ongoing domestic liquidity needs, we believe we could bring most of this cash back to the U.S. over a period of two to threeyears without material cost. However, if we had to bring all the foreign cash back immediately, we could incur incremental taxes of up to $54 million.
In 2010, we brought back $121 million of foreign cash at an incremental tax cost of $5 million. In 2011, we brought back an additional $89 millionthrough payments on intercompany loans at no added tax cost.
NEW ACCOUNTING STANDARDSThe Financial Accounting Standards Board has issued accounting guidance effective for current and future periods (that we have not yet adopted), but
we do not believe any of the new guidance will have a material impact on our current or future financial statements.
QUANTITATIVE AND QUALITATIVE DISCLOSURES ABOUT MARKET RISKInterest rate
Substantially all of our debt is denominated in United States dollars. The fair value for fixed rate debt was greater than its $730.0 million carrying valueby $47 million at June 30, 2012 and greater than its $730.0 million carrying value by $29 million at December 31, 2011. The increase in the fair marketvalue of our debt is primarily due to the decrease in credit spreads compared to risk-free rates since year-end. The fair value of fixed rate debt at June 30, 2012and December 31, 2011 was based upon a Bloomberg secondary market rate. The fair value of variable rate debt is not significantly different from itsrecorded amount.
33

Interest Rate Cash Flow HedgesIn anticipation of long-term debt maturing in April 2013, we entered into forward starting interest rate swaps in 2010. The swap contracts manage
benchmark interest rate risk associated with $200 million of planned debt issuance in August 2012. The swaps have a weighted average interest rate of 4.0%and hedge the benchmark rate of the future issuance of $200 million of debt. The credit spread over the benchmark bonds will continue to fluctuate until thecontracts are settled (either upon an issuance of debt or upon their expiration).
To the extent that the swaps are effective, changes in the fair values of the swap contracts are deferred in accumulated other comprehensive income(“AOCI”). The portion of the change in fair value considered to be ineffective is recognized immediately in “Other expense” in the accompanying consolidatedcondensed statements of operations. Amounts deferred in AOCI will be reclassified to interest expense over the same period of time that interest expense isrecognized on the future borrowings.
Investment in Foreign SubsidiariesWe view our investment in foreign subsidiaries as a long-term commitment, and do not hedge translation exposures. The investment in a foreign
subsidiary may take the form of either permanent capital or notes. Our net investment (i.e., total assets less total liabilities subject to translation exposure) inforeign subsidiaries was $887.7 million at June 30, 2012, compared to $859.2 million at December 31, 2011.
FORWARD-LOOKING STATEMENTSThis Quarterly Report on Form 10-Q and our other public disclosures, whether written or oral, may contain “forward-looking” statements including,
but not limited to: projections of revenue, income, earnings, capital expenditures, dividends, capital structure, cash flows or other financial items; possibleplans, goals, objectives, prospects, strategies or trends concerning future operations; statements concerning future economic performance; and the underlyingassumptions relating to the forward-looking statements. These statements are identified either by the context in which they appear or by use of words such as“anticipate,” “believe,” “estimate,” “expect,” “intend,” “may,” “plan,” “project,” “should” or the like. All such forward-looking statements, whether written ororal, and whether made by us or on our behalf, are expressly qualified by the cautionary statements described in this provision.
Any forward-looking statement reflects only the beliefs of the Company or its management at the time the statement is made. Because all forward-lookingstatements deal with the future, they are subject to risks, uncertainties and developments which might cause actual events or results to differ materially fromthose envisioned or reflected in any forward-looking statement. Moreover, we do not have, and do not undertake, any duty to update or revise any forward-looking statement to reflect events or circumstances after the date on which the statement was made. For all of these reasons, forward-looking statementsshould not be relied upon as a prediction of actual future events, objectives, strategies, trends or results.
Readers should review Item 1A Risk Factors in our Form 10-K, filed February 24, 2012 and in this Form 10-Q for a description of important factorsthat could cause actual events or results to differ materially from forward-looking statements. It is not possible to anticipate and list all risks, uncertainties anddevelopments which may affect the future operations or performance of the Company, or which otherwise may cause actual events or results to differmaterially from forward-looking statements. However, some of these risks and uncertainties include the following:
• factors that could affect the industries or markets in which we participate, such as growth rates and opportunities in those industries;
• adverse changes in inflation, currency, political risk, U.S. or foreign laws or regulations, consumer sentiment, housing turnover, employment
levels, interest rates, trends in capital spending and the like;
• factors that could impact raw materials and other costs, including the availability and pricing of steel scrap and rod and other raw materials, the
availability of labor, wage rates and energy costs;
• our ability to pass along raw material cost increases through increased selling prices;
• price and product competition from foreign (particularly Asian and European) and domestic competitors;
• our ability to improve operations and realize cost savings (including our ability to fix under-performing operations and to generate future earnings
from restructuring-related activities);
• our ability to maintain profit margins if our customers change the quantity and mix of our components in their finished goods;
• our ability to achieve expected levels of cash flow;
34

• our ability to maintain and grow the profitability of acquired companies;
• our ability to maintain the proper functioning of our internal business processes and information systems and avoid modification or interruption
of such systems, through cyber-security breaches or otherwise;
• a decline in the long-term outlook for any of our reporting units that could result in asset impairment; and
• litigation including product liability and warranty, taxation, environmental, intellectual property, anti-trust and workers’ compensation expense.
ITEM 3. QUANTITATIVE AND QUALITATIVE DISCLOSURES ABOUT MARKET RISKSee the “Quantitative and Qualitative Disclosures About Market Risk” section under Item 2, Management’s Discussion and Analysis of Financial
Condition and Results of Operations.
ITEM 4. CONTROLS AND PROCEDURESAn evaluation as of June 30, 2012 was carried out by the Company’s management, with participation of the Company’s Chief Executive Officer and
Chief Financial Officer, of the effectiveness of the Company’s disclosure controls and procedures (as defined in Rule 13a-15(e) under the Securities ExchangeAct of 1934, as amended (the “Exchange Act”)). Based upon this evaluation, the Chief Executive Officer and Chief Financial Officer have concluded theCompany’s disclosure controls and procedures are effective, as of June 30, 2012, to provide assurance that information required to be disclosed by theCompany in the reports that it files or submits under the Exchange Act, is recorded, processed, summarized, and reported within the time periods specified bythe Securities and Exchange Commission’s rules and forms. Disclosure controls and procedures include, without limitation, controls and procedures designedto ensure that information required to be disclosed by the Company in the reports that it files or submits under the Exchange Act is accumulated andcommunicated to the Company’s management, including its Chief Executive Officer and Chief Financial Officer, or persons performing similar functions, asappropriate to allow timely decisions regarding required disclosure.
There was no change in the Company’s internal control over financial reporting that occurred during the quarter ending June 30, 2012 that hasmaterially affected, or is reasonably likely to materially affect, the Company’s internal control over financial reporting.
35

PART II. OTHER INFORMATION
ITEM 1. LEGAL PROCEEDINGSThe information in Note 15 beginning on page 20 of the Notes to Consolidated Condensed Financial Statements is incorporated into this section by
reference.
ITEM 1A. RISK FACTORSOur 2011 Annual Report on Form 10-K filed February 24, 2012 includes a detailed discussion of our risk factors in Item 1A “Risk Factors.” The
information presented below updates and should be read in conjunction with the risk factors and information disclosed in that Form 10-K.
Investing in our securities involves risk. Set forth below and elsewhere in this report are risk factors that could cause actual results to differ materiallyfrom the results contemplated by the forward-looking statements contained in this report. We may amend or supplement these risk factors from time to time byother reports we file with the SEC.
Our goodwill and other long-lived assets are subject to potential impairment.A significant portion of our assets consists of goodwill and other long-lived assets, the carrying value of which may be reduced if we determine that
those assets are impaired.
(Dollar amounts in millions) June 30,
2012 Book Value % of Total
Assets Goodwill $ 976.6 Other intangibles 209.1
Total goodwill and other intangibles $ 1,185.7 37% Net property, plant and equipment $ 581.1 Other long-lived assets 73.2
Total net property, plant and equipment and other long- livedassets $ 654.3 20%
We review our ten reporting units for potential goodwill impairment in June as part of our annual goodwill impairment testing, and more often if an eventor circumstance occurs making it likely that impairment exists. In addition, we test for the recoverability of long-lived assets at year end, and more often if anevent or circumstance indicates the carrying value may not be recoverable. We conduct impairment testing based on our current business strategy in light ofpresent industry and economic conditions, as well as future expectations.
The annual goodwill impairment review performed in June 2012 indicated no goodwill impairments, but fair market value for one of our ten reportingunits (Fixture & Display) only exceeded book value by approximately 10%. The fair market values of all other reporting units exceeded book value by morethan 35%.
The goodwill associated with the Fixture & Display reporting unit was approximately $110 million at June, 2012. The unit is dependent upon capitalspending by retailers on both new stores and remodeling of existing stores. Over the last few years, we have narrowed the scope of the Fixtures and Displayreporting unit, effected changes to senior management, reduced overhead, and purged customer accounts with unacceptable margins. However, retailer activityhas been low and the unit has not met expectations. If actual performance does not improve and remains at current levels, future goodwill impairments couldbe possible.
In December 2011, management approved a restructuring plan which primarily related to the closure of four underperforming plants. This resulted inlong-lived asset impairment of $31 million. Prior to that event, our last material asset impairment occurred in 2007.
If actual results differ from the assumptions and estimates used in the goodwill and long-lived asset calculations, we could incur impairment charges,which could negatively impact our results of operations.
36

Reporting units’ fair values in relation to their respective carrying values and significant assumptions used in the June 2012 goodwill review arepresented in the table below.
Percentage of fair value in excess of carrying value
June 30, 2012goodwill value
(in millions)
Sales 10-yearcompound
annual growthrate range
Terminalvalues long-term growth
rate Discount rate
ranges10-25% $ 110.1 3.9% 3% 11.0%25%+ 866.5 1.4% - 6.4% 3% 7.5% - 9.5%
$ 976.6 1.4% - 6.4% 3% 7.5% - 11.0%
We have exposure to economic and other factors that affect market demand for our products.As a supplier of products to a variety of industries, we are adversely affected by general economic downturns. Our operating performance is heavily
influenced by market demand for our components and products. Market demand for the majority of our products is most heavily influenced by consumerconfidence. To a lesser extent, market demand is impacted by other broad economic factors, including disposable income levels, employment levels, housingturnover, energy costs and interest rates. All of these factors influence consumer spending on durable goods, and drive demand for our products. Some ofthese factors also influence business spending on facilities and equipment, which impacts approximately one-quarter of our sales.
Demand improved in certain of or our markets during the second quarter of 2012. We saw significant volume gains in Automotive and Adjustable Bed.The most notable volume declines occurred in Store Fixtures and Machinery.
Demand weakness in our markets can lead to lower unit orders, sales and earnings in our businesses. Several factors, including a weak globaleconomy, a depressed housing market, or low consumer confidence could contribute to conservative spending habits by consumers around the world. Shortlead times in most of our markets allow for limited visibility into demand trends. If economic and market conditions deteriorate, we may experience materialnegative impacts on our business, financial condition, operating cash flows and results of operations. ITEM 2. UNREGISTERED SALES OF EQUITY SECURITIES AND USE OF PROCEEDS
Issuer Repurchases of Equity SecuritiesThe table below is a listing of our repurchases of the Company’s common stock by calendar month during the second quarter of 2012.
Period
TotalNumber of
SharesPurchased
(1)
AveragePricePaidper
Share
TotalNumber of
SharesPurchasedas Part ofPublicly
AnnouncedPlans or
Programs(2)
MaximumNumber ofShares thatmay yet bePurchasedUnder thePlans or
Programs(2)
April 2012 0 $ — 0 9,977,012May 2012 0 $ — 0 9,977,012June 2012 3,000 $20.36 3,000 9,974,012Total 3,000 $20.36 3,000
(1) This number does not include shares withheld for taxes in stock unit conversions during the quarter.(2) On August 4, 2004, the Board authorized management to repurchase up to 10 million shares each calendar year beginning January 1, 2005. This
standing authorization was first reported in the quarterly report on Form 10-Q for the period ended June 30, 2004, filed August 5, 2004, and shallremain in force until repealed by the Board of Directors.
37

ITEM 6. EXHIBITS Exhibit 10.1* - Summary Sheet of Director Compensation.
Exhibit 10.2
-
The Company’s Flexible Stock Plan, amended and restated effective as of May l0, 2012, filed March 30, 2012 as Appendix A tothe Company’s Proxy Statement, is incorporated by reference. (SEC File No. 001-07845)
Exhibit 12* - Computation of Ratio of Earnings to Fixed Charges.
Exhibit 31.1*
-
Certification of David S. Haffner, pursuant to Rule 13a-14(a), as adopted pursuant to Section 302 of the Sarbanes-Oxley Act of2002, dated August 7, 2012.
Exhibit 31.2*
-
Certification of Matthew C. Flanigan, pursuant to Rule 13a-14(a), as adopted pursuant to Section 302 of the Sarbanes-Oxley Actof 2002, dated August 7, 2012.
Exhibit 32.1*
-
Certification of David S. Haffner, pursuant to 18 U.S.C. Section 1350, as adopted pursuant to Section 906 of the Sarbanes-Oxley Act of 2002, dated August 7, 2012.
Exhibit 32.2*
-
Certification of Matthew C. Flanigan, pursuant to 18 U.S.C. Section 1350, as adopted pursuant to Section 906 of the Sarbanes-Oxley Act of 2002, dated August 7, 2012.
Exhibit 101.INS** - XBRL Instance Document.
Exhibit 101.SCH** - XBRL Taxonomy Extension Schema.
Exhibit 101.CAL** - XBRL Taxonomy Extension Calculation Linkbase.
Exhibit 101.DEF** - XBRL Taxonomy Extension Definition Linkbase Document.
Exhibit 101.LAB** - XBRL Taxonomy Extension Label Linkbase.
Exhibit 101.PRE** - XBRL Taxonomy Extension Presentation Linkbase. * - Denotes filed herewith.** - Furnished as Exhibit 101 to this report are the following formatted in XBRL (eXtensible Business Reporting Language):(i) Consolidated Condensed Balance Sheets at June 30, 2012 and December 31, 2011; (ii) Consolidated Condensed Statements of Operations for the six
and three months ended June 30, 2012 and June 30, 2011; (iii) Consolidated Statements of Comprehensive Income (Loss) for the six and three monthsended June 30, 2012 and June 30, 2011; (iv) Consolidated Condensed Statements of Cash Flows for the six months ended June 30, 2012 and June 30,2011; and (v) Notes to Consolidated Condensed Financial Statements. In accordance with Rule 406T of Regulation S-T, the XBRL related informationin Exhibit 101 to this Quarterly Report on Form 10-Q shall not be deemed to be “filed” for purposes of Section 18 of the Exchange Act, or otherwisesubject to the liability of that section, and shall not be part of any registration statement, prospectus or other document filed under the Securities Act orthe Exchange Act, except as shall be expressly set forth by specific reference in such filing.
38

SIGNATURES
Pursuant to the requirements of the Securities Exchange Act of 1934, the Registrant has duly caused this report to be signed on its behalf by theundersigned thereunto duly authorized. LEGGETT & PLATT, INCORPORATED
DATE: August 7, 2012 By: /s/ DAVID S. HAFFNER
David S. HaffnerPresident and Chief Executive Officer
DATE: August 7, 2012 By: /s/ MATTHEW C. FLANIGAN
Matthew C. FlaniganSenior Vice President – Chief Financial Officer
39

EXHIBIT INDEX Exhibit
10.1* Summary Sheet of Director Compensation.
10.2
The Company’s Flexible Stock Plan, amended and restated effective as of May l0, 2012, filed March 30, 2012 as Appendix A to theCompany’s Proxy Statement, is incorporated by reference. (SEC File No. 001-07845)
12* Computation of Ratio of Earnings to Fixed Charges.
31.1*
Certification of David S. Haffner, pursuant to Rule 13a-14(a), as adopted pursuant to Section 302 of the Sarbanes-Oxley Act of 2002,dated August 7, 2012.
31.2*
Certification of Matthew C. Flanigan, pursuant to Rule 13a-14(a), as adopted pursuant to Section 302 of the Sarbanes-Oxley Act of 2002,dated August 7, 2012.
32.1*
Certification of David S. Haffner, pursuant to 18 U.S.C. Section 1350, as adopted pursuant to Section 906 of the Sarbanes-Oxley Act of2002, dated August 7, 2012.
32.2*
Certification of Matthew C. Flanigan, pursuant to 18 U.S.C. Section 1350, as adopted pursuant to Section 906 of the Sarbanes-Oxley Actof 2002, dated August 7, 2012.
101.INS** XBRL Instance Document.
101.SCH** XBRL Taxonomy Extension Schema.
101.CAL** XBRL Taxonomy Extension Calculation Linkbase.
101.DEF** XBRL Taxonomy Extension Definition Linkbase Document.
101.LAB** XBRL Taxonomy Extension Label Linkbase.
101.PRE** XBRL Taxonomy Extension Presentation Linkbase. * Denotes filed herewith.** Furnished as Exhibit 101 to this report are the following formatted in XBRL (eXtensible Business Reporting Language):(i) Consolidated Condensed Balance Sheets at June 30, 2012 and December 31, 2011; (ii) Consolidated Condensed Statements of Operations for the six
and three months ended June 30, 2012 and June 30, 2011; (iii) Consolidated Statements of Comprehensive Income (Loss) for the six and three monthsended June 30, 2012 and June 30, 2011; (iv) Consolidated Condensed Statements of Cash Flows for the six months ended June 30, 2012 and June 30,2011; and (v) Notes to Consolidated Condensed Financial Statements. In accordance with Rule 406T of Regulation S-T, the XBRL related informationin Exhibit 101 to this Quarterly Report on Form 10-Q shall not be deemed to be “filed” for purposes of Section 18 of the Exchange Act, or otherwisesubject to the liability of that section, and shall not be part of any registration statement, prospectus or other document filed under the Securities Act orthe Exchange Act, except as shall be expressly set forth by specific reference in such filing.
40

Exhibit 10.1
SUMMARY SHEET OF DIRECTOR COMPENSATION
The following summary sets forth current annual rates of cash and equity compensation for non-management directors that were effective immediatelyfollowing the May 12, 2011 Board meeting and were confirmed for the 2012-2013 election term at the May 10, 2012 Board meeting.
Compensation Item Current
Compensation Cash Compensation
Board Retainer $ 50,000 Audit Committee
Chair Retainer $ 18,000 Member Retainer $ 8,000
Compensation Committee Chair Retainer $ 15,000 Member Retainer $ 6,000
Nominating & Corporate Governance Committee Chair Retainer $ 10,000 Member Retainer $ 5,000
Equity Compensation - Restricted Stock or Restricted Stock Units Independent Chair Retainer (including Director Retainer) $ 290,000 Director Retainer $ 125,000
Directors may defer their cash compensation by participating in the Company’s Deferred Compensation Program, Effective as of December 1, 2011 (filedFebruary 24, 2012 as Exhibit 10.13 to the Company’s Form 10-K).
Directors may receive the equity component of their compensation in restricted stock or restricted stock units (RSUs). In either case, the awards have a 12-month vesting period ending on the day preceding the next annual meeting of shareholders. Vesting accelerates in the event of death, disability or a change incontrol of the Company. The number of shares is calculated by dividing the dollar value by the closing price of the Company’s stock on the grant date. RSUsare settled in shares of common stock and earn dividend equivalents at a 20% discount to the market price of Company stock on the dividend payment date.Directors may elect to defer settlement of the RSU award for 2 to 10 years after the grant date.
The Company pays for travel expenses the directors incur to attend Board meetings.
Our employee directors do not receive additional compensation for their Board service.

Exhibit 12
LEGGETT AND PLATT, INCORPORATED AND SUBSIDIARIESCOMPUTATION OF RATIO OF EARNINGS TO FIXED CHARGES
(Amounts in millions of dollars)
Six Months
Ended Twelve Months Ended
December 31, 6/30/12 6/30/11 2011 2010 2009 2008 2007 Earnings
Income from continuing operations before income taxes* $ 145.0 $ 138.2 $ 206.2 $255.5 $ 198.4 $192.6 $ 147.3 Interest expense (excluding amount capitalized) 19.1 18.9 38.3 37.7 37.4 49.5 60.9 Portion of rental expense under operating leases representative of an
interest factor** 8.0 8.5 14.6 15.4 16.9 21.5 24.3 Total earnings*** $172.1 $165.6 $259.1 $ 308.6 $252.7 $ 263.6 $232.5 Fixed charges
Interest expense (including amount capitalized) $ 19.4 $ 19.1 $ 39.0 $ 38.1 $ 38.3 $ 50.5 $ 61.9 Portion of rental expense under operating leases representative of an
interest factor** 8.0 8.5 14.6 15.4 16.9 21.5 24.3 Total fixed charges $ 27.4 $ 27.6 $ 53.8 $ 53.5 $ 55.2 $ 72.0 $ 86.2 Ratio of earnings to fixed charges 6.3 6.0 4.8 5.8 4.6 3.7 2.7 * 2007 and 2008 amounts have been retrospectively adjusted to include noncontrolling interest.** Estimated portion of rent expense representing interest.*** Earnings consist principally of income from continuing operations before income taxes, plus fixed charges less capitalized interest. Fixed charges include
interest expense, capitalized interest and implied interest in operating leases.

Exhibit 31.1
CERTIFICATION
I, David S. Haffner, certify that:
1. I have reviewed this report on Form 10-Q of Leggett & Platt, Incorporated;
2. Based on my knowledge, this report does not contain any untrue statement of a material fact or omit to state a material fact necessary to make the
statements made, in light of the circumstances under which such statements were made, not misleading with respect to the period covered by thisreport;
3. Based on my knowledge, the financial statements, and other financial information included in this report, fairly present in all material respects
the financial condition, results of operations and cash flows of the registrant as of, and for, the periods presented in this report;
4. The registrant’s other certifying officer(s) and I are responsible for establishing and maintaining disclosure controls and procedures (as defined in
Exchange Act Rules 13a-15(e) and 15d-15(e)) and internal control over financial reporting (as defined in Exchange Act Rules 13a-15(f) and 15d-15(f)) for the registrant and have:
a) Designed such disclosure controls and procedures, or caused such disclosure controls and procedures to be designed under our
supervision, to ensure that material information relating to the registrant, including its consolidated subsidiaries, is made known to us byothers within those entities, particularly during the period in which this report is being prepared;
b) Designed such internal control over financial reporting, or caused such internal control over financial reporting to be designed under our
supervision, to provide reasonable assurance regarding the reliability of financial reporting and the preparation of financial statements forexternal purposes in accordance with generally accepted accounting principles;
c) Evaluated the effectiveness of the registrant’s disclosure controls and procedures and presented in this report our conclusions about the
effectiveness of the disclosure controls and procedures, as of the end of the period covered by this report based on such evaluation; and
d) Disclosed in this report any change in the registrant’s internal control over financial reporting that occurred during the registrant’s most
recent fiscal quarter (the registrant’s fourth fiscal quarter in the case of an annual report) that has materially affected, or is reasonablylikely to materially affect, the registrant’s internal control over financial reporting; and
5. The registrant’s other certifying officer(s) and I have disclosed, based on our most recent evaluation of internal control over financial reporting, to
the registrant’s auditors and the audit committee of the registrant’s board of directors (or persons performing the equivalent functions):
a) All significant deficiencies and material weaknesses in the design or operation of internal control over financial reporting which are
reasonably likely to adversely affect the registrant’s ability to record, process, summarize and report financial information; and
b) Any fraud, whether or not material, that involves management or other employees who have a significant role in the registrant’s internal
control over financial reporting. Date: August 7, 2012 /s/ David S. Haffner
David S. Haffner President and Chief Executive Officer Leggett & Platt, Incorporated

Exhibit 31.2
CERTIFICATION
I, Matthew C. Flanigan, certify that:
1. I have reviewed this report on Form 10-Q of Leggett & Platt, Incorporated;
2. Based on my knowledge, this report does not contain any untrue statement of a material fact or omit to state a material fact necessary to make the
statements made, in light of the circumstances under which such statements were made, not misleading with respect to the period covered by thisreport;
3. Based on my knowledge, the financial statements, and other financial information included in this report, fairly present in all material respects
the financial condition, results of operations and cash flows of the registrant as of, and for, the periods presented in this report;
4. The registrant’s other certifying officer(s) and I are responsible for establishing and maintaining disclosure controls and procedures (as defined in
Exchange Act Rules 13a-15(e) and 15d-15(e)) and internal control over financial reporting (as defined in Exchange Act Rules 13a-15(f) and 15d-15(f)) for the registrant and have:
a) Designed such disclosure controls and procedures, or caused such disclosure controls and procedures to be designed under our
supervision, to ensure that material information relating to the registrant, including its consolidated subsidiaries, is made known to us byothers within those entities, particularly during the period in which this report is being prepared;
b) Designed such internal control over financial reporting, or caused such internal control over financial reporting to be designed under our
supervision, to provide reasonable assurance regarding the reliability of financial reporting and the preparation of financial statements forexternal purposes in accordance with generally accepted accounting principles;
c) Evaluated the effectiveness of the registrant’s disclosure controls and procedures and presented in this report our conclusions about the
effectiveness of the disclosure controls and procedures, as of the end of the period covered by this report based on such evaluation; and
d) Disclosed in this report any change in the registrant’s internal control over financial reporting that occurred during the registrant’s most
recent fiscal quarter (the registrant’s fourth fiscal quarter in the case of an annual report) that has materially affected, or is reasonablylikely to materially affect, the registrant’s internal control over financial reporting; and
5. The registrant’s other certifying officer(s) and I have disclosed, based on our most recent evaluation of internal control over financial reporting, to
the registrant’s auditors and the audit committee of the registrant’s board of directors (or persons performing the equivalent functions):
a) All significant deficiencies and material weaknesses in the design or operation of internal control over financial reporting which are
reasonably likely to adversely affect the registrant’s ability to record, process, summarize and report financial information; and
b) Any fraud, whether or not material, that involves management or other employees who have a significant role in the registrant’s internal
control over financial reporting. Date: August 7, 2012 /s/ Matthew C. Flanigan
Matthew C. Flanigan Senior Vice President and Chief Financial Officer Leggett & Platt, Incorporated

Exhibit 32.1
CERTIFICATION PURSUANT TO18 U.S.C. SECTION 1350
AS ADOPTED PURSUANT TOSECTION 906 OF THE SARBANES-OXLEY ACT OF 2002
In connection with the Quarterly Report of Leggett & Platt, Incorporated (the “Company”) on Form 10-Q for the period ending June 30, 2012 as filed with theSecurities and Exchange Commission on the date hereof (the “Report”), I, David S. Haffner, certify, pursuant to 18 U.S.C. § 1350, as adopted pursuant to §906 of the Sarbanes-Oxley Act of 2002, that:
(1) The Report fully complies with the requirements of section 13(a) or 15(d) of the Securities Exchange Act of 1934; and
(2) The information contained in the Report fairly presents, in all material respects, the financial condition and results of operations of the Company.
A signed original of this written statement required by Section 906 has been provided to Leggett & Platt, Incorporated and will be retained by Leggett & Platt,Incorporated and furnished to the Securities and Exchange Commission or its staff upon request. /s/ David S. HaffnerDavid S. HaffnerPresident and Chief Executive Officer
August 7, 2012

Exhibit 32.2
CERTIFICATION PURSUANT TO18 U.S.C. SECTION 1350
AS ADOPTED PURSUANT TOSECTION 906 OF THE SARBANES-OXLEY ACT OF 2002
In connection with the Quarterly Report of Leggett & Platt, Incorporated (the “Company”) on Form 10-Q for the period ending June 30, 2012 as filed with theSecurities and Exchange Commission on the date hereof (the “Report”), I, Matthew C. Flanigan, certify, pursuant to 18 U.S.C. § 1350, as adopted pursuantto § 906 of the Sarbanes-Oxley Act of 2002, that:
(1) The Report fully complies with the requirements of section 13(a) or 15(d) of the Securities Exchange Act of 1934; and
(2) The information contained in the Report fairly presents, in all material respects, the financial condition and results of operations of the Company.
A signed original of this written statement required by Section 906 has been provided to Leggett & Platt, Incorporated and will be retained by Leggett & Platt,Incorporated and furnished to the Securities and Exchange Commission or its staff upon request. /s/ Matthew C. FlaniganMatthew C. FlaniganSenior Vice President and Chief Financial Officer
August 7, 2012
