investor day 2013 - new zealand exchange · investor day 2013 agenda 9:00 a.m ... •today’s...
TRANSCRIPT

Auckland InternationalAirport Limited
Investor Day 2013

Investor Day 2013
Agenda
9:00 a.m. Welcome Simon Robertson Chief Financial Officer
9:05 a.m. Faster, Higher, Stronger Adrian Littlewood Chief Executive Officer
9:35 a.m. Grow Travel Markets Glenn Wedlock General Manager - Business Development
10:20 a.m. Break
10:35 a.m. Progressing Our 30 Year Vision Adrian Littlewood Chief Executive Officer
11:05 a.m. Be Fast, Efficient & Effective - Aeronautical Operations Judy Nicholl General Manager - Aeronautical Operations
11:25 a.m. Be Fast, Efficient & Effective - Managing Costs Simon Robertson Chief Financial Officer
11:30 a.m. Travel to Abbeville
12:00 p.m. Lunch
12:30 p.m. Investing For Future Growth - Property Peter Alexander General Manager - Property
Investing For Future Growth - Our Investments Simon Robertson Chief Financial Officer
1:15 p.m. Strengthen Our Consumer BusinessRichard Barker
Paul Divers
General Manager – Retail & Commercial
Manager – Retail
2:05 p.m. Aspirations and wrap-up Simon Robertson Chief Financial Officer
2:20 p.m. Tour
3:00 p.m. Ends

FasterHigher Stronger 2013Strategy BriefingInvestor Day 2013Auckland International Airport Limited

Strong infrastructure heritage

Changed philosophy, improved performance, increased expectations – a different business

CHALLENGES& OPPORTUNITIES

Infrastructure and operations are the foundation of our business

Carefully managed infrastructure and operations are key to the future of our company and country

We are in a race to capture the growth in international tourism markets

We can help New Zealand realise its potential

New customers are in control and have changing expectations

We have a strong foundation to build upon

It’s more than just constructing buildings

Need to inspire people and prove the value of the airport’s location

Technology gives us new ways of operating and communicating

Evolution not revolution
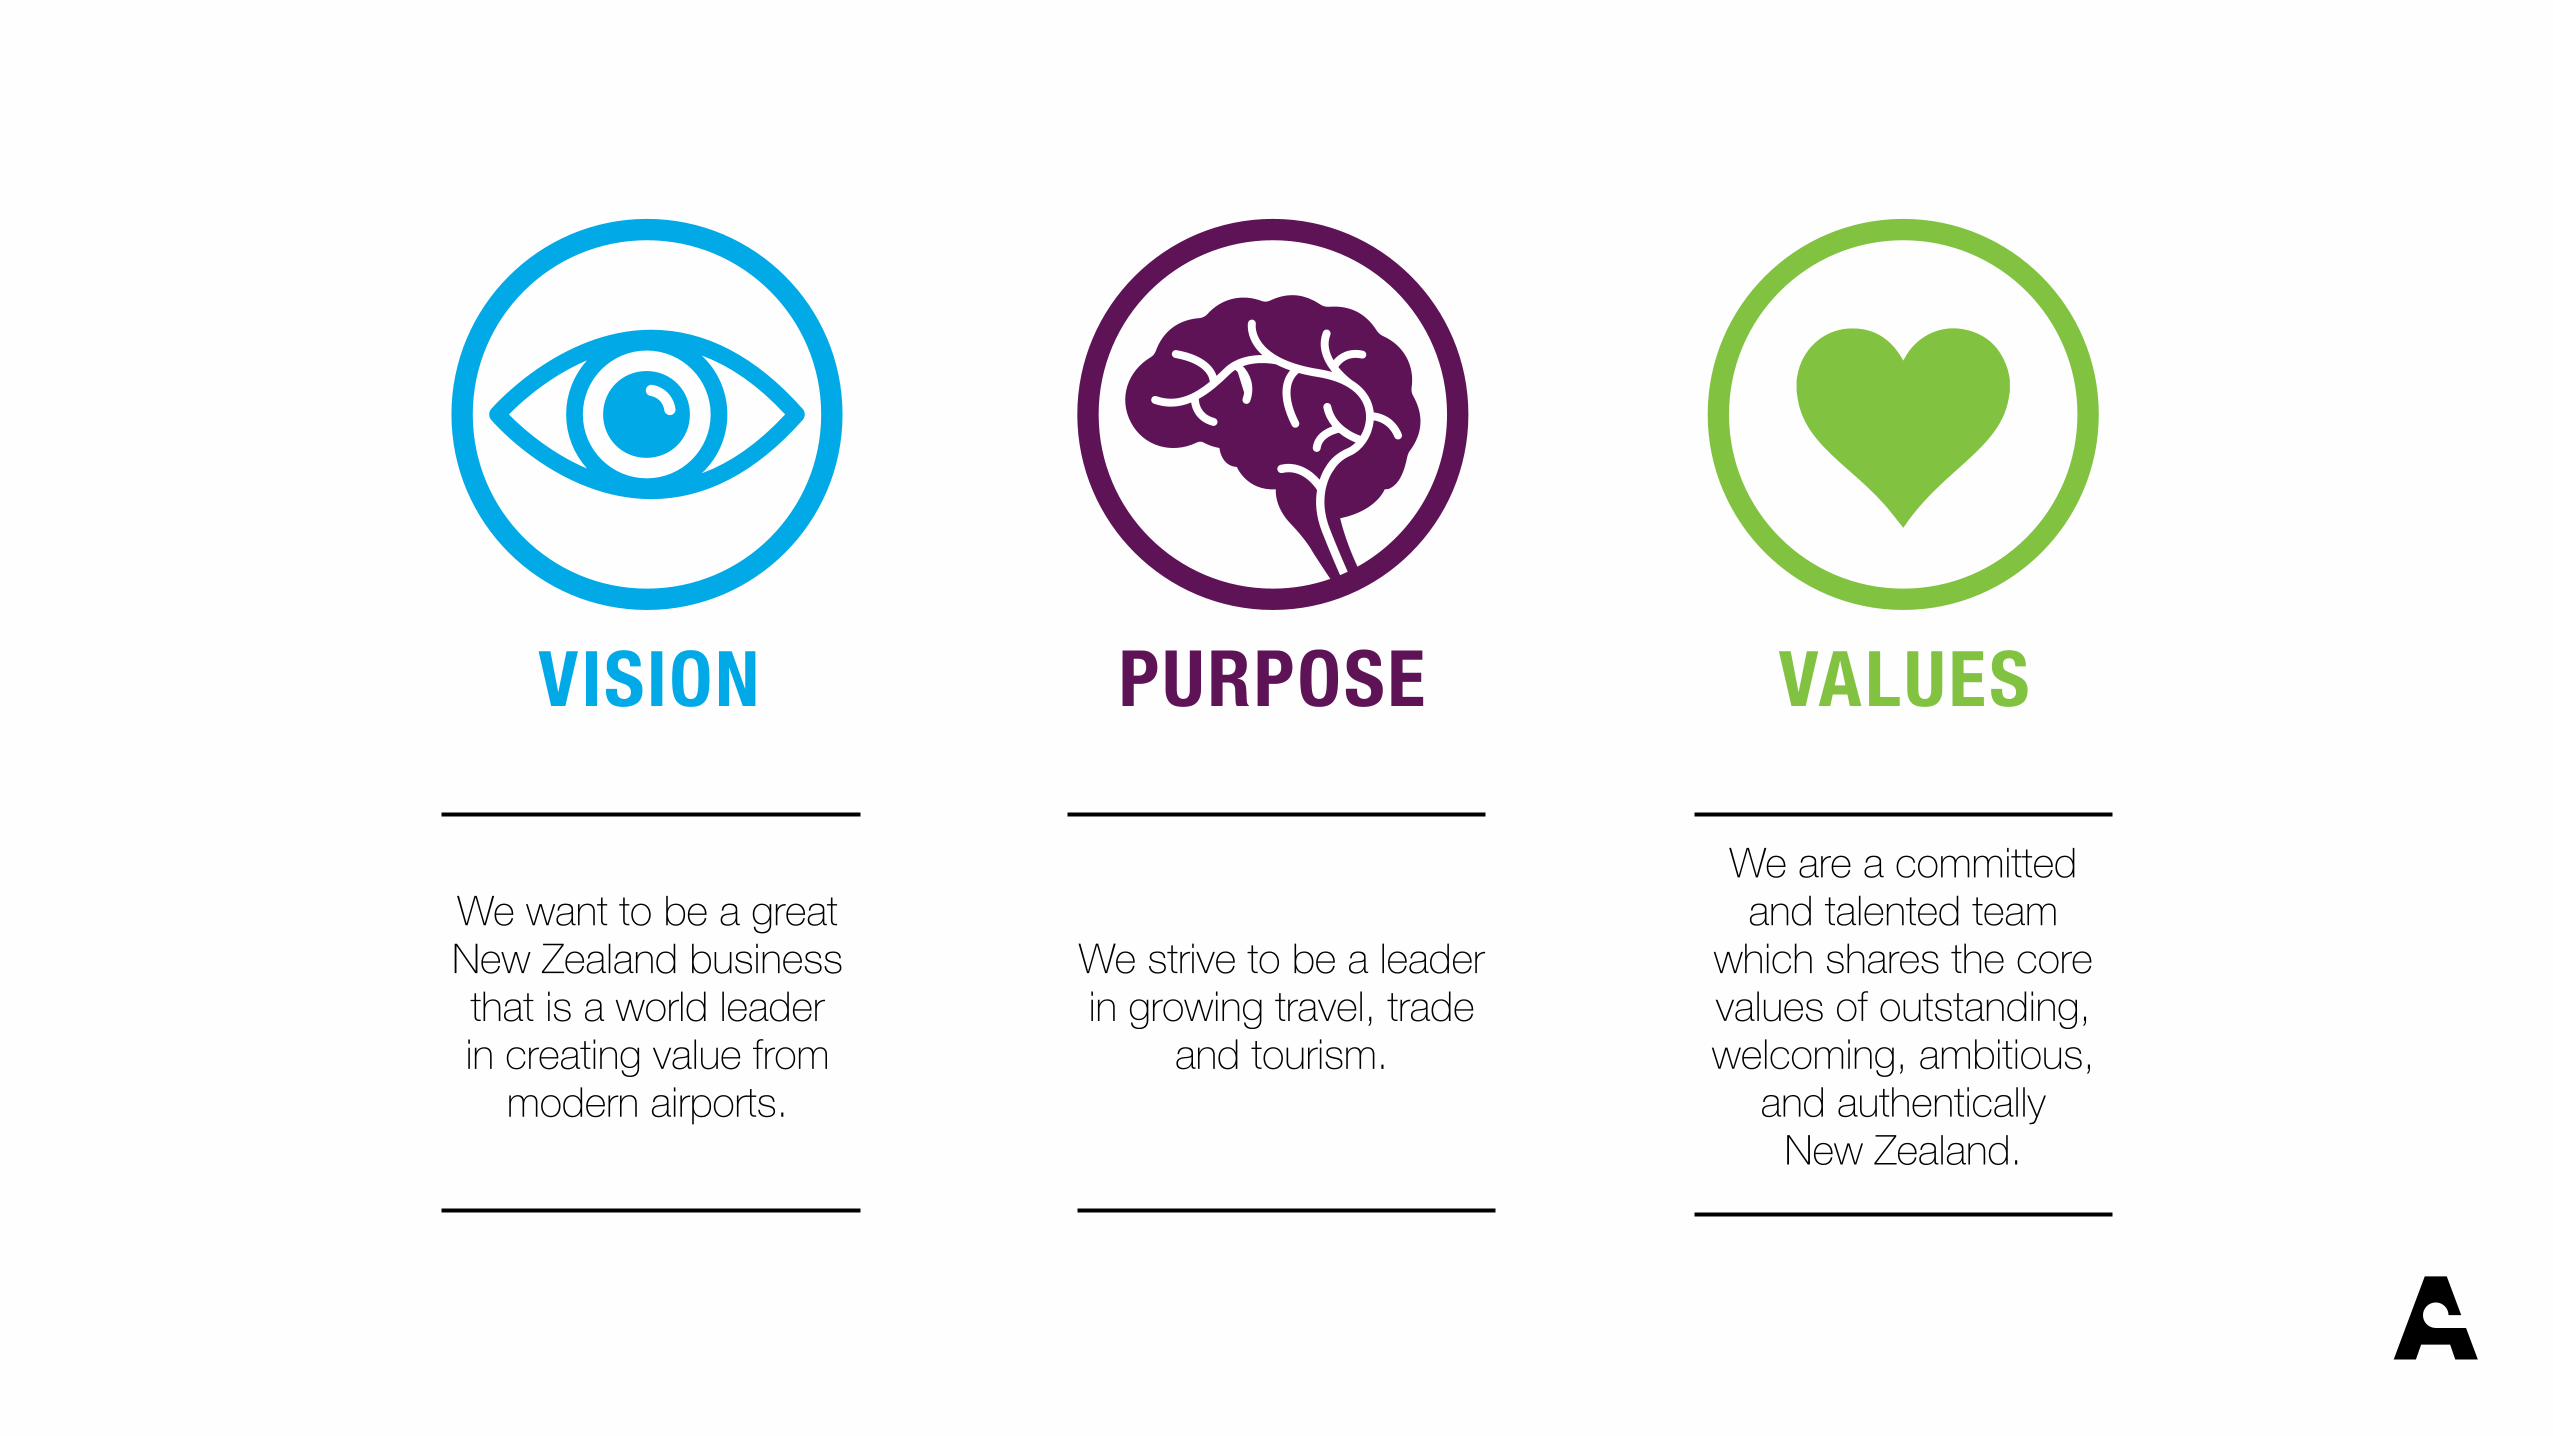
We want to be a great New Zealand business that is a world leader in creating value from
modern airports.
We strive to be a leader in growing travel, trade
and tourism.
We are a committed and talented team
which shares the core values of outstanding, welcoming, ambitious,
and authentically New Zealand.

MAKINGJOURNEYSBETTER


GROWTRAVEL
MARKETS
STRENGTHEN OUR
CONSUMERBUSINESS
BE FAST,EFFICIENT
& EFFECTIVE
INVESTFOR FUTURE
GROWTH

Adopt an ambitious and innovative approach to driving growth from Asia Pacific markets
Build opportunity to become an interregional hub
Influence travel industry policy and set ambitious industry goals
GROWTRAVEL
MARKETS
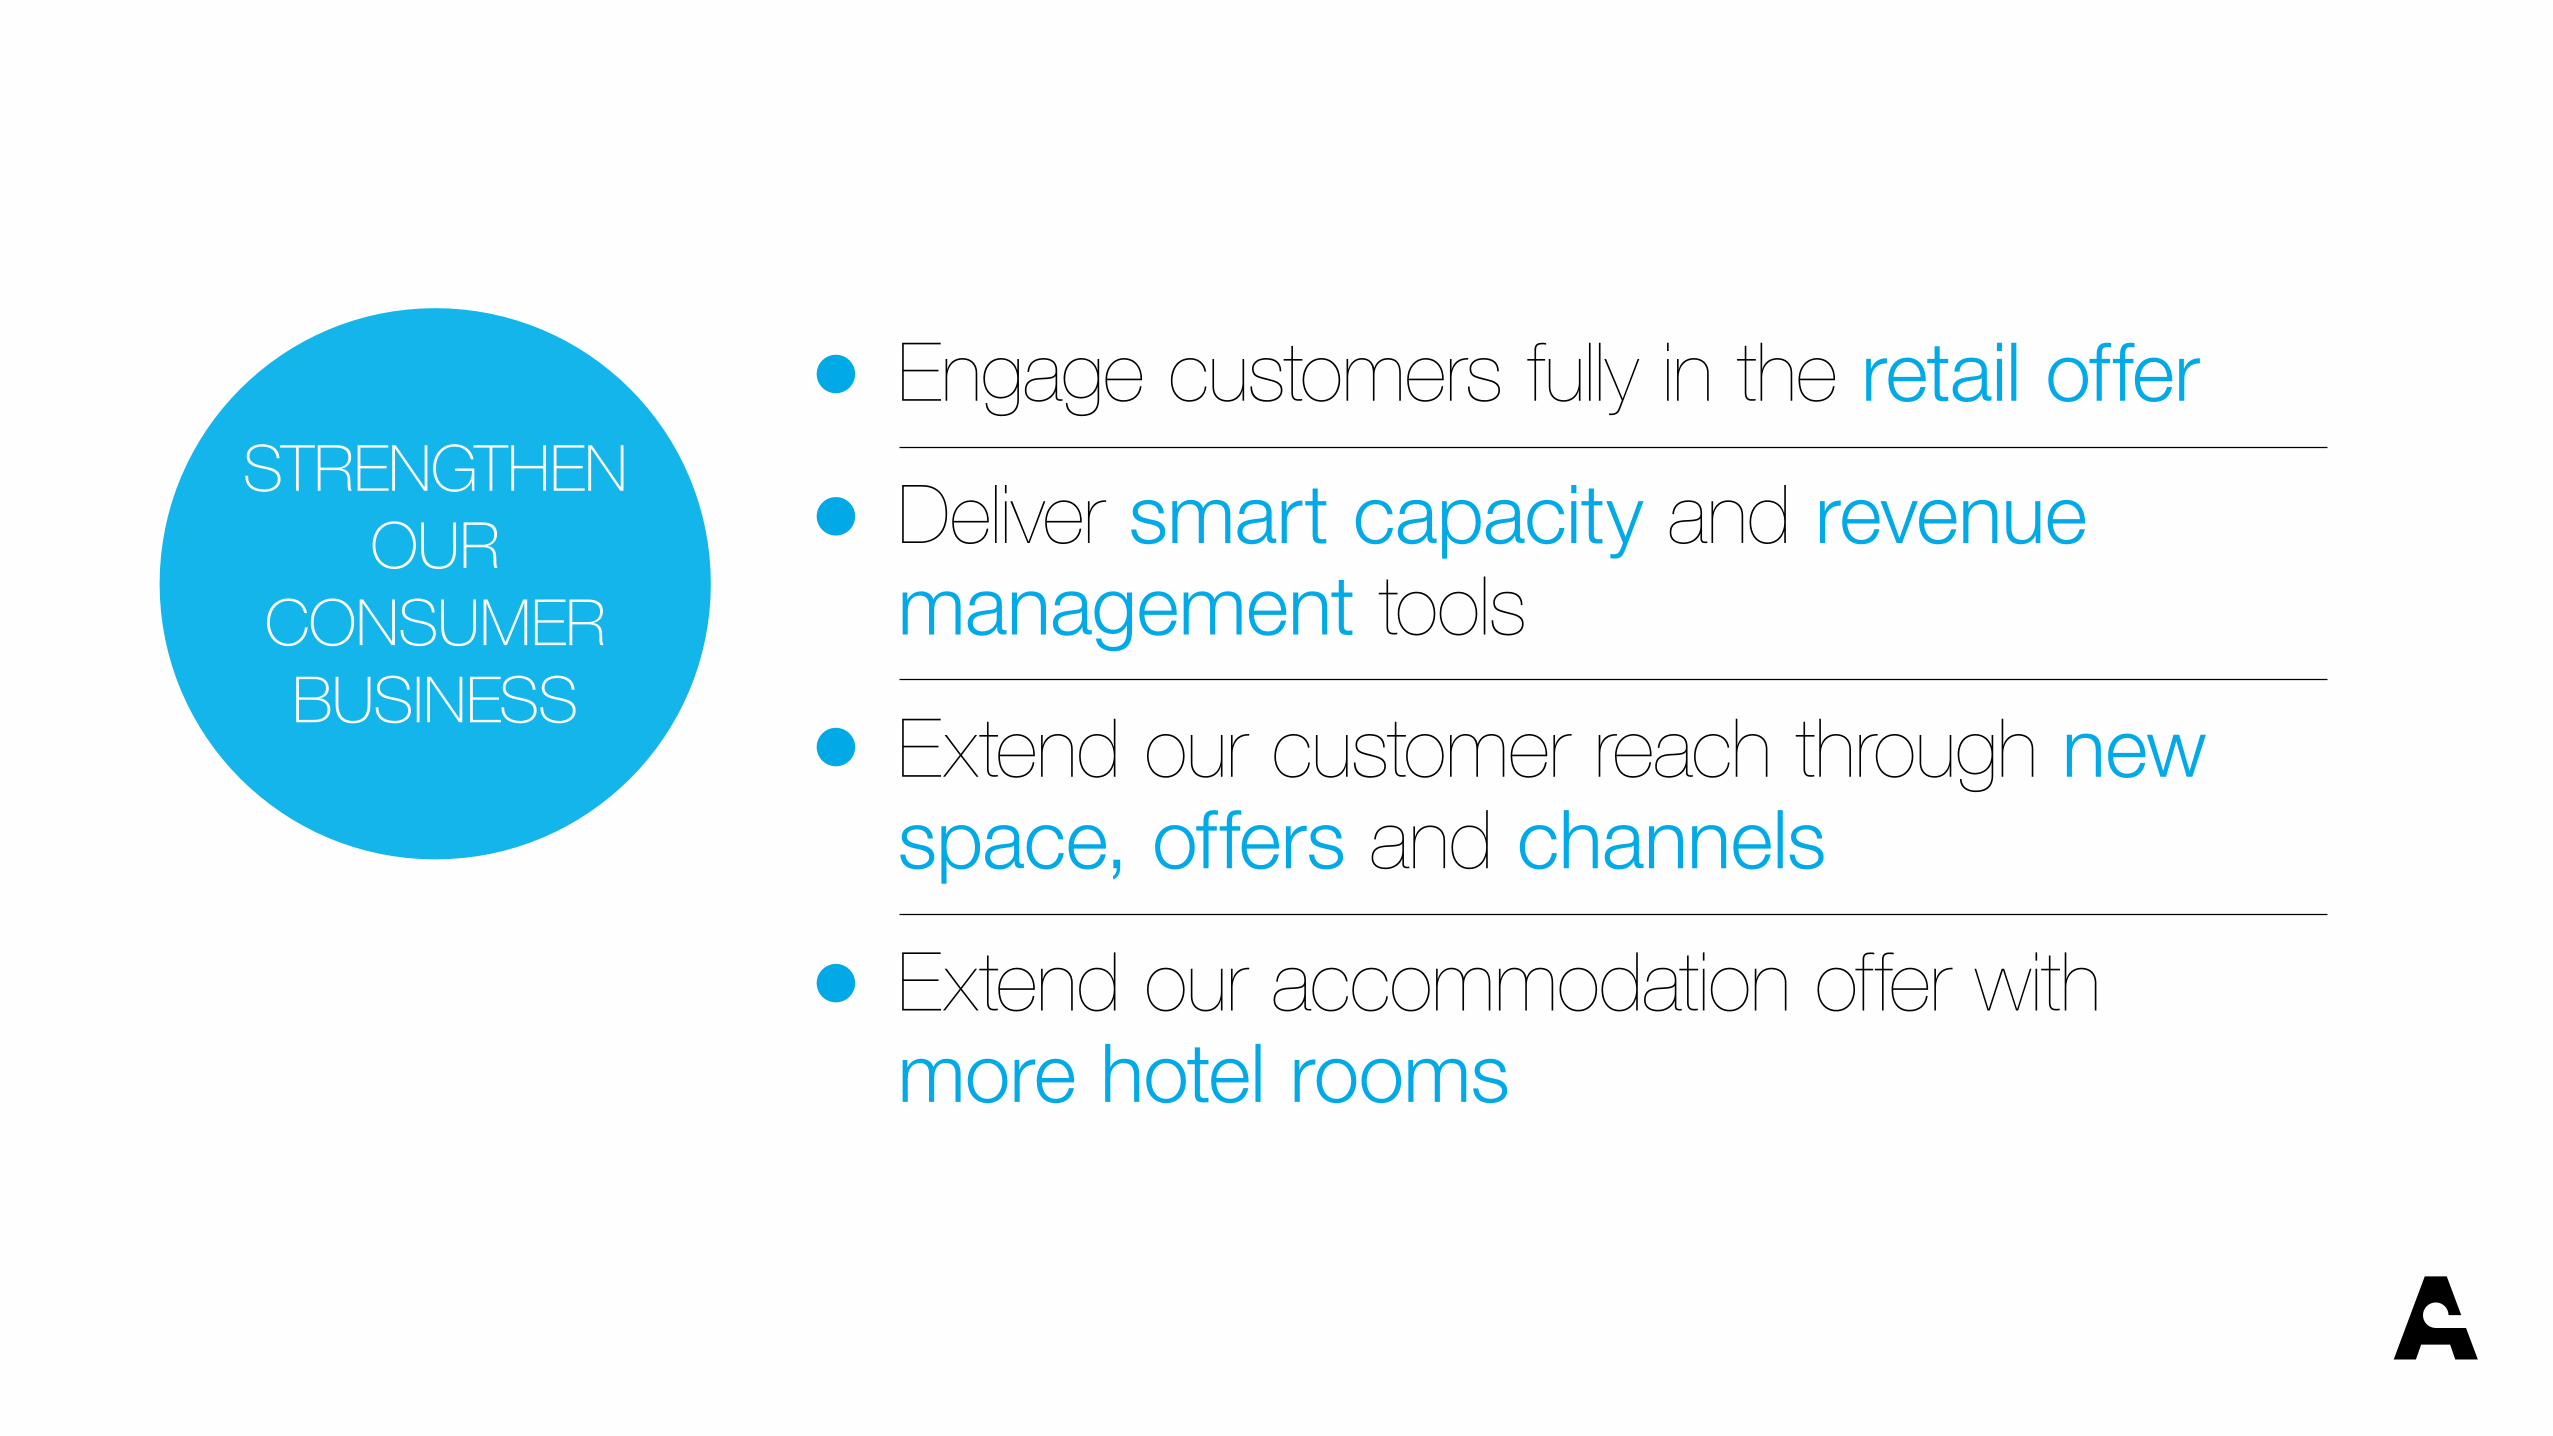
Engage customers fully in the retail offer
Deliver smart capacity and revenue management tools
Extend our customer reach through new space, offers and channels
Extend our accommodation offer with more hotel rooms
STRENGTHEN OUR
CONSUMERBUSINESS

Transform operating capability so we can be passengers’ favourite airport
Carefully manage our capital programme
Stronger effective cost control throughout the business
BE FAST,EFFICIENT
& EFFECTIVE

Secure our development pathway towards an efficient airport of choice for airlines
Build New Zealand’s greatest business location at Auckland Airport
Apply a disciplined approach to managing our investments
INVESTFOR FUTURE
GROWTH

GM aeronauticaloperations
Chieffinancialofficer
GM airport development
& delivery
GM retail & commercial
GM aeronauticalcommercial
GM corporate
affairs
GM property
CHIEFEXECUTIVE
GM marketing &
communications


Investor Day 2013Auckland InternationalAirport Limited
Developing Markets

Investor Day 2013
Developing Growth Market Structure
Grow Travel & Trade Markets
A Key Theme of Faster, Higher Stronger
• Today’s presentation is to cover four areas that
are part of our approach to developing growth.
• Building Auckland Airports position as an inter-
regional hub.
• Ambition and innovation as a catalyst for industry
alignment to growth strategies.
• Market understanding/influence and alignment to
aviation economics to create the right value
triggers for higher growth. - India Case Study
• Building marketing and conversion assets to
create market outcomes and scale for greater
long term benefits.

Investor Day 2013
Strong Potential Growth
Building “Southern Link” position
• Building Link to Emerging Power Hubs e.g. CAN
CGK, GRU
• Connectivity to growth markets in Asia/India
through hubs e.g. KUL, SIN, CAN
• Building Premium Value Positioning in
Asia/Europe
• Linking Australasia/Asia to Americas. USA,
Canada, Chile, Brazil
• Market Share Development Australia/Dual/ME to
increase loads.
• Growing Australia Regional Direct

Investor Day 2013
Strong Potential Growth
Building “Southern Link” position
CAN
AKL
EZE
LHR
CDG
AMS
Japan
MEL
BNE
CNS
PER
DEL
Guangzhou – Auckland
SYD

Investor Day 2013
Strong Potential Growth
Building “Southern Link” position

Investor Day 2013
Strong Potential Growth
Building “Southern Link” position
440 Cities are to Deliver 47% of Global GDP Growth to 2025.
Other Emerging Cities will account for 27% of GDP Growth
.

Investor Day 2013
Ambition 2020
Building Arrivals to 4 Million by
2020
• Developing “HOT” markets for
Growth
• Creating Profitable Market
Structure
• Influencer Partnerships to Build
Scale and Category Value

Investor Day 2013
Ambition 2020: View of Future Customer
2012
Actual Scenario 1 Scenario 2 Scenario 3 Scenario 1 Scenario 2 Scenario 3
Australia 1,156 1,487 1,566 1,665 3.2% 3.9% 4.7%
China 197 452 483 573 10.9% 11.9% 14.3%
UK 190 206 213 228 1.0% 1.5% 2.3%
USA 178 230 243 256 3.3% 4.0% 4.7%
Japan 72 81 97 100 1.4% 3.7% 4.2%
Germany 64 76 76 83 2.2% 2.3% 3.4%
Korea 53 57 67 86 1.0% 3.0% 6.2%
Canada 46 56 56 64 2.3% 2.4% 4.0%
Singapore 36 39 45 50 1.0% 2.6% 4.0%
India 30 53 58 69 7.3% 8.7% 11.0%
Malaysia 29 35 42 51 2.1% 4.5% 7.1%
Hong Kong 26 30 34 35 1.7% 3.2% 3.5%
France 25 31 33 34 2.6% 3.5% 4.0%
Argentina, Brazil, Chile 21 40 50 73 8.4% 11.5% 16.8%
Taiwan 19 20 22 24 0.9% 2.0% 3.2%
Thailand 17 20 20 22 2.2% 2.0% 3.5%
Indonesia 12 18 33 39 5.0% 13.2% 15.5%
Philippines 10 15 21 26 5.8% 10.0% 13.0%
Other Countries 374 473 516 561 3.0% 4.1% 5.2%
TOTAL 2,555 3,418 3,674 4,039 3.7% 4.6% 5.9%
2020 CAGRS
Country
000s Visitors to New Zealand
More than US,
UK & Germany combined
+

Investor Day 2013
Ambition 2020: View of Future Customer

Investor Day 2013
Construct Near Term View
274516 272048
330299
422452
522968
600000
YE Jun 2009 YE Jun 2010 YE Jun 2011 YE Jun 2012 YE Jun 2013 YE Target 2014
Growth in Chinese Traffic to Auckland Airport
YE Jun 2009 YE Jun 2010 YE Jun 2011 YE Jun 2012 YE Jun 2013 YE Target 2014
90%2009-2013
Target 15% Growth
(current 20%+)

Investor Day 2013
Ambition 2020: Size the Prize
Investor Day 2013
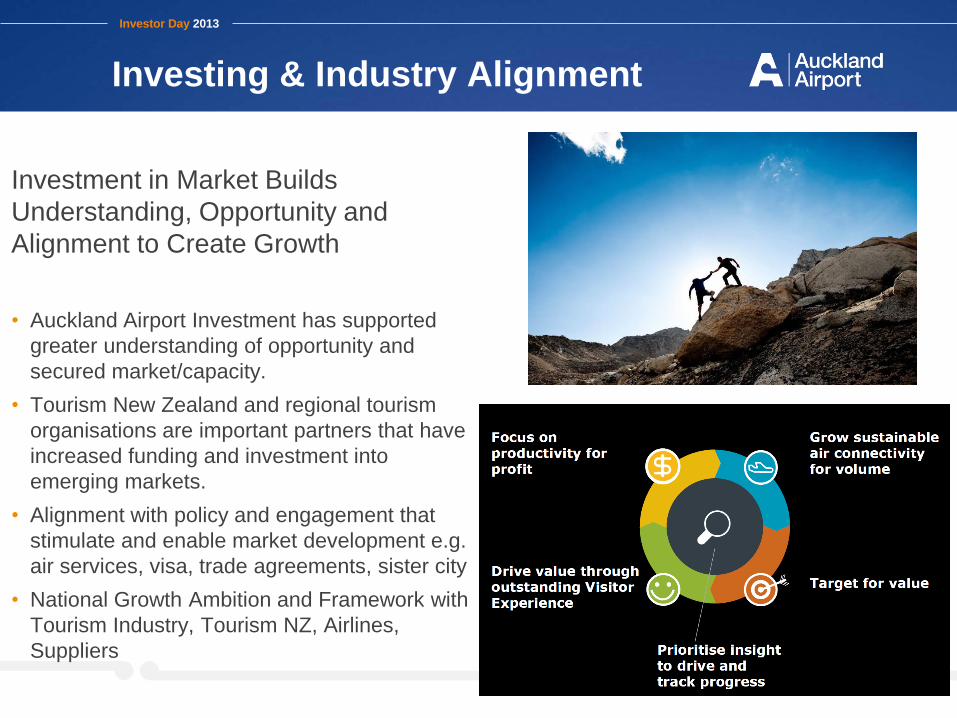
Investing & Industry Alignment
Investment in Market Builds
Understanding, Opportunity and
Alignment to Create Growth
• Auckland Airport Investment has supported
greater understanding of opportunity and
secured market/capacity.
• Tourism New Zealand and regional tourism
organisations are important partners that have
increased funding and investment into
emerging markets.
• Alignment with policy and engagement that
stimulate and enable market development e.g.
air services, visa, trade agreements, sister city
• National Growth Ambition and Framework with
Tourism Industry, Tourism NZ, Airlines,
Suppliers

Investor Day 2013
Ambition 2020: Growing India to $200M

Investor Day 2013
Ambition 2020: Understand Drivers

Investor Day 2013
Understand Market Share and Players
Other NZ Ports20%
SQ 35%
MH 24%
TG 8%
CX 6%
Other 7%
Auckland Airport
80%
Investor Day 2013
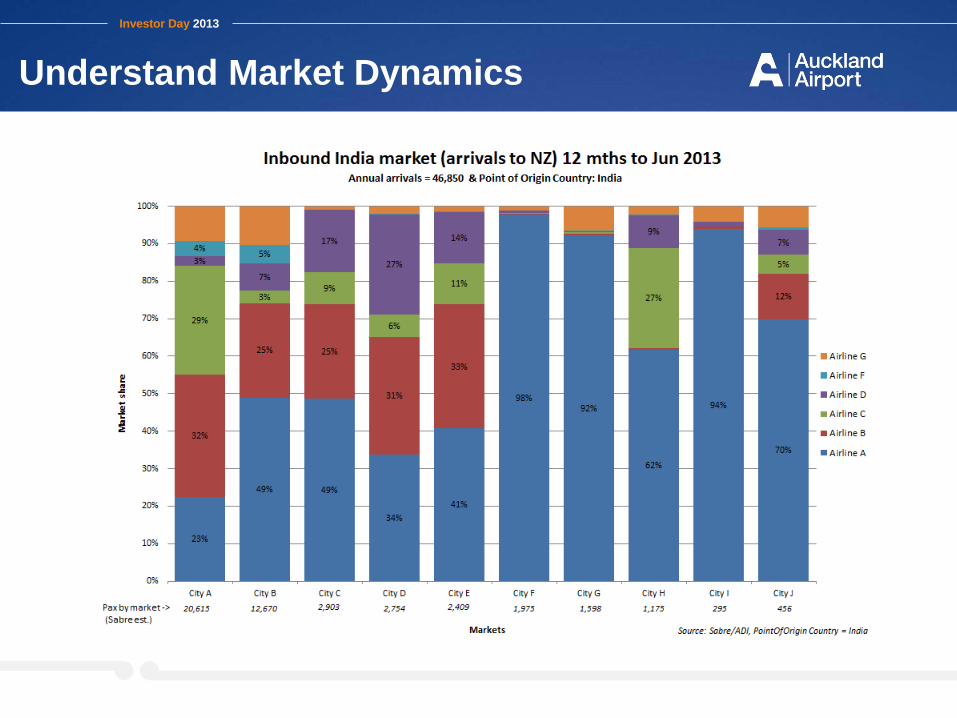
Understand Market Dynamics

Investor Day 2013
Understand Airline Dynamics
One-Stop One-Airline Travel between Auckland and India
• ARR – 35.83% market share, Ranked #2 Airline
• DEP – 37.55% market share, Ranked #2 Airline
One-Stop One-Airline Rank to/from Individual Indian Cities:
Connections
• MH has 6 services a week between AKL and KUL
• MH then has:
• 12 services a week between KUL and Mumbai; and
• 7 services a week between KUL and Hyderabad; and
• 12 services a week between KUL and Delhi
• The Mumbai flights connect well to AKL but only well on two days from Auckland
• The Delhi flights connect poorly from Auckland but well to Auckland.
• The Hyderabad flights connect well 3 days a week but poorly on the other days.
Route Sum of Passengers Market Size Share Rank
DEL 19,995 47,541 42.1% 1
BOM 7,868 28,461 27.6% 2
HYD 3,147 4,130 76.2% 1
MAA 2,443 6,202 39.4% 1
BLR 2,232 5,225 42.7% 2
Total India-AKL (Two Ways) 35,685 97,486 36.6% 2
Malaysian Airlines for example
Passengers travelling between Auckland and India for the 12 months ending 31 May 2013
Passengers Share Rank
Arrivals: 19,374 28.90% #2
Departures: 17,222 30.62% #2
Total: 36,596 29.69% #2
Source: Sabre/ADI

Investor Day 2013
Understand Connection Dynamics
AKL -> KUL -> India
18 hours 0 mins --W-F--
09:20 MH174 11:45
13:15 MH 130 20:40 (Mo,Tu,We,Fr,Su) BOM
(Tu,Th,Su)
20:10 MH 194 22:45
(Daily)
AKL KUL HYD
22:15 MH 198 23:55 17 hours 10 mins -T-T--S
(Daily)
00:15 MH132 07:40 17 hours 55 mins ---W-FS-
(We,Fr,Sa) 08:40 MH 172 11:40
(Mo,We,Fr,Sa,Su) DEL
18:30 MH 190 21:20
(Daily)
Connection Time
Less than 6 hours
> 6 hours but < 12 hours
>12 hours, no connection or less than 1 hour
hours mins Total Flight Time
MTWTFSS Connecting services days

Investor Day 2013
Understand Connection Dynamics
Connection Time
Less than 6 hours
> 6 hours but < 12 hours
>12 hours, no connection or less than 1 hour
hours mins Total Flight Time
MTWTFSS Connecting services days
India -> KUL -> AKL
16 hours 35 mins M-W----
20:20 MH 175 12:40
11:45 MH 131 21:45 (Mo,Tu,We,Fr,Su) BOM
(Mo,We,Sa)
16 hours 20 mins M-WT---
7:30 MH 195 23:55
(Daily)
AKL KUL HYD
07:35 MH 199 00:45 15 hours 30 mins -T-TF--
(Daily)
22:45 MH 133 08:45 16 hours 30 mins M-W--S-
(Tu,Th,Fr) 20:45 MH 173 12:45
(Mo,We,Fr,Sa,Su) DEL
17 hours 20 mins M-WT---
06:45 MH 191 23:00
(Daily)
Investor Day 2013
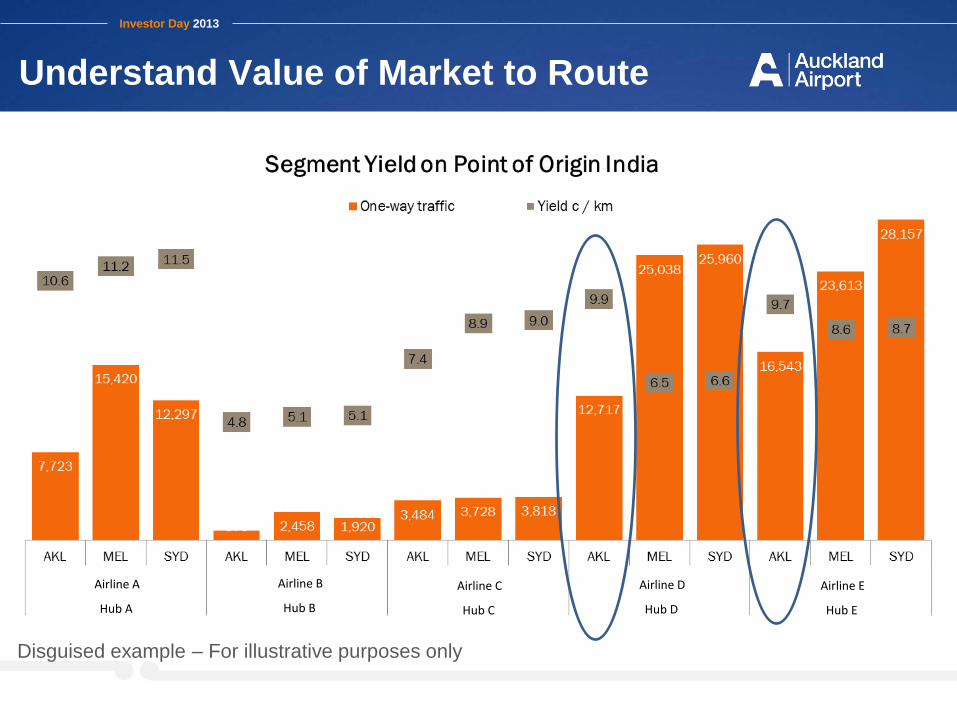
Understand Value of Market to Route
Airline A
Hub A
Airline B
Hub B
Airline C
Hub C
Airline D
Hub D
Airline E
Hub E
Disguised example – For illustrative purposes only

Investor Day 2013
Connect Fares to Future Customers
AIA /TNZ/Airline JV
FIT/digital space/family market: agents, airline JV
Honeymoon market

Investor Day 2013
Know Where to Target Future Customer

Investor Day 2013
Know Worth of Target Future Customer

Investor Day 2013
Know Which Target Future Customer

Investor Day 2013
Know Which Target Future Customer
0
1,000
2,000
3,000
4,000
5,000
6,000
7,000
8,000
Under 15 15 To 24 25 To 34 35 To 44 45 To 54 55 To 64 65+
Other
Education/Medical
Business
Visit Friends And Relatives
Holiday

Investor Day 2013
Know Wants of Target Future Customer
Investor Day 2013
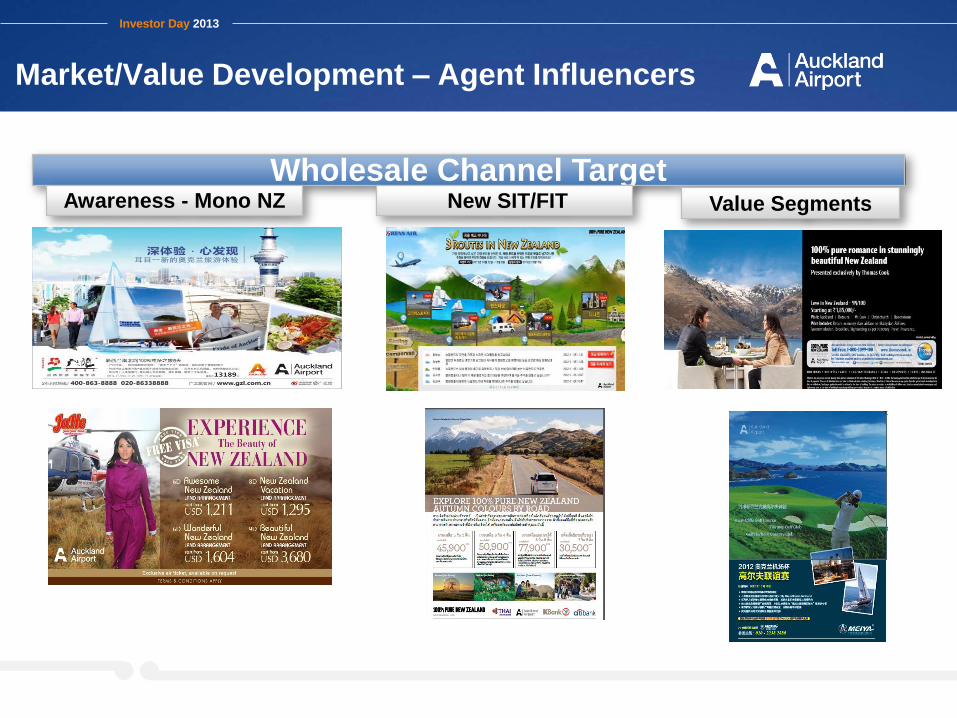
Market/Value Development – Agent Influencers
Wholesale Channel TargetNew SIT/FIT Value SegmentsAwareness - Mono NZ

Investor Day 2013
Building Marketing Assets with Partners
Marketing Conversion AssetsChina
TV/Digital/Print
Build value, partners & seasonality - trusted
advice with supporting channel offers
TV/Film/Digital/Print
Build awareness , partners & NZ demand -Preferred
source of info & offers for China
Digital/PRBuild awareness ,
partners & demand Premium Mkt- #1 Luxury
Source NZ
Other Asia
14% Pax Growth Indo - Facebook Pop = 47M India – Facebook Pop = 61M Malay- Facebook Pop = 18M
Website 100,000 page views and 3,500 Database
10,000 App Users
#1 Australasian Facebook Fanbase in
Indonesia 65K
Digital/PRBuild awreness, partners
& demand FIT Mkt-#1 FIT Source NZ
New Zealand
Digital/PRBuild awareness,
partners & demand Premium?FIT Mkt =
#1Source NZ India/Malaysia
Digital/Print/PRBuild awareness ,
partners & demand Premium Mkt- #1 Luxury
Source NZ Indonesia
Indonesia India/Malaysia
Social Media Fanbase 50,000 (TNZ 140,000) -
50% Growth in Premium Class Sales
Website 200,000 page views & 22M Impressions
Database 2000
18% Pax Growth #1 World Netizens 525M #1
Online Shoppers 228M #1Airport & Luxury Country
Offer Awareness 20-40% - Advertsing Recall
7% with 34-48% Positive Impact
Website 20,000 page views and drove #1
Sales Promotion period for Airlines
45% Share of Sales 50% Growth Business Class
Partner Funding $750K
Investor Day 2013
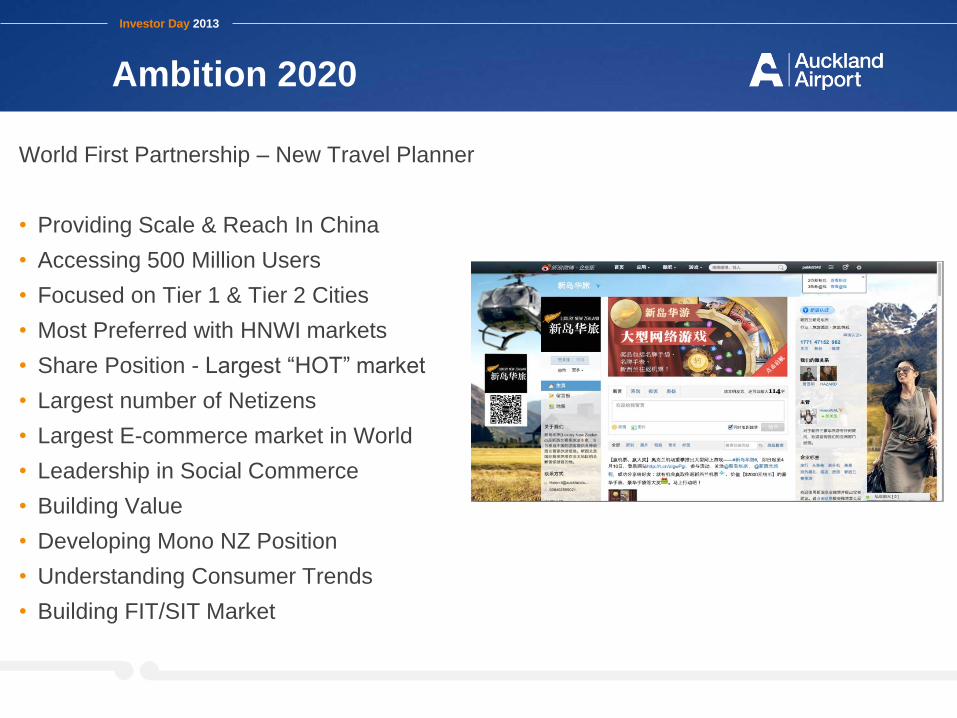
Ambition 2020
World First Partnership – New Travel Planner
• Providing Scale & Reach In China
• Accessing 500 Million Users
• Focused on Tier 1 & Tier 2 Cities
• Most Preferred with HNWI markets
• Share Position - Largest “HOT” market
• Largest number of Netizens
• Largest E-commerce market in World
• Leadership in Social Commerce
• Building Value
• Developing Mono NZ Position
• Understanding Consumer Trends
• Building FIT/SIT Market

Investor Day 2013
Our
30-year vision

Philosophy
• Playing our part to enable New Zealand growth
• Demand led
• Customer focused: airlines and passengers
• Commercially focused
• Connected to the city
• Asia-Pacific regional player
• Principles based: efficient, resilient and flexible

Aims
• Planned
• Affordable
• Stageable
• Implementable
• Permits future change
• Considers environmental and community needs

Process
• International expertise: SOM and ARUP
• Themes– Improving domestic capacity and passenger experience
– A hub for Australasia, to & from Asia and the Americas
– New Zealand’s best business location
• Industry engagement has now commenced
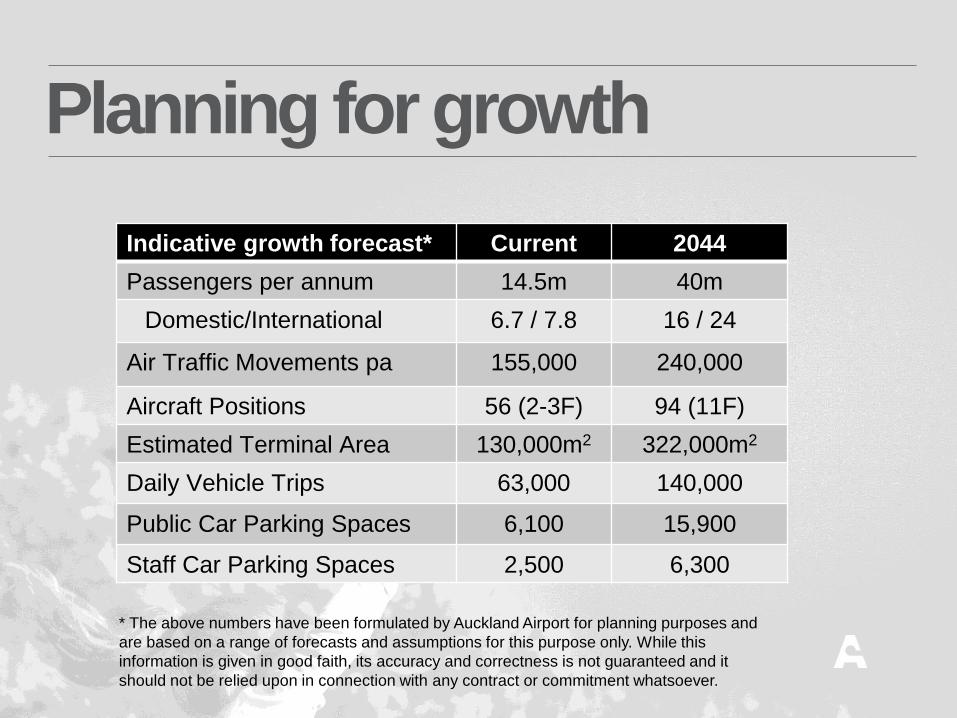
Indicative growth forecast* Current 2044
Passengers per annum 14.5m 40m
Domestic/International 6.7 / 7.8 16 / 24
Air Traffic Movements pa 155,000 240,000
Aircraft Positions 56 (2-3F) 94 (11F)
Estimated Terminal Area 130,000m2 322,000m2
Daily Vehicle Trips 63,000 140,000
Public Car Parking Spaces 6,100 15,900
Staff Car Parking Spaces 2,500 6,300
Planning for growth
* The above numbers have been formulated by Auckland Airport for planning purposes and
are based on a range of forecasts and assumptions for this purpose only. While this
information is given in good faith, its accuracy and correctness is not guaranteed and it
should not be relied upon in connection with any contract or commitment whatsoever.

Airfield
• Challenges– Growth increases congestion, aircraft delay and airline costs
– Bigger and next generation aircraft require more space
• Opportunities– Creating a hub airport for Australasia, to and from Asia and
the Americas
– Space for dual code F taxiways and taxilanes for efficient future aircraft movements
– Land holding size enables a cost effective future runway
– Our expectation remains that a second runway is required in 2025 (+ 3 years)

Investor Day 2013

Terminal precinct
• Challenges– Growth can make terminal precincts and forecourts
unpleasant and disorientating
– Providing right passenger experience
• Opportunities– Relatively unobstructed state of international terminal
provides rare opportunity to create a uniquely New Zealand
environment
– Flexibility to respond to aviation demands
– A southern domestic terminal integrated with the international
terminal for more convenience and higher productivity
– Highly efficient, flexible and stageable

Surface transport
• Challenges– Growth means more pressure on land transport system
– Journey time reliability
– Mixing of aviation infrastructure and geography
• Opportunities– Provide people with a range of travel options that meet their
needs (a multi-modal system)
– Allowance for rapid transit connected to the wider Auckland
transport network
– Ring road to separate commercial and passenger traffic

Affordability
• Our 30-year vision is not a confirmed capital
expenditure plan
• Delivery of investment will be trigger led, subject
to optimisation through detailed planning and
design and supported by a business case
• Aeronautical investment expected to be staged to
provide a reasonable price path and a fair return

Our high-level estimate:
• A $2.4 billion investment in New Zealand’s core
infrastructure over 30 years (in today’s dollars).
This is based on forecast passenger growth and
would result in a similar asset intensity in 2044
to today (in today’s dollars)
Where to from here
• Key stakeholder engagement and briefings
• Publish vision in the new year
• Design of terminal capacity with industry
consultation
• Deliver terminal capacity

Preliminary conclusions
• Auckland Airport has – The land holding to provide Auckland’s and New Zealand’s
aviation needs for the foreseeable future
– The land to enable capacity growth solutions in an efficient,
resilient and flexible way
• A resilient airport system that responds to demand– Integrated terminal with domestic in the south
– Runway disconnected from terminal space requirements
– Creates the ability for faster connections, swing gates and
utilisation of existing baggage make-up facilities
– Long-term path is stageable and affordable

Investor Day 2013Auckland InternationalAirport Limited
Be Fast, Efficient and Effective - Aeronautical Operations

Investor Day 2013
Fast, Efficient and Effective Operations
• Carefully managed operations at Auckland is core to our
business – it earns us the right to do everything else that
we do.
• Being fast, efficient and effective is all about improving our
performance by increasing the productivity of our assets,
processes and operations.
• This requires us to know our business inside out and track
performance much closer to real time so we can identify
and weed out inefficiency or under performance.
• This requires successful collaboration with all operational
partners and excellence in data management.

Investor Day 2013
Benefits for Customers, Airlines, Stakeholders and Investors
• Driving efficiency and productivity in operations has benefits for
multiple stakeholders:
Passengers with higher satisfaction levels
Airlines through our lower capital investment
requirements
Lower cost of operations for stakeholders and
operators at the airport
Improved ability to grow revenues from a higher quality
passenger dwell
• Excellence in operations requires the team to respond quickly to
short-term unplanned events, manage the daily volume peaks
and requirements as well as undertake planning for long term
efficiency gains
• Some examples of the multiple facets of our drive for efficiency
follow:
Investor Day 2013
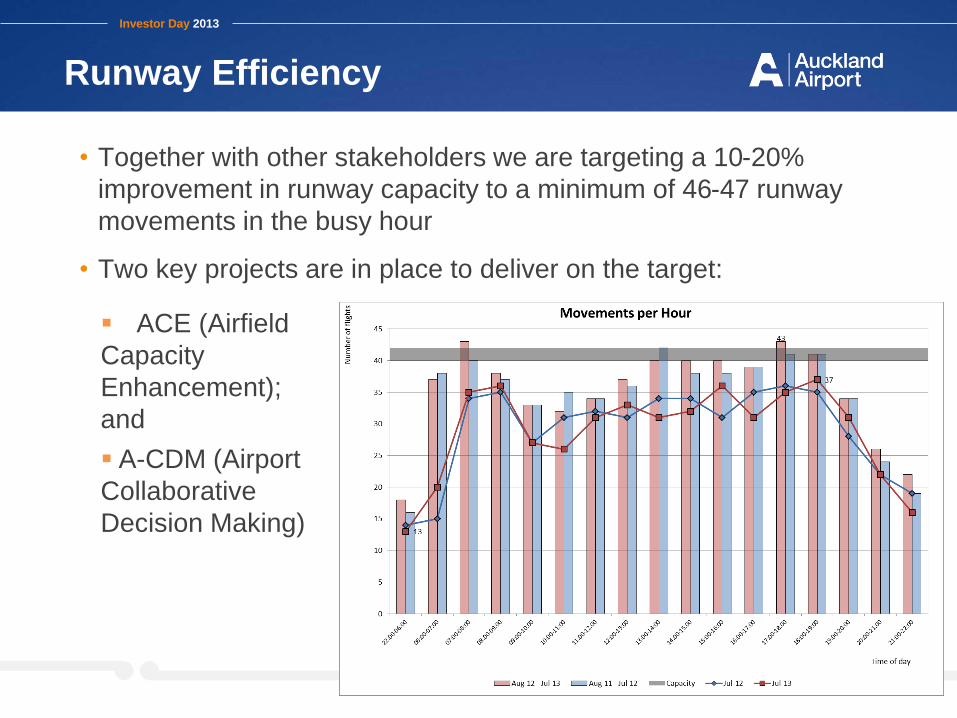
Runway Efficiency
• Together with other stakeholders we are targeting a 10-20%
improvement in runway capacity to a minimum of 46-47 runway
movements in the busy hour
• Two key projects are in place to deliver on the target:
ACE (Airfield
Capacity
Enhancement);
and
A-CDM (Airport
Collaborative
Decision Making)

Investor Day 2013
Airspace Efficiency
• Auckland Airport is a centre of economic activity, generating jobs and
driving tourism, trade and travel. Aircraft noise is an inevitable
consequence of operating a busy international airport.
• SMART Approaches are part of innovative developments within the
aviation industry and both Airways and the Airlines involved saw the
trial as an important trial of this emerging technology.
• Recently, awareness of aircraft over flight noise was heightened for
the Epsom/Onehunga/Royal Oak community due to a 12 month trial
on new ‘SMART Approaches’.
• The trial concluded this week and a full analysis is to be undertaken of
the potential benefits of these tracks, in terms of community impact,
noise, track miles, reduced emissions and fuel savings.
• The draft review of the trial will be released by the end of March 2014
and community and industry feedback on the draft recommendation
will be sought.

Investor Day 2013
Apron Efficiency
• Taxiway Lima was completed in July 2013. We are now
optimising operations to alleviate apron congestion at Pier
A.
• We are now also working on improving apron congestion
through optimisation of ground service equipment
efficiency and space utilisation.

Investor Day 2013
Data Management
• We have committed to an investment in a new airport operating system
platform and passenger tracking tools to greatly improve our ability to
collaborate with all companies and agencies at the airport to manage in
real time.
• The new operating platform is in the development stage with full
introduction expected mid 2014.
• This new platform will allow greater tracking of the passenger journey
and provide us with the ability to adjust in real time to the inevitable
operational variation of forecast to actual events.
0
5
10
15
20
25
0
5
10
15
20
25
30
Jun
-12
Jul-
12
Au
g-1
2
Sep
-12
Oct
-12
No
v-1
2
De
c-1
2
Jan
-13
Feb
-13
Mar
-13
Ap
r-1
3
May
-13
Jun
-13
Nu
mb
er
of
inte
rru
pti
on
s
Inte
rup
tio
n d
ura
tio
n (
ho
urs
)
Interruptions to Material ServicesJune 12 - June 13
Duration (hours) Number of interruptions
A regulatory measure
where a key service
(e.g. Air Bridge) is not
available for airline use
at a scheduled time

Investor Day 2013
Collaborative Operations
• In the past year we have established a new collaborative operations
group at Auckland Airport with border agencies, airlines and other
service providers working closely together to drive operational
improvements on a daily basis, a shift from solely a project focus to
business as usual.
• The collaborative operations group works with forecasts and historical
data, combined with real time data to ensure that operational planning
meets the requirements on the day, i.e. contingency for off-schedule
events.
• The collaborative operations group also identifies key projects to drive
continual improvements, following a well established lean methodology
approach.
• The collaborative operations group reports to a steering group of CEO’s
from the airport, airlines, agencies and service providers to report on
progress, gain commitment for improvements and set combined targets.

Investor Day 2013
Collaborative Operations – Building on Past Success
Challenges and gaps • Data sharing • Data – insufficient and some quality issues • Growing buy in from certain stakeholders• Moving from project focus to real time activity
KPI Apr 2010 Nov 2011 RWC June 2012 June 2013
Arrivals: 85% of Passengers processed within 25 min
64% 84% 90% 87% 82%
Departures:95% of Passengers processed within 12 min
89% 97% 99% 97% 97%
Successes • New pax tracking tool • Set passenger processing KPIs• Direct exit AU/NZ passports • Smartegate technology

Investor Day 2013
Operating Safely
• For regular passengers and tourist visitors to New
Zealand, we manage safety and risks and protect our
customers through the establishment of sound policy,
systems and routines.
• We are focussed on safety and incident preparation
management to prevent and mitigate unplanned events
for the safety of our customers, stakeholders and
employees to protect the wider NZ Inc. brand in the
tourism, trade and travel industry.

Investor Day 2013Auckland InternationalAirport Limited
Be Fast, Efficient and Effective – Managing Costs

Investor Day 2013
Be Fast, Efficient and Effective
• Efficiency and effectiveness goes to the heart of the productivity
of our assets
• That productivity includes the use of our investors’ money. We
respect your investment in Auckland Airport and aim to utilise
that cash effectively
Ensuring that our operating expenses do not grow
faster than our cost drivers
Efficient capital expenditure, rightly timed, seeking
synergies across capital investments and maximising
procurement savings to optimise the capital
investment.
Investor Day 2013
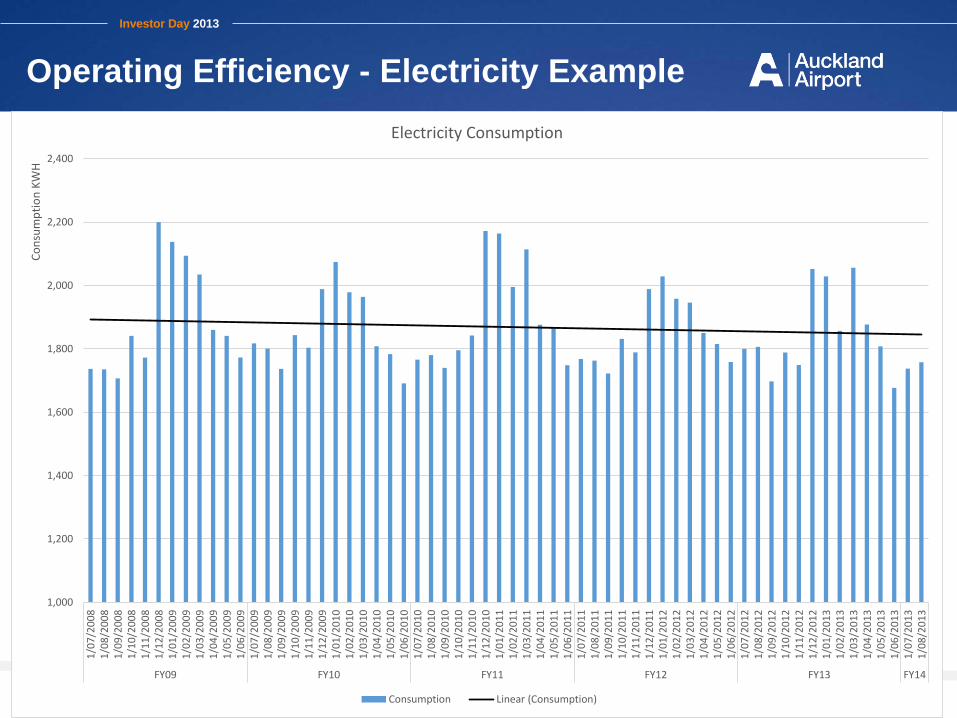
Operating Efficiency - Electricity Example
1,000
1,200
1,400
1,600
1,800
2,000
2,200
2,400
1/0
7/2
00
81
/08
/20
08
1/0
9/2
00
81
/10
/20
08
1/1
1/2
00
81
/12
/20
08
1/0
1/2
00
91
/02
/20
09
1/0
3/2
00
91
/04
/20
09
1/0
5/2
00
91
/06
/20
09
1/0
7/2
00
91
/08
/20
09
1/0
9/2
00
91
/10
/20
09
1/1
1/2
00
91
/12
/20
09
1/0
1/2
01
01
/02
/20
10
1/0
3/2
01
01
/04
/20
10
1/0
5/2
01
01
/06
/20
10
1/0
7/2
01
01
/08
/20
10
1/0
9/2
01
01
/10
/20
10
1/1
1/2
01
01
/12
/20
10
1/0
1/2
01
11
/02
/20
11
1/0
3/2
01
11
/04
/20
11
1/0
5/2
01
11
/06
/20
11
1/0
7/2
01
11
/08
/20
11
1/0
9/2
01
11
/10
/20
11
1/1
1/2
01
11
/12
/20
11
1/0
1/2
01
21
/02
/20
12
1/0
3/2
01
21
/04
/20
12
1/0
5/2
01
21
/06
/20
12
1/0
7/2
01
21
/08
/20
12
1/0
9/2
01
21
/10
/20
12
1/1
1/2
01
21
/12
/20
12
1/0
1/2
01
31
/02
/20
13
1/0
3/2
01
31
/04
/20
13
1/0
5/2
01
31
/06
/20
13
1/0
7/2
01
31
/08
/20
13
FY09 FY10 FY11 FY12 FY13 FY14
Co
nsu
mp
tio
n K
WH
Electricity Consumption
Consumption Linear (Consumption)

Investor Day 2013Auckland InternationalAirport Limited
Investing for Future Growth - Property

Investor Day 2013
The District - Land Holdings

Investor Day 2013
The District - Land Holdings
The size of Auckland’s CBD
fits easily into the land holding
of Auckland Airport

Investor Day 2013
The District - Precinct Plan
Investor Day 2013
Land Bank
• 314 hectares of land identified for airport commercial development.
• Land inventory is actively managed to ensure sufficient supply is
available to meet market demand
• Aim to have approximately 10 – 20 hectares of land ready for
commercial development.
Investor Day 2013
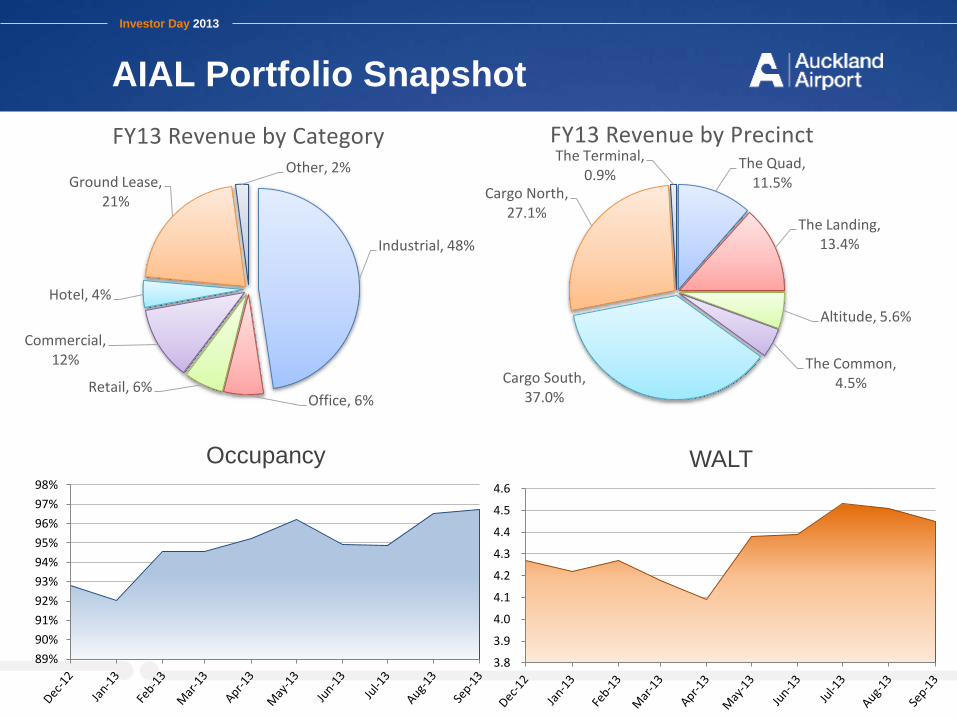
AIAL Portfolio Snapshot
Industrial, 48%
Office, 6%Retail, 6%
Commercial, 12%
Hotel, 4%
Ground Lease, 21%
Other, 2%
FY13 Revenue by CategoryThe Quad,
11.5%
The Landing, 13.4%
Altitude, 5.6%
The Common, 4.5%Cargo South,
37.0%
Cargo North, 27.1%
The Terminal, 0.9%
FY13 Revenue by Precinct
89%
90%
91%
92%
93%
94%
95%
96%
97%
98%
Occupancy
3.8
3.9
4.0
4.1
4.2
4.3
4.4
4.5
4.6
WALT
Investor Day 2013
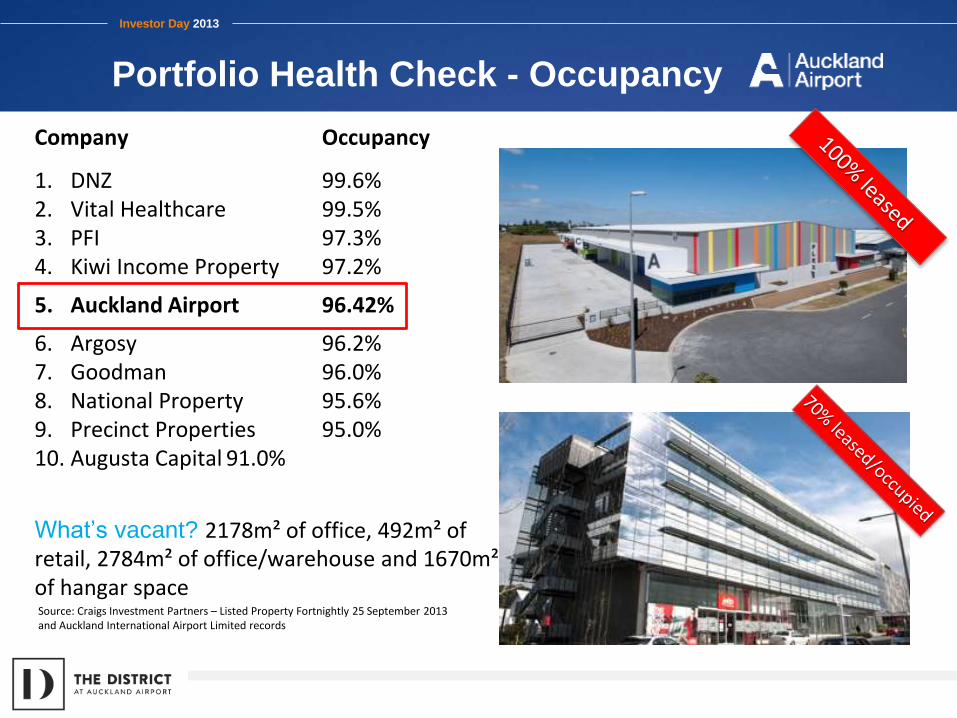
Portfolio Health Check - Occupancy
Company Occupancy
1. DNZ 99.6%2. Vital Healthcare 99.5%3. PFI 97.3%4. Kiwi Income Property 97.2%
5. Auckland Airport 96.42%
6. Argosy 96.2%7. Goodman 96.0%8. National Property 95.6%9. Precinct Properties 95.0%10. Augusta Capital 91.0%
What’s vacant? 2178m² of office, 492m² of retail, 2784m² of office/warehouse and 1670m² of hangar spaceSource: Craigs Investment Partners – Listed Property Fortnightly 25 September 2013 and Auckland International Airport Limited records

Investor Day 2013
Portfolio Health Check - WALT
Company WALT
1. Vital Healthcare 11.8 years2. Argosy 6.2 years 3. National Property 5.7 years4. Precinct Properties 5.7 years5. DNZ 5.6 years 6. PFI 5.5 years7. Goodman 5.3 years8. Augusta Capital 4.6 years
9. Auckland Airport 4.4 years
10. Kiwi Income Property 4.3 yearsSource: Craigs Investment Partners – Listed Property Fortnightly 25 September 2013 and Auckland International Airport Limited records

Investor Day 2013
Capability, Proposition & Track Record
• Developed capability, established proposition and established
development and management track record
• Over 150 years of Property Industry experience and knowledge
Returns Across Market Segments – © Investment Property Databank Ltd. All rights reserved.

Investor Day 2013
Initiatives – Keeping it Simple
Build More:
Rent
Hotels

Investor Day 2013
Property Strategy Phase 1 - 2009-2012
Kick-Start Development
• 2009 Strategy “Flightpath to Growth” – “Kickstart Property Development”
• Complete, committed or under construction, 2009 to 31 January 2013
NZD $225 million
21 projects
2 hotels
39,000m2 office/warehouse
7,000m2 office
1,600m2 retail
• 20 hectares land development, 4.4 hectares land acquired
• Plan Change 13/14 – Whole site within MUL/RUB, 100Ha+ rezoned
Business
• Rent Roll growth from $30.2m in 2008 to $44.0m as at 30 June 2013
• Developed capability, established proposition and built development and
management track record

Investor Day 2013
Market Demand Re-Emerging
Auckland Average Annual Absorption m2/annum (source CBRE Market
Outlook June 2013)
Period Non CBD Office Auckland Industrial
5 Years to 2007 39,102 316,776
5 Years to 2012 2,941 113,236
5 Years to 2017 25,141 195,879
Investor Day 2013
Auckland Plan Projections
Great Potential for The District
• Auckland Plan targets 5% annualised growth
• Auckland Plan forecasts Auckland will require:
1,400 hectares of additional business land and 12.5million m2 of new floor space by 2041
2,968,000 m2 office space/129,000 employees 6,067,000 m2 industrial space
• 64% of office demand expected in the Central Area and 16-17% in the Northern & Southern economic corridors (490,000 m2 of office space in the Southern corridor by 2041)
• “The airport, as a key transportation and distribution hub, will continue to be a major driver of business location, as will population growth, which is likely to be strongest in the southern parts of Auckland over the next 30 years”
-Auckland Plan

Investor Day 2013
Phase 2 – 2012+ Transformation
Objective
Change perception of location and strengthen workforce
proposition
Build non-travel footfall
Create development momentum
• First round of physical interventions complete 2012/2013
• 2013 + promotion and marketing

Investor Day 2013
Phase 2 – 2012+ Transformation
• Place – based strategy to create New Zealand’s greatest business
location
• Moving from a collection of projects and investments to a place and a
community
• Interventions:
• Physical Interventions – landscape entrance features and
connections
• Amenities – sculpture park, playing field, playground and mountain
bike trail, retail
• Landmark buildings
• Events
• First stage released October 2013

Investor Day 2013
Build NZ’s Best Business Location
Leveraging our PLACE based strategy, as we plan, develop, deliver, build,
lease and manage the District, to build committed rent roll to $60m by 30
June 2017
What is our goal? To build New Zealand’s best business location
How will we do it?
By leveraging our place based strategy, as we
plan, develop, deliver, build, lease and manage
the district
How will we measure progress?We have set an aspirational goal to increase
committed rent roll to $60m by 30 June 2017

Transformation +
From To
Management Style
B2B B2B & B2C
Market Position Managing a portfolio of assets, opportunities and projects
Curating a Placeand a business community
Proposition FlexibilitySecurityProximity
FlexibilitySecurityProximity +

Investor Day 2013Auckland InternationalAirport Limited
Invest for Future Growth – Our Investments

Investor Day 2013
Invest for future growth
• A key strategic objective is to make the most out of the strong assets
we own.
• These strong assets include:
North Queensland Airports
Queenstown Airport
• North Queensland Airports has significant potential centred around its
proximity to the fast growing middle class in Asia and the planning self
determination enabled by the Cairns land use plan
• Queenstown Airport has significant potential to grow markets, increase
utilisation of infrastructure and deliver for the Queenstown tourism
industry by obtaining approval for evening flights

Investor Day 2013
Proximity of Cairns to Growing Asian Wealth

Investor Day 2013
Land Use Plan at Cairns

Investor Day 2013
Queenstown
Extending the day at
Queenstown provides
convenience for travellers
Extending the day will grow
volume with no additional
infrastructure investment

Investor Day 2013
Invest for future growth
• Auckland Airport has and will continue to consider step-out opportunities
• We will look at investments through four strategic filters:
Would the acquisition support the
core growth strategy?
E.g. Potential to stimulate significant
direct traffic
Is the opportunity good business
stand-alone?
E.g. Strong pre-conditions (exposure
to growth markets, travel
infrastructure etc.)
Does it enable management to
meaningfully add value?
E.g. Level of control
Is the investment expected to deliver
attractive financial returns?
E.g. ROIC > WACC
IRR > Risk Adjusted Investment
Specific Return Hurdle

Investor Day 2013Auckland InternationalAirport Limited
Strengthening Our Consumer Business

Investor Day 2013
Retail and Parking summary
RETAIL
• $124.3m revenue in FY13
(+2.9% vs. PCP)
• 103 retail tenancies across both
terminals, many trade 20+
hours per day
• Core categories of Duty Free,
Foreign Exchange, Food and
Beverage, Destination,
Specialty
CAR PARKING
• $40.4m revenue in FY13
(+10.2% vs. PCP)
• 8567 parking bays
(public + staff). 10 ‘at-
terminal’ public car parks
• 24 hour Park & Ride facility,
transfers every 15 minutes

Investor Day 2013
Recent focus areas
RETAIL
• Driving productivity from existing
space
• Optimising retailer mix
• Product extensions to meet
changing passenger
demographics
• Increasing use of data, tools to
uncover insights and influence
retailer performance
• Closer commercial management
of retailers performance
CAR PARKING
• Demand growth and revenue
optimisation through yield
management (online tools)
• Strict capacity management
• Selective product and service
development
• Operational enhancements and
outsourcing efficiencies
Retail and parking growth supported by improved sophistication of marketing, plus ongoing research programmes

Investor Day 2013
Recent achievements – Products and Services

Investor Day 2013
Recent achievements –
products and services

Investor Day 2013
Recent achievements –
products and services

Investor Day 2013
Recent achievements – products and services

Investor Day 2013
Recent marketing activity

Investor Day 2013
Recent marketing activity

Investor Day 2013
Television Advertising

Investor Day 2013
The Retail equation
Passengers x (Penetration (%) x Conversion (%)) x ATV ($) = Sales ($) x Yield (%) = Revenue ($)
# of paxentering a
store
# of purchases
made
Average Transaction
Value
Passenger Spend Rate (PSR)
Income Per Passenger (IPP)

Investor Day 2013
Retail results and tools
• PSR grew +1.6% in FY13, excluding
tobacco
• Strong PSR growth in Specialty, Food and
Beverage categories
• Buoyant Duty Free ATVs, challenging
conversion rates
PSR movement, FY13 vs FY12

Investor Day 2013
Parking results and capacities
$250
$300
$350
$400
$450
$500
Average Revenue Per Parking Space Growth
Growth of On Line Car Parking Revenue by Key Segment
Weekender
Holidayer
Business Multi Day Trip
Business Single Day

Investor Day 2013
Parking results and capacities
June 12 June 13 June 14 (f/c)
DTB Public 2310 2638 272214% 3%
Staff 500 150 150
ITB Public 2912 2974 35842% 21%
Staff 1710 1710 1100
Park & Ride Public 695 695 1063
Staff 0 400 1089
Totals Public 5917 6307 7369
Staff 2210 2260 2339
Car Parking Capacities
• Creation of additional “at-terminal” capacity for public, through
conversion of staff parking spaces
• Progressive migration of staff to Park & Ride
• 1,140 increase in carparks

Investor Day 2013
Strengthening our consumer business
• Preserve our current
strengths and extend
our customer reach
• Engage customers
more fully
• Smart capacity
additions and revenue
management

Investor Day 2013
Key insights to guide direction
Retail conversion research, 2013
Seven in ten departing international
travellers purchase something from Auckland
Airport
Asian travellers, specifically Chinese, spend
on average significantly higher than others – up
to 2 ½ times more than the average spend
Customer Value Measurement (CVM) research, 2013Regional airports benchmarking, 2012
Retail floorspace -23%
(m2 per 1000 dep pax) vs peer airportsInternational terminal: duty free,
retail, food/bev
Car park bays -21%
(departing pax per bay) vs peer airportsAll airports, all car parks
Duty Free PSR by average dwell time, Sept 2013
$
Dwell time (hours)

Investor Day 2013
Key insights to guide direction
International Terminal Retail Conversion Benchmark 2013, TNS
• Chinese passengers (NZ resident + non-resident) represent 7% of
all traffic, yet 14% of international terminal retail spend.
• Non-resident Chinese spend rate is +166% above the overall
average
Retail Spend Rates By Nationality

Investor Day 2013
The path ahead
Clear focus on PSR and ARPS growth
Preserve existing
strengths
• Proactively manage
retailers, exit
underperformers
• Strong pipeline of
prospective tenants
• Drive for retailing / service /
sales excellence
• Mastery of segmentation
and pricing, to maximise
returns
Extend customer
reach
• Additional retail floorspace
• Broadened and deepened
product range (new
categories and brands)
• Demographic tailoring of
retail mix
• Progression of new product
and service development
Higher customer
engagement
• Targeted campaigns to
drive participation and
conversion
• Driving upsell through
existing customer
databases
• Creating a highly
experiential in-terminal
retailing environment
• Development of new
channels for product
reservation / ordering
Smart capacity
add-ons
• Higher yields from at-
terminal parking space
(migrate staff off-terminal)
• Timely additions (e.g. multi-
level parking) aligned with
30 year vision roll-out


Investor Day 2013

What we do matters for
our customers
our city
our country