investment styles, market anomalies, and global stock selection
TRANSCRIPT

Front.fm Page i Tuesday, December 29, 1998 9:56 AM
Richard O. Michaud
Investment Styles, Market Anomalies, and Global Stock Selection
The Research Foundation ofThe Institute of Chartered Financial Analysts

Front.fm Page ii Tuesday, December 29, 1998 9:56 AM
The Research Foundation ofThe Institute of Chartered Financial Analysts
Board of Trustees1998–99
ChairDeborah H. Miller, CFA
Santander Global Advisors, Inc.
Vice ChairH. Gifford Fong
Gifford Fong Associates
Executive DirectorKatrina F. Sherrerd, CFA
AIMR
Thomas A. Bowman, CFAAIMR
Gary P. Brinson, CFA*Brinson Partners, Inc.
James L. Farrell, Jr., CFAFarrell-Wako Global Investment
Management, Inc.
Khalid Ghayur, CFAHSBC Asset Management Ltd.
Robert H. JeffreyJeffrey Company
Martin L. LeibowitzTIAA-CREF
Patricia A. McConnellBear, Stearns & Company Inc.
Joan A. Payden, CFAPayden & Rygel
Frank K. Reilly, CFAUniversity of Notre Dame
Philippe A. Sarasin, CFALombard, Odier & Cie
Eugene C. Sit, CFASit Investment Associates, Inc.
Fred H. Speece, Jr., CFASpeece, Lewis & Thorson, Inc.
Walter P. Stern, CFA*Capital Group International, Inc.
R. Charles Tschampion, CFAGeneral Motors Investment
Management CorporationJames R. Vertin, CFA*
Officers and DirectorsExecutive DirectorKatrina F. Sherrerd, CFA
AIMR
Research DirectorKeith C. Brown, CFA
University of Texas at Austin
SecretaryMichael S. Caccese, Esq.
AIMR
TreasurerGeorge L. Payne, Jr.
AIMR
Research Advisory BoardRoger G. Clarke
Analytic/TSAGary L. Gastineau
American Stock ExchangeW. Van Harlow III, CFA
Fidelity Management & ResearchJoanne M. Hill
Goldman, Sachs & CompanyTakao Kobayashi
University of TokyoRobert W. Kopprasch, CFA
Smith Barney, Inc.
Mark P. Kritzman, CFAWindham Capital Management
Scott L. Lummer, CFA401k Forum
Frank K. Reilly, CFAUniversity of Notre Dame
Brian D. Singer, CFABrinson Partners, Inc.
Michael F. TheobaldThe Birmingham Business School
Arnold S. WoodMartingale Asset Management
*Emeritus

Front.fm Page iii Tuesday, December 29, 1998 9:56 AM
Richard O. MichaudAcadian Asset Management
Investment Styles, Market Anomalies, and Global Stock Selection
The Research Foundation ofThe Institute of Chartered Financial Analysts

Front.fm Page iv Tuesday, December 29, 1998 9:56 AM
Research Foundation PublicationsActive Currency Managementby Murali RamaswamiAnalysts’ Earnings Forecast Accuracy in Japan
and the United States by Robert M. Conroy, Robert S. Harris, and
Young S. Park Bankruptcy Prediction Using Artificial Neural
Systems by Robert E. Dorsey, Robert O. Edmister, and
John D. Johnson Blockholdings of Investment Professionalsby Sanjai Bhagat, Bernard Black, and
Margaret BlairCanadian Stocks, Bonds, Bills, and Inflation:
1950–1987 by James E. Hatch and Robert E. White Company Performance and Measures of Value
Addedby Pamela P. Peterson, CFA, and David R.
PetersonControlling Misfit Risk in Multiple-Manager
Investment Programsby Jeffery V. Bailey, CFA, and David E. TierneyCorporate Bond Rating Drift: An Examination
of Credit Quality Rating Changes over Time by Edward I. Altman and Duen Li Kao Corporate Governance and Firm Performance by Jonathan M. Karpoff, M. Wayne Marr, Jr.,
and Morris G. Danielson Country Risk in Global Financial Managementby Claude B. Erb, CFA, Campbell R. Harvey,
and Tadas E. ViskantaCurrency Management: Concepts and Practicesby Roger G. Clarke and Mark P. Kritzman, CFAEarnings Forecasts and Share Price Reversals by Werner F.M. De Bondt Economic Foundations of Capital Market
Returnsby Brian D. Singer, CFA, and Kevin Terhaar,
CFAEconomically Targeted and Social Investments:
Investment Management and Pension Fund Performance
by M. Wayne Marr, John R. Nofsinger, and John L. Trimble
Emerging Stock Markets: Risk, Return, and Performance
by Christopher B. Barry, John W. Peavy III, CFA, and Mauricio Rodriguez
Equity Trading Costs by Hans R. Stoll
Ethics, Fairness, Efficiency, and Financial Markets
by Hersh Shefrin and Meir Statman The Founders of Modern Finance: Their Prize-
Winning Concepts and 1990 Nobel Lectures
Franchise Value and the Price/Earnings Ratio by Martin L. Leibowitz and Stanley Kogelman Fundamental Considerations in Cross-Border
Investment: The European View by Bruno Solnik Global Asset Management and Performance
Attribution by Denis S. Karnosky and Brian D. Singer, CFAInitial Dividends and Implications for Investorsby James W. Wansley, CFA, William R. Lane,
CFA, and Phillip R. DavesInitial Public Offerings: The Role of Venture
Capitalists by Joseph T. Lim and Anthony Saunders Interest Rate and Currency Swaps: A Tutorialby Keith C. Brown, CFA, and Donald J. SmithThe International Equity Commitmentby Stephen A. Gorman, CFAManaged Futures and Their Role in Investment
Portfolios by Don M. Chance, CFA The Modern Role of Bond Covenants by Ileen B. Malitz A New Perspective on Asset Allocation by Martin L. Leibowitz Options and Futures: A Tutorial by Roger G. Clarke The Poison Pill Anti-Takeover Defense: The
Price of Strategic Deterrence by Robert F. Bruner A Practitioner’s Guide to Factor Models
Predictable Time-Varying Components of International Asset Returns
by Bruno Solnik The Role of Risk Tolerance in the Asset
Allocation Process: A New Perspectiveby W.V. Harlow III, CFA, and Keith C. Brown,
CFASales-Driven Franchise Valueby Martin L. LeibowitzSelecting Superior Securities by Marc R. Reinganum Time Diversification Revisited by William Reichenstein, CFA, and Dovalee
Dorsett

Front.fm Page v Tuesday, December 29, 1998 9:56 AM
Investment Styles, Market Anomalies, and Global Stock Selection
Front.fm Page vi Tuesday, December 29, 1998 9:56 AM
© 1998 The Research Foundation of the Institute of Chartered Financial Analysts
All rights reserved. No part of this publication may be reproduced, stored in a retrieval system, or transmitted, in any form or by any means, electronic, mechanical, photocopying, recording, or otherwise, without the prior written permission of the copyright holder.
This publication is designed to provide accurate and authoritative information in regard to the subject matter covered. It is sold with the understanding that the publisher is not engaged in rendering legal, accounting, or other professional service. If legal advice or other expert assistance is required, the services of a competent professional should be sought.
The Institute of Chartered Financial Analysts is a subsidiary of the Association for Investment Management and Research.
ISBN 0-943205-46-8
Printed in the United States of America
January 1999
Editorial Staff Maryann Dupes
Editor
Vivian FeggansAssistant Editor
Jaynee M. DudleyProduction Manager
Cheryl L. LiknessProduction Coordinator
Lois A. Carrier and Diane B. HamsharComposition

Front.fm Page vii Tuesday, December 29, 1998 9:56 AM
Mission
The Research Foundation’s mission is to identify, fund, and publish research that is relevant to the AIMR Global Body of Knowledge and useful for AIMR member investment practitioners and investors.

Front.fm Page viii Tuesday, December 29, 1998 9:56 AM
Biography of the AuthorRichard O. Michaud is senior vice president and director of research atAcadian Asset Management. His research and consulting has focused on assetallocation, investment strategies, global investment management, optimiza-tion, stock valuation, portfolio analysis, and trading costs. Mr. Michaud has aPh.D. in mathematics from Boston University and has taught investmentmanagement at Columbia University.
His prior positions include director of research and new product develop-ment at State Street Bank and Trust Company, head of equity analytics at Mer-rill Lynch, and director of quantitative investment services at PrudentialSecurities.
Mr. Michaud is a Graham and Dodd Scroll winner for his work on optimi-zation, a director of the “Q” Group, and an Editorial Board member of the Fi-nancial Analysts Journal. He has recently completed the book Efficient AssetManagement: A Practical Guide to Stock Portfolio Optimization and Asset Al-location, published by Harvard Business School Press (June 1998).

Front.fm Page ix Tuesday, December 29, 1998 9:56 AM
Contents
Foreword . . . . . . . . . . . . . . . . . . . . . . . . . . . . . . . . . . . . . . . . . . . . . . viii
Preface . . . . . . . . . . . . . . . . . . . . . . . . . . . . . . . . . . . . . . . . . . . . . . . . x
Chapter 1. Introduction . . . . . . . . . . . . . . . . . . . . . . . . . . . . . . . . 1
Chapter 2. Investment Style Analysis . . . . . . . . . . . . . . . . . . . . 3
Chapter 3. Market Anomalies in Global Equity Markets . . . . 5
Chapter 4. Institutional Style Factors . . . . . . . . . . . . . . . . . . . . 9
Chapter 5. Global Style Analysis . . . . . . . . . . . . . . . . . . . . . . . . 17
Chapter 6. Market Efficiency and Factor Persistence . . . . . . . 21
Chapter 7. Dynamic Factor Relationships. . . . . . . . . . . . . . . . . 24
Chapter 8. Dynamic Factor Weighting . . . . . . . . . . . . . . . . . . . 28
Chapter 9. Defining Value and Growth Stocks . . . . . . . . . . . . . 31
Chapter 10. Global Equity Style . . . . . . . . . . . . . . . . . . . . . . . . . . 35
Chapter 11. Summary and Conclusions . . . . . . . . . . . . . . . . . . . 37
Appendix A: Database Description . . . . . . . . . . . . . . . . . . . . . . . . 39
Appendix B: Theil Factor Weight Estimation . . . . . . . . . . . . . . . 42
References . . . . . . . . . . . . . . . . . . . . . . . . . . . . . . . . . . . . . . . . . . . . . 43
Selected AIMR Publications . . . . . . . . . . . . . . . . . . . . . . . . . . . . . . 47

Foreword
For those of us who have made a career of studying stock returns, no paradigmhas had a more pervasive impact on our thinking than the notion that capitalmarkets are efficient. As someone with one foot in academia and the other inpractice, I have long been struck by how opinions about market efficiencyfrom both sides of the fence have evolved over the years. In more polemictimes, academics were convinced by the weight of their self-generatedevidence that it was impossible to “beat the market,” particularly once activemanagement fees were considered. Professional managers and analysts,perhaps feeling threatened by this assault on their livelihoods, were equallyadamant that their services had value, citing as support numerous examplesof colleagues whose performance records were too exceptional to have beendriven by mere chance.
This deep schism in thinking typified the early years of the market effi-ciency debate. Indeed, finding someone who had or could be “converted” wasrare. As one of my university colleagues noted, the discussion was as visceraland no less emotionally charged than an argument about which system of re-ligious beliefs was the best. Although current opinions remain strongly held,recent years have nevertheless seen the verbiage moderate substantially forat least two reasons. First, money managers have found it increasingly diffi-cult to outperform their unmanaged benchmarks (i.e., the buy-and-hold alter-native espoused by efficient market purists). Second, academics havebecome increasingly suspicious of the sanctity of the case for market efficien-cy in the face of a growing number of scientific studies documenting anoma-lous and contradictory behavior in stock return patterns associated withcertain calendar events (e.g., weekends, January) or firm-specific character-istics (e.g., market capitalization, price-to-book ratio).
The root of the controversy is that establishing conclusively that marketsare truly efficient is virtually impossible. That is, an analyst or investor cannotknow for sure whether an observed stock price is too high or too low withouthaving a theoretical model indicating what the “correct” price should be. Thisunfortunate situation leads to the so-called joint hypothesis problem, which,simply stated, means that any test of market efficiency is and must be a simul-taneous test of the assumed valuation process. If stock return data disagreewith our expectations, we are never really sure whether the security is actu-ally mispriced or our mechanism for forming expectations is flawed. This dis-tinction is hardly trivial, because mispriced securities can lead to profitabletrading strategies and misspecified models can lead to financial ruin. It is notsurprising then that practitioners and academics alike have begun to pay agreat deal of attention to identifying the economic factors that drive stock re-
viii ©The Research Foundation of the ICFA

Foreword
turns and the factor models that summarize the return-generating process.In this study, Richard Michaud provides the reader with a thorough anal-
ysis of the stock factor–stock return relationship and the role that these fac-tors play in establishing anomalous market behavior. Importantly, he alsoextends this discussion to the definition of various popular investmentstyles—say, value versus growth—and considers these issues in the contextof a global portfolio. He makes the point that it is possible to explain much ofwhat is often attributed to anomalous factors (i.e., those that are significantlycorrelated with risk-adjusted stock returns) as being any of a variety of short-comings in the researcher’s empirical methodology. Notable examples ofthese afflictions include the inability to measure risk properly and the biasescreated by using a tainted data sample.
One of the most appealing features of this study is the presentation of anew global equity database specifically designed to overcome many of theempirical problems that have plagued past research in this area. Armed withthis information, Michaud investigates return behavior in a handful of theworld’s major equity markets during the early years of this decade. Althoughthe time frame he investigates is short and may not be representative of amore general period, the results he reports will comfort a lot of people whilesurprising many others. In particular, Michaud finds that there appear to bebetween two to four relevant factors but that the specific identity of these fac-tors is highly dependent on the country in question. A practical implication ofthis finding is that value and growth stocks are quite likely to be defined dif-ferently throughout the world. Furthermore, two factors that are used fre-quently in style investing—firm size and price-to-book ratio—do not prove tobe overly important. He concludes from this analysis that equity style invest-ing does not yield a simple recipe that can be applied indiscriminately on aglobal basis.
I suspect that both academics and practitioners will find much to contem-plate in this monograph. The story Michaud tells is one of caution but, ulti-mately, one that reaffirms the belief that financial market participants do notact in a wantonly irrational manner. Of course, the mere existence of anyanomalous factors suggests that classical definitions of market efficiency maynot be appropriate either. This is interesting and timely work that should pro-vide a great deal of practical guidance to the current generation of moneymanagers. The Research Foundation is pleased to bring it to your attention.
Keith C. Brown, CFAResearch Director
The Research Foundation of theInstitute of Chartered Financial Analysts
©The Research Foundation of the ICFA ix

Preface
A stock factor, such as the earnings-to-price ratio, is said to be anomalous if itis statistically significantly related to ex post risk-adjusted return. A number ofstudies have documented the existence of anomalous stock factors in manyglobal equity markets. Such factors may indicate the existence of marketinefficiencies and profitable stock selection strategies. Practitioners often usethese factors to select stocks and define investment style. Some recent studieshave reported large risk-adjusted returns based on stock selection strategiesthat use anomalous factors.
The proper interpretation of many anomaly studies, however, remainscontroversial. A number of critiques indicate that the results may be explain-able as mismeasured risk, econometric limitations, methodological errors, ordata snooping. In addition, because many studies have not controlled for man-dates of institutional asset management, the results may not have much prac-tical investment value.
This monograph is devoted to understanding global factor–return rela-tionships for institutional equity management and style analysis. A new globalfactor–return equity database has been designed to avoid a number of criti-cisms of market anomaly studies. In particular, the database was defined inDecember 1990 and allowed to evolve over time to limit the impact of datasnooping.
Controlling for the many critiques of market anomaly studies in an insti-tutionally relevant context significantly alters the perception of the economicsignificance of the anomalies in many equity markets. This new evidence isnot consistent with two-factor style analysis, identical anomalous factors inglobal markets, the “irrational” behavioral hypothesis, or constant factor-weight forecasting. The evidence is most consistent with market idiosyncrat-ic inefficiencies and dynamic style factors. Notably, the perception that largeactive returns are available from constant factor weighting with little businessor investment risk appears to be largely a hoax. A new “market culture” hy-pothesis is proposed and found to be useful for explaining a limited marketinefficiency hypothesis in some global markets. The dynamic character of fac-tor returns motivates development of an econometric procedure designed forimplementing active factor tilts that may reduce forecast risk and increasestock selection reliability.
Conventional global equity style analysis is typically a generalization ofU.S. style analysis. The results from analysis of global factor–return relation-ships raise important issues for the limitations of global style analysis. For ex-
x ©The Research Foundation of the ICFA

Preface
ample, global value style may be ambiguous, and strict adherence to aconventional value style for global equity portfolios may significantly limit in-vestment performance. More generally, global style analyses may often beuninformative and misleading when characterizing the stock selection pro-cesses of many institutional equity managers.
This monograph reflects an ongoing effort to improve the technology ofglobal stock selection and addresses practical issues in the management ofglobal equity portfolios. The framework and data used to understand stockfactors should lead to a better understanding of global equity investment is-sues. The analysis provides some useful information for all those involved inglobal asset management.
I particularly want to thank Richard Roll, Jay Shanken, Jonathan Berk,and Olivier Ledoit for very helpful suggestions and Paul Erlich for many valu-able discussions and data analysis. I am very grateful to Mark Kritzman; KeithC. Brown, CFA; and James Scott for their encouragement and support. Igratefully acknowledge the assistance and support of my associates at Acadi-an Asset Management, particularly Gary Bergstrom, Raymond Mui, andSteve Silberberg, who were very helpful during various stages of this re-search. I am also grateful for the support of the Research Foundation of theInstitute of Chartered Financial Analysts. I remain responsible for all errors.
I am happy to hear from readers. Please send comments, questions, andcorrections to [email protected] and visit my Web site atrmichaud.com for updates and errata.
Richard O. Michaud
©The Research Foundation of the ICFA xi

Chapter1.fm Page 1 Tuesday, December 29, 1998 7:32 AM
1. Introduction
The terms “value” and “growth” have a long history in equity management.They are widely used to describe investment managers and funds and toclassify stocks. Traditionally, a value-stock manager focuses on findingundervalued stocks, in terms of a low stock price relative to firm fundamentals,such as earnings or book value. In contrast, a growth-stock manager focuseson finding stocks with high expected growth in earnings. A seconddimension—size, or the market value of stocks in a fund—is also widely usedto describe manager style and explain performance.
The goal of investment style analysis is to understand a manager’s activereturn. The strong interest in investment style is part of a growing need byconsultants and investors to better understand manager performance andspecialization. The key to successful style analysis rests on whether a set offactors can be identified to reliably represent the active-return-generatingprocess. Such a framework usually comes, at least in part, from marketanomaly studies. A large body of academic and professional evidence demon-strates the existence of stock factors that are statistically significantly relatedto ex post return, after risk adjustment, in many equity markets and timeperiods. Such results appear to contradict the efficient market hypothesis andoften form the basis of an active stock selection framework.
Active global stock selection poses many challenges to style analysis andequity management. The value of equities in various global markets mayreflect wide variation in accounting standards, regulatory environments, polit-ical traditions, and characteristics of the economy and structure of financialmarkets. On the other hand, global stock selection represents the ultimateequity management frontier. The investment opportunities associated withreliable global stock selection can substantially enhance return per unit of riskrelative to domestic equity investment (for a recent review, see Michaud et al.1996).
A convenient framework for global equity management can be describedas a three- or four-stage process: (1) stock valuation within each equity market,(2) equity market valuation within a global equity market index, and (3)scaling the two components of the forecast so that they are comparable. Activecurrency management may be considered a fourth stage of the process. The
©The Research Foundation of the ICFA 1

Investment Styles, Market Anomalies, and Global Stock Selection
Chapter1.fm Page 2 Tuesday, December 29, 1998 7:32 AM
scope of this monograph is (cross-sectional) global stock selection withindeveloped country equity markets. The goal is to present an institutionallyrelevant view of the active-return-generating process for global stock selectionand style analysis. The discussion does not consider the issues of activecountry and currency selection (stages two through four), which are normallypart of global equity management. Cross-sectional stock selection within amarket can avoid consideration of the differences in accounting standards,regulations, and market structures among countries at the stock level. Also,stock selection procedures developed for the U.S. market can be applied,although basic assumptions of relatively reliable stock forecast data and ofrational and relatively economically diversified markets must be satisfied.
This monograph reviews a spectrum of market anomaly studies, focusingon how they affect style analysis and global stock selection. It describes a newfactor–return database developed for a number of global equity markets anddesigned to minimize the often-cited market anomaly criticisms for institu-tional stock selection. The data shed light on the active-return-generatingprocess and on style analysis in five major equity markets. The results indicatethat a small number of country-specific factors are significant in each marketfor the time period studied. The significant factors are not the same in allmarkets and, in most cases, not the components of traditional two-factor styleanalysis. In addition, the results are not consistent with the irrational behav-ioral hypothesis. However, a market “culture” hypothesis is helpful in ratio-nalizing some patterns in factor–return relationships and may support an exante (i.e., prior) assumption of market inefficiency in some cases. Whatforcefully emerges is the importance of addressing the idiosyncratic natureand dynamic character of markets for successful global equity management.To reduce forecast risk and enhance reliability and performance, a rigorousstatistical estimation procedure is introduced that incorporates short-termexogenous information in active stock selection. The market- and time-perioddependence of significant style factors raises important issues concerning thelimitations of style analysis in global equity portfolios.
2 ©The Research Foundation of the ICFA

2. Investment Style Analysis
When suitably defined, managers with similar investment styles are likely toperform more like each other than like the overall market or managers withdifferent styles. Style analysis may be much more informative than peer-groupanalysis, which is commonly used by many performance analysis systems. Insome cases, passive funds provide “style” returns, raising the issue of the roleof style performance for active management. Proper style analysis leads tofinding good managers within a given style and avoids having to fire a manageronly because the manager’s style is out of favor.
At least three different approaches to style analysis exist—consultant,academic, and practitioner.
Consultant style analysis focuses on a comprehensive description of amanager’s investment process, including investment philosophy, portfoliocharacteristics, and subsequent returns (Christopherson and Williams 1995).Often when evaluating a manager, a consultant may view consistency ofperformance relative to investment philosophy as a major consideration in thedecision-making process.
Academic style analysis, such as that found in Roll (1995), tends to equatestyle with market anomalies and focuses narrowly on the determinants ofactive stock returns. In an academic study of the functioning of capital mar-kets, style factors may be important if they indicate informational inefficienciesand account for superior manager performance.
Practitioner style analysis is pragmatic and simply focused on forecastingreturn. Style factors may be useful in predicting active return over investmenthorizons of institutional interest, whether the factors are anomalous or ephem-eral. Practitioners often make bets on episodic factors that may be related toactive return over short- and medium-term time horizons. The factors incommercial risk models are often a convenient source of nonanomalous stylefactors used in forecasting return.1
The two popular analytical approaches for analyzing style are return-basedand portfolio-based methods.
The return-based or “effective mix” procedure, which was popularized by
1One representative case is Leinweber, Krider, and Swank (1995).
©The Research Foundation of the ICFA 3

Investment Styles, Market Anomalies, and Global Stock Selection
Sharpe (1988, 1992), uses mean–variance optimization to attribute historicalportfolio returns to various candidate indexes (for an example, see Hardy1995). The advantage of this approach is simplicity and convenience. It doesnot require any more information than historical portfolio and index returns.Its limitations include the impact of noisy data on reliability and its likelyinappropriateness for dynamic style managers.2
The portfolio-based method seeks to identify and attribute return tovarious factor “tilts” in the portfolio.3 The advantage of this approach is that itmay be more reliable and useful for a wider array of managers, includingdynamic style managers, than the return-based approach. Its limitationsinclude the fact that period-by-period portfolio composition must be availablefor analysis.
An analytical equity style analysis requires a framework that identifies theessential components of active return. A style analysis framework often fol-lows from the results of factor studies of cross-sectional market anomalies inglobal markets. Capaul, Rowley, and Sharpe (1993) proposed the use of two-dimensional style analysis for global equity markets. This popular frameworkfor equity style analysis uses the book-to-price ratio and market capitalizationto define portfolio style. Exhibit 2.1 illustrates this procedure schematically.Based on this scheme, small-cap value managers invest in stocks with smallmarket capitalizations and high book-to-price ratios. Style performance anal-ysis compares their performance with that of other managers in the samecategory and not with the performance of managers in the remaining threecategories. The following chapters review some of the results from identifyingthe significant components of return that are the basis of most style analysisframeworks.
2For an analysis of the statistical characteristics of the procedure, see Michaud 1998a, Chapters6 and 7.3Christopherson and Trittin (1995) provide a review of multivariate style analyses and a detaileddescription of an alternative based on portfolio characteristics.
Exhibit 2.1. Traditional Style AnalysisBook-to-Price Ratio
Market Cap High LowSmall Small-cap value Small-cap growthLarge Large-cap value Large-cap growth
4 ©The Research Foundation of the ICFA
3. Market Anomalies in Global Equity Markets
A lot of evidence indicates that a number of stock factors are statisticallysignificantly related to ex post cross-sectional returns for U.S. stocks, after riskadjustment, over reasonably long time horizons. The classical empiricalstudies include Basu (1977) on the earnings-to-price ratio, Litzenberger andRamaswamy (1979) on dividend yield, Banz (1981) on firm capitalization, andReinganum (1981) on a comparison of the earnings-to-price ratio with firmcapitalization. These reports inspired a large number of “market anomaly”studies on such issues as seasonal factors (e.g., the January effect), firmfundamentals (e.g., book-to-price ratio), and price momentum. Notableempirical studies include Keim (1983) for turn of the year and firm marketsize; Rosenberg, Reid, and Lanstein (1985) for book-to-price ratio and specificreturn reversal; Fama and French (1992) for book-to-price ratio and marketcapitalization; and Lakonishok, Shleifer, and Vishny (1994) for two-factormodels that include sales growth. Hawawini and Keim (1998) found similarfactor–return relationships in many global markets.
As rationalized by Graham and Dodd (1962), investment professionalshave used “value” factors, such as the earnings-to-price ratio, to select stocksfor decades. Institutional investors have used various single-factor (Michaudand Davis 1982) and two-factor (Ambachtsheer and Farrell 1979) models formany years. Market anomaly studies provide a rationale for much of institu-tional active management practice.1
Although the existence of significant stock factor relationships with ex postrisk-adjusted return is widely acknowledged, the interpretation of their eco-nomic significance is highly controversial. Important questions have beenraised concerning the economic nature of the factor relationships. The criticalissues for investment management include whether the factors are economi-cally significant and persistent. The controversy also affects style analysis. If
1Multiple valuation models, which often depend on market anomaly stock factors, are the usualframeworks used by institutional active equity managers for forecasting return and active stockselection (Michaud 1990).
©The Research Foundation of the ICFA 5
Investment Styles, Market Anomalies, and Global Stock Selection
the book-to-price ratio or capitalization has no economic significance in a givenmarket, or if other factors are more significant, then traditional two-factor styleanalysis may have limited investment value.
The perception of economic significance and persistence of anomalousfactor–return relationships depend on the underlying explanations for therelationships. At least nine rationales can be found for market anomalies—twothat are consistent with market inefficiency and economic significance(ephemeral inefficiencies and irrational investor behavior) and seven that arenot (misestimated risk, methodological errors, data snooping, misinterpreta-tions of the size factor, attribute-sorted portfolio implications, econometriclimitations, and magnified returns).
Ephemeral Inefficiencies. Anomalous return factors in a market maysimply indicate that capital markets are episodically informationally ineffi-cient. This interpretation is the one favored by some early researchers andmany investment practitioners. The absence of a fundamental rationale sug-gests that anomalies are unlikely to be reliably persistent over time. Inaddition, once a factor is identified as anomalous, its use may become wide-spread and its effectiveness is likely to diminish. Still, evidence shows thatsome market anomalous factors persist over relatively long periods (Reinga-num 1981).
Irrational Behavioral Hypothesis. An optimistic rationale for the eco-nomic significance of anomalous factors is the “behavioral hypothesis.” In thisview, market anomalies may represent consequences of “naive” or “irrational”investor behavior (for a recent discussion and references, see Lakonishok etal. 1994). Many market anomalies are classifiable as “value” or “contrarian”factors. Investors may be considered naive if they overreact to informationand price changes, extrapolate past growth too far into the future, ride stockprice trends without regard to firm fundamentals, or focus on firm attractive-ness and fashionableness without considering price. Such investor behavior,if sufficiently widespread, may provide risk-adjusted profit opportunities formore rational, sophisticated investors with contrarian and disciplined strate-gies. Persistence may occur because many anomalies are inherently unfash-ionable and few investors are sufficiently “rational” to maintain a contrarianstrategy against widespread market sentiment. Discussions of the rationalityof investors often include references to psychological literature and experi-ments on decision-making errors. Currently, the behavioral explanation ofmarket anomalies is itself fashionable, not incidentally because its message isoften optimistic for value managers and because it provides a quasi-scientificveneer for many traditional explanations of persistent poor investment perfor-
6 ©The Research Foundation of the ICFA

Market Anomalies in Global Equity Markets
mance. At least seven alternative explanations, however, challenge the validityof the behavioral hypothesis.
Misestimated Risk. One rationale for the existence of market anoma-lies is that they reflect misestimated or omitted systematic risk (Fama andFrench 1992, 1998). A systematic-risk explanation is consistent with the long-term persistence of some factor–return relationships, such as the book-to-price ratio in the U.S. and other global markets. In this view, it is morereasonable to believe that anomalous factors reflect stock risk than profitopportunities that have been ignored by the investment community fordecades. Although factor returns may be strictly inconsistent with the beta ofthe capital asset pricing model, they may be consistent with multifactormodels of systematic risk. In this explanation, market anomalies may bepersistent and statistically significant, but they are not economically signifi-cant because they simply reflect additional risk. Because such explanationsare dependent on the assumed risk model, the results are often inconclusive(Fama 1991).
Methodological Errors. Market anomaly studies may have method-ological errors that make their conclusions unreliable. In particular, Ball,Kothari, and Shanken (1995) and Conrad and Kaul (1993) have noted signifi-cant errors in some key contrarian studies. Such errors put in doubt thecontrarian interpretation of some market anomalies.
Data Snooping. Data snooping is a fundamental critique of nearly allmarket anomaly studies. Intuitively, enough snooping of a database almostalways uncovers some factor, or set of factors, that explains return over a givenperiod. However, no matter how lengthy the historical period, in-samplesignificance is not necessarily indicative of out-of-sample reliability (Lo andMacKinlay 1990). In addition, because market anomaly studies often usesimilar historical data, it should not be surprising when new studies findsimilar results.
Size Misinterpretations. Many market anomaly studies focus on themarket-capitalization factor. Berk (1995) showed that even if a firm’s opera-tional size is unrelated to expected return, its market capitalization is likely tohave a negative relationship with average return in cross-sectional regres-sions. Consequently, a cross-sectional relationship between market capitali-zation and return should not be interpreted as an anomaly or as evidence thatsmall-cap stocks earn abnormally high returns. Berk showed that marketcapitalization is likely to proxy for omitted systematic-risk factors or empiricalmisspecification of an asset-pricing model.
©The Research Foundation of the ICFA 7

Investment Styles, Market Anomalies, and Global Stock Selection
Attribute-Sorted Portfolios. Many empirical studies use the returns ofattribute-sorted portfolios to study risk factors in asset-pricing models. Ferson(1998) provides a critique of the attribute-sorted methodology that is relatedto Berk’s (1995) analysis (see also Lyon, Barber, and Tsai, forthcoming).Ferson has shown that such “spread” or long–short portfolios will appear toimply the existence of risk factors even when the attributes are completelyunrelated to risk. Loadings on attribute-sorted long–short portfolios shouldnot, in general, be confused with risk factors.
Econometric Limitations. Ordinary least squares (OLS) regression,widely used in market anomaly studies, is highly sensitive to index misspecifi-cation and prone to estimating false anomalous relationships (Roll and Ross1994; Kandel and Stambaugh 1995). On the other hand, generalized leastsquares (GLS) regression is theoretically much less sensitive than OLS regres-sion to the inefficiency of the index. Notably, a recent re-examination of Famaand French (1992) using GLS regression found a statistically significant posi-tive relationship with beta (Ledoit 1994). At a minimum, the evaluation ofempirical results should include consideration of the financial integrity andrepresentativeness of the index and the power of econometric methods.
Magnified Returns. In some studies, large anomalous returns have beencited to support the view that the observed anomalies are neither ephemeralnor consequences of misestimated or omitted risk factors. For example, Lakon-ishok, Shleifer, and Vishny (1994) reported 7–8 percent a year in extra returnson value stocks. Many of these studies, however, used two procedures—along–short portfolio framework and multifactor valuation—that tend to mag-nify portfolio returns without changing underlying factor–return relationships.For example, factor returns may be associated with a long equal-weightedportfolio of top-decile stocks and a short equal-weighted portfolio of bottom-decile stocks from some stock universe ranked according to some stockattribute. This long–short equity strategy framework leverages index-relativereturns and generally substantially increases residual risk (for further analysis,see Michaud 1993). In the case of numerous market anomaly long–shortframework studies, portfolio residual risk levels are often substantially greaterthan what would be acceptable for most institutional investors. As anotherexample, a forecast may be based on a combination of positive significantfactors. This procedure may synergistically increase the information in thefactor combination according to the mathematical/statistical properties ofmultiple valuation models (Michaud 1990). Consequently, large abnormalfactor returns may simply indicate the use of procedures that magnify returnsbut do not provide incremental evidence of economic significance.
8 ©The Research Foundation of the ICFA

4. Institutional Style Factors
Data snooping is a particularly pervasive critique of the economic significanceof stock factors in market anomaly studies. In order to address the issue, aglobal equity market factor–return database was developed beginning inDecember 1990 to “forward test” various historical stock factors for theirpractical investment value. Sixteen beginning-of-the-month candidate stockforecast factors, beta, sector, index membership, and subsequent monthlytotal return were tabulated monthly. The factor values and regressions weredefined according to the data and regression properties given below and inAppendix A. In early 1991, when the database was being developed, noprospective information on factor–return relationships was known. It wasentirely possible that none of the candidate factors would be found to bestatistically or economically significant.
An important additional limitation of many market anomaly studies is thatthe results may not be relevant for institutional active equity management.Typically, the active equity manager’s role is to outperform a given indexwithin a multifactor forecast framework. Consequently, understanding index-relative systematic risk-adjusted return in a multifactor context is typically theactive manager’s relevant investment objective. In contrast, the focus of manymarket anomaly studies is the return premium (return net of the local interestrate) for individual factors. In addition, the stocks included in many marketanomaly studies may not be those used in institutional portfolios. In practice,institutional asset managers may devote a significant effort to identifying auniverse of investment-grade stocks, often in terms of minimum informationavailability. Also, to control the reliability of the forecast, institutional portfo-lios are typically mandated not to exceed 6 or 8 percent annual residual risk.1
Consequently, popular long–short market anomaly methodologies are ofteninappropriate measures of factor–return relationships in practice.
1The amount of residual risk assumed by an asset manager should be closely related to theassumed level of information in the return forecast and estimation error in the risk model. SeeMichaud (1993) for further discussion on forecast reliability risk.
©The Research Foundation of the ICFA 9

Investment Styles, Market Anomalies, and Global Stock Selection
Regression DesignMultivariate linear regression is generally the statistical method of choice formeasuring the relationships among stock factors for active stock selection.The regression should conform to principles of modern investment theoryand optimal multiple valuation model design. That is, the regression shouldtake into account the following practical investment issues:• The index has no active risk.• Index-relative systematic risk-adjusted return is often the appropriate
return objective. • Most indexes of interest are capitalization weighted.• The distribution of factor values may have little investment content and
may be counterproductive in regression estimation. • Monthly horizons are often the forecast period of practical investment
interest. • Factors are defined consistent with the expectation of a positive
relationship with ex post return.• Stocks included in the regression should possess a level of information
consistent with institutional investment-grade securities.All reported regressions from the database satisfy those conditions.Specifically, the regressions are capitalization weighted and based on index-relative monthly total returns, normalized and standardized factor values,investment-grade stocks, and systematic risk adjustment.
The pooled time-series regression coefficients and t-statistics for thefactors are based on the Fama–MacBeth (1973) methodology. That is, thetime-series average and t-statistic of the average of each month’s factorregression coefficients are reported. A simple and useful approach to system-atic risk adjustment is to include beta and dummy variables for sector andindex membership. One benefit of this simple risk-adjustment procedure isthat only current data are needed to define the regression for any monthlyperiod.
During the nearly eight years since the project was initiated, the databasehas been redefined several times. In particular, the database has beenexpanded to include a number of additional countries and stocks withinmarkets. In a limited number of cases, the previous unavailability of factorvalues may have introduced some look-ahead bias. These instances are largelylimited to the normalized-earnings-to-price ratio, dividend discount model(DDM) alpha, and specific return reversal in the U.S. market, particularly inthe early months of the development of the database and for an occasionalmonth in other markets. Because the database represents an ongoing invest-ment process, it is also inevitably affected by attempts to improve accuracy,
10 ©The Research Foundation of the ICFA

Institutional Style Factors
remove software bugs, refine factor computations, and expand its applicability.In nearly all cases, the objective has been to sharpen the image of underlyingfactor–return relationships rather than alter them. With the exceptions noted,nearly all of the changes were implemented on a going-forward basis. Conse-quently, the database should be reasonably useful for examining factorreturns in an active stock selection framework that is relatively free of thebiases from data snooping.
The seven-aggregate-factor framework described in a subsequent sectionis a separate issue. It was developed from the original set of 16 univariatevariables in mid-1994. A similar aggregate-factor framework had been devel-oped in mid-1992 and had been used for stock selection from that time onward.A delay for developing an aggregate-factor model was inevitable because itrequired the accumulation of a sufficient amount of univariate variable databefore statistical procedures, such as factor analysis, could be applied. Thedefinition and analysis of the aggregate factors is discussed further in thefollowing sections.
Univariate Factor AttributionsTable 4.1 provides the 16 univariate capitalization-weighted stock factorregression coefficients in basis points (bps) for Japanese stocks relative to theMSCI (Morgan Stanley Capital International) country index for Japan, riskadjusted for beta, sector, and index membership. Three sets of monthlyregression coefficients are given—October 1995, November 1995, andDecember 1995. In addition, the results of a five-year pooled average ofmonthly regression coefficients and t-statistics of the average coefficients,from January 1991 to December 1995, are given. For example, the book-to-price ratio is a statistically significant factor over the five-year period. The dataindicate that an MSCI Japan index-relative risk-adjusted return of 40 bps, onaverage, would have been experienced over the five-year period for a 1standard deviation tilt on the book-to-price ratio, gross of costs. The databaseconsisted of nearly 60,000 firm-months of monthly stock factor returns inJapan during this period.
Univariate analysis provides a simple description of the underlying dataand is a traditional approach to the analysis of factor–return relationships.However, univariate analysis provides limited useful information for forecast-ing return in practice. One important reason for this limitation is that a variablewith significant explanatory power in isolation from other variables maybecome dominated when combined with other factors. Issues of consequenceinclude factor interrelationships and factor–return dynamics. In the followingsections, multiple regression techniques are applied to properly assess histor-ical factor relationships that may be useful in an institutional multifactorforecast framework.
©The Research Foundation of the ICFA 11

Investment Styles, Market Anomalies, and Global Stock Selection
Multiple regression analysis can have practical investment limitations ifnot used appropriately. Multiple regression coefficients of strongly correlatedvariables are likely to be highly unstable and may be unintuitive. The numberof variables in the regression may also be of consequence for successfulforecasting; increasing the number of variables may increase in-sampleexplanatory power but may also reduce out-of-sample forecast power. Toapproximation theorists, this is the well-known tiger-in-a-cage principle.
The issue of designing an optimal framework for forecasting return is notsimply one of extracting maximum information from historical data. Activemanagers often use a multiple valuation model as a Bayesian framework forincluding exogenous information in the return forecast. Having a large num-ber of correlated factors may make using the results of a historical regressiondifficult for understanding and forecasting factor relationships. A parsimoni-ous, but comprehensive, representation of the active-return-generating pro-
Table 4.1. Univariate Factor Regression Analysis for Japan, January 1991–December 1995
Average Coefficient
Factor Coefficient t-StatisticOctober
1995November
1995December
1995Earnings-to-price ratio 9 bps 0.7 126 bps –141 bps –50 bpsAnalysts’ earnings-to-price
ratio 6 0.4 110 –55 24Book-to-price ratio 40 2.7 –48 46 211Cash-earnings-to-price
ratio 13 0.9 –39 –68 –48Dividend yield 34 2.7 –19 31 97Sales-to-price ratio 17 2.0 –101 20 89Normalized-earnings-to-
price ratio 29 2.2 –3 92 193DDM (alpha) 20 1.7 14 –46 105Change in analyst
earnings growth rates –2 –0.2 45 27 –82Trend in analyst revisions 2 0.3 72 32 –69Five-day specific return
reversal 48 3.8 –56 135 66Thirty-day specific return
reversal 58 4.5 3 143 –25Market capitalization 2 0.1 20 67 154Analyst neglect –10 –0.7 –20 53 80Historical four-year
earnings growth –20 –1.7 20 –20 –25Earnings torpedo 4 0.5 –3 –23 14Note: The results shown are based on monthly data. The entire period contained 59,866 firm-months of data. The October 1995 period contained 1,569; the November 1995 period contained1,572; and the December 1995 period contained 1,581.
12 ©The Research Foundation of the ICFA

Institutional Style Factors
cess with relatively uncorrelated factors that have intuitive investment contentmay sacrifice in-sample fit for increased ability to effectively use exogenousinformation for forecasting return (Michaud 1990). One useful statisticalprocedure for developing an optimal multifactor forecast framework (i.e.,factor analysis) will be described in the next section.
Aggregate Style FactorsOne approach for increasing the usefulness of multiple regression estimationfor forecasting return in a Bayesian framework is to identify a limited, yetcomprehensive, set of low-correlation, investment intuitive, “aggregate”factors to represent the original set of 16 univariate “micro” factors. Factoranalysis is the multivariate statistical procedure of choice for identifying aparsimonious set of low-correlation aggregate factors to describe theunderlying data structure spanned by a given set of variables. In a process thatcan be described as “identification by the company it keeps,” factor analysishelps to identify underlying macro or “style” factors that may characterize theindividual micro factors that “load” together. In addition, factor analysisprocedures can be useful for suggesting appropriate weightings of microfactors to define macro style factors. Multiple regression, based on factoranalysis style factors, may provide a clear, stable, more useful description offactor–return relationships in a market for out-of-sample forecasting thanunivariate regression.
Factor analysis studies of the 16 forecast variables in Table 4.1 wereperformed. Based on the analyses of monthly data for five developedmarkets—Japan, the United Kingdom, France, Germany, and the UnitedStates—seven aggregate style factors were identified. The seven style factorsand their associated micro factors are• earnings yield (earnings-to-price ratio and broker consensus forecasted
earnings-to-price ratio), • asset yield (book-to-price ratio, dividend yield, cash-earnings-to-price
ratio, and sales-to-price ratio),• normalized earnings yield (normalized-earnings-to-price ratio and DDM
alpha),• earnings trend (trend in analyst earnings estimates and change in one-
month earnings estimates), • return reversal (5-day and 30-day specific return reversal),• size (market capitalization and analyst neglect), and• cyclicality (historical earnings growth rate and earnings torpedo). The seven style factors are clearly identifiable in all five major equity marketsduring the time period studied. Ridge regressions were used to assist in
©The Research Foundation of the ICFA 13
Investment Styles, Market Anomalies, and Global Stock Selection
defining variable weightings within an aggregate factor. Factor analysisstudies for three roughly equal, mutually exclusive subperiods tested therobustness of the definitions of the aggregate factors. Few differences werefound and all seem reasonably well explained by statistical variation. The mostnotable exception is the “cyclical” or business cycle factor, which is the leaststable. All style factors were restandardized so that the standard deviation isequal to 1 in reported regressions.
A significant issue often arises in discussions of factor-analysis-definedfactors for forecasting return. In any given measurement period, an aggregatefactor constructed from factor analysis may be less related to return than someof its components. Does this observation imply that the aggregate factor isinferior as a basis of forecasting return than the more successful microvariables? The key issue is whether the aggregate factor represents aninvestment meaningful component of the active-return-generating process. Ifnot, individual factors may be more useful. On the other hand, factor analysisstyle factors that reflect stable investment constructs may be a safer basis forforecasting out-of-sample return than individual micro variables.2
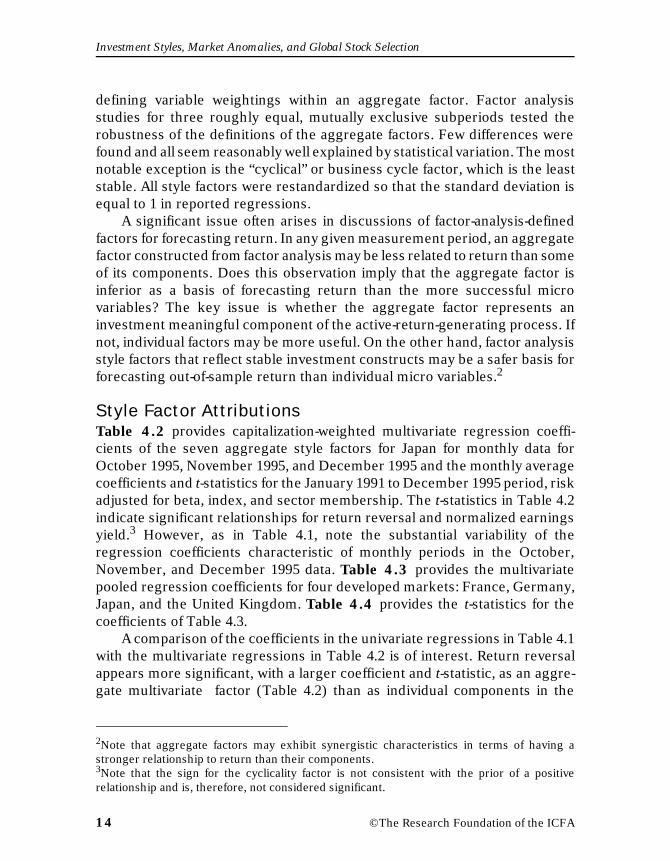
Style Factor AttributionsTable 4.2 provides capitalization-weighted multivariate regression coeffi-cients of the seven aggregate style factors for Japan for monthly data forOctober 1995, November 1995, and December 1995 and the monthly averagecoefficients and t-statistics for the January 1991 to December 1995 period, riskadjusted for beta, index, and sector membership. The t-statistics in Table 4.2indicate significant relationships for return reversal and normalized earningsyield.3 However, as in Table 4.1, note the substantial variability of theregression coefficients characteristic of monthly periods in the October,November, and December 1995 data. Table 4.3 provides the multivariatepooled regression coefficients for four developed markets: France, Germany,Japan, and the United Kingdom. Table 4.4 provides the t-statistics for thecoefficients of Table 4.3.
A comparison of the coefficients in the univariate regressions in Table 4.1with the multivariate regressions in Table 4.2 is of interest. Return reversalappears more significant, with a larger coefficient and t-statistic, as an aggre-gate multivariate factor (Table 4.2) than as individual components in the
2Note that aggregate factors may exhibit synergistic characteristics in terms of having astronger relationship to return than their components.3Note that the sign for the cyclicality factor is not consistent with the prior of a positiverelationship and is, therefore, not considered significant.
14 ©The Research Foundation of the ICFA

Institutional Style Factors
Table 4.2. Style Multivariate Regression for Japan, January 1991–December 1995
Average Coefficient
Factor Coefficient t-StatisticOctober
1995November
1995December
1995Asset yield 18 bps 1.6 –93 bps –37 bps 58 bpsCyclicality –12 –1.9 –45 –11 –30Earnings trend 4 0.7 47 20 –63Earnings yield –10 –0.6 187 –114 –129Normalized earnings
yield 32 2.9 –29 112 200Return reversal 67 6.2 24 155 50Size –9 –0.6 –7 90 104
Beta 15 0.9 –54 161 124Index member –3 –0.1 104 –86 –161Note: The data shown are based on monthly data.
Table 4.3. Style Multivariate Coefficients, January 1991–December 1995
Factor France Germany Japan United KingdomAsset yield 3 bps 17 bps 18 bps –11 bpsCyclicality –3 –1 –12 –5Earnings trend 14 32 4 31Earnings yield 11 –8 –10 28Normalized earnings yield 13 16 32 4Return reversal 30 46 67 74Size 28 –44 –9 7
Table 4.4. Style Multivariate t-Statistics, January 1991–December 1995
Factor France Germany Japan United KingdomAsset yield 0.2 1.4 1.6 –0.8Cyclicality 0.2 –0.1 –1.9 –0.4Earnings trend 1.2 3.1 0.7 3.5Earnings yield 0.7 –0.5 –0.6 1.9Normalized earnings yield 0.9 1.1 2.9 0.4Return reversal 2.0 4.2 6.2 6.6Size 1.6 –2.6 –0.6 0.5
©The Research Foundation of the ICFA 15

Investment Styles, Market Anomalies, and Global Stock Selection
univariate analysis (Table 4.1); normalized earnings yield appears more sig-nificant in the multivariate analysis, but asset yield appears less significant,with a less large coefficient relative to most of its univariate components.Further analysis showed that the average univariate regression coefficient forasset yield was 30 with a t-statistic of 2.5, indicating that the multivariateframework is primarily responsible for the smaller coefficient and t-statisticfor the asset yield style factor in this case. Few differences were found withfactors that are not statistically significant.
The data in Table 4.5 include the style factor t-statistics for the fourdeveloped markets of Table 4.4 plus the United States. Because of datalimitations for the U.S. market, the historical period in Table 4.5 begins in July1992 and covers the five-year period ending in June 1997.
Table 4.5. Style Multivariate t-Statistics, July 1992–June 1997
Factor France Germany JapanUnited
KingdomUnited States
Asset yield –1.4 0.1 1.8 –0.5 –0.3Cyclicality 0.1 –1.1 –0.1 –1.0 –0.4Earnings trend 2.4 2.8 2.9 3.3 3.0Earnings yield 0.9 0.7 0.2 1.8 0.9Normalized earnings yield 0.5 0.7 1.5 0.6 2.7Return reversal 2.4 4.1 6.8 6.5 2.2Size 1.0 –2.1 –2.3 –0.5 1.0
16 ©The Research Foundation of the ICFA

5. Global Style Analysis
A cursory inspection of the t-statistics in Tables 4.4 and 4.5 reveals that themajority of individual style factors are not statistically significant. As a firstorder consideration, it is of interest to test whether the data as a whole arestatistically significantly different from random. Lack of significance couldresult if the number of observations is insufficient or if the seven-styleframework is of little value for explaining index-relative risk-adjusted returnin global equity markets. Hotellings T-square tests of the monthly risk-adjusted regression coefficients for the four-country, five-year data in Tables4.3 and 4.4 and the more recent five-country, five-year data in Table 4.5 indicatesignificance at the 0.01 percent level or less. It is safe to conclude that the dataare not insignificant.1
Market anomalies have been associated with the January seasonal effect.For a recent discussion, see Hawawini and Keim (1998). The possibility existsthat January data are largely responsible for the statistically significant rela-tionships observed in the multivariate regression style factor data. The impactof the January seasonal effect was tested by eliminating the month of Januaryand re-estimating the regressions. The results were essentially unchanged inboth time periods.
Additional issues of fundamental interest are whether the seven-factorstyle framework is useful for explaining index-relative risk-adjusted returns ina given global equity market for these two historical periods and what stylefactors, if any, are related to return in all four/five equity markets. To test thesequestions, Hotellings T-square tests were performed for both time periods anddata sets. The null hypothesis rejection probabilities are given in Table 5.1and Table 5.2. Table 5.1 provides the rejection probabilities for the signifi-cance of the seven-factor style framework in each country for the indicatedtime periods. Table 5.2 provides the rejection probabilities for the significanceof a style factor for the five countries listed in Table 5.1 in the indicated periods.
The results in Table 5.1 show that, except in France in the 1991–95 period,
1I am particularly indebted to J. Shanken for noting the importance of Hotellings T-squareanalyses for these data.
©The Research Foundation of the ICFA 17

Investment Styles, Market Anomalies, and Global Stock Selection
the seven-factor style framework appears useful for explaining index-relativerisk-adjusted return. The results in Table 5.2 show that there is insufficientevidence that three style factors (asset yield, cyclicality, and earnings yield)are useful for explaining return in all markets in the data set. The style factorsthat are reasonably significant in all markets are earnings trend, returnreversal, and normalized earnings yield. The apparent significance of the sizefactor in the 1991–95 period is problematic; the largest size factor t-statistic inTable 4.4 is negative for Germany. A negative sign is inconsistent with the signprior for the size factor. Therefore, the T-square test statistic is not indicativeof statistical significance because it does not consider sign and is influencedby large negative values. In only one other instance, France, is the t-statisticfor size nearly significant and positive in Table 4.4. Consequently, there isinsufficient evidence in either period consistent with significance of the sizefactor. In the context of many other studies of market anomalies, perhaps themost notable result in Table 5.2 is the nonsignificance of the risk-adjustedasset yield style factor.
An issue of interest is whether the data are consistent with the hypothesisthat the factor–return relationships are similar across global markets. Aconservative analysis-of-variance test indicated that factor–return relation-
Table 5.1 Rejection Probabilities: Seven-Factor Style Framework
CountryJanuary 1991–
December 1995July 1992–June 1997
France 22% 5%Germany 0 0Japan 0 0United Kingdom 0 0United States — 0
Table 5.2 Rejection Probabilities: Style Factors in Global Equity Markets
FactorJanuary 1991–
December 1995July 1992–June 1997
Asset yield 19% 42%Cyclicality 43 30Earnings trend 0 0Earnings yield 35 43Normalized earnings yield 5 10Return reversal 0 0Size 1 12
18 ©The Research Foundation of the ICFA

Global Style Analysis
ships are unlikely to be similar at the 5 percent level for the four-country dataand at the 1 percent level for the five-country data.2 It can be safely concludedthat the data, when significant, are most consistent with factor–return relation-ships that are largely country specific.
Tests of the more general statistical hypotheses concerning the limita-tions and the reliability of the information in the regression data allow a moredetailed analysis of the t-statistics and regression coefficients in Tables 4.3–4.5. At the usual 5 percent significance level, the data in Tables 4.4 and 4.5indicate that from two to four factors are consistent with sign priors and arestatistically significant and anomalous in these global equity markets and twotime periods. Earnings yield is significant only in the United Kingdom, size isinsignificant in all markets, and asset yield is significant only in Japan and onlyin the most recent period. On the other hand, normalized earnings yield isuseful in some markets, earnings trend in many, and return reversal in allmarkets in these two time periods. To the extent that evidence for statisticallysignificant market inefficiencies exists, the inefficiencies are either relativelyshort-term trading errors (return reversal) or largely associated with specificmarkets. A notable difference between the data in Tables 4.4 and 4.5 is theearnings trend factor, which is significant in all five markets for the morerecent period.
The factor–return relationships reflected in Tables 4.3–4.5 are differentfrom those of some well-known empirical studies, such as Fama and French(1992).3 Apart from the time period analyzed, obvious reasons for differencesinclude the econometric estimation framework, a database designed tominimize data snooping, and investment-grade stocks in an index-relativecontext. To the extent that data snooping has been minimized and time-period-dependency issues are not dominant, the style factor–return relation-ships that emerge here may simply represent a more realistic and relevantforecast framework.
2A two-way classification with interaction (and replication) analysis of variance of the month-by-month regression coefficients was performed. The results showed that the interaction term,which indicates a country-specific factor relationship, is significant at the 5 percent level for thefour-country data and at the 1 percent level for the five-country data. The test is conservativebecause only a few factors are likely to have substantial interactions, although the majority maybe negligible, and because the standard deviation of the regression coefficients are roughly thesame for each market.3In some instances, when the estimation framework is similar, such as Lakonishok, Shleifer,and Vishny (1994 Table IV), the results for variables such as earnings-to-price ratio, book-to-market ratio, and capitalization are somewhat similar. Roll (1995) also found that capitalizationis dominated by other variables in a multivariate context.
©The Research Foundation of the ICFA 19
Investment Styles, Market Anomalies, and Global Stock Selection
Tests of the effect of the beta, sector, and index risk-adjustment processindicated few significant changes in anomalous factor relationships.4 Becausemarket capitalization may proxy for misestimated or omitted systematic-riskfactors, the results are consistent with the hypothesis that relevant risk factorshave not been ignored (Berk 1995). One alternative explanation of the resultsis that remaining significant factors may be consequences of the limitationsof index misspecification and econometric estimation. Note, however, thatcapitalization-weighted regression is a form of GLS (generalized leastsquares) estimation that may mitigate the impact of index misspecification.
4Roll’s (1995) risk-adjustment methodology for his data increased the statistical significance ofmarket anomalous factors. Beta and sector risk adjustment in Table 4.5 led to a mix of increasesand decreases of factor t-statistics with little discernible pattern. Exceptions are return reversalin France and the United States and asset yield in Japan, which became significant with riskadjustment. Roll’s methodology applied to the data in Table 4.5, using beta and sectormembership as risk factors, also led to a mix of increases and decreases of factor significance.The number of time periods of the data relative to the number of risk factors, however, limitedthe reliability of the analysis in this case. Note that, in contrast to the Roll (1995) results, therisk-adjustment process used in defining the regression in Tables 4.3–4.5 used beginning-of-month data only and did not require a stationarity assumption.
20 ©The Research Foundation of the ICFA
6. Market Efficiency and Factor Persistence
The evidence presented in the previous chapter indicates that somestatistically significant risk-adjusted style factors exist in these global equitymarkets and time periods. Do these results indicate that global equity marketsare not efficient? Unless the style “inefficiencies” are explainable in somereasonable fashion, market efficiency is the most likely explanation. On theother hand, the existence of statistically significant and rationalizable stylefactors may indicate true market inefficiencies that may have real economicand persistent forecast value.
The Irrational Behavioral HypothesisAttempts to “explain” market inefficiencies have often invoked an irrationalbehavioral perspective. Recall that the results of the analysis-of-variance testsindicate that style factors are not the same for the four or five global markets.On the other hand, the psychological-based behavioral hypothesis assumesthat investor behavior is motivated by universal laws of decision making.Unless psychological laws vary by country, the behavioral hypothesis is notvalidated.1 In addition, although the significance of the return reversal factorin Tables 4.4 and 4.5 is arguably consistent with an “overreaction” hypothesis,earnings trend, which is also significantly related to return in all markets inTable 4.5, is not. Finally, the irrational behavioral hypothesis is not consistentwith the insignificance of the asset yield and earnings yield factors in manymarkets, factors that are often associated with contrarian strategies andirrational investor behavior.
A Rational Behavioral HypothesisAn alternative approach is to consider that some significant style factors mayreflect rational investor behavior associated with cultural or sociologicalfactors specific to a given market. Some anecdotal evidence may be gleaned
1Note that sociological, as opposed to psychological, laws may vary by country. This essentialdifference is often lost in applications to investment behavior.
©The Research Foundation of the ICFA 21

Investment Styles, Market Anomalies, and Global Stock Selection
from instances when style factors vary from one market to another within thesame period. For example, Table 4.4 shows that earnings trend is importantin explaining active return in the United Kingdom but not in Japan. This resultis not hard to rationalize. Many global investment managers have known thatbrokerage earnings estimates in Japan have often supported the corporateview of the firm; conversely, brokerage earnings estimates in the UnitedKingdom have been more investor oriented. Recently, the impact of foreignbrokers in Japan and in other markets may be altering investment traditionsand may be making earnings forecasts more relevant to stock pricing. Thedata in Table 4.5, which are for the more recent 1992–97 period, show thatearnings trend in Japan and France is significant.
As another example, consider earnings yield in Japan and the UnitedStates in Table 4.5. By definition, corporate earnings should reflect a firm’sfinancial health, and the earnings-to-price ratio should provide a simple esti-mate of expected return. In markets such as Japan, however, accountingstandards and company practice may lead many investors to ignore a firm’sreported earnings. In this case, an asset- or cash-based estimate of expectedreturn, such as asset yield, may be a convenient earnings yield surrogate forJapanese investors. In the U.S. market, earnings yield is widely availableinvestment information even at the retail investor level and may, as a conse-quence, have little power to explain subsequent excess return, particularly ina multivariate risk-adjusted context. On the other hand, the significance ofnormalized earnings yield may reflect an active-return-generating process thatis increasingly being dominated by sophisticated asset managers in the U.S.market. Even the consistency of return reversal among markets may be lessindicative of investor overreaction than the universality of trading errors andthe bid–ask bounce. Note also that return reversal may vary substantially bymarket and monthly period.
The Market Culture Hypothesis and GlobalizationA market culture explanation of market anomalies is a working hypothesisthat may be useful for understanding the likely persistence of factors and foridentifying additional profitable factors in global equity markets. However, thegrowing influence of foreign brokers and investors is likely to lead to increasedhomogeneity of the return-generating process in many markets. Neverthe-less, the data suggest that useful information may be available by attending tothe subtleties of the investment culture in a market.
Of course, not all factor–return relationships require rational explanation.Some significant style factors may simply be time-period-dependent artifactsof a nonstationary return-generating process (see Roll 1995 for evidence of
22 ©The Research Foundation of the ICFA

Market Efficiency and Factor Persistence
nonstationarity). In addition, nonanomalous style factors may be useful forepisodic factor weighting. Nonstationary factor relationships and dynamicstyle factor weighting are discussed in later chapters. As a practical workinghypothesis, the existence of some medium-term inefficient factors in globalequity markets seems to be reasonably consistent with available evidence.
©The Research Foundation of the ICFA 23

ist inate,
termeriodsa factormentree.r-term
withgandardctorr riskmickely
ally thately) theio—three
erfectpular case,984erg-rious
7. Dynamic Factor Relationships
Experienced investors are well aware that few factor–return relationships perssign and significance period-by-period. As the monthly data in Table 4.2 indicmany factors, even when significant, may deviate substantially from long-trends during shorter periods. These deviations may persist over extensive pof time, with severe business consequences to asset managers. Knowing that has worked well at forecasting return for the past 50 years is of little investvalue if it has not worked for the past three years or will not for the next thSuccessful active management must also be concerned with the shortedynamic character of markets.
Correlations across Time and MarketsTable 7.1 provides 21 years of correlations of annual U.S. dollar total returns six beginning-of-the-year stock factor values for all stocks in the MSCI (MorStanley Capital International) country index for Japan. The average, standeviation, and t-statistic (of the average) of the annual correlations for each faare given at the bottom of the table. Note that the correlations reflect neitheadjustment nor multivariate analysis. The data simply illustrate the dynacharacter of factor–return relationships, even when significant, and their liimpact on business and investment risk over extended time periods.
In Table 7.1, all stock factors except for market capitalization have statisticsignificant average correlations for the 1975–95 period. This finding indicatesa portfolio tilted toward any of these five significant factors would have been likto perform well over this period. However, a manager who chose (in hindsightsingle best predictive factor for this period in Japan—the book-to-price ratwould have experienced two recent consecutive years (1991–1992) and additional consecutive years (1982–1984) with little added value. Because phindsight is not available in practice, consider a manager who used the poearnings-to-price ratio to value stocks in Japan over this same period. In thisin only two of the last five years and in only one of the six years starting from 1were the correlations sufficiently positive to provide significant added value (Bstrom and England-Markun 1982). Such performance is likely to have se
24 ©The Research Foundation of the ICFA

Dynamic Factor Relationships
nage-
Forriod.ed-ationcash-nt.ilar
ctingnd of
stics
ollar
business consequences in the practical world of institutional investment mament. Similar situations exist with other factors and in other markets.
Additional noteworthy issues are illustrated in the data of Table 7.1. example, factors can differ significantly in predictive power in the same time peIn 1994, while the book-to-price ratio, market capitalization, and normalizearnings-to-price ratio had positive correlations with return in Japan, the correlfor the earnings-to-price ratio was largely negative and the correlations for the earnings-to-price ratio and DDM (dividend discount model) were insignificaAlso, the factor correlations vary markedly from one market to another. In simanalyses, it was found that while the book-to-price ratio was important in predireturns in Japan and the United Kingdom, it was unimportant in Germany aonly marginal importance in France.
The idiosyncratic nature of capital markets and their dynamic characteri
Table 7.1 Factor Correlations in Japan with Subsequent One-Year Total U.S. DReturn
Year/ItemMarket
CapEarnings to
PriceBook to
PriceCash Earn-ings to Price DDM
Normalized Earnings to
Price
1975 0.22 0.19 0.14 –0.03 0.24 0.191976 0.11 –0.01 0.03 –0.11 0.00 –0.051977 0.19 0.08 0.46 0.27 –0.06 0.011978 0.32 –0.02 0.26 0.12 0.09 0.101979 –0.08 0.03 0.12 0.13 0.02 0.081980 –0.02 0.16 0.06 0.16 0.14 0.091981 –0.33 0.19 0.25 0.21 0.11 0.171982 –0.07 0.25 0.08 0.03 0.31 0.261983 0.16 0.11 0.01 –0.05 0.24 0.231984 –0.10 0.00 0.02 0.02 –0.09 –0.061985 0.08 0.06 0.25 0.12 0.01 0.081986 –0.13 –0.02 –0.07 –0.02 –0.14 –0.151987 0.19 0.12 0.26 0.13 0.13 0.201988 0.07 0.06 0.12 0.09 –0.06 0.071989 0.52 0.03 0.13 –0.03 0.00 0.051990 0.11 0.15 0.16 0.11 0.17 0.161991 0.11 –0.01 0.07 0.03 0.05 0.041992 0.03 –0.01 0.04 0.03 0.02 0.021993 –0.18 0.11 0.27 0.23 0.23 0.271994 0.33 –0.17 0.25 –0.07 0.05 0.141995 –0.12 0.21 0.07 0.13 0.18 0.19
Average 0.07 0.07 0.14 0.07 0.08 0.10Standard deviation 0.20 0.10 0.12 0.10 0.12 0.11t-statistic 1.56 3.32 5.27 3.13 2.96 4.13
©The Research Foundation of the ICFA 25

Investment Styles, Market Anomalies, and Global Stock Selection
g the the
ngesors inat are
st. Thenagert thers areThesult of
factorstylehowt for a time
-termcterot be
y use
largely define the challenge to active global management. A tool for managindynamic character of factor returns for stock selection is explored further infollowing chapter.
Size and Serial PersistenceTable 7.2 provides a summary of the serial persistence of monthly sign chaand t-statistics relative to random for each of the seven aggregate style factJapan for the 1991–95 period. The data are divided into two cases: those thnot adjusted for the mean value and those that are. Both cases are of interedata without mean adjustment represent the situation encountered by a mawith a tilt on a given factor. The mean-adjusted data more accurately reflecstatistical character of the sign changes. In the unadjusted case, two factostatistically significant at the 10 percent level—return reversal and size. adjusted mean data show that the sign persistence of return reversal is the re
its nonzero average value. On the other hand, the sign persistence of the sizeis not associated with its average value. Note that the marginally significant factor (i.e., asset yield) and significant factor (i.e., normalized earnings yield) sno sign persistence. The data indicate that a persistent positive factor weighnumber of style factors, even when significant on average, may result in manyperiods with unfavorable performance.
Successful active global stock selection may be less associated with longfactor−return relationships than with effectively managing the dynamic charaof markets. In practice, stock selection is often based on factors that may nsignificant in the long term.1
The size factor is a case in point. In practice, investment professionals ma
Table 7.2 Aggregate Factor Monthly Sign Changes and t-Statistics: Japan, January1991–December 1995
No Adjustment for the Mean Adjusted to the Mean Value
FactorSign
Changes t-StatisticSign
Changes t-Statistic
Asset yield 31 0.4 33 0.9Cyclicality 35 1.4 37 2.0Earnings trend 27 –0.7 31 0.4Earnings yield 29 –0.1 29 –0.1Normalized earnings yield 26 –0.9 28 –0.4Return reversal 23 –1.7 30 0.1Size 23 –1.7 23 –1.7
26 ©The Research Foundation of the ICFA

Dynamic Factor Relationships
-termll-capsiness sign
ntds, aiods
s as a
market size to forecast index-relative returns independent of the factor’s longsignificance. The reason for this behavior is that the pattern of returns on smastocks is often perceived to be strongly related to various economic and bucycle factors and epochs. This intuition is consistent with the persistence of thefactor in Table 7.2 and illustrated in Figure 7.1. Consequently, although a constafactor weighting on size may be ineffective on average over long time periosignificant factor weighting in some carefully chosen relatively short time permay be very profitable.
1An advantage of the seven-aggregate-factor framework over commercial risk model factorsource of style factors is that the former case was developed for forecasting return, not risk.
Figure 7.1. Japan Monthly Index-Relative Return to Size
Ind
ex-R
elat
ive
Ret
urn
(%)
6
4
2
0
–2
–41/91 12/957/91 1/92 7/92 1/93 7/93 1/94 7/94 1/95 7/95
©The Research Foundation of the ICFA 27

8. Dynamic Factor Weighting
It seems reasonable to assume that asset managers occasionally have insightsabout short-term factor–return relationships that may be relevant forforecasting return. Consequently, it is natural for a manager to consider adynamic factor-weighting process for forecasting return when the process isreliably informed.
On the other hand, factor-weight forecasting is commonly perceived to bemarket timing on factors and has a dubious reputation among many institu-tional investors and consultants. Although ad hoc factor weighting has thevirtue of practicality, the lack of rigor in implementation is a justifiable con-cern. In many cases in practice, ad hoc dynamic factor-weighting leads tolurches from one set of forecast factor weights to another, typically resultingin substantial forecast volatility and suboptimal investment performance. Theproblem is compounded because managers often formulate their factor–return forecasts in univariate terms and have limited understanding of theirmultivariate implications.
The problem is less the lack of valid manager insights than of suboptimalimplementation of the forecasts. The Theil mixed estimation proceduredescribed below addresses many of the legitimate concerns with dynamicfactor weighting in the context of multiple valuation stock selection. Usedproperly, it is likely to result in far less volatile and more reliable forecasts.
Regression and Forecast Factor WeightsAlthough useful for understanding historical relationships, multivariateregression coefficients are not typically used by institutional managers toforecast return. For example, a forecast of active return may consist of relativeweightings of two-thirds and one-third for two style factors and zero for allothers. Note that multiplication of the regression coefficients by a suitableconstant allows conversion to an absolute sum-to-1 (or 100) relative-weightingscale without altering the level of information (correlation) of the regressionwith historical return. Note also that the size of the regression coefficientsreflects the in-sample standard deviation of return, which is unknown whenforecasting out of sample.
These practical considerations lead to a two-step procedure for defining
28 ©The Research Foundation of the ICFA

Dynamic Factor Weighting
a multiple valuation forecast—relative weighting of forecast factors and scal-ing the forecast. The first step relatively values factors in an absolute sum-to-1 (or 100) framework that is based in part on regression analysis. The scalingstep allows separate consideration of the level of forecast information andreturn variability in the forecast period (see the Michaud 1989 Appendix fora description of the scaling procedure).
Theil Mixed EstimationTheil mixed estimation is a generalization of least squares linear regressionthat allows for optimally combining historical data with forecast information(Theil and Goldberger 1961; Theil 1971). It is useful for managing a dynamicmultifactor stock selection process. It is also useful as an interactive feedbacksystem for refining forecasts. The procedure allows the strategist tounderstand the implications of forecasts and levels of certainty for any subsetof factors. Ex ante factor correlations may also be included as inputs. Theilweights often lie between forecasted and historical factor weights. Althoughthe results may be qualitatively unsurprising, the procedure provides preciseoptimal weights under the assumptions.
As an illustration, consider the following stylized contrarian strategy ofstyle factor weights for selecting stocks in Japan. The relative-weight forecastsare displayed in the second column of Table 8.1—25 percent each for valuefactors (asset yield, earnings yield, and normalized earnings yield), –12.5percent each for earnings growth factors (cyclicality and earnings trend), andzero weight on remaining factors. Note that the weights on reversal and sizeare not no-information forecasts. Relative-weight forecasts have an absolutesum-to-100 value. Assume that the style relative-weight forecasts have a stan-dard error, as given in column three in Table 8.1, and that the forecast horizonis six months. Table 8.1 displays the average regression coefficients for theindicated five years of monthly historical data (absolute sum-to-100 normalized)and the Theil optimized factor weights (absolute sum-to-100 normalized). SeeAppendix B (p. 42) for further details of the estimation process.
Some caveats are in order. No statistical procedure is immune to badforecasts or unexpected changes in the return-generating process. Becausemixed estimation is so flexible, it is susceptible to misuse by those inexperi-enced with multivariate statistical techniques. In addition, mixed estimationassumes that priors are independent of historical data. But factor forecasts areseldom totally independent of historical data whether ad hoc or Theil proce-dures are used. In Theil factor-weight optimization, the problem is explicitrather than implicit.
©The Research Foundation of the ICFA 29

Investment Styles, Market Anomalies, and Global Stock Selection
A better understanding of the implications of priors should be helpful instabilizing and optimizing the process for forecasting factors and for stockselection. All else being the same, a Theil procedure is far less likely to resultin excessive changes in factor weights than ad hoc approaches. The level ofreliability required to rationalize large factor-weight changes informs theanalyst of the risks that are being taken. On the other hand, because Theilestimation allows better control of the forecast process, managers may bewilling to adjust factor weights more frequently. These frequent adjustmentsmay result in a “steady correction” process that is likely to decrease forecastvolatility and increase reliability in practice.
The process of formulating a valid and useful forecast is the key tosuccessful dynamic factor weighting. Many institutional investors use a vari-ety of methods and sources of information for forecasting factor–returnrelationships. The objective of the Theil process is to provide a more completeunderstanding of the implications of forecasts in light of the historical data ina framework suitable for multifactor valuation.
ExtensionsRegression estimation for forecasting can often be improved with Steinestimators (Judge et al. 1988). These estimators can be included to enhancethe Theil mixed estimation of factor weights. Because the Theil procedure isa multivariate regression process, many test procedures can be applied toevaluate various hypotheses (Theil 1971, pp. 350–351). Such topics are beyondthe scope of this monograph.
Table 8.1 Mixed Estimation Factor Weighting, Stylized Contrarian Strategy, Six-Month Horizon: Japan, January 1992–December 1997
FactorPrior
WeightsPrior Standard
ErrorsHistoricalWeights
TheilWeights
Asset yield 25 25 15 28Cyclicality –12.5 12.5 –2 –11Earnings trend –12.5 12.5 8 –2Earnings yield 25 25 –5 17Normalized earnings yield 25 25 15 23Return reversal 0 12.5 42 14Size 0 12.5 –13 –5Notes: The prior standard errors define forecast reliability over the forecast horizon. Theforecast standard error is the standard error of the forecast multiplied by the square root of thenumber of periods in the horizon scaled to be consistent with the historical monthly regressiondata. The standard errors for the nonzero priors in the example reflect a reliability levelassociated with a t-statistic of 1 for the forecast horizon.
30 ©The Research Foundation of the ICFA

9. Defining Value and Growth Stocks
Many measures of a stock’s value are used in practice.1 Most traditional valuemeasures are ratios of a firm fundamental to price. The list of 16 factors inTable 4.1 contains 8 that are widely considered to be traditional valuemeasures. These 8 measures are components of one of the three aggregatevalue style factors—earnings yield, normalized earnings yield, and assetyield—used in the regressions in Tables 4.2–4.5.
All eight univariate value factors have advocates and rationales for stockvaluation. Asset yield value factors may be preferred to earnings-based factorsbecause they are not as subject to the vicissitudes of accounting practices andmay be less variable for economically sensitive companies. On the other hand,the earnings yield factors implicitly include a component of expected futuregrowth of the firm, as well as cash distribution, as part of the valuationmeasure. Normalized earnings yield factors may be preferable to earningsyield factors because they may be less sensitive to the economic cycle. Suchconsiderations may be particularly important in some global equity markets.
Evidently, many plausible measures of value exist. Are all such measuresfundamentally similar; that is, is value single dimensional and reasonably wellapproximated by each univariate or aggregate value style factor? Alternatively,does more than one kind of stock value exist? The three value style factorsthat emerged in the seven-factor style framework indicate that value may bemultidimensional; that is, at least three distinct kinds of risk-adjusted equityvalue styles exist. Is value multidimensionality an artifact of the researchparadigm used to study the microforecast factors, or does it represent some-thing fundamental in terms of understanding the return-generating processin global equity markets?
Does Value Multidimensionality Matter? A key question is whether the three value style factors are useful forunderstanding the active-return-generating process in global equity markets
1The discussion follows Michaud (1998b).
©The Research Foundation of the ICFA 31

Investment Styles, Market Anomalies, and Global Stock Selection
relative to simpler measures. One simple alternative is to equal weight all eightunivariate or microfactors in the three value style factors as a unidimensionalrepresentation of value.
To put this question to a test, the t-statistics of the value style factorregressions in Table 4.5 were compared with t-statistics of the unidimensionalvalue style measure, everything else being held constant.2 The regression wasperformed exactly as in Table 4.5. Table 9.1 summarizes the unidimensionaland multidimensional value t-statistics for the value style factors in the U.S.,U.K., and Japanese markets. The t-statistics in Table 4.5 for the three valuestyle factors are reproduced for convenience in Table 9.1.
Implications for Value Style ManagementThe t-statistics for the unidimensional value style factor in the three marketsare positive and reasonably significant. It is safe to conclude that risk-adjustedunidimensional value has been a relatively significant contributor tomultivariate return in the three markets, on average, for this time period.
However, the multidimensional framework provides a more detailed viewof the relationship of value to return. The asset yield factor is statisticallysignificant only in Japan. Earnings yield is significant only in the UnitedKingdom. Normalized earnings yield is roughly significant in Japan and theUnited States. Consequently, each market has its own “value” characteristicsduring this period. Such insights can be very useful in formulating forecastsand understanding performance in a market.
A number of authors—such as Capaul, Rowley, and Sharpe (1993)—havepopularized the use of the book-to-price ratio to classify value and growthinvestment styles in global equity markets. The notion is that if stocks arepriced correctly, those with high book-to-price ratios will be priced based on
2The regressions are multivariate in both cases and include the remaining four aggregate stylefactors—size, earnings trend, reversal, and cyclicality—plus beta and index membership andsector dummy variables. For simplicity of presentation, the t-statistics of the aggregate andother factors in the multivariate regression are omitted.
Table 9.1 Unidimensional versus Multidimensional Value t-Statistics, June 1992–July 1997
Factor Japan United Kingdom United StatesUnidimensional 2.9 1.7 1.9Asset yield 1.8 –0.5 –0.3Earnings yield 0.2 1.8 0.9Normalized earnings yield 1.5 0.6 2.7Note: The data shown are based on pooled monthly data.
32 ©The Research Foundation of the ICFA
Defining Value and Growth Stocks
their current value and those with low book-to-price ratios will be priced basedon their future growth potential. Typically, the categories are defined to bemutually exclusive: Fifty percent of stocks in a given stock universe are valueand 50 percent are growth.
A number of consultants and providers of index data now track theperformance of value and growth indexes using the book-to-price ratio as themeasure of the value-versus-growth dimension. These indexes are used tomeasure the style performance of managers and to determine whether valueor growth outperformed in a given time period.
Such procedures assume that value and growth are unidimensional andwell represented by the book-to-price ratio. The evidence here indicates thatneither assumption has been true for the three largest global equity marketsin this recent five-year time period. Although asset yield, the aggregate factorthat includes the book-to-price ratio, was an important measure of value in theJapanese market in the 1992–97 time period, it was not useful in either of theother two markets (the United Kingdom and the United States). In the onemarket—Japan—where asset yield was significant, normalized earnings yieldwas also significant. Consequently, an asset yield definition of investment stylewould not have been optimal in any of the three largest global equity marketsfor this five-year period. As the sole measure of global value, the book-to-priceratio criterion appears to have severe, if not fatal, active investment manage-ment and performance measurement limitations.
Factor–return relationships are generally time-period dependent. Thedata in Table 9.1 represent results for a relatively short, although investment-relevant, period of time. On the other hand, the results of many long-termstudies may be less convincing than they appear. As Lo and MacKinlay (1990)noted, the longevity of a factor–return study may provide little additionalsupport of out-of-sample reliability or forecasting power. Even though time-period dependent, the data provide an investment-relevant view of factor–return relationships that may be of interest to many global institutionalinvestors.
Defining Growth StocksIf the book-to-price ratio is a limited measure of value, it is likely to be similarlyflawed as a growth-stock measure as well. However, the book-to-price criterionmay have additional limitations for characterizing growth-stock investment.
Are growth stocks the polar opposite of value stocks? As implied by thecriterion, do growth-stock managers invest only in stocks with low book-to-price ratios? In many institutions, growth-stock portfolios typically contain asubstantial proportion of stocks with high book-to-price ratios because pru-
©The Research Foundation of the ICFA 33

Investment Styles, Market Anomalies, and Global Stock Selection
dent institutional growth-stock managers are also concerned with stock priceand relative valuation. Consequently, a growth-stock index defined solely bythe book-to-price ratio may be seriously inconsistent with institutional prac-tice. In addition, growth stocks are also likely to be multidimensional. Themultidimensional seven-factor style framework presented here includes addi-tional factors, such as earnings trend and earnings growth, that may be moreappropriate than the book-to-price ratio for understanding growth stocks.Finally, in over-regulated economies, with rigid political and social structuresor significant governmental corruption, the investment culture may be uncon-ducive to indigenous entrepreneurial activity and the number of classicalgrowth stocks in the market may be very limited. Single-factor characteriza-tions of equity investment styles are often simplistic and seriously misleadingin many markets and practical investment situations.
34 ©The Research Foundation of the ICFA

10. Global Equity Style
Conventional definitions of global equity styles are typically generaliza-tions derived from studies of the U.S. equity market. However, stylemultidimensionality, as well as market and period dependence, severelylimit the benefits of simple style definitions and performance frameworks,particularly when applied to global equity portfolios.
Market Style MultidimensionalityThe data in Tables 4.4 and 4.5 teach that an effective forecast of return for agiven period consists of customized subsets of the seven style factors in eachmarket. Suppose a stock selection model in a market consists of an equalweighting of asset yield, earnings trend, and specific return reversal stylefactors. Investment performance is unlikely to resemble a stylized value,growth, market-capitalization strata, or momentum investment strategy.Consequently, an effective return forecast may be inconsistent andinappropriately classified by two-factor or other conventional style analysisframeworks.
Effective style factors vary by time period as well as market. Changes instyle factor effectiveness may reflect anticipatable changes in a market’sinvestment culture and regulatory and monetary environment. The practiceof dynamic factor weighting is likely to lead to an averaging of style forecastfactors over time, adding a significant additional layer of complexity forclassifying investment performance in terms of conventional fixed-factor styleclassifications.
Market- and Period-Dependent Style FactorsConventional global style analysis often assumes that style factors are thesame across global equity markets. If, however, an effective global investmentprocess requires style customization for each market, how useful is globalstyle as a construct for characterizing investment strategy and analyzingperformance?
Consider a global value equity manager. Table 9.1 indicates that globalvalue is multidimensional and market dependent. An effective global value
©The Research Foundation of the ICFA 35

Investment Styles, Market Anomalies, and Global Stock Selection
manager may use all three aggregate value style factors. Averaging the threevalue factor weights across global equity markets may lead to a relativelyuniform pattern of value factors in the global portfolio. Consequently, effectiveglobal value style management may be ambiguous and ill defined relative toa style analysis that uses a single factor such as the book-to-price ratio.
More generally, nonvalue style factors may be significantly related to risk-adjusted return in a global market. Astute global equity managers are likelyto include all style factors in a market that they consider useful for stockselection. However, if a manager’s investment process includes market-cus-tomized value and nonvalue style factors in each equity market, the globalportfolio may often have nearly uniform weightings in many style factors.Consequently, an effective global stock selection investment process mayoften be essentially style neutral. Few, if any, style factors may be sufficientlyprominent as to identify the investment strategy with any particular traditionalinvestment style.
ResolutionsThe ambiguity of global equity style indicates that it may often be appropriateto dispense with traditional labels and focus on stock selection effectiveness(see also Winston 1995). Conforming to a particular investment style shouldbe of lower priority than effective asset management. If style investing limitsinvestment performance, investment managers and fund trustees are welladvised to abandon traditional style analysis.
Style analysis appears useful at the level of country markets. The socio-political culture of a market and economy may be reflected in the set ofsignificant style factors that characterize the active-return-generating process.When significant and persistent, all such factors serve as a useful frameworkfor stock selection.
Strict adherence to global value style, or any particular fixed-factor invest-ment style, may be ineffectual or suboptimal and is not advisable. The limita-tions of global style analysis do not obviate the benefits of standard proceduresfor analyzing stock selection effectiveness and portfolio risk. Until the issueof global style is better understood, global asset managers may be at signifi-cant risk when evaluated with unsophisticated style analysis systems. As theimpact of globalization on capital markets increases, the return-generatingprocess in global equity markets may become more homogeneous, resultingin a convergence of effective style factors and perhaps better-defined globalinvestment styles.
36 ©The Research Foundation of the ICFA

11. Summary and Conclusions
A number of studies of market anomalies in global equity markets haveobserved statistically significant relationships between many stock factors andrisk-adjusted returns. The economic significance of the results, however, iscontroversial. Because anomalous factors are the basis of most definitions ofinvestment style analyses and institutional stock selection frameworks,determining their practical investment value is of great interest. A review ofmarket anomaly studies reveals two rationales that are consistent with marketinefficiency and economic significance and seven that are not. In addition,many studies have not been consistent with institutional active managementmandates, which limits their practical relevance.
This monograph presented a new global equity database designed toaddress criticisms of market anomaly studies in an institutionally relevantframework. A seven-factor style framework was developed and estimatesmade for five major global equity markets. The results showed that from twoto four factors are significant and vary by market. This new evidence altersthe perception of the economic significance of market anomalies and stylefactors for institutional global stock selection in many markets.
The results are not consistent with the irrational behavioral hypothesis,but they are often consistent with a market culture or sociologically basedrational behavioral hypothesis. This new rationale helps to support a limitedmarket inefficiency prior and may increase confidence in the out-of-samplesignificance and reliability of some factors. On the other hand, the perceptionthat large active returns are available from constant factor weighting with littlebusiness or investment risk, which was promoted by some earlier papers onmarket anomalies, appears to be largely a hoax.
Successful active stock selection may be more related to effective man-agement of the dynamic character of markets than identification of anomalousfactors. In practice, managers often have exogenous information on stylefactors that is useful for stock selection. The issue is less whether suchinformation exists than whether it can be implemented in an effective fashion.A rigorous procedure for mixing active factor-tilt priors with historical datawas given. The benefits include a reduction in forecast variability and thelikelihood of more reliable performance.
©The Research Foundation of the ICFA 37

Investment Styles, Market Anomalies, and Global Stock Selection
The observed multidimensionality and market- and time-period depen-dence of global style factors has important investment management implica-tions. Little evidence was found that global equity style can be based on thesame two factors, such as the book-to-price ratio and market capitalization, inall markets. Notably, the notion of global value investing is ambiguous andmay be ineffectual. More generally, a conventional style framework oftenlimits assessment of global manager effectiveness, and strict adherence to afixed style framework may limit the ability to add value. Effective global equityportfolios are often style neutral. Dispensing with style labels and focusingdirectly on manager effectiveness may be the best approach to take in a globalcontext. A valid factor–return estimation procedure, a market-customized,comprehensive style framework, investment insights, and a rigorous methodfor optimally mixing forecasts with historical data may significantly enhanceglobal stock selection in an institutional context.
38 ©The Research Foundation of the ICFA

Appendix A: Database Description
The database was originally designed to track and forward-test factor–returnrelationships on a monthly basis. G. Bergstrom proposed the initial list of 16univariate variables. The database was developed as a framework for multiplevaluation forecasting.1 The markets in the database initially included all MSCI(Morgan Stanley Capital International) Europe/Australasia/Far Eastcountries except New Zealand. Most developed markets and some smallermarkets have since been added, including, notably, the United States andCanada.
The original 16 factors, listed in Table 4.1, are• current earnings-to-price ratio,• broker consensus estimate earnings-to-price ratio, • current book value-to-price ratio, • current cash-earnings-to-price ratio, • current annualized dividend yield,• current sales-to-price ratio,• normalized earnings-to-price ratio: inverse of book-to-price ratio divided
by time-weighted return on equity, • beta-adjusted three-stage dividend discount model alpha, • magnitude in broker consensus change of earnings estimates, • trend in broker consensus estimated earnings, • five-day beta-adjusted price change, • 30-day beta-adjusted price change, • negative of the logarithm of total capitalization of the firm,• earnings neglect: inverse of number of analysts providing estimates, • historical four-year earnings growth rate, and• earnings torpedo: difference of latest reported to forecast earnings divided
by current price.Three sets of variables were used in formulating risk-adjusted monthly
returns: beta, index, and sector membership. Index membership is a dummy
1During the development period and subsequently, a number of individuals contributedsignificantly to database design and management. These include Steve Silberberg, RaymondMui, Vijay D’Silva, and Paul Erlich.
©The Research Foundation of the ICFA 39

Investment Styles, Market Anomalies, and Global Stock Selection
variable that has a value of 1 for stocks outside the MSCI country equity indexand 0 otherwise. Sector membership is a dummy variable that has a value of1 for one of the nine sectors defined by MSCI: capital equipment, consumergoods, energy, finance, gold mines, materials, multi-industry, services, andutilities. In some global markets, a sector may have no corporate representa-tion. One of the sector dummy variables was excluded in the regression inorder to avoid singularity. Beta was unavailable in most months in 1991.
All the regressions used monthly total returns as the dependent variableand included a constant to define the coefficients in terms of index-relativereturns. These conditions guarantee that the factor regression coefficientsreflect index-relative return relationships, holding sectors, beta, and indexmembership constant in each monthly regression.
When 1 of the 16 microfactors was missing, its value was assumed to bezero. If fewer than 10 nonzero factor values existed in a given month, thevariable was not included in univariate regression time-series averages.
July 1992 includes the beginning point of the bulk of the useful historicaldata in the database for the U.S. market. A reason for database limitationsprimarily affecting U.S. data is that data sources and identifiers are differentfor the United States relative to many international markets.
Factor analysis methods were used to define the aggregate style factors.A number of factor analysis procedures exist in the statistical literature. Theseprocedures range from conservative methods with few assumptions to thosewith numerous assumptions that are primarily useful for specific applications.Although a number of factor analysis studies were performed on the 16univariate variables, the results are based on one of the most conservativemethods—principal factors analysis with orthogonal rotations. Comparison ofthe results of different factor analysis procedures indicates that the method isuseful for understanding factor structure, given the objectives of the analysis.
The results reported for the aggregate style factors are for the most recentfactor analysis study, completed in September 1994, and based on data fromthe beginning of the database through June 1994. An earlier factor analysisstudy was performed in the summer of 1992 and included at least a year’sworth of cross-sectional monthly data for every market except the UnitedStates. The earlier study found evidence for five factors rather than seven. Thebasic difference between the earlier and more recent study is that the valuefactor in the later study had three components—earnings yield, asset yield,and normalized earnings yield. In hindsight, the evidence in 1992 was consis-tent with three value style factors and the current seven-factor style frameworkbut was ignored because of the limited amount of data and the (then uncon-ventional) investment character of a multidimensional view of value. See
40 ©The Research Foundation of the ICFA

Appendix A
Chapter 9 for further discussion.The criterion used for a stock to be included in the seven-factor style
regression was that at least five of the seven aggregate style factors wereavailable in a given monthly period. Such a criterion provides a minimumcondition for information level, forecast quality control, and estimation reli-ability. When a factor had no data for fewer than 10 stocks in a month, it wasomitted from the regression. This condition primarily affected the normalized-earnings-to-price ratio in the United States for months prior to July 1994.
If a variable was missing for a given stock, the corresponding aggregatefactor was defined by rescaling the remaining weights in the aggregate factorso that they summed to 1. If an aggregate factor was missing but five or moreaggregate factors were available for a given stock, the missing aggregatefactor was assigned a zero value. A minimum of 10 values of aggregate factorshad to exist for the variable to be included in time-series averages and reportedon a monthly basis.
A significant revision occurred for the normalized-earnings-to-price ratioin Japan. In a recent review of database integrity, the ex ante monthly datawere found to be erroneous for the months March 1993, April 1993, February1994, and April 1994. The problem was rectified by pasting the previousmonth’s normalized-earnings-to-price data (two previous months in the caseof April 1993) in the affected months. The data presented in this monographinclude this database revision.
©The Research Foundation of the ICFA 41

42 ©The Research Foundation of the ICFA
Appendix B: Theil Factor Weight Estimation
Theil regression is the first step in a two-step development of a multiplevaluation forecast that consists of relative factor weighting and forecastscaling. The unit for relative factor weighting is arbitrary and set to absolutesum-to-100 for convenience in this case. On the other hand, the historicalregression coefficients reflect magnitude as well as relative factor weights. Inaddition, the Fama–MacBeth procedure requires averaging the cross-sectional regression coefficients in each period. All these issues must bereconciled in the design of an appropriate Theil analysis procedure.
To make the scales of the prior and data comparable, one approach is tolinearly scale the prior coefficients so that the root mean square sum equalsthe root mean square sum of the Fama–MacBeth average regression coeffi-cients. Because the aggregate factors are approximately uncorrelated andhave standard deviation equal to one, the variance explained by the forecastprior after scaling and the average regression coefficients are about the same.The scale factor is also applied to the forecast prior standard errors. Toconform to the forecast horizon assumption, the scaled prior standard errorsare multiplied by the square root of the number of periods in the forecasthorizon to obtain the standard deviations for a one-month forecast. Thecovariances of the forecasts are assumed to be zero. The mean and samplecovariances of the monthly historical coefficients characterize the one-monthhistorical data. The Theil procedure mixes historical and prior forecasts asdescribed in Erlich, Lesniewski, and Michaud (1997). As a final step, theresulting Theil regression coefficients are absolute sum-to-100 normalized.
AppendixB.fm Page 42 Tuesday, December 29, 1998 7:36 AM

References
Ambachtsheer, Keith, and James L. Farrell, Jr. 1979. “Can Active ManagementAdd Value?” Financial Analysts Journal, vol. 35, no. 6 (November/Decem-ber):39–47.
Ball, Raymond, S.P. Kothari, and Jay Shanken. 1995. “Problems in MeasuringPortfolio Performance: An Application to Contrarian Investment Strategies.”Journal of Financial Economics, vol. 38, no. 1 (May):79–107.
Banz, Rolf. 1981. “The Relationship between Return and Market Value of Com-mon Stocks.” Journal of Financial Economics, vol. 9, no. 1 (March):3–18.
Basu, Sanjoy. 1977. “The Investment Performance of Common Stocks in Rela-tion to Their Price–Earnings Ratios: A Test of the Efficient Market Hypothesis.”Journal of Finance, vol. 32, no. 3 (July):663–682.
Bergstrom, Gary, and Mark England-Markun. 1982. “International CountrySelection Strategies.” Columbia Journal of World Business, vol. 16, no. 2 (Sum-mer).
Berk, Jonathan. 1995. “A Critique of Size-Related Anomalies.” Review of Finan-cial Studies, vol. 8, no. 2 (Summer):275–286.
Capaul, Carlo, Ian Rowley, and William F. Sharpe. 1993. “International Valueand Growth Stock Returns.” Financial Analysts Journal, vol. 49, no. 1 (January/February):27–36.
Christopherson, Jon, and Dennis Trittin. 1995. “Equity Style Classification Sys-tem.” In The Handbook of Equity Style Management. Edited by T. Daniel Cogginand Frank J. Fabozzi. New Hope, PA: Frank J. Fabozzi Associates.
Christopherson, Jon, and C. Nola Williams. 1995. “Equity Style: What It Is andWhy It Matters.” In The Handbook of Equity Style Management. Edited by T.Daniel Coggin and Frank J. Fabozzi. New Hope, PA: Frank J. Fabozzi Associ-ates.
Conrad, Jennifer, and Gautam Kaul. 1993. “Long-Term Market Overreaction orBiases in Computed Returns?” Journal of Finance, vol. 48, no. 1 (March):39–64.
©The Research Foundation of the ICFA 43

Investment Styles, Market Anomalies, and Global Stock Selection
Erlich, Paul, Andrew Lesniewski, and Richard Michaud. 1997. “Theil Mixed Es-timation in a Fama–MacBeth Framework.” Acadian Asset Management Tech-nical Note (September).
Fama, Eugene. 1991. “Efficient Capital Markets: II.” Journal of Finance, vol. 46,no. 5 (December):1575–1618.
Fama, Eugene, and Kenneth French. 1992. “The Cross-Section of ExpectedStock Returns.” Journal of Finance, vol. 47, no. 2 (June):427–466.
———. 1998. “Value versus Growth: The International Evidence.” Journal of Fi-nance, vol. 53, no. 6 (December):1975–99.
Fama, Eugene, and James MacBeth. 1973. “Risk, Return, and Equilibrium—Empirical Tests.” Journal of Political Economy, vol. 81, no. 3:607–636.
Ferson, Wayne. 1998. “The Alpha Factor Asset Pricing Model: A Parable.” Pre-sented to the Institute for Quantitative Research in Finance (Spring).
Graham, Benjamin, and David L. Dodd. 1962. Security Analysis. 4th ed. NewYork: McGraw-Hill.
Hardy, Steve. 1995. “Return-Based Style Analysis.” 1995. In The Handbook ofEquity Style Management. Edited by T. Daniel Coggin and Frank J. Fabozzi.New Hope, PA: Frank J. Fabozzi Associates.
Hawawini, Gabriel, and Donald Keim. Forthcoming 1998. “On the Cross-Sec-tional Behavior of Common Stock Returns: A Review of the Evidence in Mar-kets around the World.” In Security Market Imperfections in Worldwide EquityMarkets. Edited by William Ziemba and Donald Keim. Cambridge: CambridgeUniversity Press.
Judge, George, W. Griffiths, R.C. Hill, H. Lutkepohl, and T. Lee. 1988. Introduc-tion to the Theory and Practice of Econometrics. 2nd ed. New York: John Wiley& Sons.
Kandel, Shmuel, and Robert Stambaugh. 1995. “Portfolio Inefficiency and theCross-Section of Expected Returns.” Journal of Finance, vol. 50, no. 1(March):157–184.
Keim, Donald. 1983. “Size-Related Anomalies and Stock Return Seasonality:Further Empirical Evidence.” Journal of Financial Economics, vol. 12, no. 1:13–32.
Lakonishok, Josef, Andrei Shleifer, and Robert Vishny. 1994. “Contrarian In-vestment, Extrapolation, and Risk.” Journal of Finance, vol. 49, no. 5 (Decem-ber):1541–78.
44 ©The Research Foundation of the ICFA

References
Ledoit, Olivier. 1994. “Portfolio Selection: Improved Covariance Matrix Estima-tion.” Sloan School of Management (November).
Leinweber, David, David Krider, and Peter Swank. 1995. “Evolutionary Ideas inInternational Style Management.” In The Handbook of Equity Style Manage-ment. Edited by T. Daniel Coggin and Frank J. Fabozzi. New Hope, PA: FrankJ. Fabozzi Associates.
Litzenberger, Robert H., and Krishna Ramaswamy. 1979. “The Effect of Person-al Taxes and Dividends on Capital Asset Prices: Theory and Empirical Evi-dence.” Journal of Financial Economics, vol. 7, no. 2:163–196.
Lo, Andrew, and A. Craig MacKinlay. 1990. “Data-Snooping Biases in Tests ofFinancial Asset Pricing Models.” Review of Financial Studies, vol. 3, no. 3(Fall):431–468.
Lyon, John, Brad Barber, and Chih-Ling Tsai. Forthcoming February 1999.“Improved Methods for Tests of Long-Run Abnormal Stock Returns.” Journalof Finance.
Michaud, Richard. 1989. “The Markowitz Optimization Enigma: Is ‘Optimized’Optimal?” Financial Analysts Journal, vol. 45, no. 1 (January/February):31–42.
———. 1990. “Demystifying Multiple Valuation Models.” Financial AnalystsJournal, vol. 46, no. 1 (January/February):6–8.
———. 1993. “Are Long–Short Equity Strategies Superior?” Financial AnalystsJournal, vol. 49, no. 6 (November/December):44–49.
———. 1998a. Efficient Asset Management. Boston, MA: Harvard BusinessSchool Press.
———. 1998b. “Is Value Multidimensional? Implications for Style Manage-ment and Global Stock Selection.” Journal of Investing, vol. 7, no. 1 (Spring):61–65.
Michaud, Richard, Gary Bergstrom, Ronald Frashure, and Brian Wolahan.1996. “Twenty Years of International Equity Investing: Still a Route to HigherReturns and Lower Risks?” Journal of Portfolio Management, vol. 23, no. 1(Fall):9–22.
Michaud, Richard, and Paul Davis. 1982. “Valuation Model Bias and the ScaleStructure of Dividend Discount Returns.” Journal of Finance, vol. 37, no. 1(March):562–573.
Reinganum, Mark. 1981. “Misspecification of Capital Asset Pricing: EmpiricalAnomalies Based on Earnings’ Yields and Market Values.” Journal of Financial
©The Research Foundation of the ICFA 45

Investment Styles, Market Anomalies, and Global Stock Selection
Economics, vol. 9, no. 1 (March):19–46.
Roll, Richard. 1995. “Style Return Differentials: Illusions, Risk Premiums, or In-vestment Opportunities.” In The Handbook of Equity Style Management. Editedby T. Daniel Coggin and Frank J. Fabozzi. New Hope, PA: Frank J. Fabozzi As-sociates.
Roll, Richard, and Stephen Ross. 1994. “On the Cross-Sectional Relation be-tween Expected Returns and Betas.” Journal of Finance, vol. 49, no. 1(March):101–121.
Rosenberg, Barr, Kenneth Reid, and Ronald Lanstein. 1985. “Persuasive Evi-dence of Market Inefficiency.” Journal of Portfolio Management, vol. 11, no. 3(Spring):9–17.
Sharpe, William. 1988. “Determining a Fund’s Effective Asset Mix.” InvestmentManagement Review (November–December):59–69.
———. 1992. “Asset Allocation: Management Style and Performance Measure-ment.” Journal of Portfolio Management, vol. 18, no. 2 (Winter):59–69.
Theil, Henri. 1971. Principles of Econometrics. New York: John Wiley & Sons.
Theil, Henri, and A.S. Goldberger. 1961. “On Pure and Mixed Statistical Esti-mation in Economics.” International Economic Review, vol. 2, no. 1:65–78.
Winston, Kenneth. 1995. “Do International Styles Exist?” Presented to the In-ternational Equity Style Management Conference, New York (September).
46 ©The Research Foundation of the ICFA

©The Research Foundation of the ICFA 47
Selected AIMR Publications
AIMR Performance Presentation Standards Handbook, 2nd edition, 1996
Alternative Investing, 1998
Asset Allocation in a Changing World, 1998
Credit Analysis Around the World, 1998
Deregulation of the Electric Utility Industry, 1997
Derivatives in Portfolio Management, 1998
Economic Analysis for Investment Professionals, 1997
Finding Reality in Reported Earnings, 1997
The Future of Investment Management, 1998
Global Bond Management, 1997
Global Equity Investing, 1996
Global Portfolio Management, 1996
Implementing Global Equity Strategy: Spotlight on Asia, 1997
Investing in Small-Cap and Microcap Securities, 1997
Investing Worldwide VIII: Developments in Global Portfolio Management, 1997
Managing Currency Risk, 1997
Merck & Company: A Comprehensive Equity Valuation Analysis, 1996Randall S. Billingsley, CFA
Venture Capital, 1997
Standards of Practice Casebook, 1996
Standards of Practice Handbook, 7th edition, 1996
A full catalog of publications is available on AIMR’s World Wide Web site atwww.aimr.org; or you may write to AIMR, P.O. Box 3668, Charlottesville, VA22903 U.S.A.; call 1-804-980-3668; fax 1-804-963-6826; or e-mail [email protected] receive a free copy. All prices are subject to change.
SelectPubs.frm Page 47 Tuesday, December 29, 1998 7:37 AM