investment in infrastructure during the eleventh five...
TRANSCRIPT

Investment in Infrastructure
during
the Eleventh Five Year Plan
Published by
Secretariat for Infrastructure
Planning Commission, Government of India Yojana Bhawan, Parliament Street
New Delhi – 110 001
www.infrastructure.gov.in
January 2011
Contents Foreword Investment in Infrastructure
Introduction 1 Projections for the Eleventh Plan 2 Sector-wise projections 4 Projected Investment in the Twelfth Plan 11 Policy initiatives to promote private participation 12 Annex-1: Assumptions underlying the revised Investment Forecast 17
List of Tables
Table 1: Sector-wise Investments: Tenth Plan and Eleventh Plan 3
Table 2: Revised Projected Investment as Percentage of GDP 4
Table 3: Revised Projections of Investment in Infrastructure 6 during Eleventh Plan Table 4: Projected Investment in Infrastructure during 11 the Twelfth Five Year Plan
List of Boxes
Box 1: Structuring PPP Projects 13
Box 2: Model Concession Agreements for PPP Projects 14
Box 3: Model Bidding Documents for PPP Projects 14
Box 4: Guidelines and Manuals 15
Box 5: Reports 15
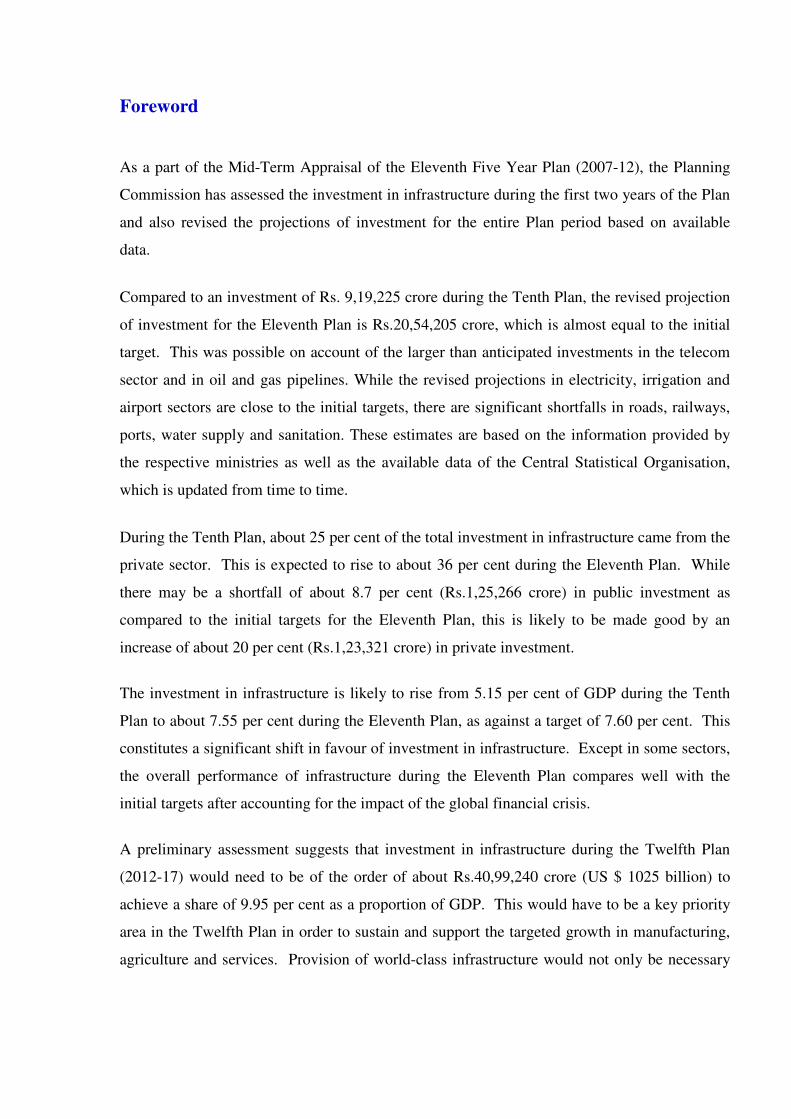
Foreword
As a part of the Mid-Term Appraisal of the Eleventh Five Year Plan (2007-12), the Planning
Commission has assessed the investment in infrastructure during the first two years of the Plan
and also revised the projections of investment for the entire Plan period based on available
data.
Compared to an investment of Rs. 9,19,225 crore during the Tenth Plan, the revised projection
of investment for the Eleventh Plan is Rs.20,54,205 crore, which is almost equal to the initial
target. This was possible on account of the larger than anticipated investments in the telecom
sector and in oil and gas pipelines. While the revised projections in electricity, irrigation and
airport sectors are close to the initial targets, there are significant shortfalls in roads, railways,
ports, water supply and sanitation. These estimates are based on the information provided by
the respective ministries as well as the available data of the Central Statistical Organisation,
which is updated from time to time.
During the Tenth Plan, about 25 per cent of the total investment in infrastructure came from the
private sector. This is expected to rise to about 36 per cent during the Eleventh Plan. While
there may be a shortfall of about 8.7 per cent (Rs.1,25,266 crore) in public investment as
compared to the initial targets for the Eleventh Plan, this is likely to be made good by an
increase of about 20 per cent (Rs.1,23,321 crore) in private investment.
The investment in infrastructure is likely to rise from 5.15 per cent of GDP during the Tenth
Plan to about 7.55 per cent during the Eleventh Plan, as against a target of 7.60 per cent. This
constitutes a significant shift in favour of investment in infrastructure. Except in some sectors,
the overall performance of infrastructure during the Eleventh Plan compares well with the
initial targets after accounting for the impact of the global financial crisis.
A preliminary assessment suggests that investment in infrastructure during the Twelfth Plan
(2012-17) would need to be of the order of about Rs.40,99,240 crore (US $ 1025 billion) to
achieve a share of 9.95 per cent as a proportion of GDP. This would have to be a key priority
area in the Twelfth Plan in order to sustain and support the targeted growth in manufacturing,
agriculture and services. Provision of world-class infrastructure would not only be necessary

for improving the competitiveness of the Indian economy but also for promoting inclusive
growth and improving the quality of life of the common man.
(Montek Singh Ahluwalia) January 13, 2011
1
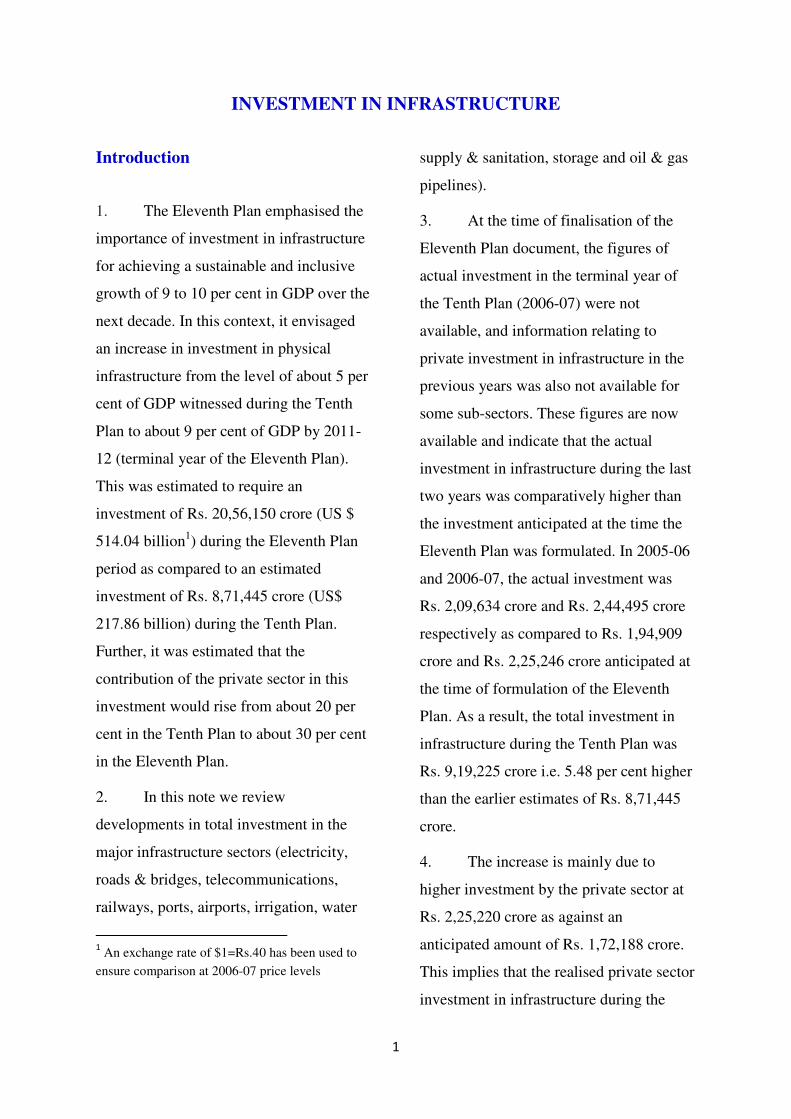
INVESTMENT IN INFRASTRUCTURE
Introduction
1. The Eleventh Plan emphasised the
importance of investment in infrastructure
for achieving a sustainable and inclusive
growth of 9 to 10 per cent in GDP over the
next decade. In this context, it envisaged
an increase in investment in physical
infrastructure from the level of about 5 per
cent of GDP witnessed during the Tenth
Plan to about 9 per cent of GDP by 2011-
12 (terminal year of the Eleventh Plan).
This was estimated to require an
investment of Rs. 20,56,150 crore (US $
514.04 billion1) during the Eleventh Plan
period as compared to an estimated
investment of Rs. 8,71,445 crore (US$
217.86 billion) during the Tenth Plan.
Further, it was estimated that the
contribution of the private sector in this
investment would rise from about 20 per
cent in the Tenth Plan to about 30 per cent
in the Eleventh Plan.
2. In this note we review
developments in total investment in the
major infrastructure sectors (electricity,
roads & bridges, telecommunications,
railways, ports, airports, irrigation, water
1 An exchange rate of $1=Rs.40 has been used to
ensure comparison at 2006-07 price levels
supply & sanitation, storage and oil & gas
pipelines).
3. At the time of finalisation of the
Eleventh Plan document, the figures of
actual investment in the terminal year of
the Tenth Plan (2006-07) were not
available, and information relating to
private investment in infrastructure in the
previous years was also not available for
some sub-sectors. These figures are now
available and indicate that the actual
investment in infrastructure during the last
two years was comparatively higher than
the investment anticipated at the time the
Eleventh Plan was formulated. In 2005-06
and 2006-07, the actual investment was
Rs. 2,09,634 crore and Rs. 2,44,495 crore
respectively as compared to Rs. 1,94,909
crore and Rs. 2,25,246 crore anticipated at
the time of formulation of the Eleventh
Plan. As a result, the total investment in
infrastructure during the Tenth Plan was
Rs. 9,19,225 crore i.e. 5.48 per cent higher
than the earlier estimates of Rs. 8,71,445
crore.
4. The increase is mainly due to
higher investment by the private sector at
Rs. 2,25,220 crore as against an
anticipated amount of Rs. 1,72,188 crore.
This implies that the realised private sector
investment in infrastructure during the

2
Tenth Plan was almost 24.50 per cent of
the total investment as against just below
20 per cent anticipated earlier. This
increase was largely due to a higher
investment realised in oil & gas pipelines,
electricity, irrigation, ports, storage and
airports during the Tenth Plan period.
Projections for the Eleventh Plan
5. Starting from a higher base of Rs.
2,44,495 crore in 2006-07, the total
investment in infrastructure during the first
two years of the Eleventh Plan has risen to
Rs. 3,03,807 crore in 2007-08 and Rs.
3,59,192 crore in 2008-09 as against the
earlier projected level of Rs. 2,70,273
crore and Rs. 3,21,579 crore respectively.
The contribution of the private sector in
the total investment in infrastructure in the
first two years of the Eleventh Plan was
34.32 per cent and 33.73 per cent
respectively, higher than the Eleventh Plan
target of 30 per cent investment by the
private sector.
6. Taking account of developments in
the first two years, the earlier projections
for the entire Eleventh Plan period have
been revised and it is now estimated that
the total investment in infrastructure in the
Eleventh Plan would be Rs. 20,54,205
crore, which is comparable to the earlier
estimates. The details are shown in
Table 1. The assumptions underlying the
projections are given in Annex-1.

3
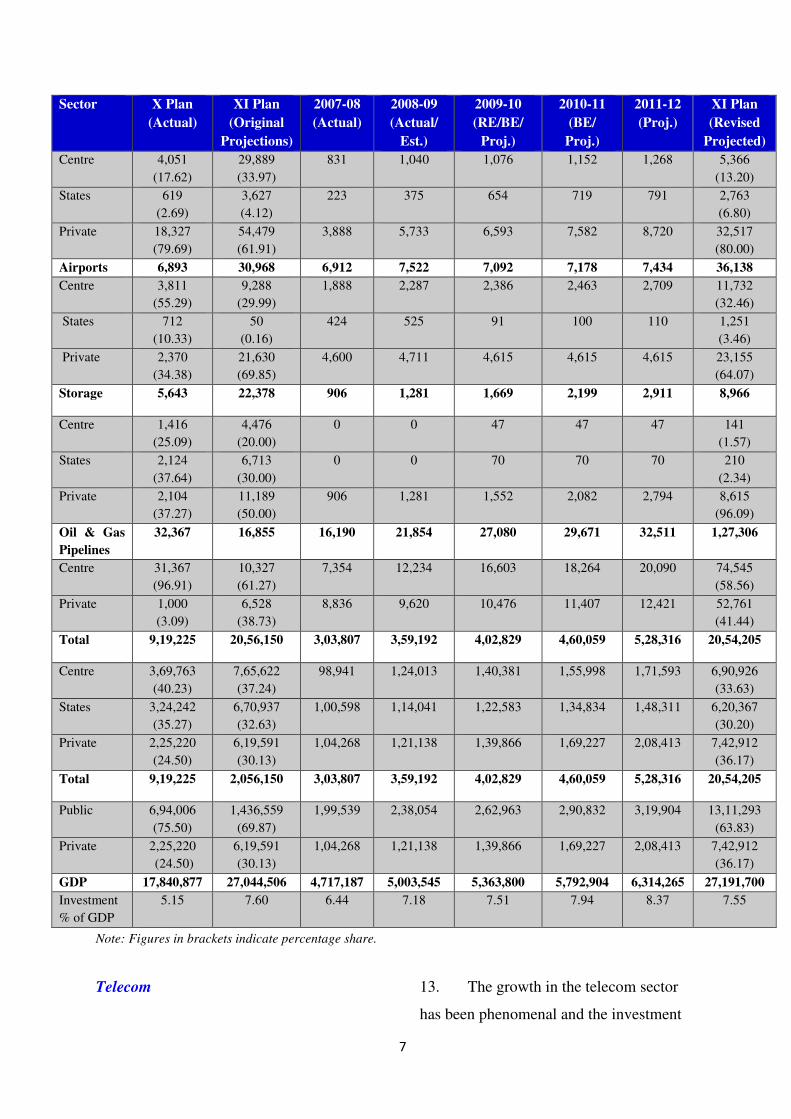
Table 1: Sector-wise Investments: Tenth Plan and Eleventh Plan
(Rs. crore at 2006-07 prices)
Note: Figures in brackets indicate sectoral shares compared to total investment in infrastructure.
Source: Planning Commission.
7. Higher level of investments has
also been observed in oil & gas pipelines,
airports and telecom in the first two years
of the Eleventh Plan. In addition, the
revised definition of infrastructure now
includes investments in oil pipelines (in
addition to gas pipelines), which is
expected to contribute an additional
investment of Rs. 1,08,190 crore during
the Eleventh Plan.
8. As shown in Table 2, starting from
a higher base of 5.71 per cent of GDP in
2006-07, the Eleventh Plan infrastructure
investment has reached 7.18 per cent of
GDP in 2008-09. This is expected to
increase to 8.37 per cent of GDP in the
terminal year of the Eleventh Plan period
which would yield an average of 7.55 per
cent of GDP for the Eleventh Plan as a
whole. The Eleventh Plan, is therefore,
Sector Tenth Plan Eleventh Plan
Original
Projections
Actual
Investments
Original
Projections
Revised
Projections
Electricity (incl. NCE) 2,91,850
(33.49)
3,40,237
(37.01)
6,66,525
(30.42)
6,58,630
(32.06)
Roads & Bridges 1,44,892
(16.63)
1,27,107
(13.83)
3,14,152
(15.28)
2,78,658
(13.57)
Telecommunications 1,03,365
(11.86)
1,01,889
(11.08)
2,58,439
(12.57)
3,45,134
(16.80)
Railways (incl. MRTS) 1,19,658
(13.73)
1,02,091
(11.11)
2,61,808
(12.73)
2,00,802
(9.78)
Irrigation (incl. Watershed) 1,11,503
(12.80)
1,19,894
(13.04)
2,53,301
(12.32)
2,46,234
(11.99)
Water Supply & Sanitation 64,803
(7.44)
60,108
(6.54)
1,43,730
(6.99)
1,11,689
(5.44)
Ports (incl. Inland waterways) 14,071
(1.61)
22,997
(2.50)
87,995
(4.28)
40,647
(1.98)
Airports 6,771
(0.78)
6,893
(0.75)
30,968
(1.51)
36,138
(1.76)
Storage 4,819
(0.55)
5,643
(0.61)
22,378
(1.09)
8,966
(0.44)
Oil & gas pipelines 9,713
(1.11)
32,367
(3.52)
16,855
(0.82)
1,27,306
(6.20)
Total 8,71,445
(100)
9,19,225
(100)
20,56,150
(100)
20,54,205
(100)
4
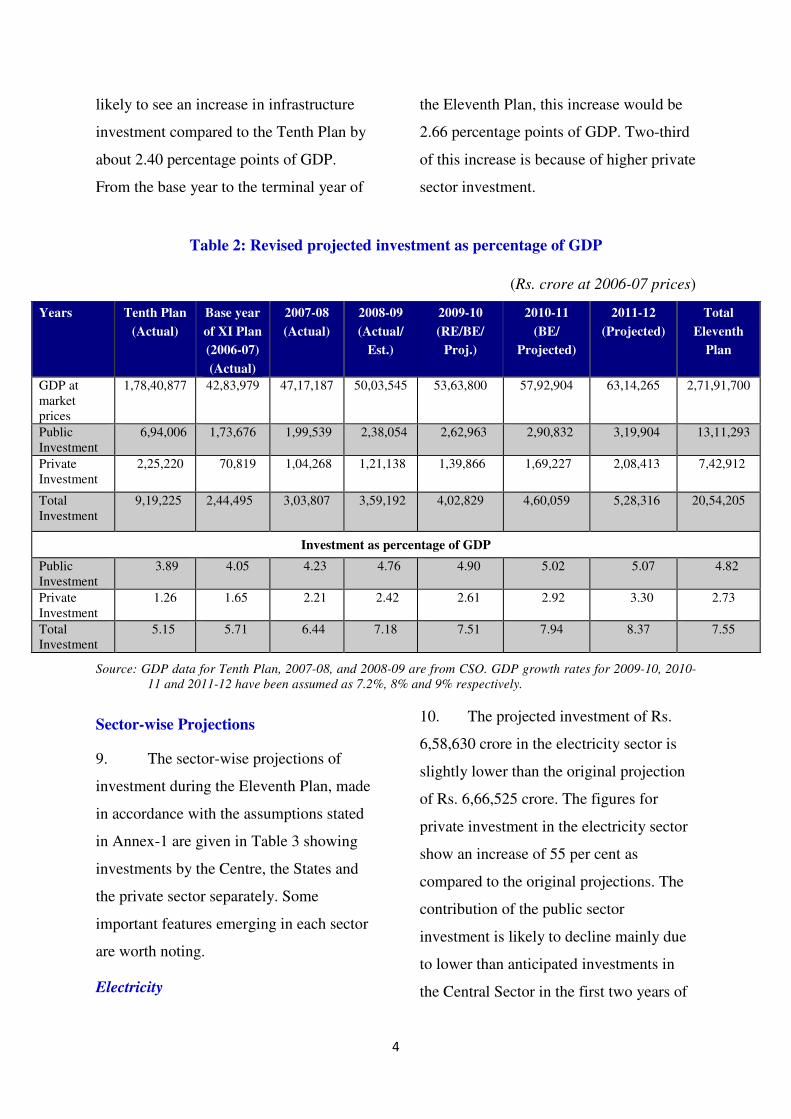
likely to see an increase in infrastructure
investment compared to the Tenth Plan by
about 2.40 percentage points of GDP.
From the base year to the terminal year of
the Eleventh Plan, this increase would be
2.66 percentage points of GDP. Two-third
of this increase is because of higher private
sector investment.
Table 2: Revised projected investment as percentage of GDP
(Rs. crore at 2006-07 prices)
Source: GDP data for Tenth Plan, 2007-08, and 2008-09 are from CSO. GDP growth rates for 2009-10, 2010-
11 and 2011-12 have been assumed as 7.2%, 8% and 9% respectively.
Sector-wise Projections
9. The sector-wise projections of
investment during the Eleventh Plan, made
in accordance with the assumptions stated
in Annex-1 are given in Table 3 showing
investments by the Centre, the States and
the private sector separately. Some
important features emerging in each sector
are worth noting.
Electricity
10. The projected investment of Rs.
6,58,630 crore in the electricity sector is
slightly lower than the original projection
of Rs. 6,66,525 crore. The figures for
private investment in the electricity sector
show an increase of 55 per cent as
compared to the original projections. The
contribution of the public sector
investment is likely to decline mainly due
to lower than anticipated investments in
the Central Sector in the first two years of
Years Tenth Plan
(Actual)
Base year
of XI Plan
(2006-07)
(Actual)
2007-08
(Actual)
2008-09
(Actual/
Est.)
2009-10
(RE/BE/
Proj.)
2010-11
(BE/
Projected)
2011-12
(Projected)
Total
Eleventh
Plan
GDP at market prices
1,78,40,877 42,83,979 47,17,187 50,03,545 53,63,800 57,92,904 63,14,265 2,71,91,700
Public Investment
6,94,006 1,73,676 1,99,539 2,38,054 2,62,963 2,90,832 3,19,904 13,11,293
Private Investment
2,25,220 70,819 1,04,268 1,21,138 1,39,866 1,69,227 2,08,413 7,42,912
Total Investment
9,19,225
2,44,495 3,03,807 3,59,192 4,02,829 4,60,059 5,28,316 20,54,205
Investment as percentage of GDP
Public Investment
3.89 4.05 4.23 4.76 4.90 5.02 5.07 4.82
Private Investment
1.26 1.65 2.21 2.42 2.61 2.92 3.30 2.73
Total Investment
5.15 5.71 6.44 7.18 7.51 7.94 8.37 7.55

5
the Eleventh Plan. Capacity addition of
62,374 MW is likely to be achieved during
the Eleventh Plan as compared to a target
of 78,700 MW.
Roads
11. The projected investment in road
sector is also significantly lower at Rs.
2,78,658 crore compared with Rs.
3,14,152 crore in the original projections.
The investment by the Centre is expected
to decline due to award of lower than
projected road projects by NHAI during
the first three years of the Plan. It is
interesting to note that investment in the
road sector by the States is expected to
increase on account of higher investments
under PMGSY.
12. The investment by the private
sector is also expected to go down due to
award of a lower number of BOT projects
in the first three years of the Eleventh
Plan. However, MORTH has decided to
speed up the award and implementation of
NHDP to achieve a completion rate of 20
kms of highways per day. This is likely to
increase the investment during the last two
years of the Eleventh Plan, but the major
build up in expenditure consequent to this
acceleration will be in the Twelfth Plan.
Table 3: Revised Projections of Investment in Infrastructure during Eleventh Plan

6
(Rs. crore at 2006-07 prices) Sector X Plan
(Actual)
XI Plan
(Original
Projections)
2007-08
(Actual)
2008-09
(Actual/
Est.)
2009-10
(RE/BE/
Proj.)
2010-11
(BE/
Proj.)
2011-12
(Proj.)
XI Plan
(Revised
Projected)
Electricity
(incl. NCE)
3,40,237 6,66,525 1,11,134 1,17,093 1,25,958 1,44,974 1,59,471 6,58,630
Centre 1,02,665
(30.17)
2,55,316
(38.31)
29,386 36,769 39,528 49,900 54,890 2,10,474
(31.96)
States 1,00,738
(29.61)
2,25,697
(33.86)
27,252 30,109 31,193 34,313 37,744 1,60,611
(24.39)
Private 1,36,834
(40.22)
1,85,512
(27.83)
54,497 50,215 55,237 60,760 66,836 2,87,546
(43.66)
Roads &
Bridges
1,27,107 3,14,152 42,741 48,108 54,638 63,183 69,988 2,78,658
Centre 50,468
(39.71)
1,07,359
(34.17)
12,963 14,876 17,370 21,765 23,942 90,916
(32.63)
States 67,416
(53.04)
1,00,000
(31.83)
22,769 25,660 28,225 31,048 34,153 1,41,855
(50.91)
Private 9,223
(7.26)
1,06,792
(33.99)
7,009 7,572 9,043 10,370 11,893 45,887
(16.47)
Telecom 1,01,889 2,58,439 31,900 52,295 64,206 84,339 1,12,394 3,45,134
Centre 48,213
(47.32)
80,753
(31.25)
7,894 11,048 13,186 13,988 15,387 61,503
(17.82)
Private 53,676
(52.68)
1,77,686
(68.75)
24,007 41,248 51,019 70,351 97,007 2,83,631
(82.18)
Railways
(incl.
MRTS)
1,02,091 2,61,808
31,182 39,095 42,830 40,875 46,820 2,00,802
Centre 98,914
(96.89)
2,01,453
(76.95)
29,594 35,863 39,548 36,675 40,343 1,82,024
(90.65)
States 2,508
(2.46)
10,000
(3.82)
1,128 2,554 2,048 2,253 2,479 10,462
(5.21)
Private 669
(0.66)
50,354
(19.23)
460 677 1,233 1,947 3,999 8,316
(4.14)
Irrigation
(incl. WS)
1,19,894 2,53,301 38,789 44,858 49,093 54,045 59,449 2,46,234
Centre 8,597
(7.17)
24,759
(9.77)
1,831 2,133 2,095 2,348 2,583 10,990
(4.46)
States 1,11,296
(92.83)
2,28,543
(90.23)
36,958 42,725 46,997 51,697 56,867 2,35,244
(95.54)
Water
Supply &
Sanitation
60,108 1,43,730 19,110 19,939 21,941 24,141 26,559 1,11,689
Centre 20,261
(33.71)
42,003
(29.22)
7,201 7,764 8,541 9,395 10,334 43,235
(38.71)
States 38,830
(64.60)
96,306
(67.00)
11,845 12,094 13,303 14,633 16,096 67,971
(60.86)
Private 1,018
(1.69)
5,421
(3.77)
65 81 97 113 128 484
(0.43)
Ports 22,997 87,995 4,942 7,148 8,323 9,454 10,779 40,647
7
Sector X Plan
(Actual)
XI Plan
(Original
Projections)
2007-08
(Actual)
2008-09
(Actual/
Est.)
2009-10
(RE/BE/
Proj.)
2010-11
(BE/
Proj.)
2011-12
(Proj.)
XI Plan
(Revised
Projected)
Centre 4,051
(17.62)
29,889
(33.97)
831 1,040 1,076 1,152 1,268 5,366
(13.20)
States 619
(2.69)
3,627
(4.12)
223 375 654 719 791 2,763
(6.80)
Private 18,327
(79.69)
54,479
(61.91)
3,888 5,733 6,593 7,582 8,720 32,517
(80.00)
Airports 6,893 30,968 6,912 7,522 7,092 7,178 7,434 36,138
Centre 3,811
(55.29)
9,288
(29.99)
1,888 2,287 2,386 2,463 2,709 11,732
(32.46)
States 712
(10.33)
50
(0.16)
424 525 91 100 110 1,251
(3.46)
Private 2,370
(34.38)
21,630
(69.85)
4,600 4,711 4,615 4,615 4,615 23,155
(64.07)
Storage 5,643 22,378 906 1,281 1,669 2,199 2,911 8,966
Centre 1,416
(25.09)
4,476
(20.00)
0 0 47 47 47 141
(1.57)
States 2,124
(37.64)
6,713
(30.00)
0 0 70 70 70 210
(2.34)
Private 2,104
(37.27)
11,189
(50.00)
906 1,281 1,552 2,082 2,794 8,615
(96.09)
Oil & Gas
Pipelines
32,367 16,855 16,190 21,854 27,080 29,671 32,511 1,27,306
Centre 31,367
(96.91)
10,327
(61.27)
7,354 12,234 16,603 18,264 20,090 74,545
(58.56)
Private 1,000
(3.09)
6,528
(38.73)
8,836 9,620 10,476 11,407 12,421 52,761
(41.44)
Total 9,19,225 20,56,150 3,03,807 3,59,192 4,02,829 4,60,059 5,28,316 20,54,205
Centre 3,69,763
(40.23)
7,65,622
(37.24)
98,941 1,24,013 1,40,381 1,55,998 1,71,593 6,90,926
(33.63)
States 3,24,242
(35.27)
6,70,937
(32.63)
1,00,598 1,14,041 1,22,583 1,34,834 1,48,311 6,20,367
(30.20)
Private 2,25,220
(24.50)
6,19,591
(30.13)
1,04,268 1,21,138 1,39,866 1,69,227 2,08,413 7,42,912
(36.17)
Total 9,19,225 2,056,150 3,03,807 3,59,192 4,02,829 4,60,059 5,28,316 20,54,205
Public 6,94,006
(75.50)
1,436,559
(69.87)
1,99,539 2,38,054 2,62,963 2,90,832 3,19,904 13,11,293
(63.83)
Private 2,25,220
(24.50)
6,19,591
(30.13)
1,04,268 1,21,138 1,39,866 1,69,227 2,08,413 7,42,912
(36.17)
GDP 17,840,877 27,044,506 4,717,187 5,003,545 5,363,800 5,792,904 6,314,265 27,191,700
Investment
% of GDP
5.15
7.60 6.44 7.18 7.51 7.94 8.37 7.55
Note: Figures in brackets indicate percentage share.
Telecom
13. The growth in the telecom sector
has been phenomenal and the investment

8
is expected to be Rs. 3,45,134 crore which
is 1.3 times higher than the originally
estimated figure of Rs. 2,58,439 crore at
the time of the formulation of the Eleventh
Plan. This is due to increase in investment
by the private sector to a level 1.59 times
higher than the investment envisaged at
the time of formulation of the Eleventh
Plan. Competition in this sector has been
quite intense, as a result of which the
economy and the users have benefitted
through increased investments and
improved quality of service at competitive
costs.
14. In contrast, investment by the
Centre in telecommunications is expected
to be 23.84 per cent lower than projected
when the Eleventh Plan was formulated.
Railways
15. The projected investment in
railways, including metro railways, in the
Eleventh Plan is now expected to be about
Rs. 2,00, 802 crore which is 23.3 per cent
lower than the earlier projection of Rs.
2,61,808 crore. Both Central sector
investment and private investment are
lower than the original projections. As per
latest estimates only Rs. 8,316 crore is
expected by way of private investment
which is only 16.5 per cent of original
projections.
16. Railways have opened up container
movement to competition and 16 entities
have been granted concessions for
operating container trains. However, in
other areas progress in pushing PPP
investment has been slow. The Ministry
has identified 50 stations for development
as world class stations through the PPP
route but no concessions have been
awarded. It has also invited expressions of
interest for the development of logistic
parks through PPP. A 60 km elevated fully
air-conditioned rail system in Mumbai is
also proposed to be implemented through
PPP. These projects need to be speeded up
to tap the full potential.
17. Several PPP initiatives have been
taken up for provision of metro rail
systems in different cities. The Delhi
Metro Rail Corporation has awarded the
work of installation of systems, including
supply of rolling stock and operation of the
Airport Express Line on PPP basis. Two
lines in the Mumbai Metro project have
been awarded on PPP basis. The
Hyderabad Metro Rail project has been
awarded on PPP basis while the Bangalore
High Speed Rail Project is also being
structured on the PPP mode.
Ports
18. Progress in this sector has been
much below expectations. The investments

9
during the Eleventh Plan are now
projected at a level of Rs. 40,647 crore
which is less than half of the original
projection of Rs. 87,995 crore. Private
investment in the port sector is also
expected to be almost 40.31 per cent lower
as compared to the projections made at the
beginning of the Plan. This is because very
few PPP projects have been awarded by
the respective Port Trusts in the first two
years of the Eleventh Plan. Ministry of
Shipping has revised the original target of
545 MMT of additional capacity for the
major ports downwards and now proposes
to develop only 48 projects with a
capacity of 393.27 MMT costing Rs.
29,905 crore over the Eleventh Plan
period.
19. Compared to the slow progress in
capacity addition in major ports, the
private sector ports in the state sector have
done relative well. Out of the total private
investment of Rs.32,517 crore projected
for the Eleventh Plan, the share of private
investment in the state sector is Rs. 26,370
crore.
Airports
20. The investment in Eleventh Plan is
now projected at Rs. 36,138 crore as
against the original estimate of Rs. 30,968
crore and both public and private
investments in airports are likely to
increase compared to the investment
projected at the beginning of the Eleventh
Plan. Private investment is expected to
contribute Rs. 23,155 crore which is 64.07
per cent of the total investment in airport
infrastructure. The investment in state
sector airports has taken a dip from 2009-
10 onwards because of the completion of
the Hyderabad and Bangalore projects.
Oil and Gas pipelines
21. The investment in oil and gas
pipelines in the Eleventh Plan is expected
to increase to Rs. 1,27,306 crore as against
the original figure of Rs. 16,855 crore. The
much larger figure is primarily because the
data include investment in oil pipelines
whereas the earlier data only included gas
pipelines. The investment in oil pipelines
alone during the Eleventh Plan is projected
at Rs. 1,08,190 crore. This category
includes large investment by the Centre
also.
Water Supply
22. The total investment in water
supply and sanitation in the Eleventh Plan
is now estimated at Rs. 1,11,689 crore,
about 22 per cent lower than the original
projection of Rs. 1,43,730 crore. The
Eleventh Five Year Plan strategy for urban
development includes departure from the
10
exclusive public sector monopoly over
urban infrastructure opening up the
possibility of investment in this area.
However, private sector investment in
water supply and sanitation is likely to be
small initially and may not exceed 2 per
cent of the total investment in this sector.
Irrigation
23. Investment in irrigation and
watershed management is a critical part of
rural infrastructure. It remains a public
sector activity only because the sector is
nowhere near being commercially viable
since water charges account for only about
20 per cent of operating costs. The total
investment in this sector is expected to be
about Rs. 2,46,234 crore in the Eleventh
Plan which is 7.52 per cent higher than
earlier anticipated and it will be more than
double the investment of Rs. 1,19,894
crore realised in the Tenth Plan.
Rural Infrastructure
24. The sectoral projections presented
in Table 3 cover investments in both urban
and rural areas. The rural investment
component is important in keeping with
the Eleventh Plan which emphasises broad
based inclusive growth of the economy
with a special effort at bridging the rural-
urban divide.
25. Bharat Nirman, which was
launched in 2005, for upgradation of rural
infrastructure comprehensively across its
sub-sectors, aims to provide electricity to
1,25,000 villages and to 23 million
households; to connect the remaining
66,802 habitations with all weather roads
and construct 1,46,185 km of new rural
roads network; to provide drinking water
to 55,067 uncovered habitations; to
provide irrigation to an additional 10
million hectares; and connect the
remaining 66,822 villages with telephones.
It is estimated that out of the total
projected investment of Rs. 13,11,293
crore to be incurred by the Centre and the
States on all infrastructure sectors during
the Eleventh Plan, about Rs 3,93,388 crore
(or 30%) would be spent exclusively
towards improvement of rural
infrastructure.
Projected Investment in the Twelfth
Plan
26. The projections presented in Table
4 suggest that the economy will enter the
Twelfth Plan in a much stronger position
as far as infrastructure is concerned than
existed at the start of the Eleventh Plan.
Investment in infrastructure will be around
8.37 per cent of GDP in the base year of
the Twelfth Plan. If GDP in the Twelfth
Plan period grows at a rate above 9 per

11
cent, it should be possible to increase the
rate of investment in infrastructure to
around 10.70 per cent in the terminal year
of the Twelfth Plan period as indicated in
Table 4. These projections imply that the
investment in the infrastructure sector
during the Twelfth Plan would be of the
order of Rs. 40,99,240 crore or US $
1,024.81 billion. At least 50 per cent of
this should come from the private sector.
This would imply that public sector
investment in infrastructure would
increase from Rs. 13,11,293 crore in the
Eleventh Plan to around Rs. 20,49,620
crore in the Twelfth Plan at 2006-07
prices. This requires an annual increase of
about 9.34 per cent in real terms.
Table 4: Projected Investment in Infrastructure during the Twelfth Five Year Plan
(Rs. crore at 2006-07 prices)
Year Base
Year
(2011-12)
2012-13 2013-14 2014-15 2015-16 2016-17 Total
12th Plan
GDP at market prices (Rs. crore)
63,14,265 68,82,549 75,01,978 81,77,156 89,13,100 97,15,280 4,11,90,064
Rate of growth of GDP (%)
9.00 9.00 9.00 9.00 9.00 9.00 9.00
Infrastructure investment as % of GDP
8.37 9.00 9.50 9.90 10.30 10.70 9.95
Infrastructure investment (Rs. crore)
5,28,316 6,19,429 7,12,688 8,09,538 9,18,049 10,39,535 40,99,240
Infrastructure investment (US $ billion) @ Rs.40/$
132.08 154.86 178.17 202.38 229.51 259.88 1,024.81
Policy initiatives to promote private
participation
27. A number of initiatives were taken
in the course of the Eleventh Plan to
accelerate the pace of investment in
infrastructure. In particular, the government
has taken several initiatives for
standardizing the documents and processes
for structuring and award of PPP projects in
a transparent and competitive manner (see
Box-1).
Committee on Infrastructure (COI)
28. The Committee on Infrastructure
(COI) was constituted on August 31, 2004
under the chairmanship of the Prime
Minister. Its members included the Finance

12
Minister, the Deputy Chairman, Planning
Commission and the Ministers-in-charge of
infrastructure ministries. The objective of
COI was to initiate policies that would
ensure time-bound creation of world class
infrastructure, develop structures that
maxims the role of PPPs, and monitor the
progress of key infrastructure projects to
ensure that established targets are realised.
Cabinet Committee on Infrastructure
(CCI)
29. In July 2009 the COI was replaced
by a Cabinet Committee on Infrastructure
chaired by the Prime Minister to give
further impetus to initiatives for
development of infrastructure. CCI
approves and reviews policies and projects
across infrastructure sectors. It considers
and decides financial, institutional and legal
measures required to enhance investment in
infrastructure sectors.
Public–Private Partnership Appraisal
Committee (PPPAC)
30. With a view to streamlining and
simplifying the appraisal and approval
process for PPP projects, a Public Private
Partnership Appraisal Committee had been
constituted under the chairmanship of
Secretary, Department of Economic Affairs
with Secretary, Planning Commission as
one of the members. PPP proposals are
appraised by the Planning Commission and
approved by the PPPAC. The PPPAC
conducts a thorough scrutiny and due
diligence in the formulation, appraisal and
approval of PPP projects. It has approved
192 projects with estimated project cost of
Rs. 1,62,550 crore by May 2010.
Empowered Committee/ Institution
(EC/EI)
31. An institutional framework
comprising an inter-ministerial Empowered
Committee has been established for the
purpose of appraising and approving
projects for availing the VGF grant of up to
20 per cent of the cost of infrastructure
projects undertaken through PPP. Until
May 2010, it has approved 63 projects in
the State sector involving a total capital
investment of Rs. 41,422 crore.
Viability Gap Funding (VGF)
32. Recognising that the externalities
engendered by infrastructure projects
cannot always be captured by project
sponsors, a Viability Gap Funding (VGF)
Scheme was notified in 2006 to enhance the
financial viability of competitively bid
infrastructure projects. Under the scheme,
grant assistance of upto 20 per cent of
capital cost is provided by the Central
Government to PPP projects undertaken by
any Central Ministry, State Government,
13
statutory entity or local body. An additional
grant of up to 20 per cent of project costs
can be provided by the sponsoring Ministry,
State Government or project authority. Up
to May 2010, 255 projects had been
approved by the PPPAC and EC/EI with a
capital investment of Rs. 2,03,972 crore.
India Infrastructure Finance Company
Ltd (IIFCL)
33. IIFCL, was established by the
Central Government for providing long-
term loans for financing infrastructure
projects that typically involve long
gestation periods, provides financial
assistance of up to 20 per cent of the project
costs, both through direct lending to project
companies and by refinancing banks and
financial institutions. It has raised Rs.
20,569 crore and approved 139 projects
involving total investment of Rs. 2,00,884
crore by May 2010. Out of these 139
projects, financial closure has been
achieved in 126 projects with investment of
Rs. 1,74,446 crore.
Model Documents
34. Recognising the need for a
standardised framework for PPPs, the COI
encouraged the creation of standard
documents for bidding and also for award
of concessions. Creation of a standardised
framework ensures transparency in the
allocation of risk, clarity in the obligation of
the concessionaire and minimisation of
possibilities of disputes arising from the
agreement. It enables robust competitive
bidding for individual projects with a
reasonable commonality in approach across
projects, which is an important aspect of
good governance.
35. To underpin this approach, a large
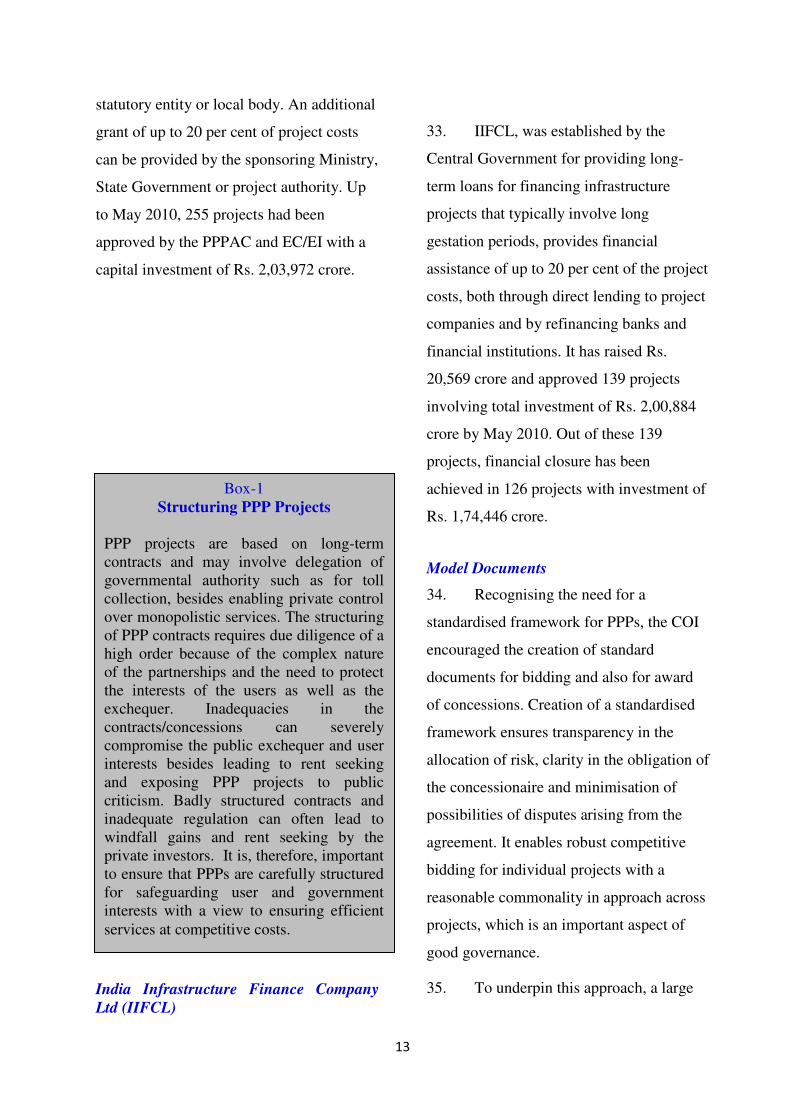
Box-1 Structuring PPP Projects
PPP projects are based on long-term contracts and may involve delegation of governmental authority such as for toll collection, besides enabling private control over monopolistic services. The structuring of PPP contracts requires due diligence of a high order because of the complex nature of the partnerships and the need to protect the interests of the users as well as the exchequer. Inadequacies in the contracts/concessions can severely compromise the public exchequer and user interests besides leading to rent seeking and exposing PPP projects to public criticism. Badly structured contracts and inadequate regulation can often lead to windfall gains and rent seeking by the private investors. It is, therefore, important to ensure that PPPs are carefully structured for safeguarding user and government interests with a view to ensuring efficient services at competitive costs.

14
number of standardised documents have
been developed based on extensive inter-
Ministerial consultations. These have been
published by the Planning Commission to
promote and facilitate development of
infrastructure. In several cases e.g., roads
and ports, the Planning Commission has
published model concession agreements
that would be used by state governments for
State PPPs. The Commission has been
involved in consultations with state
governments on PPP initiatives and stands
ready to give advice when asked.
36. A list of the Model Concession
Agreements published by the Planning
Commission is given in Box-2.
37. A list of model bidding documents
published by the Planning Commission is
given in Box-3 below:
Box-2
Model Concession Agreements for
PPP Projects
� National Highways
� State Highways
� Operation & Maintenance of
Highways
� National Highways (Six Laning)
� Urban Rail Transit Systems
� Non-Metro Airports
� Greenfield Airports
� Port Terminals
� Operation of Container Trains
� Re-development of Railway Stations
� Procurement-cum-Maintenance Agreement for Locomotives
� Transmission of Electricity
Box-3
Model Bidding Documents for PPP
Projects

15
38. A number of Guidelines, Reports
and Manuals have been issued in pursuance
of the initiatives described above. The
Guidelines and Manuals published by the
Planning Commission are listed in Box-4.
39. The government has identified
several areas for reform of policy and
processes. Based on inter-Ministerial
deliberations, a number of Reports have
been prepared and their recommendations
adopted. These are listed in Box-5.
Box-5
Reports
� Financing of the National Highways
Development Programme
� Financing Plan for Airports.
� Financing Plan for Ports
� Restructuring of NHAI
� Monitoring of PPP Projects
� Projections of the Eleventh Five
Year Plan: Investment in
Infrastructure
� Delhi-Mumbai and Delhi-Howrah
Freight Corridors
� Road Rail Connectivity of Major
Ports
� Customs Procedures of Container
Freight Stations and Ports
� Simplification of Customs
Procedures in Air Cargo and
Airports
� Measures for Operationalising
Open Access in the Power Sector
� Tariff Setting for PPP Projects in
Major Ports
� Toll Policy for National Highways
� Road Safety and Traffic
Management
� Reducing Dwell Time of Cargo at
Ports
� Norms & Standards for Capacity of
Airport Terminals
� Approach to Regulation of
Infrastructure
� Private Participation in
Infrastructure
� Selection of Consultants: Best
Practices
� Compendium of PPP Projects in
Infrastructure
� Compendium of PPP Projects in
State Highways
� Frequently Asked Questions (FAQs)
on Model RFQ Document
Box-4
Guidelines and Manuals
� Guidelines for Financial Support to
PPPs in Infrastructure (VGF Scheme)
� Guidelines on Formulation, Appraisal
and Approval of PPP Projects (PPPAC)
� Guidelines for Establishing Joint
Ventures in Infrastructure
� Guidelines for Monitoring of PPP
Projects
� Scheme for Financing Infrastructure
Projects through IIFCL
� Manual of Specifications & Standards
for Two-laning of Highways
� Manual of Specifications & Standards
for Four-laning of Highways

16
40. The Planning Commission has
initiated an exercise to revise the financing
plans in various infrastructures sectors
after taking into account the progress made
so far and the likely investment during the
remaining years of the Eleventh Plan and
the entire Twelfth Plan period.
Participation of State Governments
41. In a federal country like India,
participation and support of the State
Governments is essential for development
of world class infrastructure. The State
Governments’ support in maintenance of
law and order, land acquisition,
rehabilitation and settlement of displaced
persons, shifting of utilities and obtaining
environmental clearances is necessary for
the projects undertaken by the Central
Government or the private sector. Many
State Governments have also initiated
several PPP projects for improving
infrastructure. The participation of states
has been improving steadily over the
years.
Way Forward
42. Against the backdrop of the
financial crisis, the performance of the
infrastructure sector has shown the
resilience of the economy and its capacity
to shield itself from such external
influences. Although the projections for
the Eleventh Plan have been downsized for
some sectors keeping in mind the targets
achieved in the first two years of the Plan,
however, it is expected that with the
revival of the economy and the upbeat
investment sentiment prevailing, the actual
performance may turn out to be better than
the revised projections of the Eleventh
Plan contained in this note.

17
Annex-1
Assumptions underlying the revised Investment Forecast
1. In making the projections for the
Central sector, RE figures for the year
2009-10 and BE figures for 2010-11 have
been adopted and thereafter, a growth
rate of 10 per cent has been assumed for
the terminal year of the Plan. For the
State sector, the actual expenditure for
2008-09 has been taken into account and
an annual growth rate of 10 per cent over
the 2009-10 BE data has been assumed
for making projections for the subsequent
years of the Eleventh Plan.
2. For making projections for the
private sector, actual GCF data has been
taken from CSO in respect of the
electricity, telecom and storage sectors
for the period from 2002-03 to 2008-09.
While projections in respect of the
telecom and storage sectors for the years
2009-10 onwards are based on log linear
method using the time series data of past
five years, projections in electricity sector
are based on an anticipated growth rate of
10 per cent per annum over the 2008-09
data to reflect the current pace of
accelerated capacity addition.
3. For making projections of private
investment in roads, railways, ports and
airports, the time series data from 2002-
03 to 2008-09 has been provided by the
respective ministries. Projections in roads
and ports for the years 2009-10 onwards
are based on a growth rate of 15 per cent
per annum over 2008-09 in view of the
accelerated programmes in these sectors.
Projections in railways from 2009-10
onwards are based on the log linear
method using a time series of the past
five years. In airports, no growth in
private investment has been assumed
over the 2009-10 data as some of the PPP
projects have been completed and no new
projects have been awarded.
4. In the case of oil & gas pipelines,
the data relating to private investment has
been provided by the Ministry of
Petroleum and Natural Gas for 2008-09
and 2009-10 only. Investment in the year
2009-10 is higher by about 15 per cent as
compared to the investment in 2008-09.
Estimated investment in the remaining
two years of the Plan has been assumed
by projecting an annual increase of 15 per
cent. Similarly, the investment in 2007-
08 has been estimated by reducing the
investment by a corresponding rate.
Private sector projections for water
supply and sanitation during the Eleventh
Plan are based on the total estimated
investment indicated by the Ministry of

18
Urban Development, which has been
suitably phased out over the Plan period.
5. In case of storage, due to negative
gross capital formation of public sector in
the years 2007-08 and 2008-09, the data
has been taken as zero and projections for
the remaining three years have been
retained at the level of 2006-07. Public
sector GCF for Centre and States has
been assumed in the ratio of 40:60.