investment and sovereign research seprod limited
TRANSCRIPT

1 | P a g e
INVESTMENT AND SOVEREIGN RESEARCH August-7-2020
All information contained herein is obtained by JMMB® Investment Research from sources believed by it to be accurate and reliable. All opinions and estimates constitute the Analyst’s judgment as of the date of the report. However, neither its accuracy and completeness NOR THE OPINIONS BASED THEREON ARE GUARANTEED. As such NO WARRANTY, EXPRESS OR IMPLIED, AS TO THE ACCURACY, TIMELINESS OR COMPLETENESS OF THIS REPORT IS GIVEN OR MADE BY JMMB® IN ANY FORM WHATSOEVER.
Seprod Limited
PLEASE SEE IMPORTANT DISCLOSURES & COPYRIGHT INFRINGEMENT IN THE APPENDIX
Executive Summary
Seprod Limited is a leading Jamaican manufacturing, agribusiness and distribution company. The
Company maintains large positions in the Jamaican market for several products including edible
oils and fats, milk and sweetened condensed milk. In addition, it owns many consumer brands
such as: Betty, Butterkist, Chef, Chiffon, Cool Fruit, Gold Seal, Golden Grove, Lider, Miracle, Serge,
Supligen and Swizzle. Seprod was founded in 1944 and was listed on the Jamaica Stock Exchange
in 1985.
Over the past few years, Seprod has made several moves which have begun to bear fruit and has
taken the decision to discontinue its failed venture in sugar manufacturing, which generated
billions in losses over the years. Seprod is susceptible to economic headwinds such as weak
economic growth, high inflation and weak business & consumer confidence especially given the
uncertainty surrounding the economic impact of the coronavirus pandemic.
We face challenges in accurately estimating the impact the global pandemic has and will have on
Seprod. With these limitations in mind, we estimate revenues of $37.22B for the 2020FY and net
profit attributable to shareholders of $1.94B, increases of 13.8% and 81.3%, respectively.
Shareholders’ equity is seen increasing by 6.3% to $15.91B.
We recommend Seprod Limited as MARKETWEIGHT/MARKETPERFORM/HOLD as our estimate of
the fair value is in line with the current market value.
Company Background
Seprod Limited was incorporated in Jamaica in July 1940 and became a publicly-listed company
in 1985. Seprod now operates with three business lines: Ingredients, Dairy and Distribution. The
Ingredients division consists of Seprod’s joint venture with Seaboard Corporation, Jamaica Grain
and Cereals Limited, which commenced flour production in December 2017. The operation also
produces cornmeal and grits in bulk as well as consumer-size packages. In 2019, the company
divested its sugar manufacturing operation after racking up significant losses over the years after
acknowledging the sectors significant structural inefficiencies.

2 | P a g e
INVESTMENT AND SOVEREIGN RESEARCH August-7-2020
All information contained herein is obtained by JMMB® Investment Research from sources believed by it to be accurate and reliable. All opinions and estimates constitute the Analyst’s judgment as of the date of the report. However, neither its accuracy and completeness NOR THE OPINIONS BASED THEREON ARE GUARANTEED. As such NO WARRANTY, EXPRESS OR IMPLIED, AS TO THE ACCURACY, TIMELINESS OR COMPLETENESS OF THIS REPORT IS GIVEN OR MADE BY JMMB® IN ANY FORM WHATSOEVER.
Seprod Limited
The Dairy line has been expanded with the integration of the dairy operation formerly owned
and operated by the Nestle Group. The operation includes the physical assets based in Bog Walk,
St. Catherine and the “Betty” and “Supligen” brands. The acquisition of Facey Consumer forms
the foundation of the Distribution arm of Seprod.
Financial Performance – Year ended December 31, 2019
Profitability
Seprod Limited reported net profits attributable to shareholders of $1.07B for the 2019 financial
year, down 9.7% or $114.59M year-over-year. Net profits from continuing operations
attributable to shareholders amounted to $1.71B, up 24.3% or $333.22M year-over-year, while
net loss from discontinued operations attributable to shareholders amounted to $638.21M, up
235.2% or $447.81M year-over-year. The increase in profits from continuing operations was
attributed to “efficiencies gained from internal reorganizations of the ingredients and the
distribution businesses, and from the consolidation of the dairy business. Losses from
discontinued operations represent the sugar manufacturing business’ results.
Revenues totalled $32.69B for the year, up 45.3% from the year prior or $10.2B while direct
expenses were up 53.3% to $23.89B. The surge in revenues and direct costs reflects the first full
year of Facey Consumer Division being integrated into the Seprod Group. Direct expenses grew
faster than revenues, which resulted in a decline the gross profit margin to 26.9% from 30.7%.
Gross profits amounted to $8.8B, up 27.3% year-over-year.
Finance and other operating income grew by 56.2% to $1.31B while selling expense fell by 36.5%
to $449.96M and administrative expenses surged 52.8% to $6.89B. The increase in ‘finance and

3 | P a g e
INVESTMENT AND SOVEREIGN RESEARCH August-7-2020
All information contained herein is obtained by JMMB® Investment Research from sources believed by it to be accurate and reliable. All opinions and estimates constitute the Analyst’s judgment as of the date of the report. However, neither its accuracy and completeness NOR THE OPINIONS BASED THEREON ARE GUARANTEED. As such NO WARRANTY, EXPRESS OR IMPLIED, AS TO THE ACCURACY, TIMELINESS OR COMPLETENESS OF THIS REPORT IS GIVEN OR MADE BY JMMB® IN ANY FORM WHATSOEVER.
Seprod Limited
other operating income’ was driven by a 158% increase in ‘net foreign exchange gains and losses’
to $863.01M. As a result, Seprod reported an operating profit of $2.8B for the 2019FY, which
was up 12.9% year-over-year. EBITDA amounted to $1.39B, down 0.9% year-over-year, driven by
a 30.1% increase in depreciation expense to $900.83M and an 85.5% increase in amortisation of
intangible assets to $243.03M. The EBITDA margin stood at 12.2%, which compared to 14.8% a
year prior.
Pre-tax profits amounted to $1.39B, down 20.8% year-over-year, as finance costs rose 86.7% to
$1.47B. Total net profit amounted to $973.33M, down 8.4% year-over-year. The pre-tax profit
margin fell from 7.8% to 4.2% year-over-year while the net profit margin stood at 3.3%, down
from 5.3% for the prior year. The return of assets stood at 3.0%, compared to 4.3% a year prior
while the return on equity stood at 7.0%, relative to 9.2% in 2018.
Solvency & Liquidity
As at December 31, 2019, Seprod’s total assets amounted to $36.5B, a 3.4% or $1.2B increase,
year-over-year. Non-current assets amounted to $22.07B, a 6.7% increase year-over-year while
current assets amounted to $14.43B, down 1.2% from the prior year’s balance. The increase in
non-current assets was driven by the booking of $1.04B in right of use assets and an 85% increase
in deferred tax assets to $1.3B. A right-of-use asset is a lessee’s right to use an asset over the life
of a lease.
Property, plant & equipment amounted to $7.2B, down 3.1% year-over-year while intangible
assets amounted to $9.4B, a 2.5% decline from the balance at the start of the year. Available-for-
sale investments amounted to $1.5B, a 6.1% increase year-over-year, while investments in joint
ventures rose 12.7% to $454.07M. Long-term receivables amounted to $713.82M, up 1.4% while
biological assets amounted to $409.37M, up 19.5% year-over-year.

4 | P a g e
INVESTMENT AND SOVEREIGN RESEARCH August-7-2020
All information contained herein is obtained by JMMB® Investment Research from sources believed by it to be accurate and reliable. All opinions and estimates constitute the Analyst’s judgment as of the date of the report. However, neither its accuracy and completeness NOR THE OPINIONS BASED THEREON ARE GUARANTEED. As such NO WARRANTY, EXPRESS OR IMPLIED, AS TO THE ACCURACY, TIMELINESS OR COMPLETENESS OF THIS REPORT IS GIVEN OR MADE BY JMMB® IN ANY FORM WHATSOEVER.
Seprod Limited
The decline in current assets was driven by a 28.2% decline in cash and bank balances to $1.48B,
a 95.3% decline in the current portion of long-term receivables to $17.5K and a 34.8% decline in
biological assets to $286.55M. This decline was partially offset by a 5.6% increase in inventories
to $6.91B and a 3.9% increase in trade & other receivables to $5.24B. Seprod also booked
$289.24M in “non-current assets held for sale” which represents the carrying value of assets
associated with the discontinued sugar manufacturing operations that are currently up for sale.
Total liabilities amounted to $21.53B, a 4.7% or $975.56M increase year-over-year. Non-current
liabilities rose 17.4% to $14.07B while current liabilities were down 13.0% to $7.45B. Driving the
increase in non-current liabilities was a 10.3% increase in long-term liabilities to $11.39B and the
booking of $1.11B in lease obligations. The decrease in current liabilities was driven by a 59.6%
decline in current portion of long-term liabilities to $829.44M. Payables were relatively
unchanged (down 0.8%) and amounted to $6.32B.
The current ratio stood at 1.94x up from 1.71x a year prior while the quick ratio moved from
0.83x to 0.90x. These levels indicate Seprod’s ability to adequately meet its short-term
obligations.
Total debt amounted to $12.22B and was down 1.3% year-over-year. Seprod’s leverage as
measured by the debt-to-equity ratio stood at 0.82x, up from 0.79x. Net debt-to-EBITDA stood
at 2.69x, versus 3.11x a year prior. Seprod’s ability to service it debt obligations, as represented
by the interest coverage ratio, deteriorated but remained sufficient. The interest coverage ratio
moved from 3.20x to 2.02x for the 2019FY. Shareholders’ equity amounted to $14.97B, down
4.9% year-over-year as retained earnings fell 9.8% to $8.1B.
Outlook and Valuation
Over the past few years, Seprod has made several moves which have begun to bear fruit. In
addition to the acquisition of Facey Consumer in 2018, Seprod formerly acquired direct
ownership of diary assets from its largest shareholder – Musson Jamaica, which acquired same
from Nestle Jamaica in 2016. Seprod also formed a joint venture company, Jamaica Grain and
Cereals Limited, with Seaboard Corporation and commenced flour production in December 2017.
These moves drove the 24.3% increase in net profits from continuing operations which amounted
to $1.71B.
5 | P a g e
INVESTMENT AND SOVEREIGN RESEARCH August-7-2020
All information contained herein is obtained by JMMB® Investment Research from sources believed by it to be accurate and reliable. All opinions and estimates constitute the Analyst’s judgment as of the date of the report. However, neither its accuracy and completeness NOR THE OPINIONS BASED THEREON ARE GUARANTEED. As such NO WARRANTY, EXPRESS OR IMPLIED, AS TO THE ACCURACY, TIMELINESS OR COMPLETENESS OF THIS REPORT IS GIVEN OR MADE BY JMMB® IN ANY FORM WHATSOEVER.
Seprod Limited
Despite this strong performance from continuing operations, the discontinued sugar operations
still managed to incur losses of $638.21M for the year. It is expected that going forward, until the
sugar assets are disposed of, the losses on these assets will be minimized. This expectation held
for the first half of the 2020FY when the net loss from discontinued operations amounted to
$16.13M, down 92.5% from the prior year period.
Net profit attributable to shareholders amounted to $1.20B, an 85.5% increase year-over-year as
the net profit from continuing operations amounted to $1.22B, a 41.1% increase on the prior
year period. Revenues for 1H20 amounted to $18.61B, a 12.1% increase year-over-year. Cost of
sales rose 13.9% which led to an 8.9% increase in gross profits to $6.51B. Operating expenses
were down 2.9% to $4.61B. The increase in gross profits, along with the decline in operating
expense, led to a 36.3% increase in operating profit to $2.12B. Seprod attributed its first half
performance to the consolidation of the dairy factories, rising exports and the expansion of its
distribution footprint following the acquisition of the Facey Consumer business.
Seprod’s debt servicing ability remained strong with an interest coverage ratio of 3.68x for the
first half of the 2020FY. Debt-to-equity stood at 0.80x, down from 0.82x as at Dec. 31, 2019.
Liquidity improved as the current ratio stood at 2.19x, up from 1.89x while the quick ratio moved
from 1.19x to 1.16x over the first six months of the year.
Seprod has performed remarkably in the first half of the 2020 financial year. This performance
can be explained by growth in its continuing operations as well the cessation of losses from its
failed sugar manufacturing venture. Seprod has seen resilience in the demand for its goods as it
sells many products that fall under the “Consumer Staples” category. Consumer staples are
essential products that include typical products such as food & beverage, household goods,
pharmaceutical drugs and hygiene products. Consumer staples are viewed as non-cyclical as they
represent goods that consumers are unable, or unwilling, to cut from their budgets regardless of
their financial situation. This attribute makes consumer staples impervious to business cycles as
consumers demand these goods at a relatively constant price.
Seprod noted that with the exception of its biscuits factory, it has not eased production outputs
as it aims to maintain stability in its food supply chain for Jamaica and its export markets. This
ability to maintain production capacity despite the challenges faced from measures put in place
to curtail the transmission of the COVID-19 disease, as well as strong demand for its range of
consumer staples, has combined to drive the outperformance for the first half of the year. This
has occurred in the context of many other listed companies reporting some of their worst
quarters in recent history.

6 | P a g e
INVESTMENT AND SOVEREIGN RESEARCH August-7-2020
All information contained herein is obtained by JMMB® Investment Research from sources believed by it to be accurate and reliable. All opinions and estimates constitute the Analyst’s judgment as of the date of the report. However, neither its accuracy and completeness NOR THE OPINIONS BASED THEREON ARE GUARANTEED. As such NO WARRANTY, EXPRESS OR IMPLIED, AS TO THE ACCURACY, TIMELINESS OR COMPLETENESS OF THIS REPORT IS GIVEN OR MADE BY JMMB® IN ANY FORM WHATSOEVER.
Seprod Limited
Seprod still remains susceptible to economic headwinds such as weak economic growth, high
inflation and weak business & consumer confidence. Deterioration in these factors could have a
negative impact on the company’s outlook. We face challenges in accurately estimating the full
impact the global pandemic will have on Seprod even as the country begins to loosen the
restrictions put in place to stem the spread as another spike in cases could occur.
With these limitations in mind, we estimate revenues of $37.22B for the 2020FY and net profit
attributable to shareholders of $1.94B, increases of 13.8% and 81.3%, respectively. Shareholders’
equity is projected to increase by 6.3% to $15.91B.
We utilized the price multiples approach to determine Seprod’s fair value. Using the industry
P/E average of 26.03x yields a price of $68.68 while the industry P/B average of 3.03x yields a
price of $65.62. The 1-year historical P/E average of 20.66x yields a price of $54.50 while the 1-
year historical P/B average of 2.37x yields a price of $51.34. The average of these estimates is
$60.03, which is 7.2% above the closing price of $56.02 as at July 31, 2020.
Recommendation
We recommend Seprod Limited as MARKETWEIGHT/MARKETPERFORM/HOLD as our estimate of
the fair value is line with the current market value. The stock is suitable for investors with a long-
term investment horizon and a low to medium risk appetite given Seprod’s position as market
leader in manufacturing and distribution and proven ability to withstand economic cycles.
Source: http://www.Jamstockex.com, JMMB Investment & Research, Bloomberg, Company
Financials,
7 | P a g e
INVESTMENT AND SOVEREIGN RESEARCH August-7-2020
All information contained herein is obtained by JMMB® Investment Research from sources believed by it to be accurate and reliable. All opinions and estimates constitute the Analyst’s judgment as of the date of the report. However, neither its accuracy and completeness NOR THE OPINIONS BASED THEREON ARE GUARANTEED. As such NO WARRANTY, EXPRESS OR IMPLIED, AS TO THE ACCURACY, TIMELINESS OR COMPLETENESS OF THIS REPORT IS GIVEN OR MADE BY JMMB® IN ANY FORM WHATSOEVER.
Seprod Limited
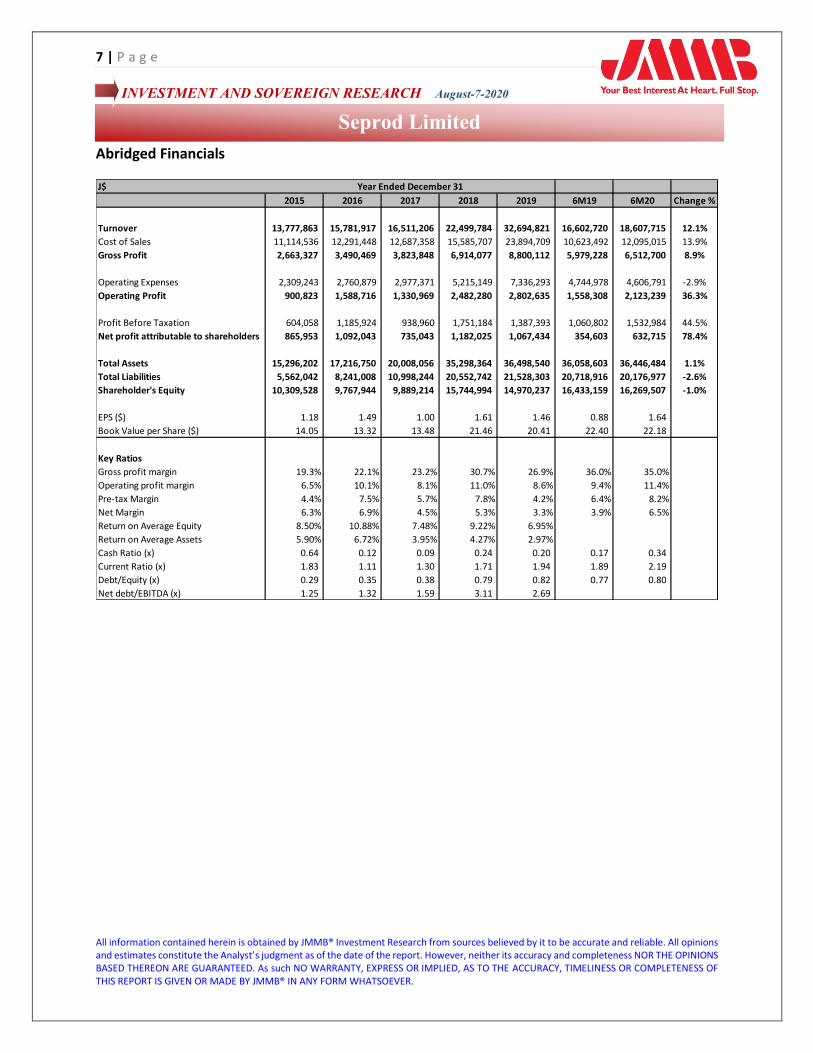
Abridged Financials
J$
2015 2016 2017 2018 2019 6M19 6M20 Change %
Turnover 13,777,863 15,781,917 16,511,206 22,499,784 32,694,821 16,602,720 18,607,715 12.1%
Cost of Sales 11,114,536 12,291,448 12,687,358 15,585,707 23,894,709 10,623,492 12,095,015 13.9%
Gross Profit 2,663,327 3,490,469 3,823,848 6,914,077 8,800,112 5,979,228 6,512,700 8.9%
Operating Expenses 2,309,243 2,760,879 2,977,371 5,215,149 7,336,293 4,744,978 4,606,791 -2.9%
Operating Profit 900,823 1,588,716 1,330,969 2,482,280 2,802,635 1,558,308 2,123,239 36.3%
Profit Before Taxation 604,058 1,185,924 938,960 1,751,184 1,387,393 1,060,802 1,532,984 44.5%
Net profit attributable to shareholders 865,953 1,092,043 735,043 1,182,025 1,067,434 354,603 632,715 78.4%
Total Assets 15,296,202 17,216,750 20,008,056 35,298,364 36,498,540 36,058,603 36,446,484 1.1%
Total Liabilities 5,562,042 8,241,008 10,998,244 20,552,742 21,528,303 20,718,916 20,176,977 -2.6%
Shareholder's Equity 10,309,528 9,767,944 9,889,214 15,744,994 14,970,237 16,433,159 16,269,507 -1.0%
EPS ($) 1.18 1.49 1.00 1.61 1.46 0.88 1.64
Book Value per Share ($) 14.05 13.32 13.48 21.46 20.41 22.40 22.18
Key Ratios
Gross profit margin 19.3% 22.1% 23.2% 30.7% 26.9% 36.0% 35.0%
Operating profit margin 6.5% 10.1% 8.1% 11.0% 8.6% 9.4% 11.4%
Pre-tax Margin 4.4% 7.5% 5.7% 7.8% 4.2% 6.4% 8.2%
Net Margin 6.3% 6.9% 4.5% 5.3% 3.3% 3.9% 6.5%
Return on Average Equity 8.50% 10.88% 7.48% 9.22% 6.95%
Return on Average Assets 5.90% 6.72% 3.95% 4.27% 2.97%
Cash Ratio (x) 0.64 0.12 0.09 0.24 0.20 0.17 0.34
Current Ratio (x) 1.83 1.11 1.30 1.71 1.94 1.89 2.19
Debt/Equity (x) 0.29 0.35 0.38 0.79 0.82 0.77 0.80
Net debt/EBITDA (x) 1.25 1.32 1.59 3.11 2.69
Year Ended December 31

8 | P a g e
INVESTMENT AND SOVEREIGN RESEARCH August-7-2020
All information contained herein is obtained by JMMB® Investment Research from sources believed by it to be accurate and reliable. All opinions and estimates constitute the Analyst’s judgment as of the date of the report. However, neither its accuracy and completeness NOR THE OPINIONS BASED THEREON ARE GUARANTEED. As such NO WARRANTY, EXPRESS OR IMPLIED, AS TO THE ACCURACY, TIMELINESS OR COMPLETENESS OF THIS REPORT IS GIVEN OR MADE BY JMMB® IN ANY FORM WHATSOEVER.
Seprod Limited
APPENDIX
IMPORTANT DISCLOSURES
ABSTRACT—As a part of our new Portfolio Strategy we are recommending strict adherence to
the following Portfolio Allocation DEFINITIONS/RECOMMENDATIONS.
PLEASE NOTE THAT NO INDIVIDUAL ASSET IN YOUR PORTFOLIO SHOULD HAVE A WEIGHTING
GREATER THAN 5% UNLESS OTHERWISE RECOMMENDED BY YOUR PORTFOLIO MANAGER OR A
SPECIFIC JMMB RESEARCH REPORT. CONSEQUENTLY, THE FOLLOWING DEFINITIONS ARE
PROVIDED FOR CLARITY.
OUTPERFORM/OVERWEIGHT/BUY—EXPOSURE TO THIS ASSET SHOULD BE UP TO
10% OF YOUR TOTAL PORTFOLIO HELD AT JMMB
MARKETPERFORM/HOLD/MARKETWEIGHT—EXPOSURE TO THE ASSET SHOULD BE
EQUAL TO 5% OF YOUR TOTAL PORTFOLIO HELD AT JMMB.
UNDERPERFORM/UNDERWEIGHT— ADJUST EXPOSURE IN YOUR PORTFOLIO HELD
AT JMMB TO BETWEEN 2.5% AND 4.9% FOR THIS PARTICULAR ASSET
STRONGLY UNDERPERFORM/UNDERWEIGHT—REDUCE EXPOSURE TO THIS ASSET
TO BELOW 2.5% OF YOUR TOTAL PORTFOLIO HELD AT JMMB
SELL—REDUCE EXPOSURE IN YOUR PORTFOLIO TO ZERO (0%).
COPYRIGHT INFRINGEMENT
“Unless otherwise expressly stated, copyright or similar rights in all material in this research
report (including graphical images) is owned, controlled or licensed by Jamaica Money
Market Brokers Limited or its affiliates (JMMB) and is protected or covered by copyright,
trade mark, intellectual property law and other proprietary rights. No part of this research
report or the report in its entirety may be published, used, reproduced, distributed,
displayed or copied for public or private use in any form including by any mechanical,
photographic or electronic process (electronically, digitally on the Internet or
World Wide Web, or over any network, or local area network or otherwise) without written
permission from JMMB.
No part of this research report may be modified or changed or exploited or used in any way
for derivative works, or offered for sale, or used to construct any kind of database or
mirrored at any other location without the express written permission of JMMB.

9 | P a g e
INVESTMENT AND SOVEREIGN RESEARCH August-7-2020
All information contained herein is obtained by JMMB® Investment Research from sources believed by it to be accurate and reliable. All opinions and estimates constitute the Analyst’s judgment as of the date of the report. However, neither its accuracy and completeness NOR THE OPINIONS BASED THEREON ARE GUARANTEED. As such NO WARRANTY, EXPRESS OR IMPLIED, AS TO THE ACCURACY, TIMELINESS OR COMPLETENESS OF THIS REPORT IS GIVEN OR MADE BY JMMB® IN ANY FORM WHATSOEVER.
Seprod Limited
Thank you for respecting our intellectual property rights.”
The investments referred to in this report may not be suitable for you should consult your
licensed investment advisor. Nothing in this report constitutes investment, legal, accounting or
tax advice or a representation that any investment or strategy is suitable to your individual
circumstances or otherwise constitutes a personal recommendation to you.
Disclosure Under the Securities Act
This disclosure is being provided pursuant to section 39 of the Securities Act. This research
report is prepared by Jamaica Money Market Brokers Limited (JMMB) and the information and
views expressed are those of JMMB. JMMB is a subsidiary of the JMMB Group Limited (JMMBGL).
Associated persons of JMMB include JMMBGL and its subsidiaries and affiliated companies,
including JMMB Fund Managers Limited, a licensed securities dealer and manager of collective
investment schemes.
As at the date of this report, JMMB and its affiliates, directors, officers, employees and other
associated persons may from time to time buy or sell, or act as principal or agent in, the
securities mentioned in this research report. JMMB or its affiliates, directors, officers and
employees have no interest in or interest in the acquisition or disposal of the securities other
than expressed above. No part of their compensation is or will be related to the
recommendations or opinions in this report.