the investment strategies of sovereign wealth fundsshaib/swf0811.pdf1 the investment strategies of...
TRANSCRIPT
1
The Investment Strategies of Sovereign Wealth Funds
Sovereign wealth funds have complex objective functions and governance structures where return maximization and strategic political considerations may conflict. SWFs with greater involvement of political leaders in fund management are more likely to support domestic firms and invest in segments and markets with higher P/E levels, especially in their domestic investments. But these investments see a subsequent reversal in P/E levels suggesting that the funds engage in poor market timing. The opposite patterns hold for funds that rely on external managers. Funds that have stated domestic development goals are more likely to invest at home, especially if politicians are involved.
2
1. Introduction
Sovereign wealth funds (SWFs), in addition to being major investors in corporate and
real resources world-wide (Fernandez and Eschweiler [2008]), are particularly interesting to
financial economists because of their ownership structure and mission. The quasi-public nature
of these funds may have unique implications for their investment objectives and the governance
arrangements they choose. The investment charters of most SWFs state that they seek to
maximize financial returns to ensure long-term public policies, such as pension or economic
development needs. But the more closely SWFs are exposed to political influences, the more
they might show major distortions from long-run return maximization. As Shleifer and Vishny
[1997] argue, such agency problems within large institutional investors can have wide-ranging
implications for the broader economy.
These agency problems may have two primary manifestations. First, the political process
can introduce short-run pressures on SWFs to accommodate public demands for job creation and
economic stabilization within the country. These demands should translate into financial support
for local firms or subsidies for industrial policies within the country. There are two opposing
views of the consequences of these investment pressures. Advocates for government-directed
investments usually rely on a view that financial markets are either not developed enough or too
myopic, and thus leave many profitable investment opportunities on the table (Atkinson and
Stiglitz [1980]; Stiglitz [1993]). The opposing, less sanguine view of politically directed
investments suggests that political involvement can either lead to misguided policy attempts to
prop up inefficient firms or industries or engage in investment activities in industries, sectors or
geographies that are “hot” (Shleifer and Vishny [1994]; Banerjee [1997]; Hart, et al. [1997]). If
the former, benevolent view is accurate, we would expect to find that government investments in
3
local firms are directed at industries that face financial constraints and subsequently perform
very well. If the latter view is true, we would predict the opposite: SWF investments would be
disproportionately directed to local firms, follow a pro-cyclical trend, and subsequently perform
poorly.
The second distortion as a result of political involvement in SWFs’ investments might
stem from the appointment of politically connected but financially inexperienced managers. This
hypothesis would suggest that politically influenced funds not only show a distortion in the
capital allocation between home and foreign investments, but would also display poorer stock
picking ability even in the international portfolio of the fund.
Since we are interested in understanding whether the investment behavior of SWFs is
shaped by (short-term) political considerations, we focus on the funds’ long-term investments—
acquisitions, purchases of private equity, and structured equity positions in public firms—on the
grounds that these distortions should be most evident here. After merging three publicly
available investment databases—Dealogic’s M&A Analytics, Security Data Company’s (SDC)
Platinum M&A, and Bureau van Dijk’s Zephyr—we identify 2,662 investments between 1984
and 2007 by 29 SWFs.
Our results show that SWFs where politicians are involved in the management of the
fund are more likely to invest in domestic firms, while those SWFs where external managers
play an important role are less likely to show a propensity to invest at home. We see that SWFs
that have political leaders playing an important role tend to invest in segments and markets with
4
higher P/E levels. This valuation effect is particularly strong for the domestic investments of
SWFs with politically connected managers. In their foreign investments, these funds do not show
a stronger likelihood of investing in industries and markets with especially high P/Es. In contrast,
SWFs with external (professional) managers invest in industries and markets with lower P/Es.
When looking at the post-investment returns, we find that the investments of SWFs with
politically connected managers tend to see a reduction in P/E levels after the investment, while
investments of external manager-influenced funds on average experience an increase in the P/E
levels. This trend is particularly pronounced for investments at home, which could suggest that
the pressures to invest in hot markets at home are especially strong for politically connected
SWFs.
Interestingly, we also find that politically connected funds are more likely to take larger
stakes in the firms they invest in, while external managers take smaller equity stakes. Instead of
investing in small liquid stakes, as those with external managers do, politically managed SWFs
take larger and potentially controlling equity stakes in domestic firms. Again this suggests that
the former investments are targeted at supporting and potentially propping up local firms, rather
than optimizing the investment returns of the SWF.
It is difficult to reconcile the benevolent view of government-directed investment with
some of our results. In particular, it is hard to understand why economic development needs
would compel funds to invest domestically when equity prices are relatively higher, which
presumably should be a time when capital constraints are less limiting. Similarly, it is hard to
explain why social welfare concerns would lead politician-influenced funds to invest in the
5
highest P/E industries, especially in light of the negative returns that subsequently characterize
these sectors. While these results are only suggestive given the lack of more micro-level data,
they raise a number of important questions about the investment strategies and management
structures of SWFs.
Finally, we investigate whether the stated objectives of the SWFs make a difference in
their investment behavior. We find that funds which have stated strategic agendas—e.g.,
economic development of the country, macroeconomic smoothing, and the like—are more likely
to invest at home, but only if politicians are involved in the fund. Otherwise, the stated objective
per se does not seem to lead to a change in behavior. But interestingly, we find that the ex post
changes in industry P/E ratios are negative for funds with stated strategic objectives independent
of whether they have politically connected managers. These results strengthen the interpretation
that the dual pressures on SWFs with political and financial objectives are associated with lower
financial returns.
The plan of this paper is as follows. In the second section, we review relevant theoretical
perspectives and the earlier studies on SWFs. Our data sources and construction are described in
Section 3. Section 4 presents the analysis. Section 5 presents robustness checks. The final section
concludes the paper.
2. Theoretical Perspectives and Related Work
Numerous accounts by both observers and practitioners suggest that there is substantial
variation in the investment criteria and sophistication of institutional investors. In particular,
6
practitioner accounts (e.g., Swensen [2009]) suggest that some institutions rely on overly rigid
decision criteria and lack a sufficient understanding of key asset classes. Observers attribute
these failures to underlying factors such as inappropriate incentives—for example, the limited
compensation and autonomy that investment officers enjoy, which leads to frequent turnover and
a predilection to select “safe” investments, even if the expected returns are modest—and
conflicting objectives, particularly the pressures by fund overseers to invest in projects sponsored
by local entrepreneurs, even if the expected investment returns (and in some cases, social
benefits) are modest.
Recent papers by Gompers and Metrick [2001] and Lerner, et al. [2007] have highlighted
the heterogeneity in investment strategies and ultimately returns across different types of
institutional investors. However, the evidence on SWFs has been limited until recently due to
many data restrictions. Several papers conduct international stock market reaction analyses to
SWF investment announcements. Kotter and Lel [2008] collect 163 SWF investment
announcements and find a positive market reaction in the two days surrounding the
announcement. Dewenter et al. [2010] find a positive market reaction to 196 stock purchases and
negative reactions to 47 SWF stock sales. In the long term, they find slightly negative abnormal
returns. Bortolotti, et al. [2010] reach similar conclusions: a positive abnormal return on the day
of the announcement and deterioration in firm performance over the following two years. Knill,
et al. [2010] analyze a sample of 232 SWF investments in publicly traded companies. While they
find positive market reactions to announcements, the one year abnormal returns varies by SWF
characteristics such as whether the SWF is from an oil-producing country, the degree of opacity,
and investments in non-financial targets.
7
Chhaochharia and Laeven [2009] take a different perspective regarding SWF investment
choices. They consider the geographical decisions made by SWFs when investing abroad in
public companies. They find that funds largely invest to diversify away from industries at home,
and do so mainly in countries that share the same ethnicity, language, and religion. Fernandes
[2009], rather than exploring transactions, focus on SWF holdings. Using data on 8,000 firms
between 2002 and 2007, he finds that the stakes in SWFs’ public investments are small: at the
95th percentile of the sample, SWFs hold less than 1.5% of the company. Moreover, he finds a
positive correlation between SWF ownership and firm performance and valuation.
While the papers outlined above explore SWFs through the lenses of international equity
markets, our analysis’s focus is their most substantial transactions (the median acquisition stake
is 50% in our sample). The paper most complementary to ours is Dyck and Morse [2011], who
construct a sample of SWF investments in public equity, real estate, and private equity between
the years 1999 and 2008. They find that relative to various capitalization benchmarks, there is a
significant bias towards private equity. The combined private equity and real estate holdings
account for almost half of SWFs’ portfolios. Dyck and Morse find that substantial explanatory
power can be attributed to either financial return maximization or state planning motives,
demonstrating the tension between the two objectives. Our paper differs from Dyck and Morse in
two dimensions. First, our focus is on SWFs’ investment performance, rather than on portfolio
holdings. Second, while Dyck and Morse infer funds’ objectives from portfolio holdings, we take
a different approach, by using SWF governance structure and stated objectives to explore how
these interact with investment decisions.
8
3. Data Sources and Construction
To analyze the direct investment strategies of SWFs, we combine three sets of data:
information on the SWFs themselves, the direct investments that the funds made, and the
investment climate around the time of the transaction. The data for all the three components are
drawn from publicly available sources.
SWF sample construction: We start with a preliminary sample of SWFs by combining the
profiles of the funds published by J.P.Morgan (Fernandez and Eschweiler [2008]) and Preqin
(Friedman [2008]). In the cases where the two databases use different names for the same SWF,
we employ the fund address and related information to eliminate duplicates. We add five funds
to the sample that were not included in these two compilations but are frequently described as
SWFs in at least one of the investment datasets noted below. This initial search yields a
population of 69 institutions, including some SWFs that have been announced but are not yet
active.
We then merge this initial sample of funds with the available data on direct investments
and characteristics of SWFs. We are careful to extract investment data for both the SWFs and
their “subsidiaries,” which we define as entities in which SWF has at least a 50% ownership
stake. The two SWF directories and the investment datasets noted below did not always
explicitly note the links between SWFs and their subsidiaries. To extract transactions involving
SWF subsidiaries, we supplement our list of SWF subsidiaries by employing ownership data in
the Directory of Corporate Affiliations and Bureau van Dijk’s Orbis.

9
SWF Characteristics: The fund profiles in the J.P.Morgan and Preqin databases contain
information on the size and operations of the funds. If there is a discrepancy between the two
databases, we reconfirm the accuracy of the information through web searches and newspaper
articles. The key variables collected are:
Assets under Management—J.P.Morgan and Preqin profiles contain estimates of fund
sizes. In case of discrepancies, J.P.Morgan’s estimate of assets under management is
given preference. Preqin’s estimate of assets under management is used only when no
J.P.Morgan estimate existed.
The Presence of Politicians in the Managing Bodies—The J.P.Morgan report emphasizes
governance structures of funds. We read carefully the profiles, and form a dummy
variable that indicates if a fund’s profile contains evidence of presence of politicians in
the governance of the fund. For example, Khazanah Nasional’s profile indicates that the
fund’s board of directors “has an eight-member Board comprising representatives from
the public and private sectors. Abdullah Ahmad Badawi, the Right Honorable Prime
Minister of Malaysia, is the Chairman of the Board of Directors.” The Alaska Permanent
Reserve Fund’s profile indicates that the fund’s Board of Trustees “is comprised of four
public members, the Commissioner of Revenue and one additional cabinet member of the
governor's choosing.” Similarly, the J.P.Morgan report indicates that the board of
directors of the Government of Singapore Investment Corporation (GIC) includes Lee
Kuan Yew as the chairman, and Lee Hsien Loong as deputy chairman. The former is
Singapore’s minister mentor, and the latter is Singapore’s prime minister.
10
Reliance on External Managers/Advisors—The J.P.Morgan volume also indicates
whether the governance of the fund is in the hands of a board consisting of investment
professionals and/or outside business leaders. We create a dummy variable that is one if
the report contains evidence that the institution relies heavily on external management or
advisors.1 For example, the J.P.Morgan profile indicates that the Hong Kong Exchange
Fund “employs external fund managers to manage about one third of the Fund’s assets,
including all of its equity portfolios and other specialized assets.” Similarly, the profile of
Abu Dhabi Investment Authority (ADIA) indicates that “approximately 70% to 80% of
the organization’s assets are managed by external fund managers”.
Stated Investment Goal—The Preqin tabulation reports the stated goals of the SWF.
Some funds have multiple goals. To simplify the analysis, we combine in some analyses
the objectives into two groups: strategic objectives (Management of Government Assets,
Acquisition of Strategic Assets, and Domestic Development) and non-strategic objectives
(Investment of Oil/Commodity Revenues, Currency Reserve Management, and Pension
Funding). When SWFs’ descriptions include objectives from both groups, we included all
these transactions in the non-strategic group and verified that results are similar when
included in the strategic group.
These measures, it must be acknowledged, have important limitations. First, these are reported as
of 2008: we do not have a time series on the governance of or advisor usage by the funds.
Second, these measures are extremely crude characterizations of the SWFs’ organizational
structures.
1 We classify a fund as relying on external managers if the reliance is sufficiently important that it is documented in the report.
11
Investment Data: Information regarding SWF target investments is identified in
Dealogic’s M&A Analytics, SDC’s Platinum M&A, and Bureau van Dijk’s Zephyr. All three of
these databases compile information on direct investments by institutional and corporate
investors. Transactions included in the database encompass outright acquisitions, venture capital
and private equity investments, and structured minority purchases in public entities (frequently
called PIPEs, or private investments in public entities). The databases do not include investments
into hedge, mutual or private equity funds, or open market purchases of minority stakes in
publicly traded firms.
In each of the three datasets, we run multiple keyword searches for every fund in the
sample. We also search for investments carried out by their subsidiaries. Finally, text fields of
acquirer descriptions are searched for phrases such as “SWF,” “sovereign fund,” or “sovereign
wealth fund.” These additional transactions are examined, and if there is a match in the SWF’s
identity (e.g., if there is a slight misspelling of the SWF’s name) and location, the entries are
added to the database. The variables we obtain about each deal are the announcement date,
transaction size, share of the equity acquired, and country and industry of the target. In the case
of discrepancies across the databases, we use press accounts and web searches to resolve the
differences. Some of the databases include proposed deals that were not consummated. If the
transactions are described in the databases as “withdrawn” or “rejected,” we drop them from the
analysis.
12
After merging the three databases, we are left with 2,662 transactions between January
1984 and December 2007 by 29 SWFs. We confirm that the bulk of the funds that are not
included are either very new (indeed, some had not yet commenced operations by the end of
2007) or very small. Of the 29 institutions with transactions in our sample, 24 are profiled in
either the J.P.Morgan or Preqin volumes, or in both publications. There exist 23 J.P.Morgan and
16 Preqin profiles for the funds in our sample. We describe a robustness check that seeks to
assess whether selection biases affect our results in Section 5.
In the bulk of the analyses below, we also exclude 36 transactions where the targets were
in Central America, South America, or Africa. This decision reflects our desire to focus on
investments in the major markets—i.e., Asian, Middle Eastern, and Western countries (North
America, Europe, and Australia)—where the vast majority of the investments are concentrated.
Environment Data: We also characterize the pricing and subsequent returns in the
industry and the nation of the transaction. Ideally, we would have liked to analyze deal pricing
using the actual target firm’s P/E ratio. However, since most SWFs’ investments are in private
firms, these data are not available.
The performance data which we use are:
Industry P/E ratios— To obtain a measure of deal valuations, we use the weighted
average of the P/E ratios of firms in the target company’s industry and nation (determined
by company headquarters). To calculate the P/E ratios for the target countries, we use the
P/E ratios of public companies in the same industry and country from the Datastream
13
database, dropping companies with negative P/E ratios.2 Weighted average P/E ratios
were formed for each target investment at the country-industry-year level (using market
values of the firms as weights). We used industry classifications based on the Standard
Industrial Classification scheme.3 The distribution of P/E values was winsorized4 at the
5% and 95% level in order to reduce the impact of extreme observations. We also
construct an approximate performance measure for each deal: the change in the weighted
mean industry-country P/E ratio in the year following the transaction.
Home P/E and versus Outside P/E— To measure the P/E levels in the home nation versus
outside the nation, we construct Home P/E and Outside P/E variables using the MSCI
database (downloaded from Datastream). These ratios are weighted by market
capitalization and measured at the country-year level. We complete missing country-level
P/E ratios using the Zawya database and Datastream’s P/E indexes for emerging markets.
For investments made abroad, the variables Home P/E and Outside P/E correspond to the
P/E level of the home country of the SWF and the target country, respectively. If
investments are made at home, the Outside P/E variable equals the weighted average (by
the total amount invested by SWFs over the sample period) P/E ratios of all countries in
which investments were made by SWFs, excluding the home country.
2 The main challenge was to get P/E ratios for Middle Eastern targets, particularly in the Persian Gulf region. In 73 cases, we could not compute a P/E ratio using the Datastream information. 3 We use a broader definition than the 2-digit SIC level, since under this classification the number of companies per industry is very small in some target countries. 4 Most of the affected transactions are concentrated in the Asian region. The estimators are more robust when we winsorize the extreme observations rather than trimming the sample (and thus disproportionately removing Asian region deals). Nevertheless, the results remain unchanged when we take the latter strategy and exclude outliers.
14
4. Analysis
4.1. Sample statistics
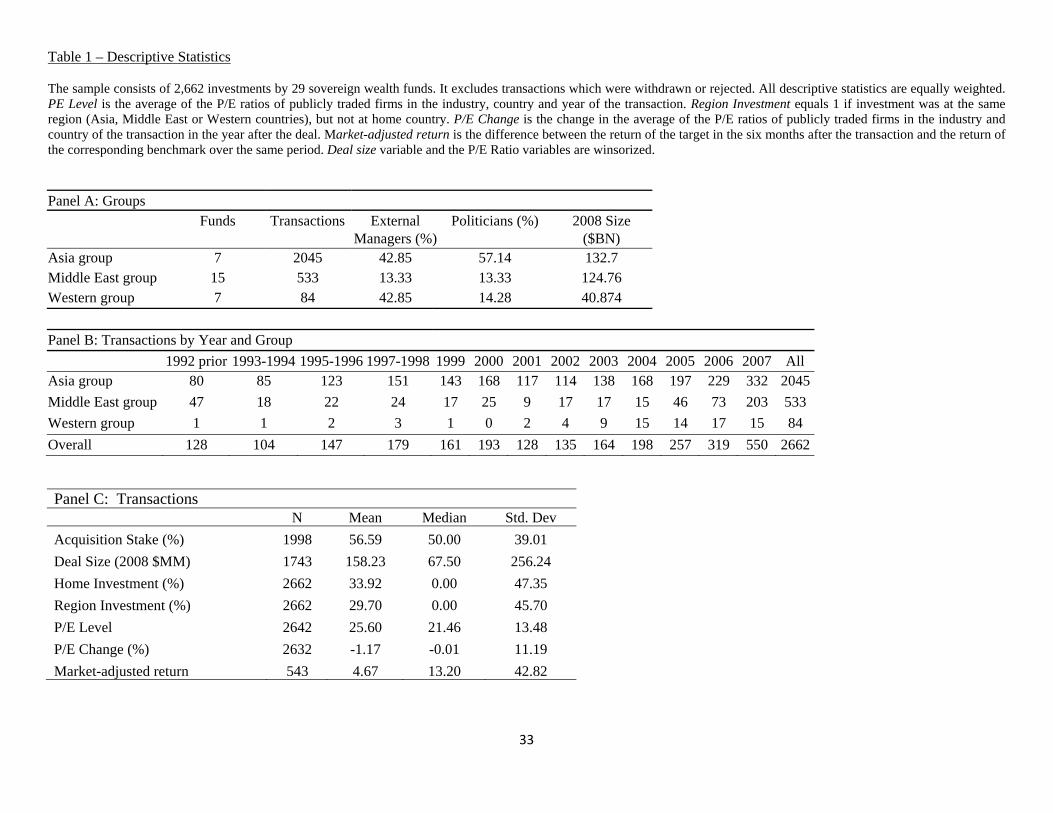
Table 1 presents the descriptive statistics of the 2,662 transactions made by the 29
sovereign wealth funds in our sample. Panel A of Table 1 sorts the funds into three regions: Asia,
Middle East,5 and Western groups. The Western group includes funds from North America,
Australia, and Europe. Our sample consists of seven funds in the Asian group, 15 funds in the
Middle Eastern group, and seven funds in the Western group. The number of transactions of
Asian funds (2,045 observations) is substantially larger than the Middle Eastern group (533
observations) and the 84 observations of the Western group.
One possible explanation for these differences in sample size is that we have only partial
coverage of the deals. We believe, however, that this can only explain part of the differences.
More important, we believe, are the differences in fund sizes and the willingness to engage in
direct investments. For example, the average Asian and Middle Eastern funds have $132B and
$124B under management, respectively, and are substantially larger than the average Western
fund ($40B). Moreover, to estimate the coverage of our sample, we compare the aggregate
transaction value of our sample to the estimate in a J.P.Morgan publication (Fernandez and
Eschweiler [2008]). They estimate outstanding SWF investments in alternatives (encompassing
hedge funds and private equity) at the end of 2007 as $316 billion. In our sample, the aggregate
transaction value in the years 2003-2007 (excluding the public investments) is $198 billion
(expressed in 2008 U.S. dollars). Given that we exclude private equity partnerships and hedge
fund investments, the comparison suggests we have reasonable sample coverage. Our estimate
5 We add the single investment by the Venezuelan SWF to the totals for the Middle East, given the petroleum-driven nature of that economy.
15
(as all analyses in this paper) relies on winsorized transaction values. Were we not to winsorize
transaction values, our sample coverage is even better.
While the sample consists of transactions between the years 1984 and 2007, Panel B
demonstrates that more than 97% of the transactions are after 1991. While both the Asian and
Middle Eastern funds’ investments go back to the mid 1980s, the Western funds’ investments are
more recent, beginning around 2003. Panel C shows that the average transaction size is $158
million (in 2008 U.S. dollars) and the average stake acquired by the SWFs is substantial (56.6%).
Panel C also demonstrates that the average P/E level in the industry-country-year of the target of
a SWF transaction is 25.6 and the typical investment segment experiences a drop of -1.2% in the
mean P/E ratio in the year after the investment. For the approximately 20% of the investments in
publicly traded firms, we also examine the market-adjusted returns in the six months after the
transaction (see the detailed description below).
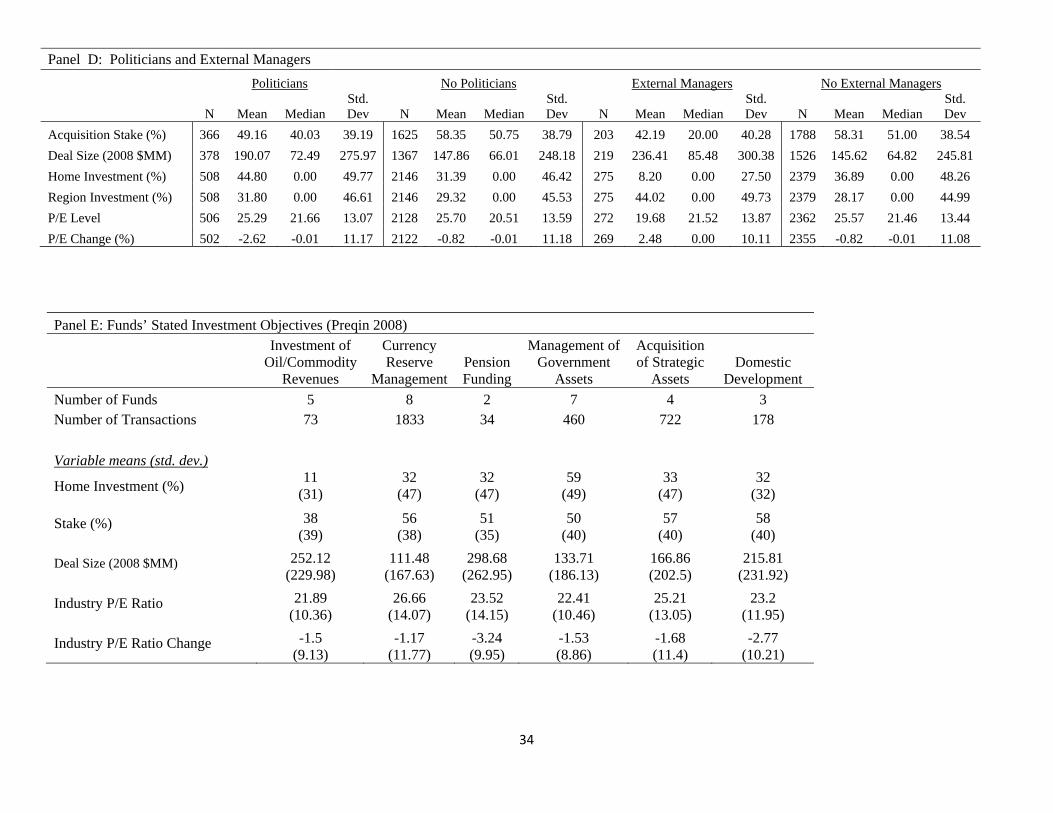
Panel D reports variables that capture the governance structure of the funds. Recall that
for each fund, we develop indicator variables for whether political leaders are involved in the
board and whether the fund relies on external managers. About 24% of the funds have politicians
involved in the fund and 28% of the funds rely on outside managers. We see that both funds with
political leaders and external managers tend to make larger investments. Interestingly, when
politicians are involved, funds invest more in the home country (44% of the deals in the sample),
relative to funds without their involvement (only 31% of the transactions). Funds with external
managers involved invest less in the home country (8%) relative to 36% for funds that do not
rely on external managers.
16
The final panel of Table 1 reports the stated fund objectives. Currency reserve
management is the objective associated with most funds and most transactions. Funds whose
stated goal is the management of government assets have the largest share of domestic
investments; those whose goal is the investment of oil/commodity revenues, the fewest.
We now analyze whether the characteristics of the SWFs are associated with differences
in their investment strategies, focusing on the likelihood of political interference. In particular,
we focus on the impact of the governance structure of the funds—i.e., whether the SWFs rely on
external managers for investment advice and whether politicians are involved in the fund—and
the SWFs’ stated objectives. We analyze investment strategies of SWFs, looking at their
propensity to invest at home, the industry-country P/E levels at the time of the investments, the
subsequent changes in the P/E ratios, and the size of the acquisition stakes of their investments.
The unit of observation in our analysis is at the transaction level (that is, for a specific
SWF and target), with standard errors at clustered at the level of the nation in which the fund is
based. In many regressions, we control for the year that the investment is made and the sovereign
wealth fund making the investment. In most specifications, we use weighted regressions, with
each observation weighted by the transaction size (transaction sizes are all expressed in 2000
U.S. dollars). Since we only have sizes for 67% of our transactions, we impute missing weights
by constructing the fitted values from a regression of deal sizes on fixed effects for the
investment year, target industry, target region, and fund. After adding imputed observations, we
17
winsorize the deal size variable at the 5% and 95% level, in order to reduce the impact of
extreme observations.6
4.2. Propensity to invest at home
In order to analyze how funds vary in their allocation of investments between the home
nation and outside, we estimate a probit model. The dependent variable is a home investment
dummy, which equals one if the target investment is made within the home nation of the SWF
and zero otherwise. In Table 2, columns (1) and (2), we regress the home dummy on indicator
variables for the presence of political leaders in the management of the fund and the reliance on
external managers. We cluster the standard errors at the level of the country where the SWF is
based. The displayed coefficients are marginal effects. In the specifications where year dummies
are added, the sample only includes transactions from 1991 onward. All regressions are weighted
by winsorized transaction sizes (expressed in 2000 U.S. dollars), as described above.
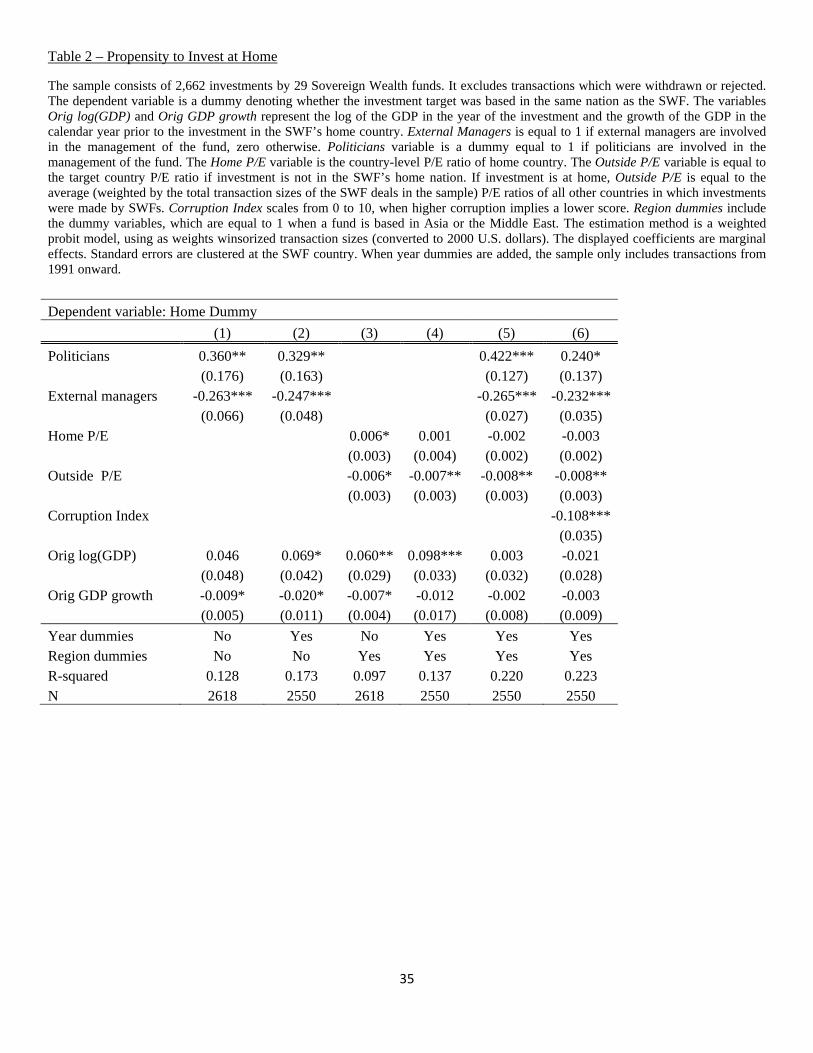
In the base specification, column (1) of Table 2, we control for the home country’s gross
domestic product (expressed using the logarithm of GDP, in 2000 U.S. dollars), and GDP growth
in the calendar year prior to the year of the investment. In subsequent regressions, we control for
the year of the investment and the geographic location of the SWF (Asian, Middle Eastern, and
Western). The results in column (1) show that in cases where political leaders are involved with
the management of the funds, domestic investments are more common, while involvement of
external managers is associated with fewer domestic investments. The magnitude of the effects is
large: the coefficient on the politician dummy reflects 36% increase in the likelihood of investing
6 In the appendix we report the results of the equally weighted regressions. We find that the results are robust, except in cases where specifically noted in the text.

18
at home when politicians are involved. In comparison, the coefficient on the external manager
dummy is equivalent to a 26.3% lower share of domestic investments when external managers
are employed. In column (2), we add transaction year fixed effects. The results change only
slightly, from +36.0% to +32.9% for the politician dummy and from -26.3% to -24.7% for the
external manager one.
To get a better understanding of the decision where to invest, we include control
variables for the pricing levels of target markets at home and abroad, as discussed in the data
construction section. In column (3) of Table 2, we repeat the regression from column (1), but add
measures of the Home P/E level of the SWF’s nation and Outside P/E, the P/E level of the
country that the fund invests in. The results show that there is a significant correlation between
the Home P/E level and the likelihood of investing at home or abroad. SWFs are more likely to
invest at home when prices there are relatively higher. The magnitude of this effect is substantial:
an increase of one standard deviation of Home P/E increases the likelihood of investing at home
by 4.5%.7
Similarly, higher P/E levels in the other countries are correlated with a lower propensity
to invest at home. An increase in one standard deviation of Outside P/E decreases the likelihood
of investing at home by 3.1%. If we add year fixed effects in column (4), the coefficient on
7 In unreported regressions, we explore the impact of the Asian financial crisis on the likelihood to invest at home by adding a Post-Crisis dummy variable. We add interaction terms with Asian and Middle Eastern groups to capture differential reaction to the Asian financial crisis. While we find positive effect on likelihood to invest at home (with the effect largest at Middle Eastern SWFs), the results are sensitive to the number of post-1998 years we use to define the Post-Crisis variable. One important reason why the results are not very robust is that prior to 1995 our sample size is relatively limited compared to later years.
19
Home P/E is still positive, but much smaller and insignificant. The coefficient on the Outside
P/E becomes significant at 5% confidence level and the magnitude is larger. In column (5), we
find that the results hold even when we use both the governance and valuation measures.
In column (6), we add a corruption index8 for the country, taken from International
Country Risk Guide (2008). This index is scaled from zero to ten, with higher numbers
representing less corrupt nations. More corruption is associated with a greater emphasis on
domestic investing: a decrease of one in the corruption scale is associated with a 10.8% increase
in the likelihood of domestic investment. In an unreported regression, the interactions between
the governance dummies and the corruption score are insignificant: e.g., political involvement
with fund management is associated with a strong home bias to investments, regardless of the
level of corruption in the nation.
The cross-sectional results suggest that SWFs invest less at home if their local equity
markets have relatively low P/E levels.9 One possible explanation for this pattern is that SWFs
shun low-valued local markets because these financial markets are not as well developed. But
this hypothesis has difficulty explaining away the fact that the propensity to invest abroad
8 Another variable of interest is the home country legal origin, and its impact on SWF investment
behavior. However, this variable has very little variation in our sample, as most countries have common law legal origin. 9 We also explore whether different determinants affect domestic investments in public versus private firms. To do so, we re-estimate Table 2 separately for private and public firms. We find that the decision to invest at home in publicly listed companies is sensitive to market conditions at home and abroad, while investments at private companies are sensitive only to foreign stock market conditions. However, the differential sensitivity of private and public investments to market valuation levels cannot be unambiguously interpreted, since market valuation might be a worse measure of investment opportunities for private firms compared to public firms. Therefore, we include the results in the Appendix (see Table A-7).
20
increases as the pricing level in foreign markets rises. Rather, it appears more consistent with the
interpretation that SWFs engage in “trend chasing,” that is, gravitate to markets where equity
values are already high.
4.3. Valuation levels
In a second step, we examine whether there are significant differences in the market
timing of the transactions undertaken by SWFs. In the first three columns of Table 3, the
dependent variable is the weighted average (by firm value) of the P/E ratios of publicly traded
firms in the industry, country, and year of the transaction. The estimation method is a weighted
ordinary least squares model, using as weights winsorized transaction sizes (converted to U.S.
dollars as of the year 2000). Robust standard errors, clustered by the countries in which the
SWFs are based, are shown in parenthesis.
As before, in each specification, we control for the level and growth of GDP in the
SWF’s nation, the location of the SWF, and the year of the investment. We also add controls
across all specifications for whether the investment is a domestic one and the geographic region
of the target company (using the broad regional classification as before). In the first two columns
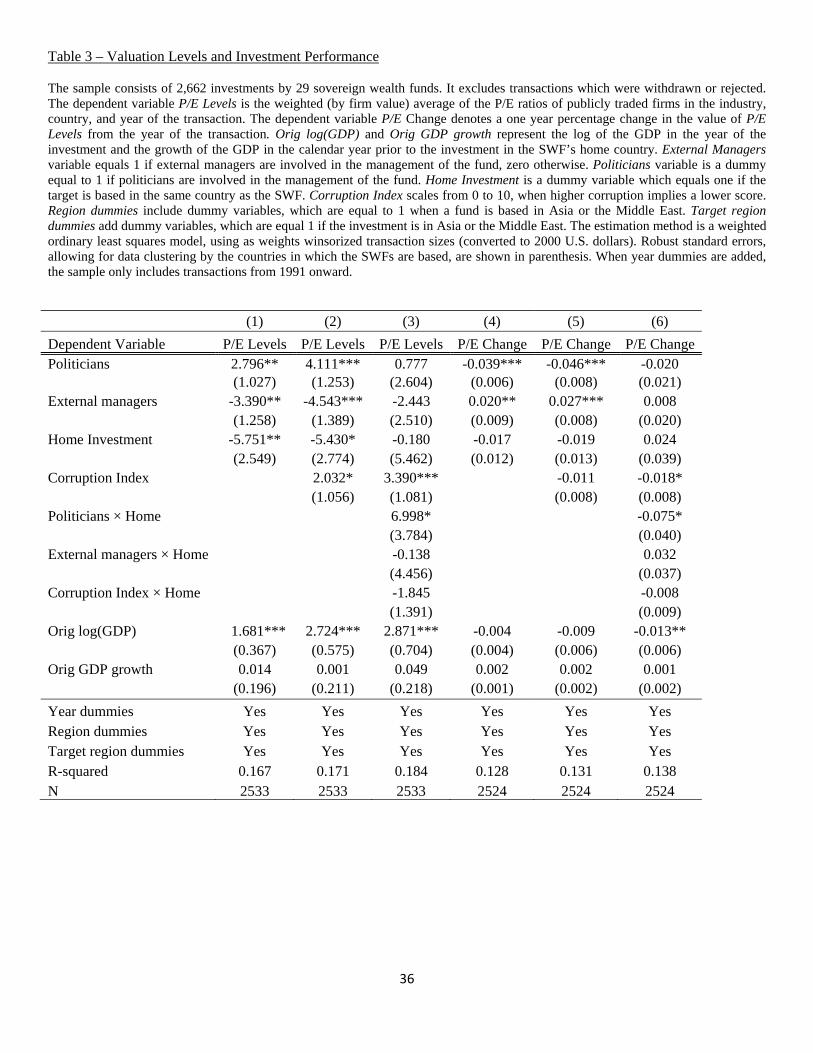
of Table 3, we include a dummy for the involvement of political leaders and of external
managers. We find that having politicians involved is strongly associated with investments in
higher-priced sectors (a premium of three to four times earnings), while external managers are
associated with investments in lower-valued sectors. In column (2), we include a control for the
country corruption index. SWFs based in more corrupt nations are consistently associated with
investments in higher-valued industries (an added multiple of two to three times earnings).
21
In column (3), we include an interaction term between politicians and home investments,
as well as an interaction between external managers and home investments. When including the
interactions, we see that the coefficient on politicians interacted with home investment is
statistically significant and economically large, reflecting a 6.9 higher P/E ratio when politicians
invest at home.10 The direct effect of the dummy for politician involvement becomes
insignificant and small. We do not find a similar significant coefficient on the interaction term
for the external managers and home investment. These results suggest that politicians tend to
particularly invest in high P/E deals at home, while the effect is much less pronounced abroad.
For external managers, there is no difference in the investment timing between domestic and
foreign markets.
4.4. Investment performance
By themselves, these results above could be consistent with very different interpretations.
First, the fact that SWFs with politicians’ involvement are investing in higher P/E sectors might
not be troubling. If these ratios are true reflections of the investment opportunities of the firms,
these institutions may be rationally choosing sectors that are likely to perform well. This view
(Gordon [1959]) was recently used by Bekaert et al. [2007] to measure countries’ growth opportunities.
A second interpretation relies on the assumption that markets can be inefficient and that higher P/E ratios
reflect investors’ overreaction (Lakonishok, Shleifer, and Vishny [1994]). This view suggests that high
P/Es may reflect overpayment on the part of the SWFs.
10 In the equally weighted regressions, the interaction term is insignificant with smaller magnitude.
22
To shed some light on these two competing interpretations, we look at the performance of
investments in the industry and country in the year after the deal. If the first interpretation is true,
we should see that SWFs outperform in home investments, while the opposite would hold under
the second explanation.
The regressions in Column (4)-(6) in Table 3 are structured to be parallel to the first three
columns, but now the dependent variable is the percentage change in the mean P/E ratio of firms
in that country and industry in the year following the investment. By looking at the subsequent
performance of the sector, we can address some of the interpretative challenges highlighted
above. As in the previous section, we use a transaction size-weighted ordinary least squares
specification.
In column (4), we see that SWFs where political leaders play a role select sectors with
significant drops in P/E going forward (-3.9%). This is in contrast to the case when external
managers are involved, where P/E values increase in the year following the investment (+2.0%).
We repeat this estimation in column (5), now controlling for corruption levels. While corruption
by itself has no significant effect on returns, the governance measures become stronger. The
coefficient on politicians becomes -4.6%, while the positive effect of external managers grows to
+2.7%. When interactions with home investments are added in column (6), the interaction term
between politician influence and home investments is negative and substantial, reflecting a
23
decline of 7.5% in returns when investing at home. The coefficient is significant at the 10%
threshold.11
The analysis suggests that SWFs with politician involvement do not select high P/E
sectors because they have better private information about investment opportunities. Rather, it
seems to reflect a willingness to trend chase and overpay for investments. The analysis suggests,
at least weakly, that these effects are stronger when it comes to domestic investments.
In Table 4, we undertake a robustness check of the performance regressions. A key
drawback of the analyses in Table 3 is that we examined the performance at the level of the
chosen industry and nation as a whole, and not that of the individual companies that the SWFs
invested in. The performance of these selected firms could be unrepresentative of the returns
more generally, or the experience of private firms could differ from those of the public concerns
whose P/Es we can trace. To partially address the first of these concerns, we examine the subset
of firms that were publicly traded at the time of the SWF investment. We search the Datastream
database for all target companies that were publicly traded and extract their monthly returns. We
determine the benchmark returns for the stock exchanges in which the target companies were
traded and extract those returns as well. We compute cumulative abnormal returns relative to the
benchmark in the six months after the transaction, which leads to a considerably larger coverage
than one-year returns.
11 The equally weighted regressions demonstrate similar results, however, the coefficients are noisier, and in some cases insignificant.
24
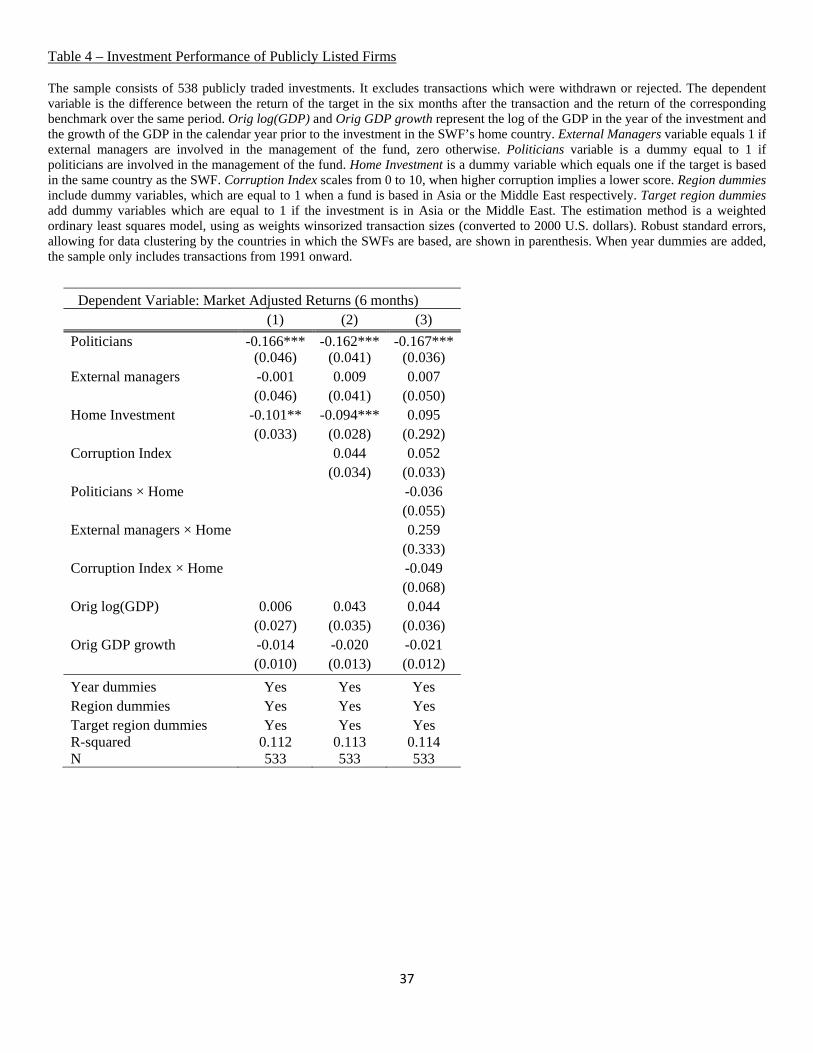
We estimate in Table 4 transaction size-weighted OLS regressions similar to those in the
final three columns of Table 3, but now with the difference between the return of the target in the
six months after the transaction and the return of the corresponding benchmark over the same
period as the dependent variable. We use 533 observations in these estimations.
We find once again that in the basic specifications, politician-influenced SWFs are
associated with lower returns. These transactions significantly underperform, generating 16%
lower returns in the six months after the investments. The home investment dummy now has a
significantly negative coefficient, suggesting underperformance among domestic investments.
While the sample of publicly traded transactions is considerably smaller, the similarity to the
results in Table 3 is reassuring.
In an unreported regression, we repeat the analysis using a measure which addresses the
second concern. We use as the dependent variable the percentage change in the weighted (by
firm value) average EBITDA/Assets ratio of all publicly traded firms if target is public, or if the
target is private, all privately held firms in the corresponding three-digit SIC industry, country,
and year of the target in the transaction.
We determine the ratios for the corresponding firms from the 2009 edition of Orbis from
Bureau van Dyck, which includes financial information about private firms for many nations.
The important advantage of Orbis is that it includes data on both public and private firms (in fact,
most of the firms in this database are private). Unfortunately, in many cases, the information is
quite scanty, so we can only obtain a ratio for the corresponding industry, country, and year for
25
796 firms: far worse than the P/E ratio, where we have a benchmark for 2,553 firms. The results
are quite weak. In the basic regressions, the politicians variable retains a negative coefficient and
the external managers one a positive one, but neither are statistically significant.
4.5. Acquisition stake
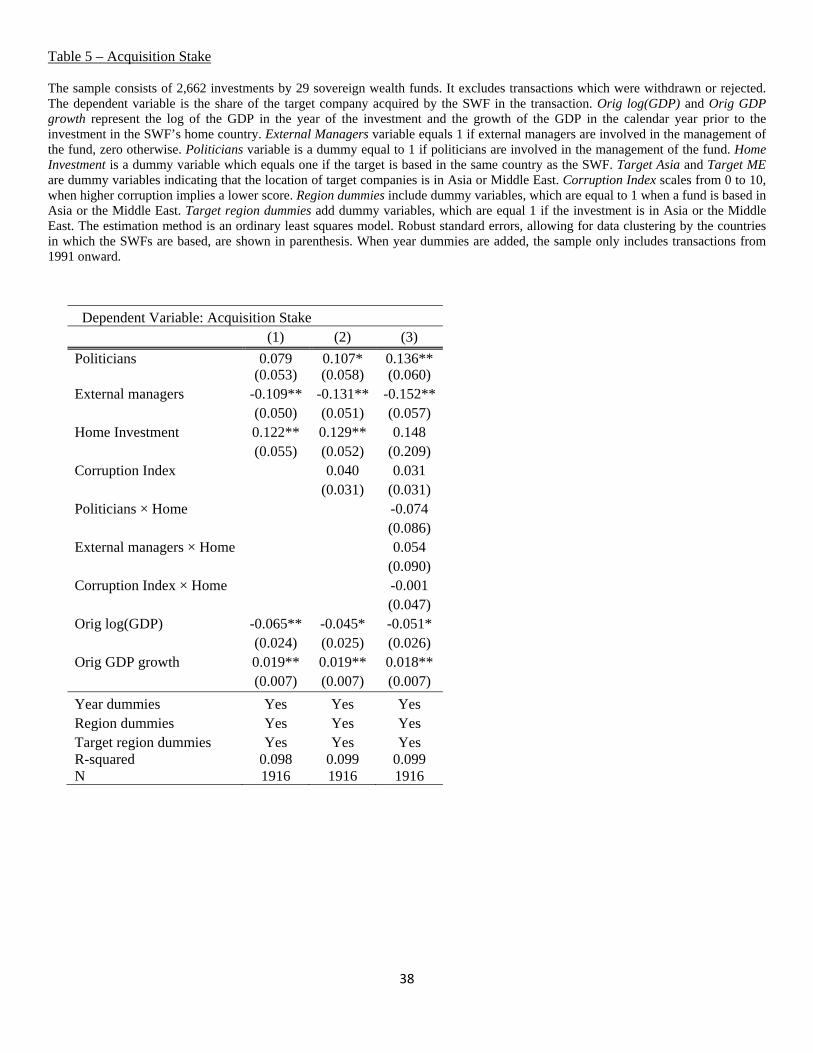
In Table 5, we explore how the size of the acquisition stakes varies in the investments
that different SWFs make. Unlike the other tables in the paper, we use equally weighted
regressions here, since weighting based on deal sizes will bias our results. Otherwise, the set-up
of the table is parallel to the specifications in Tables 3 and 4, with an OLS specification.
In column (1), we find that the acquisition stake of SWFs with external managers present
is lower by 10.9%. Investments at home are 12.2% larger, an effect that is statistically
significant. Political leaders’ involvement is associated with 7.9% increase in acquisition stake,
although the coefficient is not statistically significant. When we control for corruption levels in
column (2), we find that the coefficient on the dummy for politicians’ involvement becomes
significant and has a larger magnitude (a 10.7% increase). Similarly, the coefficient on external
managers remains statistically significant (13.1%). In column (3), we add interaction terms with
home investment dummies. Interestingly, the interaction term between politicians and home
investment dummy is insignificant; suggesting that politician-influenced SWFs’ propensity to
acquire larger stakes is independent of the location of the target company.
26
4.6. Stated investment objective
These institutions often differ in their stated investment goals. Some SWFs profess a
desire to focus on more strategic objectives, such as the acquisition of useful companies or
domestic development. Others aim more at the long-term return goals that are akin to those of a
university endowment.
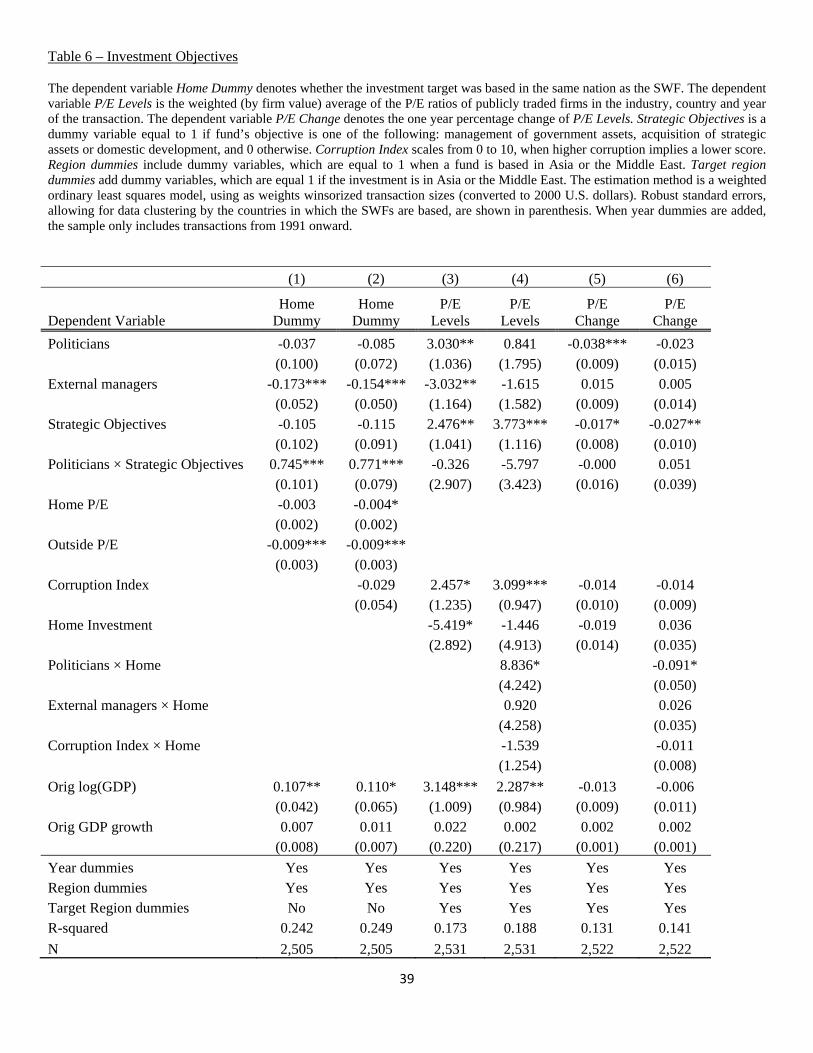
In Table 6, we repeat the analyses of Tables 2 and 3, but look specifically at the role that
investment objectives play. Using the Preqin data, we define funds’ objectives to be strategic if
stated goals include Management of Government Assets, Acquisition of Strategic Assets, or
Domestic Development. We consider the rest of the objectives as non-strategic (Investment of
Oil/Commodity Revenues, Currency Reserve Management, or Pension Funding). Most funds
include multiple goals, which typically fall under the same broad category. In 220 investments,
fund goals included both strategic and non-strategic objectives. We included all these
transactions in the non-strategic group, and verified that results are similar when these are
included in the strategic group instead.
The first two columns repeat the specifications in Table 2, estimating a weighted probit
model where the dependent variable is the home country indicator. In column (1), we regress a
dummy for whether the investment is at home on our standard variables plus an interaction
between a dummy for whether politicians are involved in the fund and the strategic objective of
the fund. We also include a dummy variable for strategic objectives. We find that the coefficient
on the strategic objective indicator is insignificant and close to zero, suggesting no increase in
the likelihood to invest domestically. However, when political leaders are involved, those funds
27
which have strategic objectives show a much higher probability of investing at home: the
coefficient of the interaction term between politicians and strategic objectives is significant at
1% level, and indicates a 74.5% increase in the likelihood to invest at home. We repeat the
analysis in column (2), controlling for level of corruption, and find that the results are similar.
The second pair of regressions in Table 6 uses as the dependent variable the average P/E
ratio in the target country, industry, and year of the transaction. We repeat the specification in
Table 3, and add the direct effect for strategic objectives and an interaction term with politicians’
involvement. In column (3), we find that the coefficient of the strategic objective dummy is
significant at the 5% level and reflects a higher P/E ratio of 2.5. This effect is independent of
having politicians involved in the SWF, as the interaction term is now insignificant. We repeat
the analysis in column (4), adding interaction terms with home investment dummy. The result
from the previous column remains, with the interaction term becoming bigger (3.8) and
statistically significant at the 1% level. Interestingly, the interaction term of politicians and home
investment dummy is still significant and positive, similarly to our previous findings. This
suggests that the increased tendency of politicians to invest at high P/E ratios at home is
independent of the fund’s strategic objectives.
The last pair of regressions in Table 6 uses as the dependent variable the one-year change
in P/E ratios. In column (5), we find that funds with strategic objectives perform poorly, with a
significant drop of 1.7% in sector performance. Similarly, the direct effect of politicians’
involvement is highly significant at the 1% level, with a drop of 3.8%. However, the interaction
term of these two factors is insignificant and close to zero. The specification in column (6) adds
28
interaction terms of the home investment dummy with the political involvement measure. The
direct effect of strategic objectives now becomes even more significant and its magnitude gets
bigger in absolute terms (-2.7%). The earlier result found in Table 3 of politician-influenced
funds performing poorly when investing at home exists here as well, even when controlling for
the strategic objectives of the fund. The interaction term between politicians’ involvement and
the home investment dummy reveals a large drop of 7.5% in such investments. Overall, this
implies that the political leader-influenced investments underperform irrespective of their stated
strategic objectives, and that the underperformance is particularly concentrated at home.12
5. Robustness Checks
As the descriptive statistics in Table 1 show, the sample is somewhat skewed in the size
of the deals, and the transactions are clustered towards the end of the period under study.
Moreover, there is heterogeneity in deal size across different funds. One could be worried that
our results might be driven either by some of the smaller deals or the valuation trends in the
years immediately before the financial crisis. Alternatively, one might worry that there is
selection biases in the deals included in our sample, which is doubtless a greater problem among
the smaller transactions. To verify that our results are robust to these concerns, we undertake a
number of additional tests that examine different subsets of the data.
We repeat all the regressions presented in this paper using two subsamples, one which
includes the largest 75% of the deals, and the other with the largest 50% of the deals. In these
12 In equally weighted regressions, the direct effects of politicians and external managers on P/E levels and sector performance are similar to the results presented here, and the coefficients exhibit even larger magnitudes and higher statistical significance. However, the effect of strategic objectives on these measures becomes smaller and insignificant.
29
samples, the cutoff value is either $11 million or $68 million (in 2008 U.S. dollars), respectively.
We re-run the regressions of the paper, both size-weighted and equal-weighted. Even after
removing 50% of the transactions, the remaining transactions maintain the same distribution
across the groups. And in both subsamples, the results remained similar to the ones reported in
the paper. We also run the regressions without winsorizing the data. Finally, we repeat our
analysis excluding either the last two years or the last year of the sample and find that the results
remain unchanged.
Finally, we conduct simple weighted mean tests to explore the robustness of the results.
The results are provided in the appendix and exhibit similar patterns to the ones described in the
multivariate analysis except when noted above.
6. Conclusions
Sovereign wealth funds are distinguished by their complex set of objectives. Taken as a
whole, our results lend support to the hypothesis that the more intensely these funds are exposed
to political influences, the more they show major distortions from long-run return maximization.
In particular, SWFs with politician involvement are more likely to invest domestically, while
those SWFs where external managers play an important role are more likely to invest
internationally. Politically influenced SWFs also concentrate their funds in sectors that both have
high P/E levels and then experience a drop in these levels, especially in their domestic
investments, patterns that do not hold in funds that rely on external managers. Funds that have
stated strategic goals are more likely to invest at home, but only if politicians are involved.
30
While these results are only suggestive, given the preliminary nature of the data, they
raise a number of important questions about the investment decisions and management structure
of SWFs. A logical extension of this analysis would be to investigate the strategies of SWFs
across a wider set of asset classes. Such an analysis, however, would be challenging given the
opacity of many of these funds.
More generally, we believe that much interesting work remains to be done in
understanding the underlying objectives of SWFs, their investment strategies, and organizational
differences, as well as the constraints they face due to internal and external pressures. For
example, many reports suggest that SWFs are often employed to further the geopolitical and
strategic economic interests of their governments (World Economic Forum, [2011]). A recent
example is the emphasis of Singaporean SWFs on investing into India and China, which has
been interpreted as being motivated by a desire to forge strategic ties with the city-state’s larger
and more powerful neighbors. In other cases, political considerations have led to the
abandonment of prescient investment strategies, as when the Norway’s Government Pension
Fund caused an uproar in 2006 by shorting the shares of Icelandic banks. Thus, SWFs present an
ideal setting in which to understand the interaction between finance and political economy.
31
References
Atkinson, Anthony B., and Joseph E. Stiglitz, 1980, Lectures on Public Economics, London, McGraw Hill. Bekaert, Geert, Campbell R. Harvey, Christian Lundblad, and Stephan Siegel, 2007, Global growth opportunities and market integration, Journal of Finance 62, 1081-1137.
Banerjee, Abhijit V., 1997, A theory of misgovernance. Quarterly Journal of Economics, 112, 1289–1332. Bortolotti, Bernardo, Veljko Fotak, William L. Megginson, and William Miracky, 2010, Sovereign wealth fund investment patterns and performance, Unpublished working paper, available at SSRN: http://ssrn.com.ezp-prod1.hul.harvard.edu/abstract=1364926 Chhaochharia, Vidhi, and Luc A. Laeven, 2009, Sovereign wealth funds: Their investment strategies and performance, Unpublished working paper, available at SSRN, http://ssrn.com/abstract=1262383. Dewenter, Katherine L., Xi Han, and Paul H. Malatesta, 2010, Firm values and sovereign wealth fund investments, Journal of Financial Economics 98, 256-278. Dyck, I. J. Alexander, and Adair Morse, 2011, Sovereign wealth fund portfolios, Chicago Booth Research Paper No. 11-15, available at SSRN, http://ssrn.com/abstract=1792850 Fernandez, David G. and Bernhard Eschweiler, 2008, Sovereign Wealth Funds: A Bottom-Up Primer, New York, J.P.Morgan Research. 2008. Fernandes, Nuno G., 2009, Sovereign wealth funds: Investment choices and implications around the world, Unpublished working paper, available at SSRN, http://ssrn.com/abstract=1341692. Friedman, Tim, 2008, Preqin Sovereign Wealth Fund Review, London, Preqin Limited.
Gompers, Paul A., and Andrew Metrick, 2001, Institutional investors and equity prices, Quarterly Journal of Economics, 116, 229-259. Gordon, Myron J., 1959, Dividends, earnings, and stock prices, Review of Economics and Statistics 41, 99-105. Hart, Oliver, Andrei Shleifer, and Robert Vishny, 1997, The proper scope of government: Theory and an application to prisons, Quarterly Journal of Economics, 112, 1127–1162. Knill, April M., Bong-Soo Lee, and Nathan Mauck, 2010, Is sovereign wealth fund investment destabilizing?, Unpublished working paper, available at SSRN, http://ssrn.com/abstract=1328045.
32
Kotter, Jason, and Ugur Lel, 2008, Friends or foes? The stock price impact of sovereign wealth fund investments and the price of keeping secrets, International Finance Discussion Paper No. 940, Federal Reserve Board. Lakonishok, Josef, Andrei Shleifer, and Robert W. Vishny, 1994, Contrarian investment, extrapolation, and risk, Journal of Finance 49, 1541-1578. Lerner, Josh, Antoinette Schoar, and Wan Wongsunwai, 2007, Smart institutions, foolish choices? The limited partner performance puzzle, Journal of Finance, 62, 731-764. Shleifer, Andrei, and Robert Vishny, 1994, Politicians and firms, Quarterly Journal of Economics, 109, 995–1025. Shleifer, Andrei, and Robert Vishny, 1997, A survey of corporate governance, Journal of Finance 52, 737-789. Stiglitz, Joseph E., 1993. The role of the state in financial markets, in Proceedings of the World Bank Annual Conference on Economic Development, Washington, International Bank for Reconstruction and Development/World Bank, pp. 19–56. Swensen, David, 2009, Pioneering Portfolio Management: An Unconventional Approach to Institutional Investment, 2nd edition, New York, Simon and Schuster. Tirole, Jean, 1994, The internal organization of governments, Oxford Economic Papers, 46, 1–29. World Economic Forum, 2011, The Future of Long-Term Investing, New York, World Economic Forum USA.
33
Table 1 – Descriptive Statistics
The sample consists of 2,662 investments by 29 sovereign wealth funds. It excludes transactions which were withdrawn or rejected. All descriptive statistics are equally weighted. PE Level is the average of the P/E ratios of publicly traded firms in the industry, country and year of the transaction. Region Investment equals 1 if investment was at the same region (Asia, Middle East or Western countries), but not at home country. P/E Change is the change in the average of the P/E ratios of publicly traded firms in the industry and country of the transaction in the year after the deal. Market-adjusted return is the difference between the return of the target in the six months after the transaction and the return of the corresponding benchmark over the same period. Deal size variable and the P/E Ratio variables are winsorized.
Panel A: Groups Funds Transactions External Politicians (%) 2008 Size
Managers (%) ($BN) Asia group 7 2045 42.85 57.14 132.7 Middle East group 15 533 13.33 13.33 124.76 Western group 7 84 42.85 14.28 40.874
Panel B: Transactions by Year and Group
1992 prior 1993-1994 1995-1996 1997-1998 1999 2000 2001 2002 2003 2004 2005 2006 2007 All Asia group 80 85 123 151 143 168 117 114 138 168 197 229 332 2045
Middle East group 47 18 22 24 17 25 9 17 17 15 46 73 203 533
Western group 1 1 2 3 1 0 2 4 9 15 14 17 15 84
Overall 128 104 147 179 161 193 128 135 164 198 257 319 550 2662
Panel C: Transactions N Mean Median Std. Dev
Acquisition Stake (%) 1998 56.59 50.00 39.01
Deal Size (2008 $MM) 1743 158.23 67.50 256.24
Home Investment (%) 2662 33.92 0.00 47.35
Region Investment (%) 2662 29.70 0.00 45.70
P/E Level 2642 25.60 21.46 13.48
P/E Change (%) 2632 -1.17 -0.01 11.19
Market-adjusted return 543 4.67 13.20 42.82
34
Panel D: Politicians and External Managers
Politicians No Politicians External Managers No External Managers
N Mean Median Std. Dev N Mean Median
Std. Dev N Mean Median
Std. Dev N Mean Median
Std. Dev
Acquisition Stake (%) 366 49.16 40.03 39.19 1625 58.35 50.75 38.79 203 42.19 20.00 40.28 1788 58.31 51.00 38.54
Deal Size (2008 $MM) 378 190.07 72.49 275.97 1367 147.86 66.01 248.18 219 236.41 85.48 300.38 1526 145.62 64.82 245.81
Home Investment (%) 508 44.80 0.00 49.77 2146 31.39 0.00 46.42 275 8.20 0.00 27.50 2379 36.89 0.00 48.26
Region Investment (%) 508 31.80 0.00 46.61 2146 29.32 0.00 45.53 275 44.02 0.00 49.73 2379 28.17 0.00 44.99
P/E Level 506 25.29 21.66 13.07 2128 25.70 20.51 13.59 272 19.68 21.52 13.87 2362 25.57 21.46 13.44
P/E Change (%) 502 -2.62 -0.01 11.17 2122 -0.82 -0.01 11.18 269 2.48 0.00 10.11 2355 -0.82 -0.01 11.08
Panel E: Funds’ Stated Investment Objectives (Preqin 2008) Investment of
Oil/Commodity Revenues
Currency Reserve
Management Pension Funding
Management of Government
Assets
Acquisition of Strategic
Assets Domestic
Development
Number of Funds 5 8 2 7 4 3 Number of Transactions 73 1833 34 460 722 178
Variable means (std. dev.)
Home Investment (%) 11
(31) 32
(47) 32
(47) 59
(49) 33
(47) 32
(32)
Stake (%) 38 (39)
56 (38)
51 (35)
50 (40)
57 (40)
58 (40)
Deal Size (2008 $MM) 252.12 (229.98)
111.48 (167.63)
298.68 (262.95)
133.71 (186.13)
166.86 (202.5)
215.81 (231.92)
Industry P/E Ratio 21.89 (10.36)
26.66 (14.07)
23.52 (14.15)
22.41 (10.46)
25.21 (13.05)
23.2 (11.95)
Industry P/E Ratio Change -1.5 (9.13)
-1.17 (11.77)
-3.24 (9.95)
-1.53 (8.86)
-1.68 (11.4)
-2.77 (10.21)
35
Table 2 – Propensity to Invest at Home
The sample consists of 2,662 investments by 29 Sovereign Wealth funds. It excludes transactions which were withdrawn or rejected. The dependent variable is a dummy denoting whether the investment target was based in the same nation as the SWF. The variables Orig log(GDP) and Orig GDP growth represent the log of the GDP in the year of the investment and the growth of the GDP in the calendar year prior to the investment in the SWF’s home country. External Managers is equal to 1 if external managers are involved in the management of the fund, zero otherwise. Politicians variable is a dummy equal to 1 if politicians are involved in the management of the fund. The Home P/E variable is the country-level P/E ratio of home country. The Outside P/E variable is equal to the target country P/E ratio if investment is not in the SWF’s home nation. If investment is at home, Outside P/E is equal to the average (weighted by the total transaction sizes of the SWF deals in the sample) P/E ratios of all other countries in which investments were made by SWFs. Corruption Index scales from 0 to 10, when higher corruption implies a lower score. Region dummies include the dummy variables, which are equal to 1 when a fund is based in Asia or the Middle East. The estimation method is a weighted probit model, using as weights winsorized transaction sizes (converted to 2000 U.S. dollars). The displayed coefficients are marginal effects. Standard errors are clustered at the SWF country. When year dummies are added, the sample only includes transactions from 1991 onward.
Dependent variable: Home Dummy
(1) (2) (3) (4) (5) (6)
Politicians 0.360** 0.329** 0.422*** 0.240* (0.176) (0.163) (0.127) (0.137)
External managers -0.263*** -0.247*** -0.265*** -0.232*** (0.066) (0.048) (0.027) (0.035)
Home P/E 0.006* 0.001 -0.002 -0.003 (0.003) (0.004) (0.002) (0.002)
Outside P/E -0.006* -0.007** -0.008** -0.008** (0.003) (0.003) (0.003) (0.003)
Corruption Index -0.108*** (0.035)
Orig log(GDP) 0.046 0.069* 0.060** 0.098*** 0.003 -0.021 (0.048) (0.042) (0.029) (0.033) (0.032) (0.028)
Orig GDP growth -0.009* -0.020* -0.007* -0.012 -0.002 -0.003 (0.005) (0.011) (0.004) (0.017) (0.008) (0.009)
Year dummies No Yes No Yes Yes Yes Region dummies No No Yes Yes Yes Yes R-squared 0.128 0.173 0.097 0.137 0.220 0.223 N 2618 2550 2618 2550 2550 2550
36
Table 3 – Valuation Levels and Investment Performance
The sample consists of 2,662 investments by 29 sovereign wealth funds. It excludes transactions which were withdrawn or rejected. The dependent variable P/E Levels is the weighted (by firm value) average of the P/E ratios of publicly traded firms in the industry, country, and year of the transaction. The dependent variable P/E Change denotes a one year percentage change in the value of P/E Levels from the year of the transaction. Orig log(GDP) and Orig GDP growth represent the log of the GDP in the year of the investment and the growth of the GDP in the calendar year prior to the investment in the SWF’s home country. External Managers variable equals 1 if external managers are involved in the management of the fund, zero otherwise. Politicians variable is a dummy equal to 1 if politicians are involved in the management of the fund. Home Investment is a dummy variable which equals one if the target is based in the same country as the SWF. Corruption Index scales from 0 to 10, when higher corruption implies a lower score. Region dummies include dummy variables, which are equal to 1 when a fund is based in Asia or the Middle East. Target region dummies add dummy variables, which are equal 1 if the investment is in Asia or the Middle East. The estimation method is a weighted ordinary least squares model, using as weights winsorized transaction sizes (converted to 2000 U.S. dollars). Robust standard errors, allowing for data clustering by the countries in which the SWFs are based, are shown in parenthesis. When year dummies are added, the sample only includes transactions from 1991 onward.
(1) (2) (3) (4) (5) (6)
Dependent Variable P/E Levels P/E Levels P/E Levels P/E Change P/E Change P/E ChangePoliticians 2.796** 4.111*** 0.777 -0.039*** -0.046*** -0.020 (1.027) (1.253) (2.604) (0.006) (0.008) (0.021) External managers -3.390** -4.543*** -2.443 0.020** 0.027*** 0.008 (1.258) (1.389) (2.510) (0.009) (0.008) (0.020) Home Investment -5.751** -5.430* -0.180 -0.017 -0.019 0.024 (2.549) (2.774) (5.462) (0.012) (0.013) (0.039) Corruption Index 2.032* 3.390*** -0.011 -0.018* (1.056) (1.081) (0.008) (0.008) Politicians × Home 6.998* -0.075* (3.784) (0.040) External managers × Home -0.138 0.032 (4.456) (0.037) Corruption Index × Home -1.845 -0.008 (1.391) (0.009) Orig log(GDP) 1.681*** 2.724*** 2.871*** -0.004 -0.009 -0.013** (0.367) (0.575) (0.704) (0.004) (0.006) (0.006) Orig GDP growth 0.014 0.001 0.049 0.002 0.002 0.001 (0.196) (0.211) (0.218) (0.001) (0.002) (0.002)
Year dummies Yes Yes Yes Yes Yes Yes Region dummies Yes Yes Yes Yes Yes Yes Target region dummies Yes Yes Yes Yes Yes Yes R-squared 0.167 0.171 0.184 0.128 0.131 0.138 N 2533 2533 2533 2524 2524 2524
37
Table 4 – Investment Performance of Publicly Listed Firms
The sample consists of 538 publicly traded investments. It excludes transactions which were withdrawn or rejected. The dependent variable is the difference between the return of the target in the six months after the transaction and the return of the corresponding benchmark over the same period. Orig log(GDP) and Orig GDP growth represent the log of the GDP in the year of the investment and the growth of the GDP in the calendar year prior to the investment in the SWF’s home country. External Managers variable equals 1 if external managers are involved in the management of the fund, zero otherwise. Politicians variable is a dummy equal to 1 if politicians are involved in the management of the fund. Home Investment is a dummy variable which equals one if the target is based in the same country as the SWF. Corruption Index scales from 0 to 10, when higher corruption implies a lower score. Region dummies include dummy variables, which are equal to 1 when a fund is based in Asia or the Middle East respectively. Target region dummies add dummy variables which are equal to 1 if the investment is in Asia or the Middle East. The estimation method is a weighted ordinary least squares model, using as weights winsorized transaction sizes (converted to 2000 U.S. dollars). Robust standard errors, allowing for data clustering by the countries in which the SWFs are based, are shown in parenthesis. When year dummies are added, the sample only includes transactions from 1991 onward.
Dependent Variable: Market Adjusted Returns (6 months)
(1) (2) (3)
Politicians -0.166*** -0.162*** -0.167***(0.046) (0.041) (0.036)
External managers -0.001 0.009 0.007 (0.046) (0.041) (0.050)
Home Investment -0.101** -0.094*** 0.095 (0.033) (0.028) (0.292)
Corruption Index 0.044 0.052 (0.034) (0.033)
Politicians × Home -0.036 (0.055)
External managers × Home 0.259 (0.333)
Corruption Index × Home -0.049 (0.068)
Orig log(GDP) 0.006 0.043 0.044 (0.027) (0.035) (0.036)
Orig GDP growth -0.014 -0.020 -0.021 (0.010) (0.013) (0.012)
Year dummies Yes Yes Yes Region dummies Yes Yes Yes Target region dummies Yes Yes Yes R-squared 0.112 0.113 0.114 N 533 533 533
38
Table 5 – Acquisition Stake
The sample consists of 2,662 investments by 29 sovereign wealth funds. It excludes transactions which were withdrawn or rejected. The dependent variable is the share of the target company acquired by the SWF in the transaction. Orig log(GDP) and Orig GDP growth represent the log of the GDP in the year of the investment and the growth of the GDP in the calendar year prior to the investment in the SWF’s home country. External Managers variable equals 1 if external managers are involved in the management of the fund, zero otherwise. Politicians variable is a dummy equal to 1 if politicians are involved in the management of the fund. Home Investment is a dummy variable which equals one if the target is based in the same country as the SWF. Target Asia and Target ME are dummy variables indicating that the location of target companies is in Asia or Middle East. Corruption Index scales from 0 to 10, when higher corruption implies a lower score. Region dummies include dummy variables, which are equal to 1 when a fund is based in Asia or the Middle East. Target region dummies add dummy variables, which are equal 1 if the investment is in Asia or the Middle East. The estimation method is an ordinary least squares model. Robust standard errors, allowing for data clustering by the countries in which the SWFs are based, are shown in parenthesis. When year dummies are added, the sample only includes transactions from 1991 onward.
Dependent Variable: Acquisition Stake (1) (2) (3)
Politicians 0.079 0.107* 0.136**(0.053) (0.058) (0.060)
External managers -0.109** -0.131** -0.152**(0.050) (0.051) (0.057)
Home Investment 0.122** 0.129** 0.148 (0.055) (0.052) (0.209)
Corruption Index 0.040 0.031 (0.031) (0.031)
Politicians × Home -0.074 (0.086)
External managers × Home 0.054 (0.090)
Corruption Index × Home -0.001 (0.047)
Orig log(GDP) -0.065** -0.045* -0.051* (0.024) (0.025) (0.026)
Orig GDP growth 0.019** 0.019** 0.018** (0.007) (0.007) (0.007)
Year dummies Yes Yes Yes Region dummies Yes Yes Yes Target region dummies Yes Yes Yes R-squared 0.098 0.099 0.099 N 1916 1916 1916
39
Table 6 – Investment Objectives
The dependent variable Home Dummy denotes whether the investment target was based in the same nation as the SWF. The dependent variable P/E Levels is the weighted (by firm value) average of the P/E ratios of publicly traded firms in the industry, country and year of the transaction. The dependent variable P/E Change denotes the one year percentage change of P/E Levels. Strategic Objectives is a dummy variable equal to 1 if fund’s objective is one of the following: management of government assets, acquisition of strategic assets or domestic development, and 0 otherwise. Corruption Index scales from 0 to 10, when higher corruption implies a lower score. Region dummies include dummy variables, which are equal to 1 when a fund is based in Asia or the Middle East. Target region dummies add dummy variables, which are equal 1 if the investment is in Asia or the Middle East. The estimation method is a weighted ordinary least squares model, using as weights winsorized transaction sizes (converted to 2000 U.S. dollars). Robust standard errors, allowing for data clustering by the countries in which the SWFs are based, are shown in parenthesis. When year dummies are added, the sample only includes transactions from 1991 onward.
(1) (2) (3) (4) (5) (6)
Dependent Variable Home
Dummy Home
Dummy P/E
Levels P/E
Levels P/E
Change P/E
Change
Politicians -0.037 -0.085 3.030** 0.841 -0.038*** -0.023 (0.100) (0.072) (1.036) (1.795) (0.009) (0.015)
External managers -0.173*** -0.154*** -3.032** -1.615 0.015 0.005 (0.052) (0.050) (1.164) (1.582) (0.009) (0.014)
Strategic Objectives -0.105 -0.115 2.476** 3.773*** -0.017* -0.027** (0.102) (0.091) (1.041) (1.116) (0.008) (0.010)
Politicians × Strategic Objectives 0.745*** 0.771*** -0.326 -5.797 -0.000 0.051 (0.101) (0.079) (2.907) (3.423) (0.016) (0.039) Home P/E -0.003 -0.004*
(0.002) (0.002) Outside P/E -0.009*** -0.009***
(0.003) (0.003) Corruption Index -0.029 2.457* 3.099*** -0.014 -0.014
(0.054) (1.235) (0.947) (0.010) (0.009) Home Investment -5.419* -1.446 -0.019 0.036
(2.892) (4.913) (0.014) (0.035) Politicians × Home 8.836* -0.091*
(4.242) (0.050) External managers × Home 0.920 0.026
(4.258) (0.035) Corruption Index × Home -1.539 -0.011
(1.254) (0.008)
Orig log(GDP) 0.107** 0.110* 3.148*** 2.287** -0.013 -0.006 (0.042) (0.065) (1.009) (0.984) (0.009) (0.011)
Orig GDP growth 0.007 0.011 0.022 0.002 0.002 0.002 (0.008) (0.007) (0.220) (0.217) (0.001) (0.001)
Year dummies Yes Yes Yes Yes Yes Yes Region dummies Yes Yes Yes Yes Yes Yes Target Region dummies No No Yes Yes Yes Yes R-squared 0.242 0.249 0.173 0.188 0.131 0.141
N 2,505 2,505 2,531 2,531 2,522 2,522