investing seizing in growth new opportunities · 2020. 7. 24. · 2014 market overview the past...
TRANSCRIPT
Seizing new opportunities
AGF M A n AGeMen t L iMi t ed
2 0 14 A n n u A l R e p o R T
investing in growth

Seizing new opportunities
Corporate profileAGF Management Limited (AGF) is one of Canada’s
premier independent global investment management
firms with a strong history dating back to 1957. With
operations and investments in Canada, the United States,
the United Kingdom, ireland and Asia, AGF has a track
record of delivering top-quality, innovative products and
services to more than one million investors. AGF provides
investment management and financial solutions to retail,
institutional and high-net-worth clients.
AGF offers a diversified family of mutual funds, mutual
fund wrap programs and pooled funds. AGF also manages
assets on behalf of institutional investors, including
pension plans, foundations and endowments as well as for
private clients. AGF trades on the toronto Stock exchange
under the symbol AGF.B.

Annual Report 2014 1
Our mission Helping investors succeed.™
Our vision to be the premier Canadian-based investment
management firm with industry-leading
financial performance, talent and client
relationships.
Table of contentsFinancial highlights 2
A message to shareholders 4
executive interview 8
Our global footprint 10
Corporate social responsibility 12
AGF corporate governance practices 14
Management’s discussion and analysis 17
Management’s responsibility for financial reporting 52
Auditor’s report 53
Consolidated statement of financial position 54
Consolidated statement of income 56
Consolidated statement of comprehensive income 57
Consolidated statement of changes in equity 58
Consolidated statement of cash flow 59
notes to consolidated financial statements 60
Consolidated 10-year review 95
Board of directors and executive officers 96
AGF corporate directory 97
Table of Contents
2 AGF Management Limited
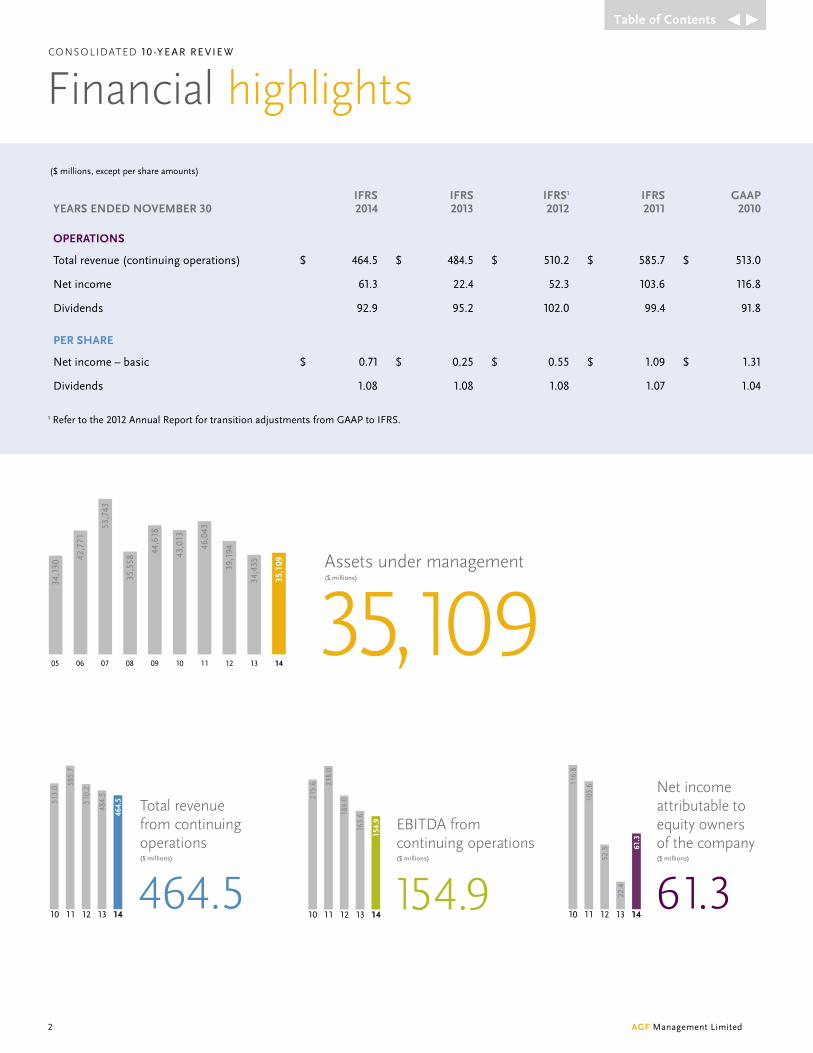
($ millions, except per share amounts)
YeARs ended novembeR 30IFRs 2014
IFRs 2013
IFRs1 2012
IFRs 2011
GAAp 2010
opeRATIons
total revenue (continuing operations) $ 464.5 $ 484.5 $ 510.2 $ 585.7 $ 513.0
net income 61.3 22.4 52.3 103.6 116.8
dividends 92.9 95.2 102.0 99.4 91.8
peR shARe
net income – basic $ 0.71 $ 0.25 $ 0.55 $ 1.09 $ 1.31
dividends 1.08 1.08 1.08 1.07 1.04
1 Refer to the 2012 Annual Report for transition adjustments from GAAP to iFRS.
COnsOlidaTed 10 -ye AR Re vie W
Financial highlights
Net income attributable to equity owners of the company ($ millions)
0
30
60
90
120
150116.
8
103.
6
52.3 61
.3
22.4 61.3
1413121110
Total revenue from continuing operations ($ millions)
0
100
200
300
400
500
600
1413121110
510.
2585.
7
513.
0
484.
5
464.
5
464.5
0
9000
18000
27000
36000
45000
54000
14131211100908070605
Assets under management ($ millions)
34,1
30
05
42,7
71
06
53,7
43
12 13 14
34,4
35
35,1
09
35,109
39,1
94
11
46,0
43
10
43,0
13
09
44,6
18
0807
35,5
58
EBITDA from continuing operations($ millions)
0
45
90
135
180
225
270
315
360
0
45
90
135
180
225
270
315
360
215.
6 238.
0
189.
0
154.
9
163.
6
154.91413121110
Table of Contents
Annual Report 2014 3
Earnings per share (basic)($)
0.0
0.3
0.6
0.9
1.2
1.5
1.09
1.31
0.55
0.25
0.71
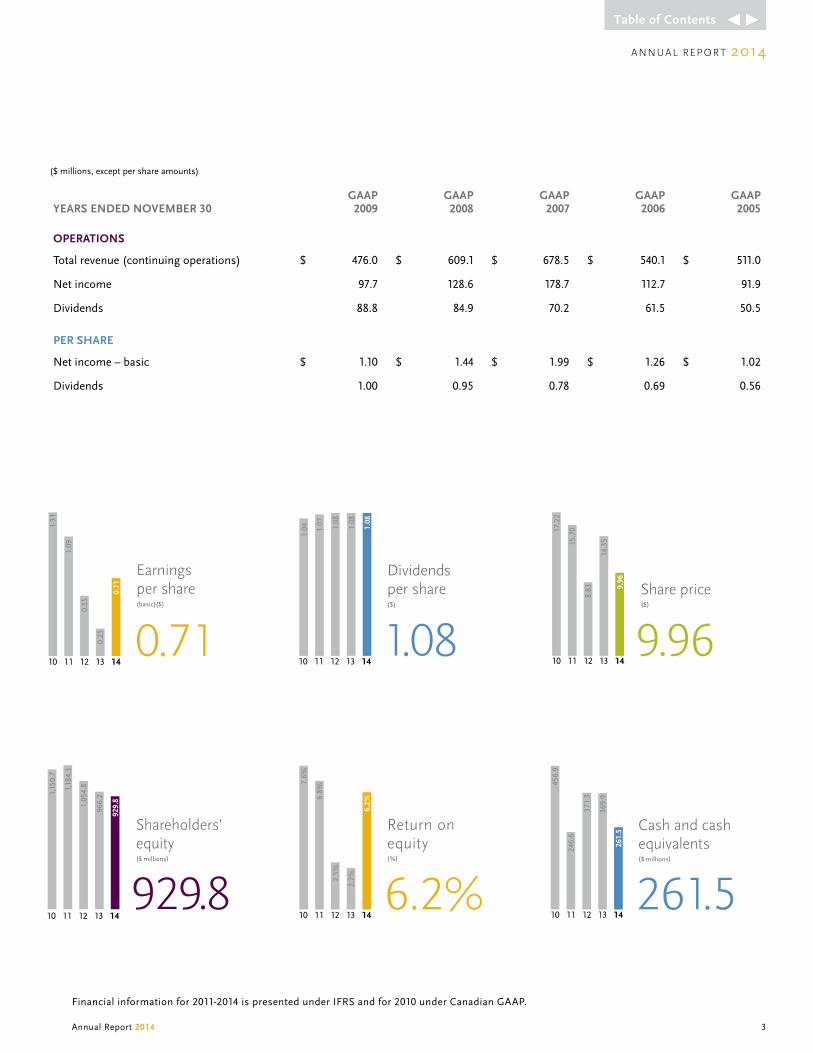
0.711413121110
Share price($)
0.000000
4.571430
9.142859
13.714289
18.285719
22.857149
27.428578
8.83
14.3
5
9.96
9.96
15.7
017.2
2
1413121110
0.0
0.1
0.2
0.3
0.4
0.5
0.6
0.7
0.8
0.9Dividends per share ($)
1.08
1.08
1.08
1.08
1.07
1.04
1413121110
Shareholders’equity ($ millions)
0
300
600
900
1200
966.
2
929.
8
929.8
1,05
4.81,18
4.3
1,15
0.7
1413121110
divs per share.eps
Return onequity (%)
0
1
2
3
4
5
6
7
8
2.5%
2.2%
6.2%
6.2%
6.8%
7.6%
1413121110
divs per share.eps
Cash and cash equivalents ($ millions)
0
100
200
300
400
500369.
9
261.
5
261.5
371.
3
246.
6
456.
9
1413121110
annual Rep OR T 2014
($ millions, except per share amounts)
YeARs ended novembeR 30GAAp 2009
GAAp 2008
GAAp 2007
GAAp 2006
GAAp 2005
opeRATIons
total revenue (continuing operations) $ 476.0 $ 609.1 $ 678.5 $ 540.1 $ 511.0
net income 97.7 128.6 178.7 112.7 91.9
dividends 88.8 84.9 70.2 61.5 50.5
peR shARe
net income – basic $ 1.10 $ 1.44 $ 1.99 $ 1.26 $ 1.02
dividends 1.00 0.95 0.78 0.69 0.56
Financial information for 2011-2014 is presented under iFRS and for 2010 under Canadian GAAP.
Table of Contents

4 AGF Management Limited
to shareholders
annual Rep OR T 2014
a message
blake C. Goldring, m.s.m., cfaChairman and Chief executive Officer
Table of Contents

Annual Report 2014 5
2014 mARkeT oveRvIew
the past year was largely a strong one for developed markets, while emerging markets generally produced more modest returns. in Canada, markets were strong for much of the year.
U.S. economic growth and labour market improvement resulted in strong U.S. equity returns and the termination of the U.S. Federal Reserve Board’s (Fed’s) third round of quantitative easing in October. the dichotomy between the Fed’s monetary stance and other central banks’ easing policies resulted in the strong appreciation of the U.S. dollar. Although the Japanese economy entered a technical recession during the period, Japanese equities performed strongly as the Bank of Japan expanded its monetary easing program. the easing policies took a significant toll on the Japanese yen, which benefited Japanese exporters. european equities underperformed as the region struggled with deflation concerns.
emerging markets produced modest returns but underperformed developed markets as economic activity generally decelerated. For the first time in two years, the People’s Bank of China cut its benchmark deposit and lending rates, highlighting China’s concerns over decelerating growth.
Global bond yields trended lower during
the period as a result of strong fixed-
income demand, geopolitical risk and
disinflationary trends. Consequently,
longer-duration fixed-income securities
significantly outperformed.
Recently, Canadian equities fell, along
with a decline in the price of oil to levels
not seen since 2007. the January 2015
rate cut by the Bank of Canada has also
weighed heavily on the Canadian dollar.
TAkInG deCIsIve ACTIon To
posITIon AGF FoR GRowTh
during 2014, we made significant
progress on our priorities, and in
doing so laid the foundation for
future growth and expansion. AGF is
focused on sustainable value creation
for shareholders. to further position
the firm for long-term growth, we
announced a change in our capital
strategy late in 2014, which included
retaining more capital to fund initiatives
with greater potential to grow our
business. these initiatives include
improving the company’s investment
performance, growing our asset base
and enhancing our focus on client
relationships.
AGF has paid dividends for 46 years as
a public company and we continue to
be committed to paying a reasonable
and sustainable dividend as part of
our approach to returning value to
shareholders. We will also continue to
deliver value through our share buyback
program, which we renewed in early
2015, and through the execution of our
growth initiatives.
2014 AChIevemenTs
After an extensive search, we welcomed
Kevin McCreadie as President and Chief
investment Officer in June 2014. He
brings more than 30 years of investment
management experience to AGF in
both the retail and institutional space.
Kevin is focusing on three key areas:
risk management processes, portfolio
construction and performance, and
investment talent. i am pleased with
the progress we have seen so far in the
first months of his tenure and believe
his efforts and those of our dedicated
employees across AGF are starting to
manifest in improving operating and
financial performance.
enhancing investment performance
was a key focus throughout 2014. As at
november 30, 2014, 34% of our AUM
was above median compared to 30%
at november 30, 2013. We recognize
that we still have work to do and this
remains our number one priority.
For nearly six decades, aGF has provided asset management services to institutions and
individuals around the globe. We are committed to delivering excellence in investment
management, developing innovative product solutions that meet our clients’ needs, and
increasing value for shareholders. in the next few pages, i share my thoughts regarding
what we accomplished in 2014 and what i see for aGF in 2015.
Table of Contents
6 AGF Management Limited
We have built the foundation of our alternative asset management platform through our joint venture, instarAGF Asset Management inc. (instarAGF). established in early 2014, instarAGF’s talented and experienced team is led by Gregory Smith. in September 2014, in partnership with Stream Asset Financial Limited, instarAGF launched a midstream oil and gas infrastructure fund with commitments of approximately $210.0 million. instarAGF expects to launch its essential infrastructure Fund in the first half of 2015.
On January 27, 2015, instarAGF announced that nieuport Aviation infrastructure Partners GP, a consortium of Canadian and international infrastructure investors that includes instarAGF, acquired the passenger terminal at Billy Bishop toronto City Airport from a subsidiary of Porter Aviation Holdings inc. AGF, as a cornerstone investor in instarAGF’s essential infrastructure Fund, contributed approximately $103.0 million of capital. Our investment is consistent with AGF’s strategy to deploy capital to initiatives that will deliver growing and sustainable shareholder value.
in mid-2014, we launched AGF’s “value of Advice” national advertising campaign to promote the value of professional financial advice to Canadians. We are strong believers in the value of financial advice and feel investors who work with advisors are better positioned to meet their long-term goals. in conjunction with this, we entered into a multi-year partnership with the Canadian Football League to promote the brand and the message to a wider audience.
in november 2014, AGF was recognized with the Morningstar Canadian investment Marketing Award for AGF’s “Rethink Risk” marketing campaign. the campaign was developed to help advisors educate their clients and promote financial literacy.
2014 FInAnCIAl oveRvIew
As at november 30, 2014, our total AUM
was $35.1 billion, up from $34.4 billion at
november 30, 2013. We have continued
to see monthly improvement in our
retail fund net redemptions, which have
declined on a year-over-year basis since
January 2013. One of our key priorities is
to continue to reduce redemptions and
increase gross sales by improving our
investment performance and offering
innovative products that meet our
clients’ needs.
Financially, AGF’s earnings before
interest, taxes, depreciation and
amortization (eBitdA) from continuing
operations were $154.9 million, compared
to $163.6 million in 2013. eBitdA margin
was 33.3% compared to 33.8% in 2013.
diluted earnings per share (ePS) from
continuing operations for the year
ended november 30, 2014 increased to
$0.68 per share, compared to adjusted
diluted ePS of $0.53 per share in 2013,
reflecting the impact of cost control and
lower amortization expense.
Our balance sheet remains strong with
$261.5 million in cash and a modest
long-term debt to equity level of 33.1%.
during 2014, AGF paid out total
dividends of $1.08 per share. in all, we
returned $112.8 million of capital to you,
our shareholders, through a combination
of dividends and share buybacks.
ChAnGes To The boARd
in January 2014, we welcomed Sarah
davis to our Board of directors. Sarah
is the Chief Administrative Officer
of Loblaw Companies Ltd., Canada’s
largest food retailer, and brings over
two decades of strategic and financial
management experience at successful
Canadian companies. She has also been
honoured as one of Canada’s Most
Powerful Women: top 100™. it has been
a pleasure to have Sarah on our Board
and to benefit from her experience and
insight. AGF is committed to diversity
within our organization and we feel
privileged to have attracted an executive
like Sarah to the Board.
in April 2014, Bill Morneau decided
to enter the world of politics and was
obliged to resign from AGF’s Board,
where he served as a director since
2000, and as Chairman of AGF’s
Compensation Committee. i would
like to personally thank Bill for all his
contributions to AGF.
2015 ouTlook And
oppoRTunITIes
i am excited about our business
strengths and growth potential.
executing on our key initiatives –
improving investment performance,
building our asset base and
strengthening partner and client
relationships – will remain our focus in
2015. With a strong financial position,
capital flexibility and our unwavering
commitment to achieving our goals,
we are positioned to seize new
opportunities in 2015.
In AppReCIATIon
in closing, i would like to express my
sincere thanks to all of our stakeholders
for their continued support and
confidence throughout 2014. i also
wish to thank AGF’s Board of directors
for their ongoing counsel and advice.
Finally, thank you to the AGF team for
your commitment and enthusiasm as
we work together to achieve AGF’s goals
and create value for shareholders.
Blake C. Goldring, M.S.M., CFA
Chairman and Chief executive Officer
January 28, 2015
Table of Contents

Annual Report 2014 7
investing in the future
Table of Contents

8 AGF Management Limited
investing in performanceexecution, improving investment
performance, increasing assets under
management and building on partner
and client relationships remain the
key areas of focus for aGF. Our
goal is to build on our investment
management platform, continue to
improve our investment performance
and accelerate product development
to help our clients succeed and create
shareholder value.
executive interview
kevin mcCreadie, mba, cfa
President and Chief investment Officer AGF investments inc.
Table of Contents

investing in employees
At AGF, we are committed to a workplace that
encourages collaboration, cooperation and
transparency to drive a culture of performance,
while delivering value to our shareholders.
Robert J. bogart
executive vice-President and Chief Financial Officer
Judy G. Goldring, ll.b.
executive vice-President and Chief Operating Officer
investing in success
We remain focused on our core business of
investment management, while seeking to deploy
capital to take advantage of new investment
opportunities in the asset management space
that generate growth and drive shareholder value.
9
Table of Contents
10 AGF Management Limited
CALGARY
LONDONTORONTO
BOSTON
HALIFAXOTTAWA
MONTREAL LONDONDUBLIN
HONG KONG
SINGAPORE
BEIJING
VANCOUVER
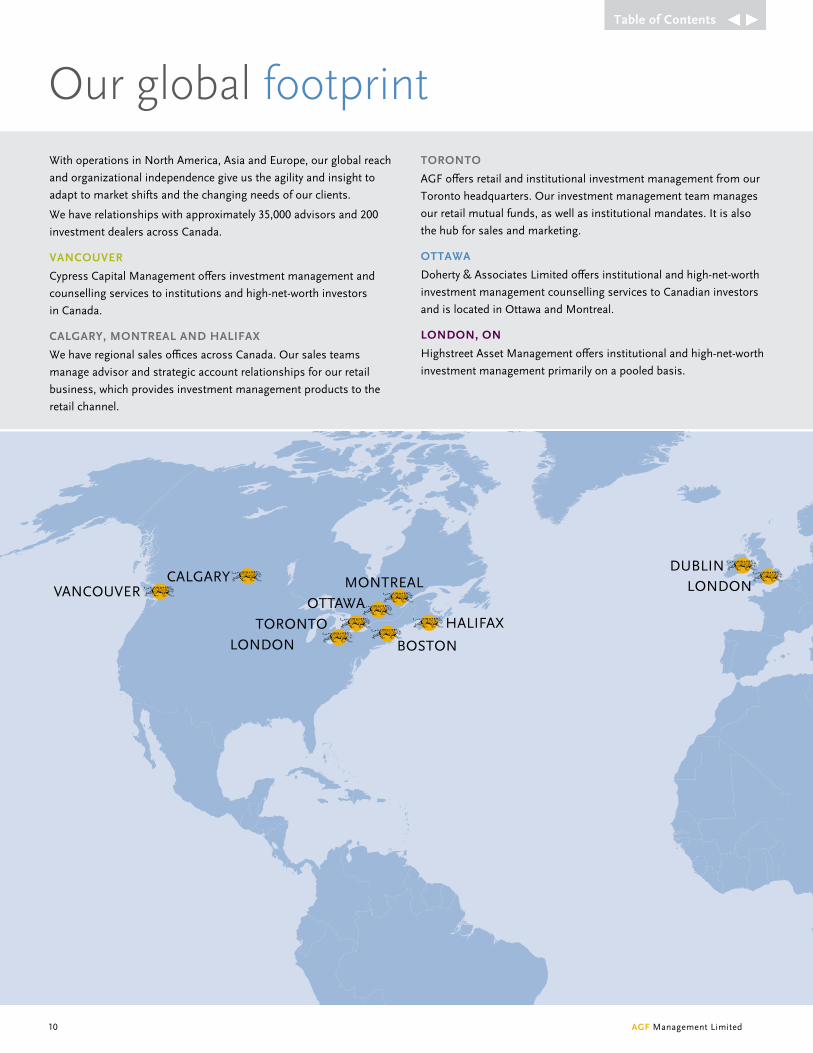
Our global footprintWith operations in north America, Asia and europe, our global reach
and organizational independence give us the agility and insight to
adapt to market shifts and the changing needs of our clients.
We have relationships with approximately 35,000 advisors and 200
investment dealers across Canada.
vAnCouveR
Cypress Capital Management offers investment management and
counselling services to institutions and high-net-worth investors
in Canada.
CAlGARY, monTReAl And hAlIFAx
We have regional sales offices across Canada. Our sales teams
manage advisor and strategic account relationships for our retail
business, which provides investment management products to the
retail channel.
ToRonTo
AGF offers retail and institutional investment management from our
toronto headquarters. Our investment management team manages
our retail mutual funds, as well as institutional mandates. it is also
the hub for sales and marketing.
oTTAwA
doherty & Associates Limited offers institutional and high-net-worth
investment management counselling services to Canadian investors
and is located in Ottawa and Montreal.
london, on
Highstreet Asset Management offers institutional and high-net-worth
investment management primarily on a pooled basis.
Table of Contents
Annual Report 2014 11
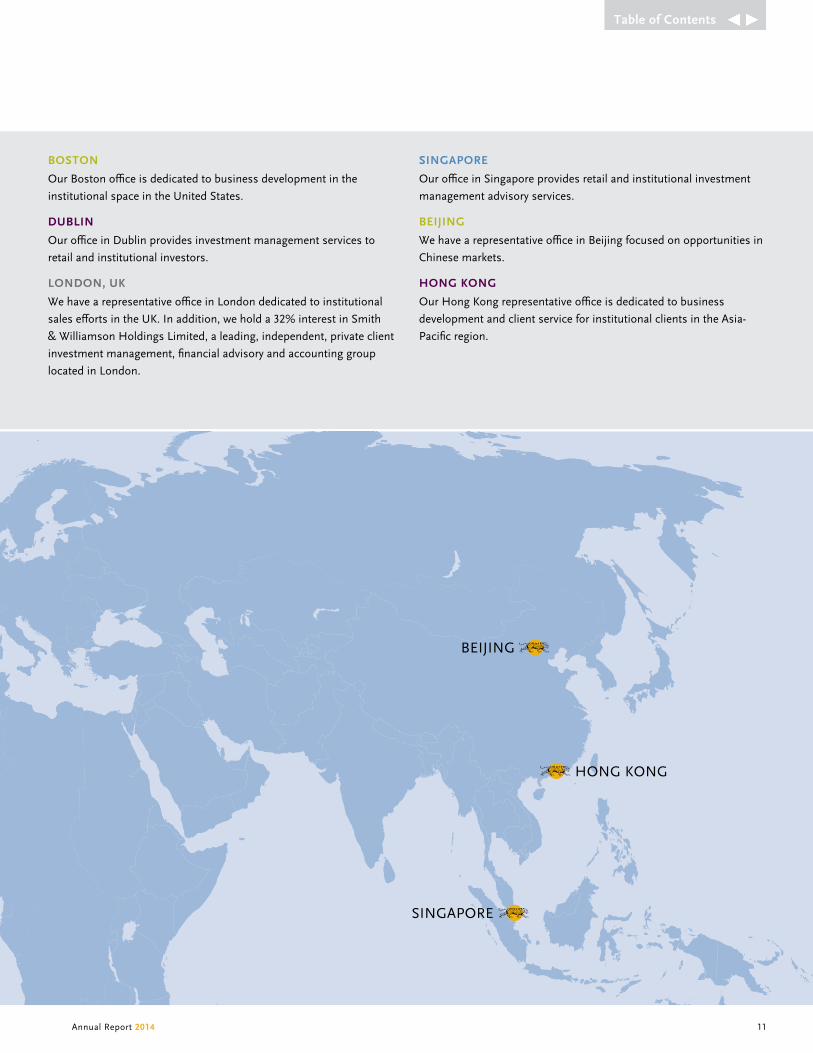
bosTon
Our Boston office is dedicated to business development in the
institutional space in the United States.
dublIn
Our office in dublin provides investment management services to
retail and institutional investors.
london, uk
We have a representative office in London dedicated to institutional
sales efforts in the UK. in addition, we hold a 32% interest in Smith
& Williamson Holdings Limited, a leading, independent, private client
investment management, financial advisory and accounting group
located in London.
sInGApoRe
Our office in Singapore provides retail and institutional investment
management advisory services.
beIJInG
We have a representative office in Beijing focused on opportunities in
Chinese markets.
honG konG
Our Hong Kong representative office is dedicated to business
development and client service for institutional clients in the Asia-
Pacific region.
CALGARY
LONDONTORONTO
BOSTON
HALIFAXOTTAWA
MONTREAL LONDONDUBLIN
HONG KONG
SINGAPORE
BEIJING
VANCOUVER
Table of Contents
12 AGF Management Limited
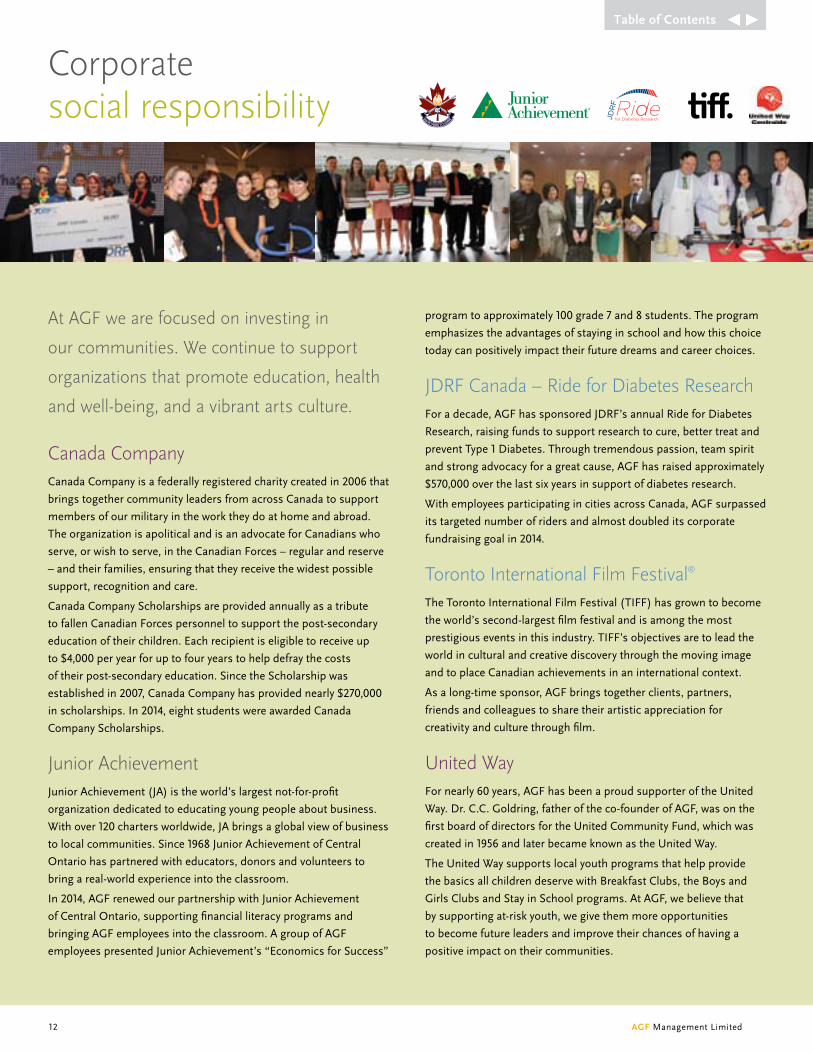
at aGF we are focused on investing in
our communities. We continue to support
organizations that promote education, health
and well-being, and a vibrant arts culture.
Canada CompanyCanada Company is a federally registered charity created in 2006 that
brings together community leaders from across Canada to support
members of our military in the work they do at home and abroad.
the organization is apolitical and is an advocate for Canadians who
serve, or wish to serve, in the Canadian Forces – regular and reserve
– and their families, ensuring that they receive the widest possible
support, recognition and care.
Canada Company Scholarships are provided annually as a tribute
to fallen Canadian Forces personnel to support the post-secondary
education of their children. each recipient is eligible to receive up
to $4,000 per year for up to four years to help defray the costs
of their post-secondary education. Since the Scholarship was
established in 2007, Canada Company has provided nearly $270,000
in scholarships. in 2014, eight students were awarded Canada
Company Scholarships.
Junior achievementJunior Achievement (JA) is the world’s largest not-for-profit
organization dedicated to educating young people about business.
With over 120 charters worldwide, JA brings a global view of business
to local communities. Since 1968 Junior Achievement of Central
Ontario has partnered with educators, donors and volunteers to
bring a real-world experience into the classroom.
in 2014, AGF renewed our partnership with Junior Achievement
of Central Ontario, supporting financial literacy programs and
bringing AGF employees into the classroom. A group of AGF
employees presented Junior Achievement’s “economics for Success”
program to approximately 100 grade 7 and 8 students. the program
emphasizes the advantages of staying in school and how this choice
today can positively impact their future dreams and career choices.
JdRF Canada – Ride for diabetes ResearchFor a decade, AGF has sponsored JdRF’s annual Ride for diabetes
Research, raising funds to support research to cure, better treat and
prevent type 1 diabetes. through tremendous passion, team spirit
and strong advocacy for a great cause, AGF has raised approximately
$570,000 over the last six years in support of diabetes research.
With employees participating in cities across Canada, AGF surpassed
its targeted number of riders and almost doubled its corporate
fundraising goal in 2014.
Toronto international Film Festival®
the toronto international Film Festival (tiFF) has grown to become
the world’s second-largest film festival and is among the most
prestigious events in this industry. tiFF’s objectives are to lead the
world in cultural and creative discovery through the moving image
and to place Canadian achievements in an international context.
As a long-time sponsor, AGF brings together clients, partners,
friends and colleagues to share their artistic appreciation for
creativity and culture through film.
united WayFor nearly 60 years, AGF has been a proud supporter of the United
Way. dr. C.C. Goldring, father of the co-founder of AGF, was on the
first board of directors for the United Community Fund, which was
created in 1956 and later became known as the United Way.
the United Way supports local youth programs that help provide
the basics all children deserve with Breakfast Clubs, the Boys and
Girls Clubs and Stay in School programs. At AGF, we believe that
by supporting at-risk youth, we give them more opportunities
to become future leaders and improve their chances of having a
positive impact on their communities.
Corporate social responsibility
Table of Contents

Annual Report 2014 13
investing in the community
Table of Contents
14 AGF Management Limited
AGF is committed to ensuring its corporate governance practices
evolve with best practices. each of its directors is actively engaged
in his or her duties as a steward of the corporation, tasked with
the protection and promotion of shareholder interests. to help
galvanize the alignment of interests, AGF’s Board has established
a policy that each Board member own at least three times his
or her annual retainer in AGF Class B non-voting shares and/or
deferred Share Units.
AGF operates in a highly regulated environment and complies
with all legislative and regulatory requirements for its businesses.
Regulators include securities commissions and regulators of
financial institutions in the respective jurisdictions in which
AGF operates.
best practices in Corporate Governance in place at
AGF management limited
> All three of the Board’s committees meet independence
guidelines in terms of composition.
> the Board conducts an annual review of its performance,
the performance of each of the Board’s committees, and the
performance of each director.
> All directors are required to own at least three times their annual
retainer in AGF Class B non-voting shares and/or deferred Share
Units. new directors have 24 months upon appointment to
obtain such ownership.
> At each meeting of the Board and Board committees, time
is specifically reserved for independent discussion without
management present.
> An orientation and education program is in place for all
new directors, as well as a continuing education program
for all directors.
> All directors, officers and employees of AGF must acknowledge
their adherence annually to AGF’s Code of Business Conduct
and ethics.
The Board of directors mandate of the board
AGF’s Board is responsible for the stewardship of the Corporation,
including overseeing the conduct of the business and affairs of
the Corporation. the Board has a written charter that is reviewed
annually. All material relating to the strategic plan, which takes into
account the risks and opportunities of the business, is reviewed at
least annually by the Board and discussed with management. Any
transaction having a significant impact on the strategic plan and
other significant decisions that affect the AGF Group of Companies
is approved by the Board. it assesses the effectiveness of the Board
committees based on reports from the committees. in addition,
each director annually completes a Board and Board Committee
effectiveness evaluation questionnaire and a Self-Assessment
questionnaire, the results of which are taken into consideration
for the annual election of directors and appointment of Board
committee members. the Board appoints the Chief executive
Officer and other executive officers.
the Board meets with senior executives on a regular basis to
receive and consider reports on the affairs of the Corporation. the
Board expects these reports to be comprehensive, accurate and
timely. All material communications to shareholders are approved
by the Board. Additionally, the Board reviews and approves annual
and interim reports to shareholders, including financial statements
and management’s discussion and analysis.
Corporate governance practices
Table of Contents
Annual Report 2014 15
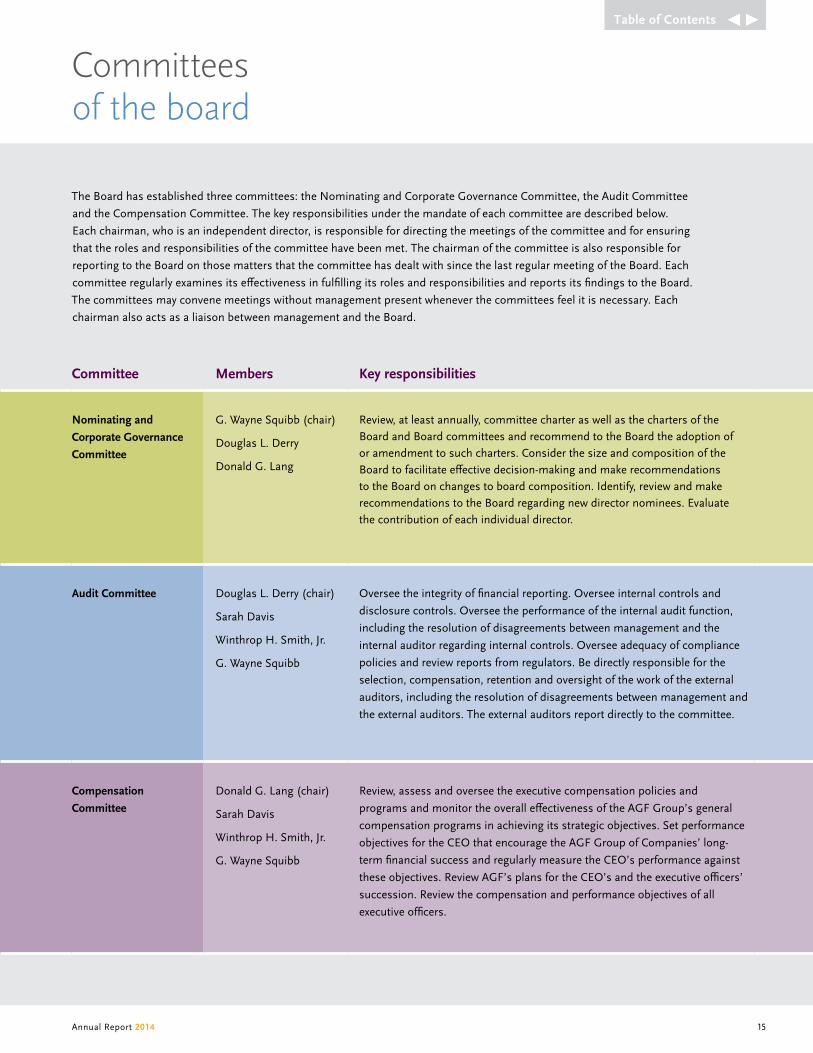
the Board has established three committees: the nominating and Corporate Governance Committee, the Audit Committee
and the Compensation Committee. the key responsibilities under the mandate of each committee are described below.
each chairman, who is an independent director, is responsible for directing the meetings of the committee and for ensuring
that the roles and responsibilities of the committee have been met. the chairman of the committee is also responsible for
reporting to the Board on those matters that the committee has dealt with since the last regular meeting of the Board. each
committee regularly examines its effectiveness in fulfilling its roles and responsibilities and reports its findings to the Board.
the committees may convene meetings without management present whenever the committees feel it is necessary. each
chairman also acts as a liaison between management and the Board.
Committees of the board
Committee members key responsibilities
nominating and
Corporate Governance
Committee
G. Wayne Squibb (chair)
douglas L. derry
donald G. Lang
Review, at least annually, committee charter as well as the charters of the Board and Board committees and recommend to the Board the adoption of or amendment to such charters. Consider the size and composition of the Board to facilitate effective decision-making and make recommendations to the Board on changes to board composition. identify, review and make recommendations to the Board regarding new director nominees. evaluate the contribution of each individual director.
Audit Committee douglas L. derry (chair)
Sarah davis
Winthrop H. Smith, Jr.
G. Wayne Squibb
Oversee the integrity of financial reporting. Oversee internal controls and
disclosure controls. Oversee the performance of the internal audit function,
including the resolution of disagreements between management and the
internal auditor regarding internal controls. Oversee adequacy of compliance
policies and review reports from regulators. Be directly responsible for the
selection, compensation, retention and oversight of the work of the external
auditors, including the resolution of disagreements between management and
the external auditors. the external auditors report directly to the committee.
Compensation
Committee
donald G. Lang (chair)
Sarah davis
Winthrop H. Smith, Jr.
G. Wayne Squibb
Review, assess and oversee the executive compensation policies and
programs and monitor the overall effectiveness of the AGF Group’s general
compensation programs in achieving its strategic objectives. Set performance
objectives for the CeO that encourage the AGF Group of Companies’ long-
term financial success and regularly measure the CeO’s performance against
these objectives. Review AGF’s plans for the CeO’s and the executive officers’
succession. Review the compensation and performance objectives of all
executive officers.
Table of Contents
16 AGF Management Limited
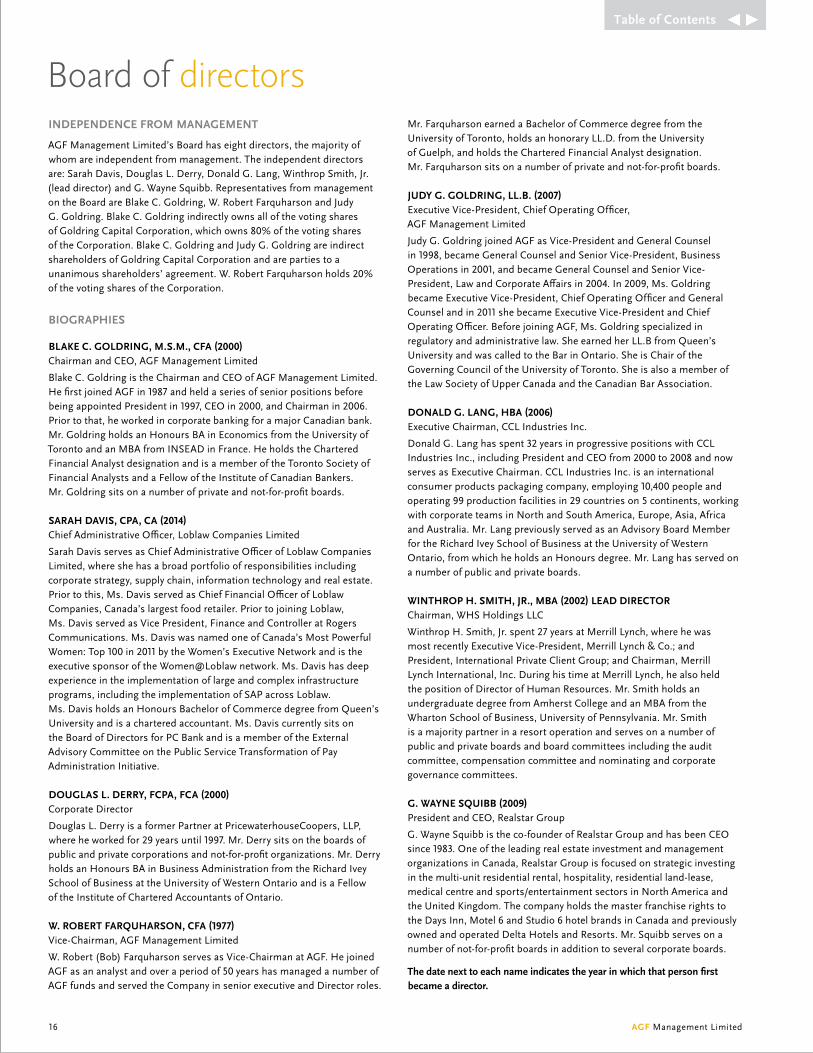
IndependenCe FRom mAnAGemenT
AGF Management Limited’s Board has eight directors, the majority of whom are independent from management. the independent directors are: Sarah davis, douglas L. derry, donald G. Lang, Winthrop Smith, Jr. (lead director) and G. Wayne Squibb. Representatives from management on the Board are Blake C. Goldring, W. Robert Farquharson and Judy G. Goldring. Blake C. Goldring indirectly owns all of the voting shares of Goldring Capital Corporation, which owns 80% of the voting shares of the Corporation. Blake C. Goldring and Judy G. Goldring are indirect shareholders of Goldring Capital Corporation and are parties to a unanimous shareholders’ agreement. W. Robert Farquharson holds 20% of the voting shares of the Corporation.
bIoGRAphIes
blAke C. GoldRInG, m.s.m., CFA (2000)Chairman and CeO, AGF Management Limited
Blake C. Goldring is the Chairman and CeO of AGF Management Limited. He first joined AGF in 1987 and held a series of senior positions before being appointed President in 1997, CeO in 2000, and Chairman in 2006. Prior to that, he worked in corporate banking for a major Canadian bank. Mr. Goldring holds an Honours BA in economics from the University of toronto and an MBA from inSeAd in France. He holds the Chartered Financial Analyst designation and is a member of the toronto Society of Financial Analysts and a Fellow of the institute of Canadian Bankers. Mr. Goldring sits on a number of private and not-for-profit boards.
sARAh dAvIs, CpA, CA (2014)Chief Administrative Officer, Loblaw Companies Limited
Sarah davis serves as Chief Administrative Officer of Loblaw Companies Limited, where she has a broad portfolio of responsibilities including corporate strategy, supply chain, information technology and real estate. Prior to this, Ms. davis served as Chief Financial Officer of Loblaw Companies, Canada’s largest food retailer. Prior to joining Loblaw, Ms. davis served as vice President, Finance and Controller at Rogers Communications. Ms. davis was named one of Canada’s Most Powerful Women: top 100 in 2011 by the Women’s executive network and is the executive sponsor of the Women@Loblaw network. Ms. davis has deep experience in the implementation of large and complex infrastructure programs, including the implementation of SAP across Loblaw. Ms. davis holds an Honours Bachelor of Commerce degree from Queen’s University and is a chartered accountant. Ms. davis currently sits on the Board of directors for PC Bank and is a member of the external Advisory Committee on the Public Service transformation of Pay Administration initiative.
douGlAs l. deRRY, FCpA, FCA (2000)Corporate director
douglas L. derry is a former Partner at PricewaterhouseCoopers, LLP, where he worked for 29 years until 1997. Mr. derry sits on the boards of public and private corporations and not-for-profit organizations. Mr. derry holds an Honours BA in Business Administration from the Richard ivey School of Business at the University of Western Ontario and is a Fellow of the institute of Chartered Accountants of Ontario.
w. RobeRT FARquhARson, CFA (1977) vice-Chairman, AGF Management Limited
W. Robert (Bob) Farquharson serves as vice-Chairman at AGF. He joined AGF as an analyst and over a period of 50 years has managed a number of AGF funds and served the Company in senior executive and director roles.
Mr. Farquharson earned a Bachelor of Commerce degree from the University of toronto, holds an honorary LL.d. from the University of Guelph, and holds the Chartered Financial Analyst designation. Mr. Farquharson sits on a number of private and not-for-profit boards.
JudY G. GoldRInG, ll.b. (2007)executive vice-President, Chief Operating Officer, AGF Management Limited
Judy G. Goldring joined AGF as vice-President and General Counsel in 1998, became General Counsel and Senior vice-President, Business Operations in 2001, and became General Counsel and Senior vice-President, Law and Corporate Affairs in 2004. in 2009, Ms. Goldring became executive vice-President, Chief Operating Officer and General Counsel and in 2011 she became executive vice-President and Chief Operating Officer. Before joining AGF, Ms. Goldring specialized in regulatory and administrative law. She earned her LL.B from Queen’s University and was called to the Bar in Ontario. She is Chair of the Governing Council of the University of toronto. She is also a member of the Law Society of Upper Canada and the Canadian Bar Association.
donAld G. lAnG, hbA (2006)executive Chairman, CCL industries inc.
donald G. Lang has spent 32 years in progressive positions with CCL industries inc., including President and CeO from 2000 to 2008 and now serves as executive Chairman. CCL industries inc. is an international consumer products packaging company, employing 10,400 people and operating 99 production facilities in 29 countries on 5 continents, working with corporate teams in north and South America, europe, Asia, Africa and Australia. Mr. Lang previously served as an Advisory Board Member for the Richard ivey School of Business at the University of Western Ontario, from which he holds an Honours degree. Mr. Lang has served on a number of public and private boards.
wInThRop h. smITh, JR., mbA (2002) leAd dIReCToRChairman, WHS Holdings LLC
Winthrop H. Smith, Jr. spent 27 years at Merrill Lynch, where he was most recently executive vice-President, Merrill Lynch & Co.; and President, international Private Client Group; and Chairman, Merrill Lynch international, inc. during his time at Merrill Lynch, he also held the position of director of Human Resources. Mr. Smith holds an undergraduate degree from Amherst College and an MBA from the Wharton School of Business, University of Pennsylvania. Mr. Smith is a majority partner in a resort operation and serves on a number of public and private boards and board committees including the audit committee, compensation committee and nominating and corporate governance committees.
G. wAYne squIbb (2009)President and CeO, Realstar Group
G. Wayne Squibb is the co-founder of Realstar Group and has been CeO since 1983. One of the leading real estate investment and management organizations in Canada, Realstar Group is focused on strategic investing in the multi-unit residential rental, hospitality, residential land-lease, medical centre and sports/entertainment sectors in north America and the United Kingdom. the company holds the master franchise rights to the days inn, Motel 6 and Studio 6 hotel brands in Canada and previously owned and operated delta Hotels and Resorts. Mr. Squibb serves on a number of not-for-profit boards in addition to several corporate boards.
The date next to each name indicates the year in which that person first became a director.
Board of directors
Table of Contents
Table of contents
mAnAGemenT’s dIsCussIon And AnAlYsIs
18 Basis of Presentation and Summary of Accounting Policies
18 Our Business
19 Key Performance drivers
19 Our Strategy
20 Our Priorities and Progress
21 Outlook
22 2014 Financial and Operational Performance Overview
23 Assets Under Management
24 Consolidated Operating Results
30 Liquidity and Capital Resources
30 Contractual Obligations
31 intercompany and Related Party transactions
32 Capital Management Activities from Continuing Operations
32 dividends
33 Key Performance indicators, Additional iFRS and
non-iFRS Measures
36 Significant Accounting Policies
37 Risk Factors and Management of Risk
42 Controls and Procedures
43 Government Regulations
45 Fourth Quarter Analysis
50 Selected Quarterly information
51 Selected Annual information
51 Additional information
Caution regarding forward-looking statements this Management’s discussion and Analysis (Md&A) includes forward-looking statements about the Company, including its business operations, strategy and expected financial performance and condition. Forward-looking statements include statements that are predictive in nature, depend upon or refer to future events or conditions, or include words such as ‘expects,’ ‘anticipates,’ ‘intends,’ ‘plans,’ ‘believes’ or negative versions thereof and similar expressions, or future or conditional verbs such as ‘may,’ ‘will,’ ‘should,’ ‘would’ and ‘could.’ in addition, any statement that may be made concerning future financial performance (including revenues, earnings or growth rates), ongoing business strategies or prospects, and possible future action on our part, is also a forward-looking statement. Forward-looking statements are based on certain factors and assumptions, including expected growth, results of operations, business prospects, business performance and opportunities. While we consider these factors and assumptions to be reasonable based on information currently available, they may prove to be incorrect. Forward-looking statements are based on current expectations and projections about future events and are inherently subject to, among other things, risks, uncertainties and assumptions about our operations, economic factors and the financial services industry generally. they are not guarantees of future performance, and actual events and results could differ materially from those expressed or implied by forward-looking statements made by us due to, but not limited to, important risk factors such as level of assets under our management, volume of sales and redemptions of our investment products, performance of our investment funds and of our investment managers and advisors, pipeline, competitive fee levels for investment management products and administration, and competitive dealer compensation levels and cost efficiency in our investment management operations, as well as interest and foreign-exchange rates, taxation, changes in government regulations, unexpected judicial or regulatory proceedings, and our ability to complete strategic transactions and integrate acquisitions. We caution that the foregoing list is not exhaustive. the reader is cautioned to consider these and other factors carefully and not place undue reliance on forward-looking statements. Other than specifically required by applicable laws, we are under no obligation (and expressly disclaim any such obligation) to update or alter the forward-looking statements, whether as a result of new information, future events or otherwise. For a more complete discussion of the risk factors that may impact actual results, please refer to the ‘Risk Factors and Management of Risk’ section of this Md&A.
Management’s discussion and analysis of f inancial condition and results of operations
17 AGF Management Limited
Table of Contents
Management’s discussion and analysis of Financial Condition and Results of Operations this Management’s discussion and Analysis (Md&A) is as of January 27, 2015, and presents an analysis of the financial condition of AGF and its subsidiaries as at november 30, 2014, compared to november 30, 2013. the Md&A should be read in conjunction with the 2014 Consolidated Financial Statements for the year ended november 30, 2014. All dollar amounts are in Canadian dollars unless otherwise indicated. throughout this discussion, percentage changes are calculated based on numbers rounded to the decimals that appear in this Md&A. Results, except per share information, are presented in millions of dollars. Certain totals, subtotals and percentages may not reconcile due to rounding. For purposes of this discussion, the operations of AGF and our subsidiary companies are referred to as ‘we,’ ‘us,’ ‘our,’ ‘the firm’ or ‘the Company.’
basis of presentation and summary of Accounting policiesthe consolidated financial statements have been prepared in accordance with international Financial Reporting Standards (iFRS) as issued by the international Accounting Standards Board (iASB).
We also utilize non-iFRS financial measures to assess our overall performance. details of non-iFRS measures used are outlined in the ‘Key Performance indicators, Additional iFRS and non-iFRS Measures’ section, which provides calculations of the non-iFRS measures.
our businessAGF Management Limited, with $35.1 billion in assets under management (AUM) as at november 30, 2014, is one of the largest independent Canadian-based investment management firms, with operations and investments in Canada, the United States, the United Kingdom, ireland and Asia.
the origin of our Company dates back to 1957 with the introduction of the American Growth Fund, the first mutual fund available to Canadians seeking to invest in the United States. As of november 30, 2014, our products and services include a diverse lineup of investment solutions for retail, institutional and high-net-worth clients. Our multi-disciplined investment management teams have expertise across the balanced, fixed income, equity and specialty asset categories and are located in toronto, dublin and Singapore.
Our retail business delivers a wide range of products across a number of investment strategies, including AGF mutual funds, the AGF elements portfolios and the Harmony Private investment Program. Our products are delivered through multiple channels, including advisors, financial planners, banks, life insurance companies and brokers. We have sales organizations located across Canada serving regional advisors and their clients, while our strategic accounts team serves our corporate distribution partners.
Our institutional business offers a variety of investment mandates through pooled funds and segregated accounts. Our global institutional business provides investment management services for a variety of clients including institutions, pension funds, foundations, sovereign wealth funds and endowments. We offer a diverse range of investment strategies and have sales and client service offices in toronto, London (Ontario), Boston, dublin, London (england), Hong Kong and Beijing.
Our high-net-worth business delivers investment management and counselling services in local markets. it includes the operations of Cypress Capital Management Limited in vancouver; Highstreet Asset Management (Highstreet) in London, Ontario; and doherty & Associates in Ottawa and Montreal.
We hold a 50.1% interest in instarAGF Asset Management inc. (instarAGF), a joint venture with instar Group inc. (instar), to develop an alternative asset management platform offering new alternative investment products to support our retail, institutional and high-net-worth channels. instarAGF holds a 37.0% interest in Stream Asset Financial Management LP, manager of a midstream oil and gas infrastructure fund. in addition, instarAGF plans to launch its essential
Management’s discussion and analysis of f inancial condition and results of operations
18 AGF Management Limited
Table of Contents
AGF Management Limited 19
infrastructure Fund in early 2015, in which AGF will participate as a cornerstone investor. the fund will invest in utilities and civil, social and power infrastructure assets, including renewable energy.
We hold a 32.0% interest in Smith & Williamson Holdings Limited (S&WHL), a leading independent private client investment management, financial advisory and accounting group based in the UK. S&WHL is one of the top 10 largest firms of accountants in the UK and its investment management business has over £15.7 billion of funds under management and advice as at november 30, 2014.
the principal subsidiaries and associated companies included, collectively referenced as the AGF Group of Companies (AGF), are entities listed in the ‘Government Regulations’ section on page 43 of this Md&A.
key performance driversAGF uses several key performance indicators (KPis) to measure the success of our business strategies. Refer to the ‘Key Performance indicators, Additional iFRS and non-iFRS Measures’ section of this Md&A.
our strategyAGF is a firm focused exclusively on investment management. the Company believes that superior investment performance and product innovation are key to its success. it also believes strongly in diversification, both in terms of investment styles and product solutions offered to clients, and in the client segments in which it operates. Finally, AGF is a global firm, with investment research capabilities and institutional sales offices in Canada and abroad.
Measuring long-term shareholder growth, we look to the following KPis:
▪ AUM growth
▪ Revenue growth driven by new sales, investment performance and client retention
▪ earnings before interest, taxes, depreciation, amortization and non-controlling interest (eBitdA) growth
▪ Pre-tax margins
year-over-year improvement in these measures is expected to result in improved cash flows as well as improved return on equity. Our objective is the return of a fair share of the annual cash flow to shareholders in the form of dividends and through share buybacks, with the remaining cash flow being invested in a manner intended to support future growth.
Our strategy also recognizes that our business will experience cycles related to the global stock markets, credit availability, employment levels and other economic factors. We believe that a successful strategy is founded on the ability of our operations to effectively operate through economic downturns and upturns by controlling cost and maintaining an effective operating infrastructure.
Table of Contents
our priorities and progressAGF is committed to our mission of ‘Helping investors Succeed.’ throughout 2014, we remained focused on our three key priorities:
▪ improving our investment performance
▪ Offering our retail advisors and clients innovative product solutions
▪ international expansion and organic growth
during the year, we made the following progress on our priorities:
Investment performance
We are focused on improving our investment performance. We are doing this through supporting our most promising investment platforms while ensuring we have the talent to achieve our stated goal. to date we have achieved the following:
▪ during the year, we appointed Kevin McCreadie as President and Chief investment Officer (CiO), an experienced investment management executive with over 30 years of experience. Kevin’s focus is on risk management, portfolio construction and talent management.
▪ We completed the build-out of our north American team, with the strengthening of our research team and the hiring of respected Canadian growth manager Peter imhof.
▪ in 2013, we refined our investment process and improved the research capabilities at Highstreet and dublin, resulting in improved performance in the related mandates.
▪ We are in the process of implementing a new risk management tool to enhance our existing capabilities.
▪ For the one-year period ended november 30, 2014, 34% of retail fund AUM is above median, compared to 30% a year ago.
offering our Retail Advisors and Clients Innovative product solutions
Our strategy is to provide our advisors and clients a product platform that offers innovative solutions around specific needs, resulting in organic AUM growth.
▪ during the past three years, we have addressed investor needs related to rising rates and market volatility with the launch of several new funds:
• AGF U.S. AlphaSector Class has generated approximately $300.0 million in net inflows since August 2013,
• AGF Floating Rate income Fund has had net inflows of over $350.0 million since its launch, and
• AGF Focus Funds have brought in over $240.0 million in net inflows since their launch.
• On January 5, 2015, we announced the launch of the Global Convertible Bond Fund. the fund offers investors downside protection with enhanced upside potential.
▪ We intend to develop products that leverage our alternatives capability.
▪ We are actively promoting the AGF brand, ensuring brand recognition throughout the market.
Management’s discussion and analysis of f inancial condition and results of operations
20 AGF Management Limited
Table of Contents

AGF Management Limited 21
International expansion and organic Growth
Our strategy is to leverage our world-class global equity capabilities and distribute our products through structures and platforms that work within their local markets. We have begun to lay the foundation to achieve our goal and are encouraged by the results to date:
▪ through our joint venture with instarAGF, AGF has $210.0 million of fee-bearing AUM as at november 30, 2014 and recognized earnings of $0.3 million and received $1.1 million in distributions related to the management of these assets in 2014.
▪ AGF has allocated a total of $150.0 million to invest in funds and investments associated with the alternative asset management platform. As at november 30, 2014, of the $150.0 million, AGF has committed $50.0 million to Stream Asset Financial LP (Stream), a midstream oil and gas infrastructure fund with equity commitments of approximately $210.0 million, including AGF’s $50.0 million. As at november 30, 2014, AGF had invested $16.6 million in Stream, with $33.4 million remaining committed capital to be invested in the Stream fund.
▪ On January 27, 2015, instarAGF announced the acquisition of the Billy Bishop toronto City Airport passenger terminal by nieuport Aviation infrastructure Partners GP, a consortium of investors led by instarAGF. AGF has committed and invested $103.0 million related to this investment, which will form a seed asset for the essential infrastructure fund. Upon closing of a fund with external investments, the Company will receive a return of its capital in excess of its proportionate participation in the fund. the fund is expected to achieve its first close in the first half of 2015.
▪ in december 2013, we launched our Undertakings for Collective investment in transferable Securities (UCitS) platform. the platform, with AUM of $650.0 million, offers AGF’s emerging markets and global strategy mandates and can be marketed throughout the european Union and Asia.
outlook AGF is focused on growth. during 2014, our fund flows continued to improve and our expansion into the alternatives business is on track. to further ensure that the firm is well positioned for long-term growth, we announced a change in our capital allocation strategy late in 2014 that will result in retained capital being deployed to initiatives with greater potential to increase shareholder value. As part of this strategy, the Company announced an adjustment to the quarterly dividend to $0.08 per share on both the Class B non-voting shares and the Class A voting common shares for the first quarter of 2015. this change in strategy will provide us with increased flexibility to execute our growth strategy and invest in the growth of the business, while being active in AGF’s share buyback program.
As we enter 2015, execution, improving investment performance, increasing assets under management, and building on partner and client relationships will be key areas of focus for AGF. Retaining capital allows us to focus on our key priorities while accelerating product development and the growth of our alternatives platform.
Regulators in Canada are currently reviewing the advisor and client relationship under a broad set of reforms, often referred to as CRM2. CRM2 will be fully implemented by July 2016. While the industry awaits the results of the regulators’ reviews of both the advisor best interest duty and retail mutual fund compensation model, AGF is proactively engaged in addressing areas in our product lineup that account for the changing landscape.
Table of Contents
2014 Financial and operational performance overview
summary of key Financial and operational Results:
▪ total AUM was $35.1 billion at november 30, 2014, as compared to $34.4 billion at november 30, 2013.
▪ Retail AUM was $19.1 billion, as compared to $19.6 billion at november 30, 2013.
▪ Retail fund net redemptions improved to $1.9 billion for the year ended november 30, 2014, compared to net redemptions of $2.4 billion for the year ended november 30, 2013. Since January 2013, each month has shown improvements in the level of retail outflows as compared to the same month of the prior year.
▪ institutional AUM increased to $11.3 billion, compared to $10.9 billion at november 30, 2013.
▪ High-net-worth AUM increased 12.1% to $4.4 billion, compared to $4.0 billion at november 30, 2013.
▪ AGF committed $50.0 million to Stream Asset Financial LP (Stream), a midstream oil and gas infrastructure fund with equity commitments of approximately $210.0 million, including AGF’s $50.0 million. As at november 30, 2014, AGF had invested $16.6 million in Stream, with $33.4 million remaining committed capital to be invested in the Stream fund.
▪ On January 27, 2015, instarAGF announced the acquisition of the Billy Bishop toronto City Airport passenger terminal by nieuport Aviation infrastructure Partners GP, a consortium of investors led by instarAGF. AGF has committed and invested $103.0 million related to this investment, which will form a seed asset for the essential infrastructure fund. Upon closing of a fund with external investments, the Company will receive a return of its capital in excess of its proportionate participation in the fund.
▪ We delivered value directly to our shareholders through dividend payments and share buybacks. during 2014, we paid dividends of $1.08 per share (2013 – $1.08 per share). dividends paid, including dividends reinvested, on Class A voting common shares and Class B non-voting shares, were $93.0 million in fiscal 2014, compared to $95.2 million in fiscal 2013. Under the normal course issuer bid, 1,762,200 Class B non-voting shares were repurchased for a total consideration of $22.1 million at an average price of $12.55.
▪ On december 9, 2014, we announced an adjustment to the quarterly dividend in fiscal 2015 to $0.08 per share as part of our amended capital allocation strategy discussed above.
▪ Revenue from continuing operations was $464.5 million, compared to $484.5 million in the same period of 2013, reflecting lower AUM levels.
▪ eBitdA from continuing operations was $154.9 million, compared to $163.6 million in 2013.
▪ diluted ePS from continuing operations for the year ended november 30, 2014 was $0.68 per share, compared to diluted ePS of $0.25 per share in 2013.
▪ Our balance sheet remains strong with $261.5 million in cash and a modest long-term debt to equity level of 33.1%.
▪ For the one-year period ended november 30, 2014, 34% of ranked AUM performed above median, compared to 30% in 2013.
Management’s discussion and analysis of f inancial condition and results of operations
22 AGF Management Limited
Table of Contents
AGF Management Limited 23
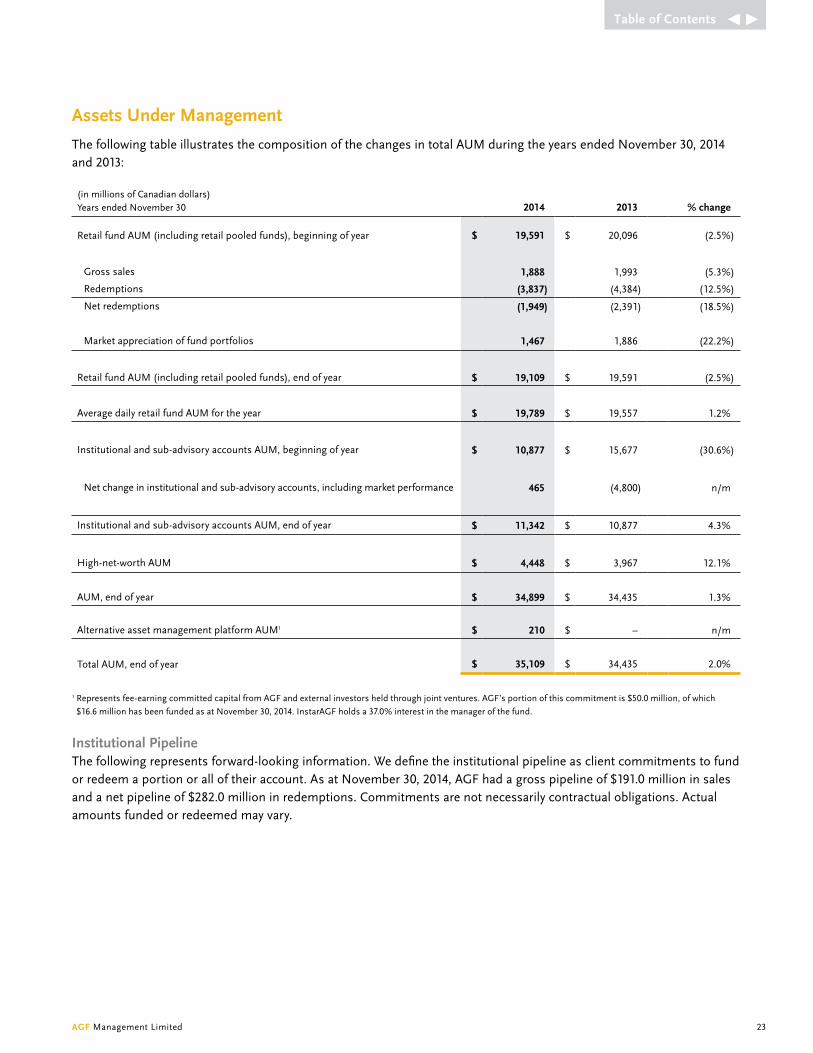
Assets under management
the following table illustrates the composition of the changes in total AUM during the years ended november 30, 2014 and 2013:
(in millions of Canadian dollars) years ended november 30 2014 2013 % change
Retail fund AUM (including retail pooled funds), beginning of year $ 19,591 $ 20,096 (2.5%)
Gross sales 1,888 1,993 (5.3%)
Redemptions (3,837) (4,384) (12.5%)
net redemptions (1,949) (2,391) (18.5%)
Market appreciation of fund portfolios 1,467 1,886 (22.2%)
Retail fund AUM (including retail pooled funds), end of year $ 19,109 $ 19,591 (2.5%)
Average daily retail fund AUM for the year $ 19,789 $ 19,557 1.2%
institutional and sub-advisory accounts AUM, beginning of year $ 10,877 $ 15,677 (30.6%)
net change in institutional and sub-advisory accounts, including market performance 465 (4,800) n/m
institutional and sub-advisory accounts AUM, end of year $ 11,342 $ 10,877 4.3%
High-net-worth AUM $ 4,448 $ 3,967 12.1%
AUM, end of year $ 34,899 $ 34,435 1.3%
Alternative asset management platform AUM1 $ 210 $ – n/m
total AUM, end of year $ 35,109 $ 34,435 2.0%
1 Represents fee-earning committed capital from AGF and external investors held through joint ventures. AGF’s portion of this commitment is $50.0 million, of which
$16.6 million has been funded as at november 30, 2014. instarAGF holds a 37.0% interest in the manager of the fund.
Institutional pipelinethe following represents forward-looking information. We define the institutional pipeline as client commitments to fund or redeem a portion or all of their account. As at november 30, 2014, AGF had a gross pipeline of $191.0 million in sales and a net pipeline of $282.0 million in redemptions. Commitments are not necessarily contractual obligations. Actual amounts funded or redeemed may vary.
Table of Contents
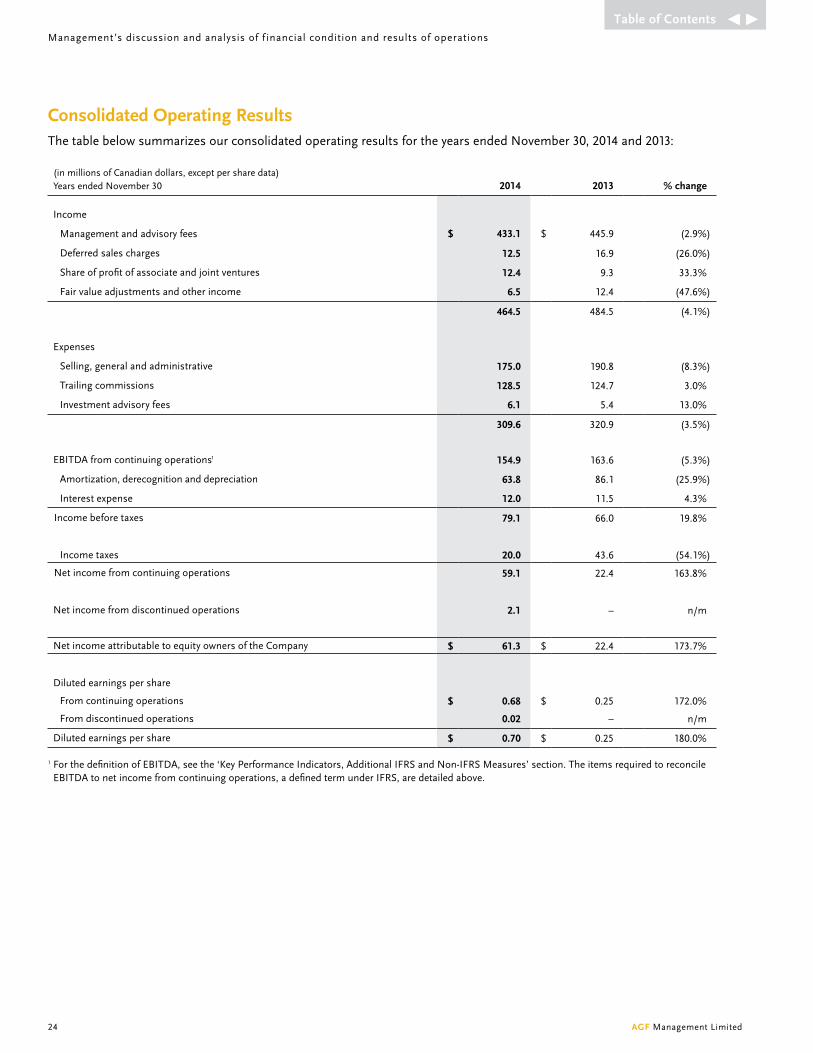
Consolidated operating Resultsthe table below summarizes our consolidated operating results for the years ended november 30, 2014 and 2013:
(in millions of Canadian dollars, except per share data) years ended november 30 2014 2013 % change
income
Management and advisory fees $ 433.1 $ 445.9 (2.9%)
deferred sales charges 12.5 16.9 (26.0%)
Share of profit of associate and joint ventures 12.4 9.3 33.3%
Fair value adjustments and other income 6.5 12.4 (47.6%)
464.5 484.5 (4.1%)
expenses
Selling, general and administrative 175.0 190.8 (8.3%)
trailing commissions 128.5 124.7 3.0%
investment advisory fees 6.1 5.4 13.0%
309.6 320.9 (3.5%)
eBitdA from continuing operations1 154.9 163.6 (5.3%)
Amortization, derecognition and depreciation 63.8 86.1 (25.9%)
interest expense 12.0 11.5 4.3%
income before taxes 79.1 66.0 19.8%
income taxes 20.0 43.6 (54.1%)
net income from continuing operations 59.1 22.4 163.8%
net income from discontinued operations 2.1 – n/m
net income attributable to equity owners of the Company $ 61.3 $ 22.4 173.7%
diluted earnings per share
From continuing operations $ 0.68 $ 0.25 172.0%
From discontinued operations 0.02 – n/m
diluted earnings per share $ 0.70 $ 0.25 180.0%
1 For the definition of eBitdA, see the ‘Key Performance indicators, Additional iFRS and non-iFRS Measures’ section. the items required to reconcile eBitdA to net income from continuing operations, a defined term under iFRS, are detailed above.
Management’s discussion and analysis of f inancial condition and results of operations
24 AGF Management Limited
Table of Contents
AGF Management Limited 25
Income
For the year ended november 30, 2014, income decreased by 4.1% over the previous year, with changes in the categories as follows:
management and Advisory FeesManagement and advisory fees are directly related to our AUM levels. For the year ended november 30, 2014, the average daily retail fund AUM increased 1.2%, while institutional and sub-advisory accounts AUM increased 4.3%. However, management and advisory fees decreased 2.9%, compared to 2013, reflecting the reduction in certain higher fee-earning investment assets, offset by an increase in assets with lower management fee rates.
deferred sales Charges (dsC)We receive deferred sales charges upon redemption of securities sold on the contingent dSC or low-load commission basis for which we finance the selling commissions paid to the dealer. the dSC ranges from 1.5% to 5.5%, depending on the commission option of the original subscription price of the funds purchased if the funds are redeemed within the first two years and declines to zero after three or seven years. dSC revenue fluctuates based on the level of redemptions, the age of the assets being redeemed and the proportion of redemptions composed of back-end assets. dSC revenues decreased by 26.0% for the year ended november 30, 2014 as compared to 2013, reflecting lower redemption levels and redemption of a larger proportion of older, lower-yielding dSC assets.
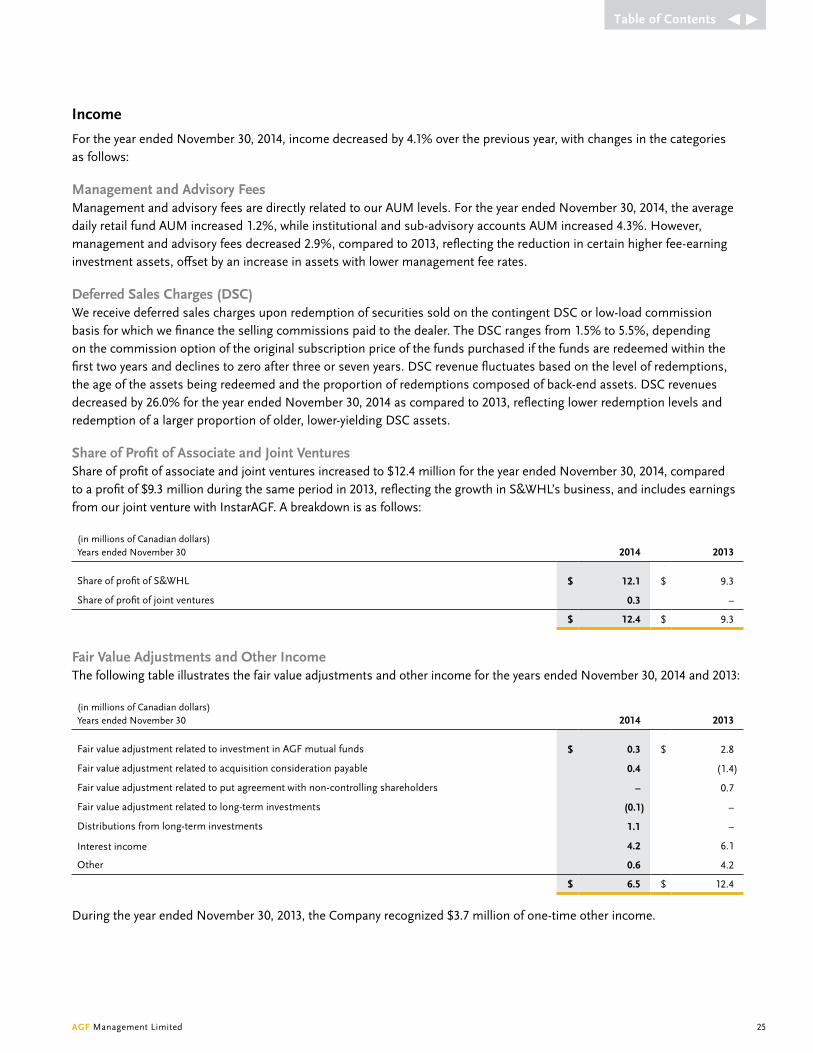
share of profit of Associate and Joint venturesShare of profit of associate and joint ventures increased to $12.4 million for the year ended november 30, 2014, compared to a profit of $9.3 million during the same period in 2013, reflecting the growth in S&WHL’s business, and includes earnings from our joint venture with instarAGF. A breakdown is as follows:
(in millions of Canadian dollars) years ended november 30 2014 2013
Share of profit of S&WHL $ 12.1 $ 9.3
Share of profit of joint ventures 0.3 –
$ 12.4 $ 9.3
Fair value Adjustments and other Incomethe following table illustrates the fair value adjustments and other income for the years ended november 30, 2014 and 2013:
(in millions of Canadian dollars) years ended november 30 2014 2013
Fair value adjustment related to investment in AGF mutual funds $ 0.3 $ 2.8
Fair value adjustment related to acquisition consideration payable 0.4 (1.4)
Fair value adjustment related to put agreement with non-controlling shareholders – 0.7
Fair value adjustment related to long-term investments (0.1) –
distributions from long-term investments 1.1 –
interest income 4.2 6.1
Other 0.6 4.2
$ 6.5 $ 12.4
during the year ended november 30, 2013, the Company recognized $3.7 million of one-time other income.
Table of Contents
expenses
For the year ended november 30, 2014, expenses decreased 3.5% from the previous year. Changes in specific categories are described in the discussion that follows:
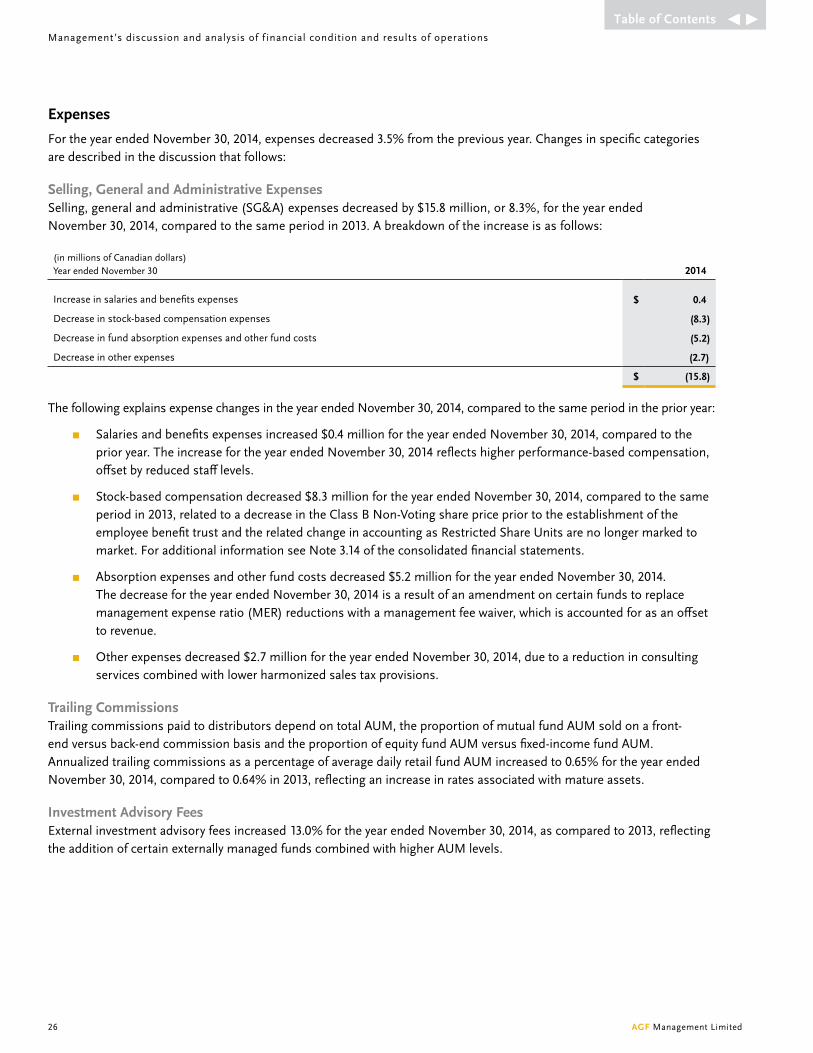
selling, General and Administrative expensesSelling, general and administrative (SG&A) expenses decreased by $15.8 million, or 8.3%, for the year ended november 30, 2014, compared to the same period in 2013. A breakdown of the increase is as follows:
(in millions of Canadian dollars) year ended november 30 2014
increase in salaries and benefits expenses $ 0.4
decrease in stock-based compensation expenses (8.3)
decrease in fund absorption expenses and other fund costs (5.2)
decrease in other expenses (2.7)
$ (15.8)
the following explains expense changes in the year ended november 30, 2014, compared to the same period in the prior year:
▪ Salaries and benefits expenses increased $0.4 million for the year ended november 30, 2014, compared to the prior year. the increase for the year ended november 30, 2014 reflects higher performance-based compensation, offset by reduced staff levels.
▪ Stock-based compensation decreased $8.3 million for the year ended november 30, 2014, compared to the same period in 2013, related to a decrease in the Class B non-voting share price prior to the establishment of the employee benefit trust and the related change in accounting as Restricted Share Units are no longer marked to market. For additional information see note 3.14 of the consolidated financial statements.
▪ Absorption expenses and other fund costs decreased $5.2 million for the year ended november 30, 2014. the decrease for the year ended november 30, 2014 is a result of an amendment on certain funds to replace management expense ratio (MeR) reductions with a management fee waiver, which is accounted for as an offset to revenue.
▪ Other expenses decreased $2.7 million for the year ended november 30, 2014, due to a reduction in consulting services combined with lower harmonized sales tax provisions.
Trailing Commissionstrailing commissions paid to distributors depend on total AUM, the proportion of mutual fund AUM sold on a front-end versus back-end commission basis and the proportion of equity fund AUM versus fixed-income fund AUM. Annualized trailing commissions as a percentage of average daily retail fund AUM increased to 0.65% for the year ended november 30, 2014, compared to 0.64% in 2013, reflecting an increase in rates associated with mature assets.
Investment Advisory Feesexternal investment advisory fees increased 13.0% for the year ended november 30, 2014, as compared to 2013, reflecting the addition of certain externally managed funds combined with higher AUM levels.
Management’s discussion and analysis of f inancial condition and results of operations
26 AGF Management Limited
Table of Contents
AGF Management Limited 27
ebITdA, ebITdA margin and ebITdA per share
eBitdA from continuing operations were $154.9 million for the year ended november 30, 2014, compared to $163.6 million for the same period of 2013. eBitdA margin was 33.3% for the year ended november 30, 2014, compared to 33.8% in the corresponding period in 2013. diluted eBitdA per share from continuing operations for the year ended november 30, 2014 was $1.78, compared to $1.84 for the year ended november 30, 2013.
Amortization and Interest expense the category represents amortization of deferred selling commissions, customer contracts, other intangible assets, property, equipment, and computer software and interest expense. deferred selling commissions amortization represents the most significant category of amortization. We internally finance all selling commissions paid. these selling commissions are capitalized and amortized on a straight-line basis over a period that corresponds with their applicable dSC schedule. Unamortized deferred selling commissions related to units redeemed prior to the end of the schedule are immediately expensed. Amortization expense related to deferred selling commissions was $48.5 million for the year ended november 30, 2014, compared to $58.6 million for the same period of 2013. during the year ended november 30, 2014, we paid $38.4 million in selling commissions, compared to $36.7 million in the same period of 2013, reflecting stable sales. As at november 30, 2014, the unamortized balance of deferred selling commissions financed was $104.8 million (2013 – $114.8 million).
Customer contracts amortization decreased $4.2 million for the year ended november 30, 2014, as a result of fewer redemptions and a lower net book value. Customer contracts are immediately expensed upon redemption of the AUM.
Other intangibles amortization decreased $7.4 million for the year ended november 30, 2014, as a result of certain assets related to the Acuity acquisition being fully amortized at February 1, 2014.
interest expense increased as a result of higher interest rates.
pre-tax profit margin
Pre-tax profit margin increased to 17.0% for the year ended november 30, 2014, compared to a 13.6% margin in the corresponding period in 2013.
Income Tax expense income tax expense for the year ended november 30, 2014 was $20.0 million, as compared to $43.6 million in the corresponding period in 2013. the estimated effective tax rate for the year ended november 30, 2014 was 25.3% (2013 – 66.0%).
the Company believes that it has adequately provided for income taxes based on all of the information that is currently available. the calculation of income taxes in many cases, however, requires significant judgement in interpreting tax rules and regulations. the Company’s tax filings are subject to audits, which could materially change the amount of the current and deferred income tax assets and liabilities, and could, in certain circumstances, result in the assessment of interest and penalties.
in november 2013, the Company received a notice of reassessment (nOR) from the Canada Revenue Agency (CRA) relating to the transfer pricing and allocation of income between one of the Company’s Canadian legal entities and a foreign subsidiary, which would increase the Company’s taxes payable from its original tax filings by $10.0 million, $10.5 million and $15.4 million (before the application of any interest and penalties of $21.6 million) for its 2005, 2006 and 2007 fiscal years, respectively. in november 2014, the Company has also received an nOR from the CRA relating to the same matter, which would increase the Company’s taxes payable from its original tax filings by $13.6 million (before the application of any interest and penalties of $6.3 million) for its 2008 fiscal year.
the Company strongly disagrees with the CRA’s position and filed an objection to the nOR for 2005, 2006 and 2007 in February 2014 and will also object to the nOR for 2008. in connection with the filing of an objection to the nOR for the 2005, 2006 and 2007 fiscal years, the Company was required to pay, and has paid, approximately $39.5 million (including interest
Table of Contents

and penalties) during the year ended november 30, 2014, even though the ultimate outcome may differ from this amount. Subsequent to the year-end, the Company has paid $14.5 million (including interest and penalties) in relation to the 2008 nOR even though the ultimate outcome may differ from this amount. the Company is not expected to make any further significant payments with respect to the nOR for years 2005 to 2008 until the resolution of this matter. including the payments made subsequent to the year-end, the Company has paid approximately $54.0 million with respect to the nOR for years 2005 to 2008.
in relation to this transfer pricing tax audit, the estimated total exposure based on the CRA’s position for years 2005 to 2014 (including interest and penalties and the relief from double taxation) is $85.7 million. in consultation with its external advisors, the Company believes that its tax filing positions continue to be reasonable based on its transfer pricing methodology and the Company is contesting the CRA’s position and any related transfer pricing penalty. the Company believes it is likely that the CRA will reassess its taxes for subsequent years on a similar basis and that these may result in future cash payments on receipt of the reassessments. during the year ended november 30, 2014, the Company has recorded a tax provision of $2.0 million in relation to this transfer pricing audit. the amount of tax provision recorded on the consolidated statement of financial position of $56.1 million (prior to netting the $39.5 million payment described above) reflects management’s best estimate of the final payment to be made on the ultimate resolution of this matter and includes any related estimated interest and penalties for the 2005 to 2014 fiscal years. the final result of the audit and appeals process may vary and may be materially different compared to the estimates and assumptions used by management in determining the Company’s consolidated income tax provision and in valuing its income tax assets and liabilities.
Further to the Company’s objection to the nOR, the Company is also seeking Competent Authority relief from double taxation under the applicable tax treaty. While it is uncertain whether relief from double taxation will be granted, the Company’s provision, which reflects its best estimate of the final payment to be made on the ultimate resolution of this matter, includes an expected recovery of approximately $10.5 million for the tax years 2005 through 2008 that are not covered in the Bilateral Advance Pricing Arrangement (BAPA) as described below.
the Company has been accepted by the CRA into a BAPA between Canada and the relevant tax authorities to establish the appropriate transfer pricing methodologies for the tax years 2009 through 2016. Under a BAPA, the taxpayer can avoid potential double taxation on transactions covered by the BAPA according to the provisions of the income tax treaty between Canada and the foreign country.
net Income
the impact of the above revenue and expense items resulted in a net income from continuing operations of $59.1 million for the year ended november 30, 2014, as compared to net income from continuing operations of $22.4 million in the corresponding period in 2013.
earnings per share
diluted earnings per share from continuing operations increased 172.0% to $0.68 per share for the year ended november 30, 2014, as compared to earnings of $0.25 per share in the corresponding period of 2013.
Management’s discussion and analysis of f inancial condition and results of operations
28 AGF Management Limited
Table of Contents

AGF Management Limited 29
discontinued operations
On August 1, 2012, the Company completed its sale of 100% of the shares of AGF trust Company (AGF trust) for cash consideration corresponding to the net book value of AGF trust at closing of $246.3 million. the agreement included a contingent consideration to a maximum of $20.0 million over five years if the credit performance of AGF trust’s loan portfolio met certain thresholds. in May 2014, the Company finalized an early settlement of the contingent consideration receivable for $10.0 million. At november 30, 2013, the value of the contingent consideration receivable was estimated at $6.1 million. the amount receivable was settled on June 4, 2014. in addition, the Company indemnified the purchaser of AGF trust against unenforceable loans outstanding or committed as at the date of closing which may be put back to the Company on a quarterly basis, subject to certain conditions. the put option will expire on October 31, 2017 and indemnifies only against errors in underwriting and not credit deterioration. the carrying value of the loans subject to indemnification was $3.1 billion at the date of sale. the Company records a provision for indemnified loans when the loan is in default and the put option becomes probable of being exercised, which generally coincides with the receipt of notification by the purchaser that it intends to exercise the put. during the year ended november 30, 2014, a provision of $0.7 million was recorded related to these loans. As a result, the Company realized a net gain on discontinued operations of $3.1 million, or $2.1 million after tax (2013 – nil), during the year ended november 30, 2014.
one-time Adjustments
the table below summarizes one-time adjustments for the years ended november 30, 2014 and 2013:
(in millions of Canadian dollars, except per share data) years ended november 30 2014 2013
eBitdA from continuing operations $ 154.9 $ 163.6
Add:
Restructure charge – 3.6
Other income – (3.7)
Adjusted eBitdA from continuing operations $ 154.9 $ 163.5
net income from continuing operations $ 59.1 $ 22.4
Add:
Adjustments to eBitdA from above – (0.1)
Adjustment to tax provision for the transfer pricing tax audit – 25.0
Adjusted net income from continuing operations $ 59.1 $ 47.3
Adjusted diluted ePS from continuing operations $ 0.68 $ 0.53
Table of Contents

liquidity and Capital ResourcesAs at november 30, 2014, the Company had total cash and cash equivalents of $261.5 million. Free cash flow, as defined on page 34, generated from continuing operating activities was $82.8 million for the year ended november 30, 2014, compared to $102.3 million in the prior year. during the year ended november 30, 2014, we used $108.4 million in cash to fund the following:
▪ We repurchased a total of 1,762,200 (2013 – 2,685,258) shares for $22.1 million (2013 – $30.7 million).
▪ We paid $90.7 million in dividends for the year ended november 30, 2014, compared to $92.8 million in 2013.
▪ We invested $30.7 million in the alternative asset management platform and received a return of capital of $10.9 million during the year ended november 30, 2014.
▪ We purchased $12.8 million (2013 – $5.1 million) in seed capital and investments during the year ended november 30, 2014.
▪ We paid $39.5 million to the CRA in relation to the nOR received during the year ended november 30, 2014.
total long-term debt outstanding at november 30, 2014 was $308.2 million (2013 – $307.9 million). On november 29, 2013, the Company, through its subsidiary AGF investments inc., amended and restated its loan agreements for a four-year term and decreased the total credit availability. the amended unsecured revolving credit has a maximum aggregate principal amount of $400.0 million and includes an accordion feature providing for an additional $100.0 million. As at november 30, 2014, $84.9 million was available to be drawn. the loan facility will be available to meet future operational and investment needs. We anticipate that cash balances and cash flow from operations, together with the available loan facility, will be sufficient in the foreseeable future to implement our business plan, finance selling commissions, satisfy regulatory and tax requirements, service debt repayment obligations, pay quarterly dividends, and fund any future share buybacks.
On december 9, 2014, we announced our intention to reduce the quarterly dividend in fiscal 2015 to $0.08 per share as part of our amended capital allocation strategy.
Contractual obligations the table below is a summary of our contractual obligations at november 30, 2014. See also notes 10 and 27 of the Consolidated Financial Statements.
(in millions of Canadian dollars) Total 2015 2016 2017 2018 2019 Thereafter
Long-term debt $ 310.0 $ – $ – $ 310.0 $ – $ – $ –
Operating leases 43.2 7.4 7.1 6.6 6.2 5.8 10.1
Purchase obligations 10.0 4.7 3.2 1.4 0.6 0.1 –
total contractual obligations $ 363.2 $ 12.1 $ 10.3 $ 318.0 $ 6.8 $ 5.9 $ 10.1
Management’s discussion and analysis of f inancial condition and results of operations
30 AGF Management Limited
Table of Contents

AGF Management Limited 31
in addition to the contractual obligations detailed above, the following obligations exist that vary depending upon business volume and other factors:
▪ We pay trailing commissions to financial advisors based on AUM of their respective clients. this obligation varies based on fund performance, sales and redemptions, and in 2014 we paid $129.4 million in trailing commissions.
▪ We have committed to 2015 to reimburse Citigroup up to $2.8 million per year if minimum levels of services and related fees are not achieved.
▪ in conjunction with the elements Advantage Commitment on certain elements portfolios, AGF has committed to investors that if a portfolio does not match or outperform its customized benchmark over a three-year average annualized period, investors will receive up to 90 basis points in new units. Payments related to this began in fiscal 2009 for the applicable funds. AGF capped the AGF elements Advantage feature on its elements products to new purchases effective June 22, 2009. eligible units purchased prior to June 22, 2009 have been grandfathered. the estimated liability as at november 30, 2014 is $3.5 million, compared to $3.7 million in 2013.
▪ We have allocated $150.0 million under the alternative asset management platform over the next two to three years, subject to certain conditions being achieved. As at november 30, 2014, we have committed $50.0 million to Stream, of which we have funded $16.6 million.
Intercompany and Related party TransactionsUnder iFRS, entities are deemed to be related parties if one entity provides key management personnel services to another entity. As such, AGF investments inc. is deemed for iFRS purposes to be a related party to AGF Funds (the Funds) since it is the manager of the Funds.
the Company receives management and advisory fees from the AGF Funds in accordance with the respective agreements between the Funds and the Company. in return, the Company is responsible for management and investment advisory services and all costs connected with the distribution of securities of the Funds. Substantially all the management and advisory fees the Company earned in the years ended november 30, 2014 and 2013 were from the AGF Funds. As at november 30, 2014, the Company had $19.4 million (2013 – $27.1 million) receivable from the AGF Funds. the Company also acts as trustee for the AGF Funds that are mutual fund trusts.
the aggregate unitholder services costs absorbed and management and advisory fees waived by the Company during the year ended november 30, 2014 on behalf of the Funds were approximately $3.8 million (2013 – $9.8 million).
Table of Contents

Capital management Activities from Continuing operationsWe actively manage our capital to maintain a strong and efficient capital base to maximize risk-adjusted returns to shareholders, to invest in future growth opportunities, including acquisitions, and to ensure that the regulatory capital requirements are met for each of our subsidiary companies.
AGF capital consists of shareholders’ equity and long-term debt. On an annual basis, AGF prepares a three-year plan detailing projected operating budgets and capital requirements. AGF is required to prepare and submit a three-year operating plan and budget to AGF’s Finance Committee for approval prior to seeking Board approval. AGF’s Finance Committee consists of the Chairman and CeO; the vice-Chairman, executive vice-President and CFO; the executive vice-President and Chief Operating Officer; and President and CiO. Once approved by the Finance Committee, the three-year plans are reviewed and approved by AGF’s Board of directors. these plans become the basis for the payment of dividends to shareholders, the repurchase of Class B non-voting shares and, combined with the reasonable use of leverage, the source of funds for expansion through organic growth and strategic investments.
Investment management operations – Regulatory CapitalA significant objective of the Capital Management program is to ensure regulatory requirements are met for capital. Our investment Management businesses, in general, are not subject to significant regulatory capital requirements in each of the jurisdictions in which they are registered and operate. the cumulative amount of minimum regulatory capital across all of our investment Management Operations is approximately $6.0 million.
normal Course Issuer bidAGF has obtained applicable regulatory approval to purchase for cancellation, from time to time, certain of its Class B non-voting shares through the facilities of the toronto Stock exchange (tSX). AGF relies on an automatic purchase plan during the normal course issuer bid. the automatic purchase plan allows for purchases by AGF of its Class B non-voting shares during certain pre-determined black-out periods, subject to certain parameters. Outside of these pre-determined black-out periods, shares will be purchased in accordance with management’s discretion. Under its normal course issuer bid, the Class B non-voting shares may be repurchased from time to time at prevailing market prices or such other price as may be permitted by the tSX. AGF may purchase up to 6,904,647 Class B non-voting shares, or 10% of the public float for such shares, through the facilities of the tSX (or as otherwise permitted by the tSX) between February 4, 2014 and February 3, 2015. Subject to regulatory approval, the Company will apply for renewal of its normal course issuer bid in 2015.
during the year ended november 30, 2014, under the previous normal course issuer bid, 1,762,200 Class B non-voting shares were repurchased for a total consideration of $22.1 million at an average price of $12.55.
during the year ended november 30, 2014, under the current normal course issuer bid, 470,000 Class B non-voting shares were purchased for the employee benefit trust for a total consideration of $5.4 million at an average price of $11.57 per share. For additional information see note 3.14 of the consolidated financial statements.
dividendsthe holders of Class B non-voting and Class A voting common shares are entitled to receive cash dividends. dividends are paid in equal amounts per share on all the Class B non-voting shares and all the Class A voting common shares at the time outstanding without preference or priority of one share over another. no dividends may be declared in the event that there is a default of a condition of our revolving loan or acquisition facilities or where such payment of dividends would create a default.
Our Board of directors may determine that Class B non-voting shareholders shall have the right to elect to receive part or all of such dividend in the form of a stock dividend. they also determine whether a dividend in Class B non-voting shares is substantially equal to a cash dividend. this determination is based on the weighted average price at which the Class B non-voting shares traded on the tSX during the 10 trading days immediately preceding the record date applicable to such dividend.
Management’s discussion and analysis of f inancial condition and results of operations
32 AGF Management Limited
Table of Contents

AGF Management Limited 33
the following table sets forth the dividends paid by AGF on Class B non-voting shares and Class A voting common shares for the years indicated:
years ended november 30 20141 2013 2012 2011 2010
Per share $ 1.08 $ 1.08 $ 1.08 $ 1.07 $ 1.04
1 Represents the total dividends paid in April 2014, July 2014, October 2014 and January 2015.
We review our dividend distribution policy on a quarterly basis, taking into account our financial position, profitability, cash flow and other factors considered relevant by our Board of directors. the quarterly dividend paid on January 16, 2015 was $0.27 per share. On december 9, 2014, we announced a change in our capital allocation strategy that will result in retained capital being deployed to initiatives with greater potential to increase shareholder value. As part of this strategy, the Company announced an intention to adjust the quarterly dividend to $0.08 per share on both the Class B non-voting shares and the Class A voting common shares for the first quarter of 2015. this change in strategy will provide us with increased flexibility to execute our growth strategy and invest in the growth of the business, while being active in AGF’s share buyback program.
outstanding share data
Set out below is our outstanding share data as at november 30, 2014 and 2013. For additional detail, see note 13 and note 18 of the Consolidated Financial Statements.
years ended november 30 2014 2013
Shares
Class A voting common shares 57,600 57,600
Class B non-voting shares 85,703,751 87,091,646
Stock Options
Outstanding options 4,428,542 4,823,331
exercisable options 2,251,917 2,617,243
key performance Indicators, Additional IFRs and non-IFRs measuresWe measure the success of our business strategies using a number of KPis, which are outlined below. With the exception of revenue, the following KPis are non-iFRS measures, which are not defined under iFRS. they should not be considered as an alternative to net income attributable to equity owners of the Company or any other measure of performance under iFRS.
Revenue Revenue is a measurement defined by iFRS and is recorded net of fee rebates and sales taxes. Revenue is indicative of our potential to deliver cash flow.
We derive our revenue principally from a combination of:
▪ management and advisory fees based on AUM
▪ dSC earned from investors when mutual fund securities sold on a dSC basis are redeemed
▪ 32.0% equity interest in S&WHL, and
▪ equity interest in instarAGF
Table of Contents

ebITdAWe define eBitdA from continuing operations as earnings before interest, taxes, depreciation and amortization and impairment of goodwill and management contracts. eBitdA is a standard measure used in the mutual fund industry by management, investors and investment analysts to understand and compare results. We believe this is an important measure as it allows us to assess our investment management businesses without the impact of non-operational items.
Please see the Consolidated Operating Results section on page 24 of this Md&A for a schedule showing how eBitdA reconciles to our iFRS financial statements.
Free Cash Flow Free cash flow from continuing operations represents cash available for distribution to our shareholders, share buybacks and general corporate purposes. We define free cash flow from continuing operations as cash flow from operations before net changes in non-cash balances related to operations less interest paid and adjusted to exclude prior years’ cash taxes paid or refunded and include anticipated cash taxes to be paid or refunded related to the current year continuing operations. Free cash flow for 2014 has been normalized to exclude taxes paid related to the transfer pricing audit. Free cash flow is a relevant measure in the investment management business since a substantial amount of cash is spent on upfront commission payments.
(in millions of Canadian dollars) years ended november 30 2014 2013
net cash provided by continuing operating activities $ 43.1 $ 121.1
Adjusted for:
net changes in non-cash working capital balances related to continuing operations 13.9 (5.7)
taxes paid related to transfer pricing audit 39.5 –
interest paid (11.8) (11.7)
Prior years’ cash taxes paid (refunded) and anticipated cash taxes to be refunded (paid) related to the current year continuing operations (1.9) (1.4)
Free cash flow $ 82.8 $ 102.3
ebITdA margineBitdA margin provides useful information to management and investors as an indicator of our overall operating performance. We believe eBitdA margin is a valuable measure because it assesses the extent we are able to earn profit from each dollar of revenue. We define eBitdA margin as the ratio of eBitdA to revenue.
(in millions of Canadian dollars) years ended november 30 2014 2013
eBitdA $ 154.9 $ 163.6
divided by revenue 464.5 484.5
eBitdA margin 33.3% 33.8%
pre-tax profit marginPre-tax profit margin provides useful information to management and investors as an indicator of our overall operating performance. We believe pre-tax profit margin is a valuable measure because it assesses the extent we are able to earn profit from each dollar of revenue. We define pre-tax profit margin as the ratio of income before taxes to revenue.
Management’s discussion and analysis of f inancial condition and results of operations
34 AGF Management Limited
Table of Contents

AGF Management Limited 35
(in millions of Canadian dollars) years ended november 30 2014 2013
net income from continuing operations $ 59.1 $ 22.4
Add: income taxes 20.0 43.6
income before taxes $ 79.1 $ 66.0
divided by revenue 464.5 484.5
Pre-tax profit margin 17.0% 13.6%
Return on equity (Roe) We monitor ROe to assess the profitability of the consolidated Company on an annual basis. We calculate ROe by dividing net income (loss) attributable to equity owners of the Company by average shareholders’ equity.
(in millions of Canadian dollars) years ended november 30 2014 2013
net income from continuing operations $ 59.1 $ 22.4
divided by average shareholders’ equity 948.0 1,010.5
Return on equity 6.2% 2.2%
long-term debt to ebITdA RatioLong-term debt to eBitdA ratio provides useful information to management and investors as an indicator of our ability to service our long-term debt. We define long-term debt to eBitdA ratio as long-term debt at the end of the period divided by annualized eBitdA for the period.
(in millions of Canadian dollars) years ended november 30 2014 2013
Long-term debt $ 308.2 $ 307.9
divided by eBitdA 154.9 163.6
Long-term debt to eBitdA ratio 199.0% 188.2%
Assets under managementthe amount of AUM and the related fee rates are important to our business as these are the drivers of our revenue from our mutual fund, institutional and sub-advisory accounts and high-net-worth relationships. AUM will fluctuate in value as a result of investment performance, sales and redemptions. Mutual fund sales and AUM determine a significant portion of our expenses because we pay upfront commissions on gross sales and trailing commissions to financial advisors as well as investment advisory fees based on the value of AUM.
Investment performance investment performance, which represents market appreciation (depreciation) of fund portfolios and is shown net of management fees received, is a key driver of the level of AUM and is central to the value proposition that we offer advisors and unitholders. Growth in AUM resulting from investment performance increases the wealth of our unitholders, and, in turn, we benefit from higher revenues. Alternatively, poor investment performance will reduce our AUM levels and result in lower management fee revenues. Strong relative investment performance may also contribute to growth in gross sales or reduced levels of redemptions. Conversely, poor relative investment performance may result in lower gross sales and higher levels of redemptions. Refer to the ‘Risk Factors and Management of Risk’ section of this report for further information.
net sales (Redemptions)Gross sales and redemptions are monitored separately and the sum of these two amounts comprises net sales (redemptions). net sales (redemptions), together with investment performance and fund expenses, determine the level of average daily retail fund AUM, which is the basis on which management fees are charged. the average daily retail fund
Table of Contents

AUM is equal to the aggregate average daily net asset value of the AGF retail funds. We monitor AUM in our institutional, sub-advisory and high-net-worth businesses separately. We do not compute an average daily retail fund AUM figure for them.
ebITdA margin (excluding share of profit of Associates and Joint ventures)eBitdA margin provides useful information to management and investors as an indicator of our operating performance in our investment Management Operations, excluding share of profit of associated company and joint ventures. We believe eBitdA margin is a valuable measure because it assesses the extent we are able to earn profit from each dollar of revenue. We define eBitdA margin as the ratio of eBitdA to revenue.
(in millions of Canadian dollars) years ended november 30 2014 2013
eBitdA $ 142.5 $ 154.3
divided by revenue 452.1 475.2
eBitdA margin (excluding share of profit of associates and joint ventures) 31.5% 32.5%
pre-tax profit margin (excluding share of profit of Associated Company)Pre-tax profit margin provides useful information to management and investors as an indicator of our operating performance in our investment Management Operations, excluding share of profit of associated company and joint ventures. We believe pre-tax profit margin is a valuable measure because it assesses the extent we are able to earn profit from each dollar of revenue. We define pre-tax profit margin as the ratio of income before taxes and non-segmented items to revenue.
(in millions of Canadian dollars) years ended november 30 2014 2013
income before taxes $ 66.7 $ 56.7
divided by revenue 452.1 475.2
Pre-tax profit margin (excluding share of profit of associates and joint ventures) 14.8% 11.9%
significant Accounting policies
Critical Accounting estimates and Judgements
the preparation of consolidated financial statements in conformity with iFRS requires management to make estimates and assumptions that affect the reported amounts of assets and liabilities and disclosures of contingent assets and liabilities at the date of the Consolidated Financial Statements and the reported amounts of revenue and expenses during the reporting period. Actual results could differ from these estimates. the estimates and underlying assumptions are reviewed on an ongoing basis. Revisions to accounting estimates are recognized in the period in which the estimate is revised if the revision affects only that period or in the period in which the estimate is revised if the revision affects both current and future periods.
Key areas of estimation where management has made difficult, complex or subjective judgements – often about matters that are inherently uncertain – include provision for useful lives of depreciable assets, commitments and contingencies, as well as the specific items discussed below.
(a) impairment of non-financial Assets
the Company determines the recoverability of each of its CGUs based on an analysis of the underlying AUM associated with the CGU and available AUM multiples from recent transactions for similar assets within the same industry. Such analysis involves management judgement in selecting the appropriate AUM multiple to be used in the assessment of the impairment of non-financial assets. Refer to note 8 of the consolidated financial statements for further details on the impairment of non-financial assets.
Management’s discussion and analysis of f inancial condition and results of operations
36 AGF Management Limited
Table of Contents
AGF Management Limited 37
(b) Stock-based Compensation and Other Stock-based Payments
in determining the fair value of stock-based rewards and the related charge to the consolidated statement of income, the Company makes assumptions about future events and market conditions. in particular, judgement must be formed as to the likely number of shares that will vest, and the fair value of each award granted. the fair value of stock options granted is determined using the Black-Scholes option-pricing model, which is dependent on further estimates, including the Company’s future dividend policy and the future volatility in the price of the Class B non-voting shares. Refer to note 18 of the Consolidated Financial Statements for the assumptions used. Such assumptions are based on publicly available information and reflect market expectation. different assumptions about these factors to those made by AGF could materially affect reported net income.
(c) income taxes
the Company is subject to income taxes in numerous jurisdictions. there are many transactions and calculations for which the ultimate tax determination is uncertain. AGF recognizes liabilities for anticipated tax audit issues based on estimates of whether additional taxes will be due. When the estimated outcome of these matters is different from the amounts that were recorded, such differences will impact the current and deferred income tax assets and liabilities in the period in which such determination is made. Refer to note 26 of the consolidated financial statements for further details.
(d) Critical Judgements in Applying the Company’s Accounting Policies
the application of the Company’s accounting policies may require management to make judgements, apart from those involving estimates, that can affect the amounts recognized in the consolidated financial statements. Such judgements include the determination of whether intangible assets have finite or indefinite lives, the accounting implications related to certain legal matters. in addition, judgement was applied in determining the recognition and measurement of the provision related to the put option liability for loans related to AGF trust Company (AGF trust). Refer to note 6 of the consolidated financial statements for further details.
Risk Factors and management of Risk Risk is the responsibility of the executive Management Committee. the executive Management Committee is made up of the Chairman and Chief executive Officer (CeO); the Chief Financial Officer (CFO); the Chief Operating Officer; the Chief investment Officer (CiO); the Chief information Officer; and the Head of Marketing, Product and Retail. the Chairman and CeO is directly accountable to the Board of directors for all risk-related activities. the executive Management Committee reviews and discusses significant risks that arise in developing and executing the enterprise-wide strategy and ensures risk oversight and governance at the most senior levels of management. each of the business units and shared services owns and assumes responsibility for managing its risk. they do this by ensuring that policies, processes and internal controls are in place and by escalating significant risks identified in the business units to the executive Management Committee.
AGF operates an enterprise Risk Management (eRM) program. Key risks are identified and evaluated by senior management. Plans for addressing the key risks are developed by management and agreed to and monitored by the executive Management Committee. the Board of directors receives a quarterly report on eRM.
AGF’s risk governance structure is designed to balance risk and reward and to promote business activities consistent with our standards and risk tolerance levels, with the objective of maximizing long-term shareholder value.
Risk Factors That may Affect Future Results
there are many factors that may affect our ability to execute against our strategy. Some of these factors are within our control and others, because of their nature, are beyond our control. these factors apply to our corporate strategy as well as business-specific strategies, which are included in the segment discussions that follow.
Table of Contents

performance and sales Risk
demand for our products depends on the ability of our investment management team to deliver value in the form of strong investment returns, as well as the demand for specific investment products. this is a relative as well as an absolute measure, because the risk is that AGF may not perform as well as the market or its peers, or in line with our clients’ expectations. A specific fund manager’s style may fall out of favour with the market, resulting in lower sales and/or higher redemptions.
Our future financial performance will be influenced by our ability to successfully execute our strategy and generate net sales. if sales do not materialize as planned or key personnel cannot be retained, margins may erode.
distribution Risk
Our retail AUM is obtained through third-party distribution channels including financial advisors or strategic partners that offer our products to investors along with similar products from our competitors. Our future success is dependent on continued access to these distribution channels that are independent of our company.
key personnel Risk
AGF’s success depends on its key personnel, and in particular senior management and portfolio managers. the investment management industry is highly competitive. Reliance on investment performance to sell financial products has increased the demand for experienced and high-performing portfolio managers. Compensation packages for these portfolio managers may increase at a rate well above the rates of increase observed in other industries. Losing key individuals or being unable to attract and retain such individuals could adversely affect AGF’s business. AGF believes it has the resources necessary to hire and retain its key personnel.
General market Risk
A general economic downturn, market volatility and an overall lack of investor confidence could result in lower sales, higher redemption levels and lower AUM levels. in addition, market uncertainty could result in retail investors avoiding traditional equity funds in favour of money market funds.
Industry Competition Risk
the level of competition in the industry is high, driven by factors including product variety, brand recognition, investment performance, management, sales and distribution relationships, fee and commission rates and other compensation matters. Sales and redemptions of mutual funds may be influenced by relative service levels, management fees, attributes of specific products in the marketplace and actions taken by competitors. AGF’s competition includes other mutual fund companies, investment management firms, banks and insurance companies, some of whom have greater resources than AGF. the investment management industry’s trend towards consolidation has increased the strength of some of AGF’s competitors. While AGF continues to develop new products and explore new opportunities, there can be no assurance that AGF will maintain its current standing or market share. this may adversely affect AGF’s business, financial condition and operating results.
Regulatory and legal Risk
AGF conducts its business in Canada and abroad and is subject to extensive and changing legal, taxation and regulatory requirements. the governments and other regulatory bodies in the jurisdictions where we conduct our business regularly adopt new laws, rules, regulations and policies that apply to AGF. these requirements include those that apply to AGF Management Limited as a publicly traded company and those that apply to AGF’s subsidiaries based on the nature of their activities. they include regulations related to capital markets, the provision of financial products and services, including fund management and discretionary managed accounts and their sale and distribution, and other activities carried on by AGF in the markets in which it operates. the current environment of heightened regulatory scrutiny in the financial
Management’s discussion and analysis of f inancial condition and results of operations
38 AGF Management Limited
Table of Contents

AGF Management Limited 39
services sector may reasonably be expected to lead to increasingly stringent interpretation and enforcement of existing laws and rules or additional regulations, changes in existing laws and rules, or changes in interpretation or enforcement of existing laws and rules. Regulatory developments may also impact product structures, pricing and dealer and advisor compensation. While AGF actively monitor such initiatives, and where feasible comments upon or discusses them with regulators, the ability of AGF to mitigate the imposition of differential regulatory treatment of financial products or services is limited. AGF and its subsidiaries are also subject to regulatory reviews as part of the normal ongoing process of oversight by the various regulators. See the ‘Government Regulations’ section for further details.
We take all reasonable measures to ensure compliance with governing statutes, regulations and regulatory policies, however such changes may affect directly the method of operation and profitability of AGF or may have a material adverse effect on our financial results and financial condition. Failure to comply with statutes, regulations or regulatory policies could result in sanctions or fines that could adversely affect earnings and reputation.
AGF may, in the normal course of its business operations, be subject to claims or complaints from time to time from investors or others. these claims or complaints involve legal risks for AGF, its directors, officers, employees and agents, including potential liability for violations of securities laws, breach of fiduciary duty and misuse of investors’ funds. Certain violations or breaches could lead to civil liability, fines or sanctions. AGF may incur significant costs in connection with such potential liabilities.
strategic Transactions Risk
Our strategy includes strategic acquisitions and investments in associates, joint ventures and limited partnerships. there is no assurance that we will be able to complete acquisitions on the terms and conditions that satisfy our investment criteria. After transactions are completed, meeting target return objectives is contingent upon many factors, including retaining key employees and growth in AUM of the acquired companies.
Our strategic investments may involve risks and uncertainties including, but not limited to, our dependency on partners and co-venturers that are not under our control and that might become bankrupt or otherwise fail to fund their share of required capital contributions, or suffer reputational damage that could have an adverse impact on us. We do not have sole control over certain major decisions relating to these assets and businesses, which could affect our future returns on these investments.
the success of our strategic investments, including infrastructure investments, may be influenced by government and economic regulations, capital expenditure requirements, performance under customer or client contracts, general economic conditions and other material disruptions that may be outside our control such as weather conditions, natural disasters, major accidents, acts of malicious destruction, sabotage and terrorism.
market Risk in Assets under management
AUM is exposed to various market risks, including changes in equity prices, interest rates and foreign exchange rates. these risks transfer to the Company as our management fee revenue is calculated as a percentage of the average net asset value of each retail fund or portfolio managed. the Company does not quantify these risks in isolation; however, in general, for every $1.0 billion reduction of retail fund AUM, management fee revenues would decline by approximately $18.8 million. the Company monitors these risks as they may impact earnings; however, it is at the discretion of the fund manager to decide on the appropriate risk-mitigating strategies for each fund.
Table of Contents

to provide additional details on the Company’s exposure to these market risks, the following provides further information on our retail fund AUM by asset type as at november 30:
Percentage of total retail fund AUM 2014 2013
domestic equity funds 16.1% 17.6%
U.S. and international equity funds 46.0% 42.7%
domestic balanced funds 15.1% 15.9%
U.S. and international balanced funds 2.5% 2.6%
domestic fixed-income funds 12.1% 13.0%
U.S. and international fixed-income funds 7.2% 7.0%
domestic money market 1.0% 1.2%
100.0% 100.0%
institutional and high-net-worth AUM are exposed to the same market risks as retail fund AUM. in general, for every $1.0 billion reduction of institutional and high-net-worth AUM, management fee revenues would decline by approximately $4.3 million.
price Risk
AGF is exposed to equity securities price risk on certain equity securities held by AGF, on certain derivative positions and on long-term investments in infrastructure funds. the Company’s investments that have price risk include seed capital investments in mutual funds managed by AGF investments inc. and equity securities.
Foreign exchange Risk
Our main foreign exchange risk derives from the U.S. and international portfolio securities held in the retail fund AUM. Change in the value of the Canadian dollar relative to foreign currencies will cause fluctuations in the Canadian-dollar value of non-Canadian AUM upon which our management fees are calculated. this risk is monitored since currency fluctuation may impact the financial results of AGF; however, it is at the discretion of the fund manager to decide whether to enter into foreign exchange contracts to hedge foreign exposure on U.S. and international securities held in funds.
We are subject to foreign exchange risk on our integrated foreign subsidiaries in the United States, ireland and Singapore, which provide investment advisory services. these subsidiaries retain minimal monetary exposure to the local currency and their revenues are calculated in Canadian dollars. the local currency expenses are translated at the average monthly rate, and local currency assets and liabilities are translated at the rate of exchange in effect at the balance sheet date.
the Company is exposed to foreign exchange risks through its equity interest in S&WHL, which is denominated in UK pounds. the investment is translated into Canadian dollars at the rate of exchange in effect at the balance sheet date. Unrealized translation gains and losses are reported in other comprehensive income. Based on the carrying value at november 30, 2014, a 5% change in the value of the Canadian dollar versus the UK pound would result in a change in other comprehensive income of $4.3 million.
Interest Rate Risk
AGF has exposure to the risk related to changes in interest rates on floating-rate debt and cash balances at november 30, 2014. Using average balances for the year, the effect of a 1% change in variable interest rates on our floating-rate debt and cash balances in fiscal 2014 would have resulted in a corresponding change of approximately $1.9 million in interest expense for the year ended november 30, 2014.
Management’s discussion and analysis of f inancial condition and results of operations
40 AGF Management Limited
Table of Contents

AGF Management Limited 41
Credit Risk
AGF is exposed to the risk that third parties, including clients, who owe AGF money, securities or other assets will not perform their obligations. AGF’s overall credit risk strategy and credit risk policy are developed by senior management and further refined at the business unit level, through the use of policies, processes and internal controls designed to promote business activities, while ensuring these activities are within the standards of risk tolerance levels. AGF does not have a significant exposure to any individual counterparty.
liquidity Risk
Liquidity risk is the risk that AGF may not be able to generate sufficient funds and within the time required to meet its obligations as they come due. the key liquidity requirements are the funding of commissions paid on mutual funds, dividends paid to shareholders, obligations to taxation authorities, investment-related commitments and the repayment of its long-term debt. While AGF currently has access to financing, unfavourable market conditions may affect its ability to obtain loans or make other arrangements on terms acceptable to AGF. AGF manages its liquidity by monitoring actual and projected cash flows to ensure that it has sufficient liquidity through cash received from operations as well as borrowings under its revolving credit facility. Cash surpluses are invested in interest-bearing short-term deposits and investments with a maturity up to 90 days. AGF is subject to certain financial loan covenants under its revolving credit facility and has met all of these conditions.
operational Risk
Operational risk is related to the processes and systems that support AGF’s business, including administration, information technology, product development and marketing. Problems or errors with these processes and systems may impact AGF’s ability to provide such operational services. AGF may also experience losses in connection with employee errors. Although AGF’s expenses in connection with employee errors have not been significant in the past, there can be no assurances that these expenses will not increase in the future.
the Company outsources its fund administration function to Citigroup Fund Services inc. pursuant to a contract that expires in October 2015. non-renewal of this contract would require the Company to transition the services, which could lead to operational and business disruption, as well as a potential negative financial impact.
Taxation Risk
AGF is subject to various uncertainties concerning the interpretation and application of Canadian tax laws. if tax authorities disagree with AGF’s application of such tax laws, AGF’s profitability and cash flows could be adversely affected. AGF is considered a large case file by the Canada Revenue Agency, and as such, is subject to audit each year. there is a significant lag between the end of a fiscal year and when such audits are completed. therefore, at any given time, several years may be open for audit, which may result in an adjustment.
the foregoing discussion is not an exhaustive list of all risks and uncertainties regarding our ability to execute against our strategy. Readers are cautioned to consider other potential risk factors when assessing our ability to execute against our strategy.
Table of Contents
Controls and procedures
disclosure Controls and procedures
disclosure controls and procedures are designed to provide reasonable assurance that information required to be disclosed by AGF Management Limited in reports filed or submitted under Canadian securities laws is recorded, processed, summarized and reported within the time periods specified under those laws and include controls and procedures that are designed to ensure that information is accumulated and communicated to management, including the CeO and CFO, to allow timely decisions regarding required disclosure.
AGF Management Limited’s management, under the direction of the CeO and CFO, has evaluated the effectiveness of AGF Management Limited’s disclosure controls and procedures (as defined in national instrument 52-109 of the Canadian Securities Commission) as at november 30, 2014, and has concluded that such disclosure controls and procedures were effective.
Internal Control over Financial Reporting
the CeO and CFO have designed, or caused to be designed under their supervision, internal controls over financial reporting to provide reasonable assurance regarding the reliability of financial reporting and the preparation of financial statements for external purposes in accordance with iFRS.
the Company’s internal control over financial reporting includes policies and procedures that:
▪ Pertain to the maintenance of records that, in reasonable detail, accurately and fairly reflect transactions and dispositions of the Company;
▪ Provide reasonable assurance that transactions are recorded as necessary to permit preparation of financial statements in accordance with iFRS, and receipts and expenditures of the Company are made only in accordance with authorizations of management and directors of the Company; and
▪ Provide reasonable assurance regarding prevention or timely detection of unauthorized acquisition, use or disposition of the Company’s assets that could have a material effect on the financial statements.
internal control systems, no matter how well designed, have inherent limitations. therefore, even those systems determined to be designed effectively can provide only reasonable assurance with respect to financial reporting and financial statement preparation.
Management, under the direction of the CeO and CFO, has evaluated the effectiveness of the Company’s internal control over financial reporting as at november 30, 2014, and has concluded that internal control over financial reporting is designed and operating effectively to provide reasonable assurance regarding the reliability of financial reporting and the preparation of financial statements for external purposes in accordance with iFRS. Management’s assessment was based on the framework established in internal Control – integrated Framework (1992) issued by the Committee of Sponsoring Organizations of the treadway Commission.
Changes in Internal Controls over Financial Reporting
there have been no changes in AGF Management Limited’s internal control over financial reporting during the year ended november 30, 2014 that have materially affected, or are reasonably likely to materially affect, our internal control over financial reporting.
Changes in Information Technology systems
during 2014, there were no significant changes to information technology Systems.
Management’s discussion and analysis of f inancial condition and results of operations
42 AGF Management Limited
Table of Contents

AGF Management Limited 43
Government Regulations
AGF management limited
AGF Management Limited (AGF) is incorporated under the laws of the Province of Ontario and is a reporting issuer in each province and territory of Canada. Accordingly, AGF is subject to applicable securities laws in each jurisdiction. in addition, the Class B non-voting common shares of AGF are listed for trading on the toronto Stock exchange under the trading symbol AGF.B. AGF is also subject to oversight from other government and regulatory agencies.
AGF mutual Funds to qualify for continuous distribution, each of the mutual funds managed by AGF investments inc. (AGFi) must file each year a simplified prospectus, annual information form and fund facts document (per series) in every province and territory of Canada in which it intends to distribute securities. it must also obtain a receipt for the same from provincial and territorial securities regulatory authorities.
each mutual fund is managed by AGFi and as such AGFi is liable for any misrepresentation in the offering documents of the funds. Pursuant to securities legislation in certain of the provinces and territories of Canada, none of the mutual funds managed by AGFi can make portfolio investments in substantial security holders of the funds, in AGF or in corporations in which the directors or officers of the funds, or their substantial security holders, have a significant interest.
AGF Investments Inc.AGFi is registered with the Ontario Securities Commission (OSC) as a portfolio manager and investment fund manager and maintains equivalent registrations in each of the other provinces and territories of Canada in which AGFi carries on business. AGFi is also registered as a Mutual Fund dealer, exempt Market dealer and Commodity trading Manager in certain jurisdictions and is subject to oversight by the federal and provincial Privacy Commissions and Financial transactions and Reports Analysis Centre of Canada (FintRAC). AGFi also maintains appropriate registrations in dublin, ireland to allow it to promote and distribute its self-managed UCitS, including obtaining ‘passport’ registrations in other european jurisdictions for its distribution in other european jurisdictions. in its capacity as portfolio manager and investment fund manager, AGFi is subject to conflict of interest provisions pursuant to the Securities Act (Ontario), national instrument 31-103 and certain other provincial and territorial securities legislation. Amongst other things, these provisions impose limitations on the ability of AGFi to advise or make recommendations with respect to its own securities or securities of a related or connected issuer. AGFi is also subject to certain restrictions that are imposed by applicable provincial and territorial securities legislation on advertising and sales incentives.
AGF International Advisors Company limitedAGF international Advisors Company Ltd. is incorporated under the laws of the Republic of ireland and is authorized by the Central Bank of ireland (Bank of ireland), under Regulation 11 of the european Communities (Markets in Financial instruments) Regulations 2007, to provide a range of financial services including the provision of investment advice and the managing of portfolios. As an authorized entity, AGF international Advisors Company Ltd. is subject to a range of irish and eU regulations. AGF international Advisors Company Ltd. also holds an Australian Financial Services Licence granted by the Australian Securities & investments Commission (ASiC) and is subject to the relevant ongoing requirements of this licence.
AGFIA limitedAGFiA Limited is a private limited company incorporated under the laws of the Republic of ireland and is authorized by the Bank of ireland, under Regulation 11 of the european Communities (Markets in Financial instruments) Regulations 2007, to provide a range of financial services including the provision of investment advice and the managing of portfolios, primarily to institutional accounts. As an authorized entity, AGFiA Limited is subject to a range of irish and eU regulations. AGFiA Limited is registered with the OSC as a non-resident portfolio manager and maintains equivalent registrations in each of the other provinces and territories of Canada in which AGFiA carries on business.
Table of Contents
AGF Asset management Asia limitedAGF Asset Management Asia Ltd. provides investment research and advisory services on Asian ex-Japan markets for AGF mutual funds and other clients. AGF Asset Management Asia Ltd. is regulated by the Monetary Authority of Singapore (MAS) under the Securities and Futures Act. the company holds a Capital Markets Services licence, which permits it to offer fund management services to accredited and institutional investors. AGF Asset Management Asia Ltd. is required to obtain the prior approval of MAS for any significant change of its members or shareholdings of its members.
AGF Investments America Inc.AGF investments America inc. (AGFA) is registered with the U.S. Securities and exchange Commission as an Adviser and provides investment management services to (U.S.) institutional clients.
Acuity Investment management Inc.Acuity investment Management inc. (AiMi) is registered with the OSC as a portfolio manager and maintains equivalent registration in each of the other provinces in Canada in which it does business. AiMi is also subject to oversight by federal and provincial Privacy Commissions and FintRAC.
highstreet Asset management Inc.Highstreet Asset Management inc. (Highstreet) is registered with the OSC as a portfolio manager and maintains equivalent registrations in each of the other provinces and territories of Canada in which it does business. Highstreet is also registered with the OSC as an exempt market dealer for the purpose of facilitating the distribution of certain pooled fund securities to clients and is subject to oversight by federal and provincial Privacy Commissions and FintRAC. in addition, Highstreet is registered in Ontario as a Commodity trading Manager.
Cypress Capital management limitedCypress Capital Management Ltd. (Cypress) is registered with the British Columbia Securities Commission as a portfolio manager and maintains equivalent registrations in each of the other provinces and territories of Canada in which it does business. Cypress is also subject to oversight by federal and provincial Privacy Commissions and FintRAC.
Cypress Capital management us limitedCypress Capital Management US Limited (Cypress US) is a wholly owned subsidiary of Cypress and is registered with the U.S. Securities and exchange Commission as an Adviser. Cypress US provides investment management services to (U.S.) high-net-worth, corporate, endowment and foundation clients.
doherty & Associates limited doherty & Associates Ltd. (doherty) is registered with the OSC as a portfolio manager and maintains equivalent registrations in each of the other provinces and territories of Canada in which it does business. doherty is also registered with the OSC as an exempt market dealer for the purpose of facilitating the distribution of certain securities to its clients and is subject to oversight by federal and provincial Privacy Commissions and FintRAC.
AGF securities (Canada) limitedAGF Securities (Canada) Limited is a member of the investment industry Regulatory Organization of Canada (iiROC). AGF Securities (Canada) Limited is registered as an investment dealer with the securities regulatory authorities in each of Alberta, British Columbia, Ontario and Saskatchewan and is registered as a type 3 non-advising introducing broker. AGF Securities (Canada) Limited is also a member of the Canadian investor Protection Fund and is subject to oversight by federal and provincial Privacy Commissions and FintRAC.
Management’s discussion and analysis of f inancial condition and results of operations
44 AGF Management Limited
Table of Contents

AGF Management Limited 45
Fourth quarter Analysis
Assets under management
the following table illustrates the composition of the changes in retail fund AUM during the three months ended november 30, 2014 and 2013:
(in millions of Canadian dollars) three months ended november 30 2014 2013 % change
Retail fund AUM (including retail pooled funds), beginning of period $ 19,905 $ 18,918 5.2%
Gross sales 494 443 11.5%
Redemptions (893) (1,044) (14.5%)
net redemptions (399) (601) (33.6%)
Market appreciation (depreciation) of fund portfolios (397) 1,274 n/m
Retail fund AUM (including retail pooled funds), end of period $ 19,109 $ 19,591 (2.5%)
Average daily retail fund AUM for the period $ 19,174 $ 19,360 (1.0%)
institutional and sub-advisory accounts AUM, beginning of period $ 12,410 $ 13,829 (10.3%)
net change in institutional and sub-advisory accounts, including market performance $ (1,068) $ (2,952) (63.8%)
institutional and sub-advisory accounts AUM, end of period $ 11,342 $ 10,877 4.3%
High-net-worth AUM $ 4,448 $ 3,967 12.1%
AUM, end of period $ 34,899 $ 34,435 1.3%
Alternative asset management platform AUM1 $ 210 $ – n/m
total AUM, including alternative asset management platform, end of period $ 35,109 $ 34,435 2.0%
1 Represents fee-earning committed capital from AGF and external investors held through joint ventures. AGF’s portion of this commitment is $50.0 million, of which
$16.6 million has been funded as at november 30, 2014. instarAGF holds a 37.0% interest in the manager of the fund.
Table of Contents
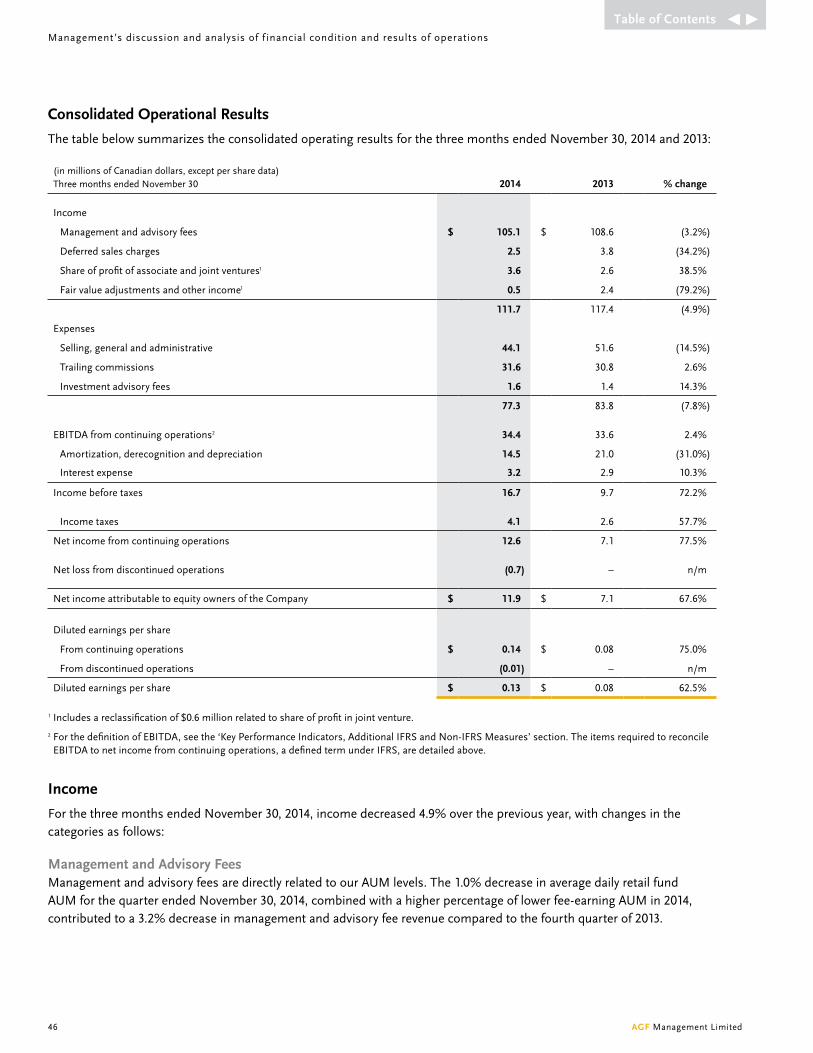
Consolidated operational Results
the table below summarizes the consolidated operating results for the three months ended november 30, 2014 and 2013:
(in millions of Canadian dollars, except per share data) three months ended november 30 2014 2013 % change
income
Management and advisory fees $ 105.1 $ 108.6 (3.2%)
deferred sales charges 2.5 3.8 (34.2%)
Share of profit of associate and joint ventures1 3.6 2.6 38.5%
Fair value adjustments and other income1 0.5 2.4 (79.2%)
111.7 117.4 (4.9%)
expenses
Selling, general and administrative 44.1 51.6 (14.5%)
trailing commissions 31.6 30.8 2.6%
investment advisory fees 1.6 1.4 14.3%
77.3 83.8 (7.8%)
eBitdA from continuing operations2 34.4 33.6 2.4%
Amortization, derecognition and depreciation 14.5 21.0 (31.0%)
interest expense 3.2 2.9 10.3%
income before taxes 16.7 9.7 72.2%
income taxes 4.1 2.6 57.7%
net income from continuing operations 12.6 7.1 77.5%
net loss from discontinued operations (0.7) – n/m
net income attributable to equity owners of the Company $ 11.9 $ 7.1 67.6%
diluted earnings per share
From continuing operations $ 0.14 $ 0.08 75.0%
From discontinued operations (0.01) – n/m
diluted earnings per share $ 0.13 $ 0.08 62.5%
1 includes a reclassification of $0.6 million related to share of profit in joint venture.
2 For the definition of eBitdA, see the ‘Key Performance indicators, Additional iFRS and non-iFRS Measures’ section. the items required to reconcile eBitdA to net income from continuing operations, a defined term under iFRS, are detailed above.
Income
For the three months ended november 30, 2014, income decreased 4.9% over the previous year, with changes in the categories as follows:
management and Advisory FeesManagement and advisory fees are directly related to our AUM levels. the 1.0% decrease in average daily retail fund AUM for the quarter ended november 30, 2014, combined with a higher percentage of lower fee-earning AUM in 2014, contributed to a 3.2% decrease in management and advisory fee revenue compared to the fourth quarter of 2013.
Management’s discussion and analysis of f inancial condition and results of operations
46 AGF Management Limited
Table of Contents
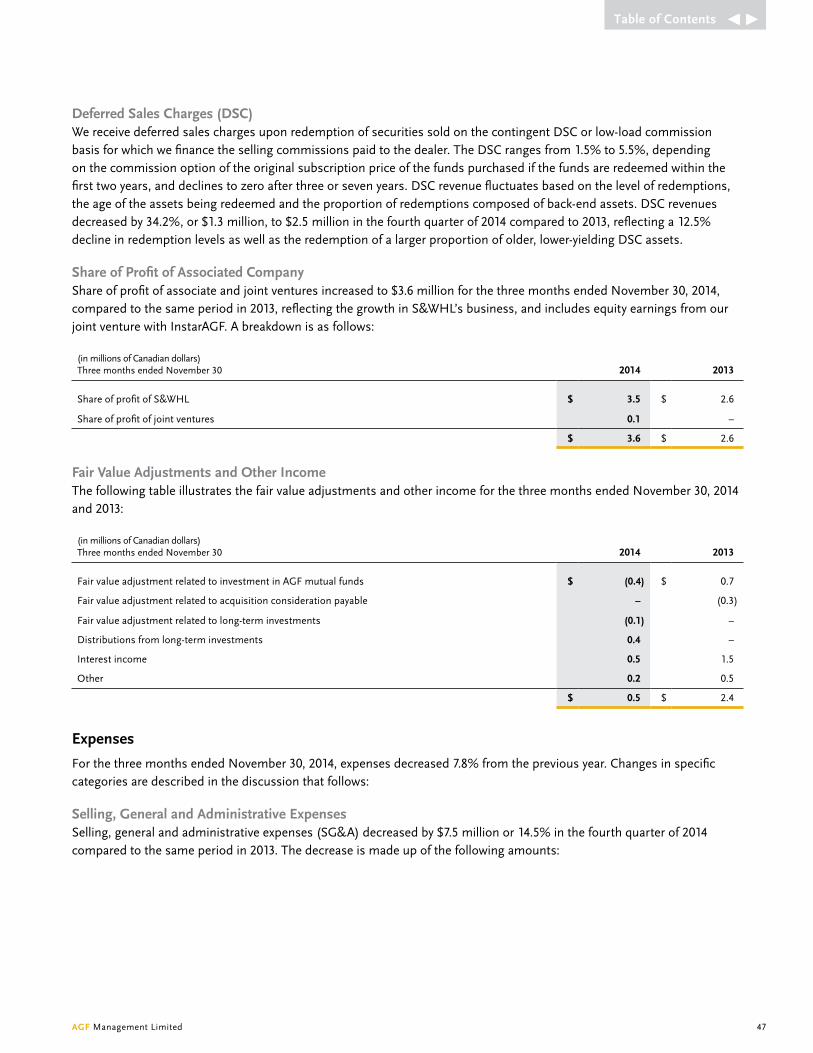
AGF Management Limited 47
deferred sales Charges (dsC)We receive deferred sales charges upon redemption of securities sold on the contingent dSC or low-load commission basis for which we finance the selling commissions paid to the dealer. the dSC ranges from 1.5% to 5.5%, depending on the commission option of the original subscription price of the funds purchased if the funds are redeemed within the first two years, and declines to zero after three or seven years. dSC revenue fluctuates based on the level of redemptions, the age of the assets being redeemed and the proportion of redemptions composed of back-end assets. dSC revenues decreased by 34.2%, or $1.3 million, to $2.5 million in the fourth quarter of 2014 compared to 2013, reflecting a 12.5% decline in redemption levels as well as the redemption of a larger proportion of older, lower-yielding dSC assets.
share of profit of Associated CompanyShare of profit of associate and joint ventures increased to $3.6 million for the three months ended november 30, 2014, compared to the same period in 2013, reflecting the growth in S&WHL’s business, and includes equity earnings from our joint venture with instarAGF. A breakdown is as follows:
(in millions of Canadian dollars) three months ended november 30 2014 2013
Share of profit of S&WHL $ 3.5 $ 2.6
Share of profit of joint ventures 0.1 –
$ 3.6 $ 2.6
Fair value Adjustments and other Incomethe following table illustrates the fair value adjustments and other income for the three months ended november 30, 2014 and 2013:
(in millions of Canadian dollars) three months ended november 30 2014 2013
Fair value adjustment related to investment in AGF mutual funds $ (0.4) $ 0.7
Fair value adjustment related to acquisition consideration payable – (0.3)
Fair value adjustment related to long-term investments (0.1) –
distributions from long-term investments 0.4 –
interest income 0.5 1.5
Other 0.2 0.5
$ 0.5 $ 2.4
expenses
For the three months ended november 30, 2014, expenses decreased 7.8% from the previous year. Changes in specific categories are described in the discussion that follows:
selling, General and Administrative expensesSelling, general and administrative expenses (SG&A) decreased by $7.5 million or 14.5% in the fourth quarter of 2014 compared to the same period in 2013. the decrease is made up of the following amounts:
Table of Contents

(in millions of Canadian dollars) three months ended november 30 2014
decrease in salaries, benefits and restructuring and termination expenses $ (2.4)
decrease in stock-based compensation expenses (1.6)
decrease in fund absorption expenses and other fund costs (4.5)
increase in other expenses 1.0
$ (7.5)
the following explains expense changes in the three months ended november 30, 2014, compared to the same periods in the prior year:
▪ Salaries and benefits expenses decreased $2.4 million for the three months ended november 30, 2014, compared to the prior year, as a result of lower restructuring costs.
▪ Stock-based compensation decreased $1.6 million for the three months ended november 30, 2014, compared to the same period in 2013. this decrease is mainly attributable to a change in accounting as Restricted Share Units are no longer marked to market. the share price increased 12.1% in the fourth quarter of 2014, resulting in a higher expense. For additional information see note 3.14 of the consolidated financial statements.
▪ Fund administration expenses decreased $4.5 million for the three months ended november 30, 2014, as a result of an amendment on certain funds to replace management expense ratio (MeR) reductions with a management fee waiver, which is accounted for as an offset to revenue.
▪ Other expenses increased $1.0 million for the three months ended november 30, 2014, due to increased sales and marketing activity.
Trailing Commissionstrailing commissions paid to distribution depend on total AUM, the proportion of retail fund AUM sold on a front-end versus back-end commission basis and the proportion of equity fund AUM versus fixed-income fund AUM. Annualized trailing commissions as a percentage of average daily retail fund AUM were 0.66% for the three months ended november 30, 2014, compared to 0.64% in the same 2013 period, reflecting an increase in rates associated with mature assets.
Investment Advisory Feesexternal investment advisory fees increased to $1.6 million in the fourth quarter of 2014, compared to $1.4 million during the same period in 2013, reflecting the addition of certain externally managed funds combined with higher AUM levels.
ebITdA, ebITdA margin and ebITdA per share
eBitdA from continuing operations for the three months ended november 30, 2014 was $34.4 million, a 2.4% increase from $33.6 million for the same period in 2013. eBitdA margin was 30.8% for the fourth quarter of 2014, compared to 28.6% in 2013. diluted eBitdA per share from continuing operations for the three months ended november 30, 2014 was $0.40, compared to $0.39 for the three months ended november 30, 2013.
Amortization and Interest expensethe category represents amortization of deferred selling commissions, customer contracts, other intangible assets, property, equipment and computer software. deferred selling commission amortization represents the most significant category of amortization. We internally finance all selling commissions paid. the selling commissions are capitalized and amortized on a straight-line basis over a period that corresponds with their applicable dSC schedule. Amortization expense related to deferred selling commissions was $11.0 million in the fourth quarter of 2014, compared to $13.4 million in 2013.
For the three months ended november 30, 2014, we paid $8.6 million in selling commissions, compared to $8.0 million in 2013.
Management’s discussion and analysis of f inancial condition and results of operations
48 AGF Management Limited
Table of Contents
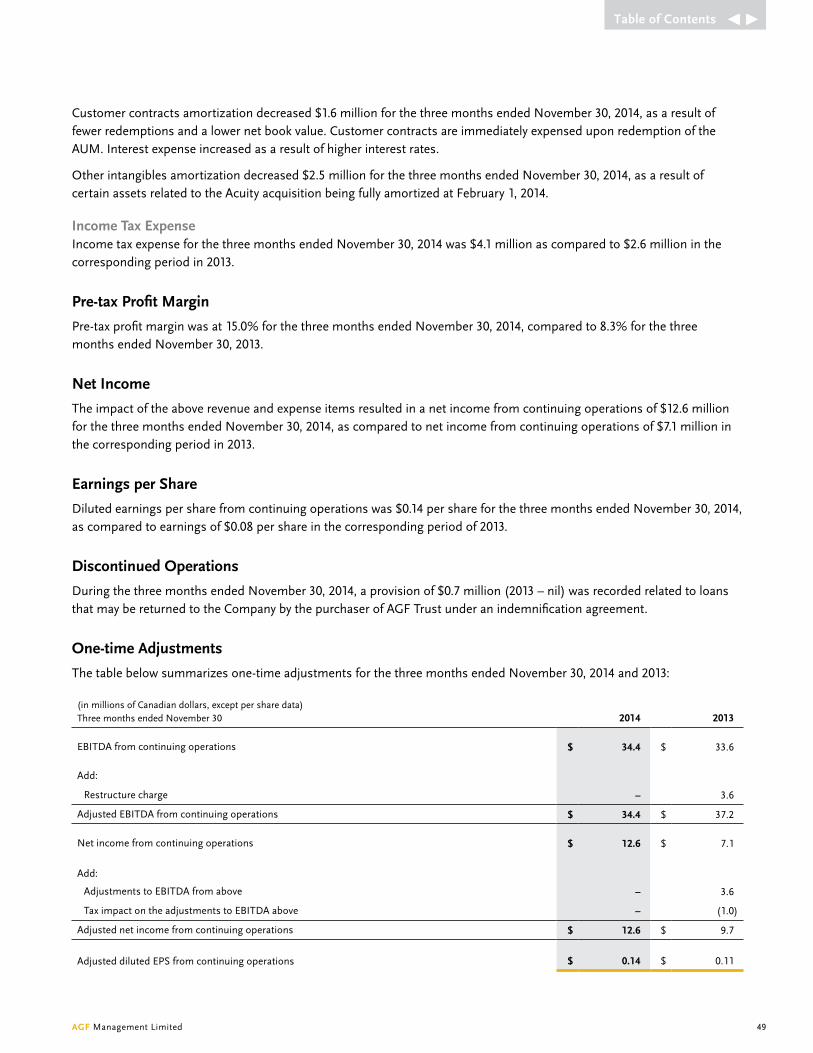
AGF Management Limited 49
Customer contracts amortization decreased $1.6 million for the three months ended november 30, 2014, as a result of fewer redemptions and a lower net book value. Customer contracts are immediately expensed upon redemption of the AUM. interest expense increased as a result of higher interest rates.
Other intangibles amortization decreased $2.5 million for the three months ended november 30, 2014, as a result of certain assets related to the Acuity acquisition being fully amortized at February 1, 2014.
Income Tax expense income tax expense for the three months ended november 30, 2014 was $4.1 million as compared to $2.6 million in the corresponding period in 2013.
pre-tax profit margin
Pre-tax profit margin was at 15.0% for the three months ended november 30, 2014, compared to 8.3% for the three months ended november 30, 2013.
net Income
the impact of the above revenue and expense items resulted in a net income from continuing operations of $12.6 million for the three months ended november 30, 2014, as compared to net income from continuing operations of $7.1 million in the corresponding period in 2013.
earnings per share
diluted earnings per share from continuing operations was $0.14 per share for the three months ended november 30, 2014, as compared to earnings of $0.08 per share in the corresponding period of 2013.
discontinued operations
during the three months ended november 30, 2014, a provision of $0.7 million (2013 – nil) was recorded related to loans that may be returned to the Company by the purchaser of AGF trust under an indemnification agreement.
one-time Adjustments
the table below summarizes one-time adjustments for the three months ended november 30, 2014 and 2013:
(in millions of Canadian dollars, except per share data) three months ended november 30 2014 2013
eBitdA from continuing operations $ 34.4 $ 33.6
Add:
Restructure charge – 3.6
Adjusted eBitdA from continuing operations $ 34.4 $ 37.2
net income from continuing operations $ 12.6 $ 7.1
Add:
Adjustments to eBitdA from above – 3.6
tax impact on the adjustments to eBitdA above – (1.0)
Adjusted net income from continuing operations $ 12.6 $ 9.7
Adjusted diluted ePS from continuing operations $ 0.14 $ 0.11
Table of Contents

selected quarterly Information
(in millions of Canadian dollars, except per share amounts) For the three-month period ended nov. 30, 2014 Aug. 31, 2014 may 31, 2014 Feb. 28, 2014
income (continuing operations) $ 111.7 $ 116.9 $ 119.1 $ 116.9
Free cash flow1 22.8 22.2 18.0 19.8
eBitdA (continuing operations)1 34.4 38.5 38.1 43.9
Pre-tax income (continuing operations) 16.7 19.6 19.5 23.2
net income attributable to equity owners of the Company 12.6 14.8 14.5 19.9
net income (continuing operations) 11.9 14.8 14.5 17.1
eBitdA per share (continuing operations)
Basic $ 0.40 $ 0.45 $ 0.44 $ 0.51
diluted $ 0.40 $ 0.45 $ 0.44 $ 0.51
earnings per share attributable to equity owners of the Company
Basic (continuing operations) $ 0.15 $ 0.17 $ 0.17 $ 0.20
diluted (continuing operations) $ 0.14 $ 0.17 $ 0.17 $ 0.20
Basic $ 0.14 $ 0.17 $ 0.17 $ 0.23
diluted $ 0.13 $ 0.17 $ 0.17 $ 0.23
Weighted average basic shares 85,812,669 85,950,736 86,009,993 86,188,463
Weighted average fully diluted shares 87,000,054 86,459,914 86,563,621 86,742,830
(in millions of Canadian dollars, except per share amounts) For the three-month period ended nov. 30, 2013 Aug. 31, 2013 may 31, 2013 Feb. 28, 2013
income (continuing operations) $ 117.4 $ 117.7 $ 126.9 $ 122.5
Free cash flow1 23.1 26.3 24.2 28.7
eBitdA (continuing operations)1 33.6 38.6 46.1 45.3
Pre-tax income (continuing operations) 9.7 14.1 20.5 21.8
net income (loss) attributable to equity owners of the Company 7.1 10.1 (10.4) 15.6
net income (loss) (continuing operations) 7.1 10.1 (10.4) 15.6
eBitdA per share (continuing operations)
Basic $ 0.39 $ 0.44 $ 0.52 $ 0.51
diluted $ 0.38 $ 0.44 $ 0.52 $ 0.51
earnings (loss) per share attributable to equity owners of the Company
Basic (continuing operations) $ 0.08 $ 0.12 $ (0.12) $ 0.18
diluted (continuing operations) $ 0.08 $ 0.11 $ (0.12) $ 0.17
Basic $ 0.08 $ 0.12 $ (0.12) $ 0.18
diluted $ 0.08 $ 0.11 $ (0.12) $ 0.17
Weighted average basic shares 87,145,604 87,411,167 88,880,598 89,229,202
Weighted average fully diluted shares 87,911,391 88,026,012 89,395,236 89,538,278
1 As previously defined, see ‘Key Performance indicators, Additional iFRS and non-iFRS Measures’ section.
Management’s discussion and analysis of f inancial condition and results of operations
50 AGF Management Limited
Table of Contents
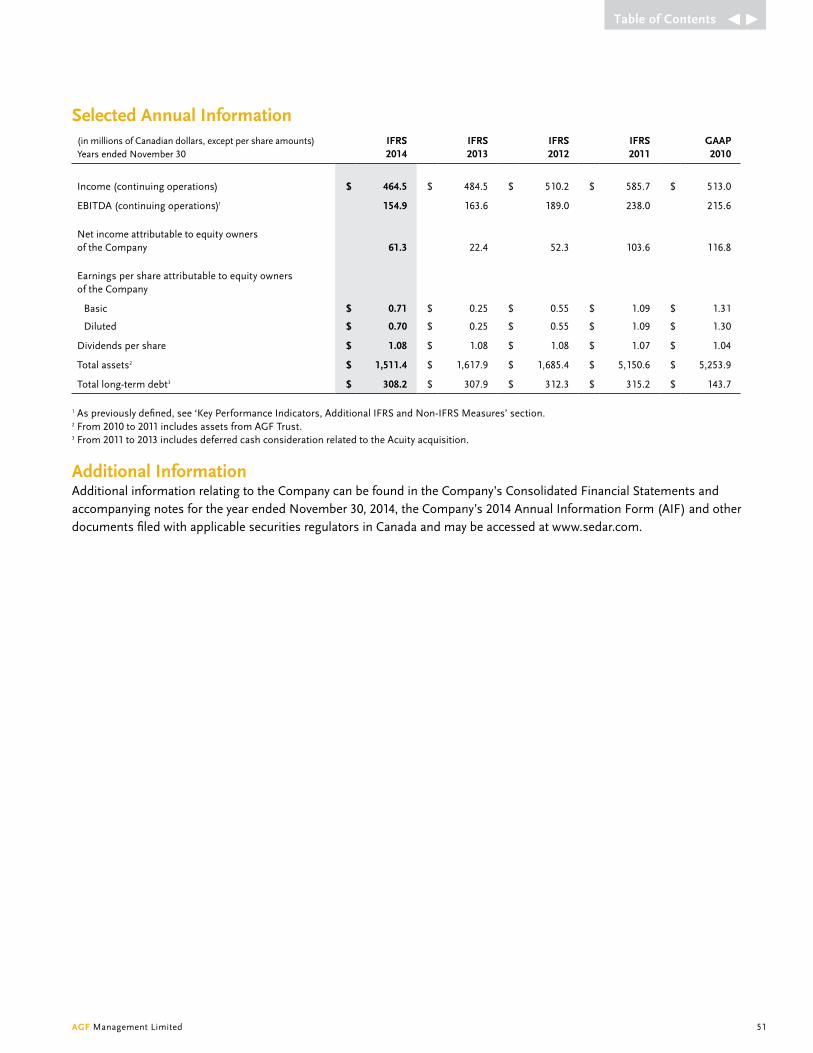
AGF Management Limited 51
selected Annual Information(in millions of Canadian dollars, except per share amounts) years ended november 30
IFRs 2014
IFRs 2013
IFRs 2012
IFRs 2011
GAAp 2010
income (continuing operations) $ 464.5 $ 484.5 $ 510.2 $ 585.7 $ 513.0
eBitdA (continuing operations)1 154.9 163.6 189.0 238.0 215.6
net income attributable to equity owners of the Company 61.3 22.4 52.3 103.6 116.8
earnings per share attributable to equity owners of the Company
Basic $ 0.71 $ 0.25 $ 0.55 $ 1.09 $ 1.31
diluted $ 0.70 $ 0.25 $ 0.55 $ 1.09 $ 1.30
dividends per share $ 1.08 $ 1.08 $ 1.08 $ 1.07 $ 1.04
total assets2 $ 1,511.4 $ 1,617.9 $ 1,685.4 $ 5,150.6 $ 5,253.9
total long-term debt3 $ 308.2 $ 307.9 $ 312.3 $ 315.2 $ 143.7
1 As previously defined, see ‘Key Performance indicators, Additional iFRS and non-iFRS Measures’ section.2 From 2010 to 2011 includes assets from AGF trust.3 From 2011 to 2013 includes deferred cash consideration related to the Acuity acquisition.
Additional InformationAdditional information relating to the Company can be found in the Company’s Consolidated Financial Statements and accompanying notes for the year ended november 30, 2014, the Company’s 2014 Annual information Form (AiF) and other documents filed with applicable securities regulators in Canada and may be accessed at www.sedar.com.
Table of Contents
tOROntO, JAnUARy 27, 2015
the accompanying consolidated financial statements of AGF Management Limited (the Company) were prepared by management, which is responsible for the integrity and fairness of the information presented, including the amounts based on estimates and judgements. these consolidated financial statements were prepared in accordance with Canadian generally accepted accounting principles (GAAP). Financial information appearing throughout this Annual Report is consistent with these consolidated financial statements.
in discharging its responsibility for the integrity and fairness of the consolidated financial statements and for the accounting systems from which they are derived, management maintains internal controls designed to ensure that transactions are authorized, assets are safeguarded and proper records are maintained. the system of internal controls is supported by a compliance function, which ensures that the Company and its employees comply with securities legislation and conflict of interest rules, and by an internal audit staff, which conducts periodic audits of all aspects of the Company’s operations.
the Board of directors oversees management’s responsibilities for financial reporting through an Audit Committee, which is comprised entirely of independent directors. this Committee reviews the consolidated financial statements of the Company and recommends them to the Board for approval.
PricewaterhouseCoopers LLP, an independent auditor appointed by the shareholders of the Company upon the recommendation of the Audit Committee, has performed an independent audit of the consolidated financial statements, and its report follows. the shareholders’ auditor has full and unrestricted access to the Audit Committee to discuss their audit and related findings.
blake C. Goldring, M.S.M., CFA Robert J. bogartChairman and Chief Executive Officer Executive Vice-President and Chief Financial Officer
Management’s responsibility for f inancial reporting
52 AGF Management Limited
Table of Contents
AGF Management Limited a 53
to the Shareholders of AGF Management Limited:
We have audited the accompanying consolidated financial statements of AGF Management Limited and its subsidiaries, which comprise the consolidated statements of financial position as at november 30, 2014 and 2013 and the consolidated statements of income, comprehensive income, changes in equity and cash flow for the years ended november 30, 2014 and 2013, and the related notes, which comprise a summary of significant accounting policies and other explanatory information.
management’s responsibility for the consolidated financial statementsManagement is responsible for the preparation and fair presentation of these consolidated financial statements in accordance with international Financial Reporting Standards, and for such internal control as management determines is necessary to enable the preparation of consolidated financial statements that are free from material misstatement, whether due to fraud or error.
Auditor’s responsibilityOur responsibility is to express an opinion on these consolidated financial statements based on our audits. We conducted our audits in accordance with Canadian generally accepted auditing standards. those standards require that we comply with ethical requirements and plan and perform the audit to obtain reasonable assurance about whether the consolidated financial statements are free from material misstatement.
An audit involves performing procedures to obtain audit evidence about the amounts and disclosures in the consolidated financial statements. the procedures selected depend on the auditor’s judgement, including the assessment of the risks of material misstatement of the consolidated financial statements, whether due to fraud or error. in making those risk assessments, the auditor considers internal control relevant to the entity’s preparation and fair presentation of the consolidated financial statements in order to design audit procedures that are appropriate in the circumstances, but not for the purpose of expressing an opinion on the effectiveness of the entity’s internal control. An audit also includes evaluating the appropriateness of accounting policies used and the reasonableness of accounting estimates made by management, as well as evaluating the overall presentation of the consolidated financial statements.
We believe that the audit evidence we have obtained in our audits is sufficient and appropriate to provide a basis for our audit opinion.
opinionin our opinion, the consolidated financial statements present fairly, in all material respects, the financial position of AGF Management Limited and its subsidiaries as at november 30, 2014 and 2013 and their financial performance and their cash flows for the years ended november 30, 2014 and 2013, in accordance with international Financial Reporting Standards.
pricewaterhouseCoopers llpChartered Professional Accountants, Licensed Public AccountantsJanuary 27, 2015Toronto, Canada
independent auditor’s report
Table of Contents

( in thousands of Canadian dollars) november 30 note 2014 2013
AsseTs
Current Assets
Cash and cash equivalents $ 261,498 $ 369,865
investments 4 23,832 12,272
Accounts receivable, prepaid expenses and other assets 5, 23 42,227 49,173
327,557 431,310
investment in associate and joint venture 5 91,948 84,876
Long-term investments 5 19,671 –
Management contracts 8 689,759 689,759
Customer contracts, net of accumulated amortization and derecognition 8 6,595 10,565
Goodwill 8 244,549 244,549
Other intangibles, net of accumulated amortization and derecognition 8 12,548 19,739
deferred selling commissions, net of accumulated amortization and derecognition 8 104,773 114,848
Property, equipment and computer software, net of accumulated depreciation 9 9,353 12,169
deferred income tax assets 11 4,503 3,951
Other assets 6 167 6,107
total assets $ 1,511,423 $ 1,617,873
Consolidated statement of f inancial position
54 AGF Management Limited
Table of Contents
AGF Management Limited a 55
( in thousands of Canadian dollars) november 30 note 2014 2013
lIAbIlITIes
Current Liabilities
Accounts payable and accrued liabilities 18 $ 65,961 $ 84,494
income tax liability 20, 26 20,702 53,034
Provision for elements Advantage 12 2,045 1,652
Acquisition consideration payable 7 – 6,731
derivative financial instrument 10 1,596 1,609
90,304 147,520
Long-term debt 10 308,199 307,888
deferred income tax liabilities 11 175,472 179,329
derivative financial instrument 10 1,032 1,734
Provision for elements Advantage 12 1,419 2,012
Other long-term liabilities 18 5,222 13,163
total liabilities 581,648 651,646
equITY
equity attributable to owners of the Company
Capital stock 13 517,467 524,681
Contributed surplus 18 39,584 28,440
Retained earnings 361,628 405,989
Accumulated other comprehensive income 14 11,096 7,117
total equity 929,775 966,227
total liabilities and equity $ 1,511,423 $ 1,617,873
(the accompanying notes are an integral part of these Consolidated Financial Statements.)
Approved by the Board:
blake C. Goldring, M.S.M., CFA douglas l. derry, FCPA, FCADirector Director
Consolidated statement of f inancial position
Table of Contents

( in thousands of Canadian dollars, except per share data) Years ended november 30 note 2014 2013
InCome
Management and advisory fees $ 433,118 $ 445,923
deferred sales charges 12,507 16,891
Share of profit of associate and joint ventures 5 12,386 9,340
Fair value adjustments and other income 15 6,469 12,381
total income 464,480 484,535
expenses
Selling, general and administrative 16 175,039 190,783
trailing commissions 128,482 124,707
investment advisory fees 6,129 5,352
Amortization and derecognition of deferred selling commissions 8 48,476 58,617
Amortization and derecognition of customer contracts 8 3,970 8,127
Amortization and derecognition of other intangibles 8 7,191 14,564
depreciation of property, equipment and computer software 9 4,203 4,811
interest expense 19 11,815 11,611
385,305 418,572
Income before income taxes 79,175 65,963
income tax expense (benefit)
Current 20 24,270 51,973
deferred 20 (4,222) (8,424)
20,048 43,549
income from continuing operations, net of tax 59,127 22,414
income from discontinued operations, net of tax 6 2,128 –
net income for the year $ 61,255 $ 22,414
net income attributable to:
equity owners of the Company $ 61,255 $ 22,447
non-controlling interest – (33)
$ 61,255 $ 22,414
eARnInGs peR shARe FoR The YeAR ATTRIbuTAble To The equITY owneRs oF The CompAnY
Basic earnings per share
Continuing operations 21 $ 0.69 $ 0.25
discontinued operations 21 0.02 –
$ 0.71 $ 0.25
diluted earnings per share
Continuing operations 21 $ 0.68 $ 0.25
discontinued operations 21 0.02 –
$ 0.70 $ 0.25
(the accompanying notes are an integral part of these Consolidated Financial Statements.)
Consolidated statement of income
56 AGF Management Limited
Table of Contents
AGF Management Limited a 57
( in thousands of Canadian dollars) Years ended november 30 2014 2013
neT InCome FoR The YeAR $ 61,255 $ 22,414
oTheR CompRehensIve InCome (losses), neT oF TAx
Cumulative translation adjustment
Foreign currency translation adjustments related to net investments in foreign operations 2,717 7,298
2,717 7,298
net unrealized gains on investments
Unrealized gains 725 1,599
Reclassification of realized gain to earnings – (1,702)
725 (103)
net unrealized losses on cash flow hedge
Unrealized losses (467) (246)
Reclassification of realized loss to earnings 1,004 1,020
537 774
total other comprehensive income from continuing operations, net of tax 3,979 7,969
CompRehensIve InCome $ 65,234 $ 30,383
Comprehensive income attributable to:
equity holders of the Company $ 65,234 $ 30,416
non-controlling interest – (33)
$ 65,234 $ 30,383
All items presented in other comprehensive income will be reclassified to the consolidated statement of income in subsequent years.
(the accompanying notes are an integral part of these Consolidated Financial Statements.)
Consolidated statement of comprehensive income
Table of Contents
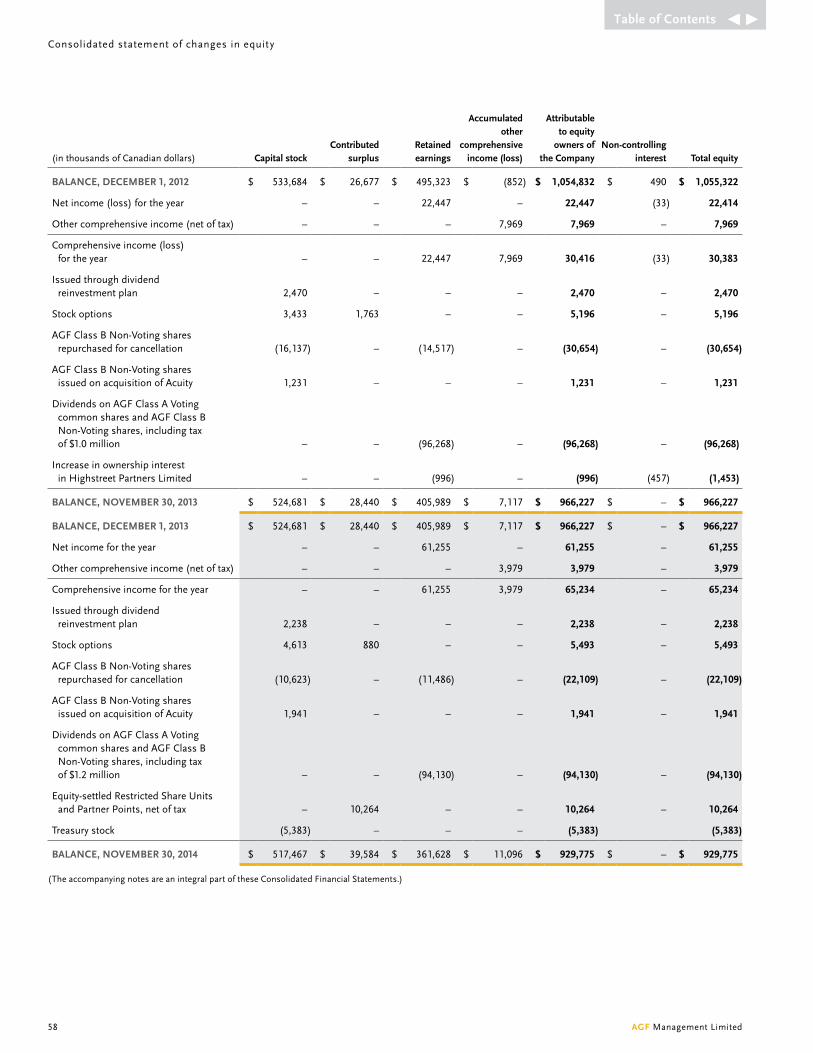
(in thousands of Canadian dollars) Capital stockContributed
surplusRetained earnings
Accumulated other
comprehensive income (loss)
Attributable to equity
owners of the Company
non-controlling interest Total equity
bAlAnCe, deCembeR 1, 2012 $ 533,684 $ 26,677 $ 495,323 $ (852) $ 1,054,832 $ 490 $ 1,055,322
net income (loss) for the year – – 22,447 – 22,447 (33) 22,414
Other comprehensive income (net of tax) – – – 7,969 7,969 – 7,969
Comprehensive income (loss) for the year – – 22,447 7,969 30,416 (33) 30,383
issued through dividend reinvestment plan 2,470 – – – 2,470 – 2,470
Stock options 3,433 1,763 – – 5,196 – 5,196
AGF Class B non-voting shares repurchased for cancellation (16,137) – (14,517) – (30,654) – (30,654)
AGF Class B non-voting shares issued on acquisition of Acuity 1,231 – – – 1,231 – 1,231
dividends on AGF Class A voting common shares and AGF Class B non-voting shares, including tax of $1.0 million – – (96,268) – (96,268) – (96,268)
increase in ownership interest in Highstreet Partners Limited – – (996) – (996) (457) (1,453)
bAlAnCe, novembeR 30, 2013 $ 524,681 $ 28,440 $ 405,989 $ 7,117 $ 966,227 $ – $ 966,227
bAlAnCe, deCembeR 1, 2013 $ 524,681 $ 28,440 $ 405,989 $ 7,117 $ 966,227 $ – $ 966,227
net income for the year – – 61,255 – 61,255 – 61,255
Other comprehensive income (net of tax) – – – 3,979 3,979 – 3,979
Comprehensive income for the year – – 61,255 3,979 65,234 – 65,234
issued through dividend reinvestment plan 2,238 – – – 2,238 – 2,238
Stock options 4,613 880 – – 5,493 – 5,493
AGF Class B non-voting shares repurchased for cancellation (10,623) – (11,486) – (22,109) – (22,109)
AGF Class B non-voting shares issued on acquisition of Acuity 1,941 – – – 1,941 – 1,941
dividends on AGF Class A voting common shares and AGF Class B non-voting shares, including tax of $1.2 million – – (94,130) – (94,130) – (94,130)
equity-settled Restricted Share Units and Partner Points, net of tax – 10,264 – – 10,264 – 10,264
treasury stock (5,383) – – – (5,383) (5,383)
bAlAnCe, novembeR 30, 2014 $ 517,467 $ 39,584 $ 361,628 $ 11,096 $ 929,775 $ – $ 929,775
(the accompanying notes are an integral part of these Consolidated Financial Statements.)
Consolidated statement of changes in equity
58 AGF Management Limited
Table of Contents

AGF Management Limited a 59
( in thousands of Canadian dollars) Years ended november 30 note 2014 2013
opeRATInG ACTIvITIes
net income for the year $ 61,255 $ 22,414
Adjustments for
net income from discontinued operations 6 (2,128) –
Amortization, derecognition and depreciation 63,840 86,119
interest expense 11,815 11,611
income tax expense 20 20,048 43,549
income taxes paid (59,055) (23,048)
Stock-based compensation 17 4,434 12,830
Share of profit of associate and joint venture 5 (12,386) (9,340)
dividends from associate 5 7,636 6,249
deferred selling commissions paid 8 (38,401) (36,678)
Other (69) 1,651
56,989 115,357
net change in non-cash working capital balances related to operations
Accounts receivable 6,946 8,962
Other assets (1,621) (3,922)
Accounts payable and accrued liabilities (11,939) (4,047)
Other liabilities (7,265) 4,723
(13,879) 5,716
net cash provided by operating activities 43,110 121,073
FInAnCInG ACTIvITIes
Repurchase of Class B non-voting shares for cancellation 13 (22,109) (30,654)
issue of Class B non-voting shares 13 4,232 3,210
Purchase of treasury stock 13 (5,440) –
dividends paid 22 (90,651) (92,775)
transaction costs on amendment of long-term debt – (765)
interest paid (11,844) (11,691)
net cash used in financing activities (125,812) (132,675)
InvesTInG ACTIvITIes
increase in ownership interest in Highstreet Partners Limited – (4,423)
Acquisition of Acuity Funds Ltd. and Acuity investment Management, net of cash acquired 7 (4,440) (2,713)
Purchase of investment in joint venture 5 (1) –
Purchase of long-term investments (30,700)
Return of capital from long-term investments 5 10,946 –
Proceeds from sale of discontinued operations 6 10,000 –
Purchase of property, equipment and computer software, net of disposals 9 (1,387) (3,424)
Purchase of investments 4 (12,829) (5,076)
Proceeds from sale of investments 4 2,746 25,804
net cash provided by (used in) investing activities (25,665) 10,168
deCReAse In CAsh And CAsh equIvAlenTs (108,367) (1,434)
bAlAnCe oF CAsh And CAsh equIvAlenTs, beGInnInG oF YeAR 369,865 371,299
bAlAnCe oF CAsh And CAsh equIvAlenTs, end oF YeAR $ 261,498 $ 369,865
(the accompanying notes are an integral part of these Consolidated Financial Statements.)
Consolidated statement of cash f low
Table of Contents
FOR tHe yeARS ended nOveMBeR 30, 2014 And 2013
note 1 General Information
AGF Management Limited (AGF or the Company) is a limited liability company incorporated and domiciled in Canada under the Business Corporations Act (Ontario). the address of its registered office and principal place of business is toronto-dominion Bank tower, 66 Wellington Street West, toronto, Ontario.
the Company is an integrated, global wealth management corporation whose principal subsidiaries provide investment management for mutual funds, institutions and corporations, as well as high-net-worth clients. the Company conducts the management and distribution of mutual funds in Canada under the brand names AGF, Acuity, elements and Harmony (collectively, AGF investments). the Company also holds investments in an associate, Smith & Williamson Holdings Limited, and in joint ventures instarAGF inc. and Stream Asset Financial LP.
these consolidated financial statements were authorized for issue by the Board of directors on January 27, 2015.
note 2 basis of preparation
these consolidated financial statements have been prepared in accordance with international Financial Reporting Standards (iFRS) as issued by the international Accounting Standards Board (iASB).
note 3 significant Accounting policies, Judgements and estimation uncertainty
3.1 basis of measurement
the consolidated financial statements have been prepared under the historical cost convention, except for the revaluation of certain financial assets and financial liabilities to fair value.
3.2 Adoption of new and Revised Accounting standards
the Company has adopted the following new and revised standards, along with all consequential amendments to other standards, effective december 1, 2013. these changes were adopted in accordance with the applicable transitional provisions of each new or revised standard.
iFRS 7, Financial instruments: disclosures, has been amended to address offsetting financial assets and financial liabilities. iFRS 7 requires additional disclosure to allow users of the financial statements to evaluate the effect or potential effect of master netting or other similar arrangements. the Company adopted the amended standard effective december 1, 2013 and certain disclosures have been added as a result.
iFRS 10, Consolidated Financial Statements, introduces a single consolidation model that uses the same criteria to determine control for entities of all types, irrespective of whether the investee is controlled by voting rights or other contractual arrangements. Under iFRS 10, an investee is consolidated only if the investor possesses power over the investee, has exposure to variable returns from its involvement with the investee and has the ability to use its power over the investee to affect its returns. the principle that a consolidated entity presents a parent and its subsidiaries as a single entity remains unchanged, as do the mechanics of consolidation. iFRS 10 supersedes the guidance in iAS 27, Consolidated and Separate Financial Statements, and SiC-12, Consolidation – Special Purpose entities. the adoption of iFRS 10 did not result in any changes to the entities, which are consolidated by the Company.
iFRS 11, Joint Arrangements, establishes principles for financial reporting by parties to a joint arrangement, and only differentiates between joint operations and joint ventures. the option to apply proportionate consolidation when accounting for joint ventures has been removed and equity accounting where the fair value option has not been elected
notes to consolidated f inancial statements
60 AGF Management Limited
Table of Contents
AGF Management Limited 61
is now applied in accordance with iAS 28, investments in Associates and Joint ventures. iFRS 11 supersedes existing guidance under iAS 31, interests in Joint ventures, and SiC-13, Jointly Controlled entities – non-Monetary Contributions by venturers. As the Company did not have any interests in joint arrangements at december 1, 2013, there was no impact as a result of the adoption of iFRS 11.
On december 1, 2013, the Company adopted iFRS 12, disclosures of interests in Other entities, which integrates all of the disclosure requirements for interests in subsidiaries, joint arrangements, associates and structured entities into a single standard. the required disclosures provide information to evaluate the nature of, and risks associated with, an entity’s interests in other entities, and the effects of those interests on the entity’s financial statements. the adoption of the standard resulted in additional disclosures in the Company’s annual consolidated financial statements.
iFRS 13, Fair value Measurement, provides a single comprehensive framework for measuring fair value. iFRS 13 applies to fair value measurements where required or permitted by other iFRS but does not address when to measure fair value or require additional use of fair value. the measurement of the fair value of an asset or liability is based on assumptions that market participants would use when pricing the asset or liability under current market conditions, including assumptions about risk.
the new standard requires disclosures similar to those in iFRS 7, Financial instruments: disclosures, but applies to substantially all assets and liabilities measured at fair value, whereas iFRS 7 applies only to financial assets and liabilities measured at fair value. the Company adopted iFRS 13 prospectively on december 1, 2013. the adoption of iFRS 13 did not require any significant adjustments to the valuation techniques used by the Company to measure fair value and did not result in any significant measurement adjustments as at december 1, 2013.
Amendments to iAS 19, employee Benefits, require changes to the recognition and measurement of defined benefit pension, post-retirement benefit expense and termination benefits and to the disclosures for all employee benefits. the Company adopted the amendments to iAS 19 retrospectively, which had no impact on the consolidated financial statements.
iAS 28, investments in Associates and Joint ventures, has been amended to be consistent with the changes to accounting for joint arrangements in iFRS 11. the amended standard prescribes the accounting for investments in associates and provides guidance on the application of the equity method when accounting for investments in associates and joint ventures. there was no impact to the Company as a result of the adoption of the amended standard.
3.3 Investments in subsidiaries, Associates, Joint ventures and structured entities
(a) Subsidiaries and Consolidated Structured entities the consolidated financial statements include the accounts of the Company and its directly and indirectly owned
subsidiaries. Subsidiaries are all entities for which the Company has exposure to variable returns and power over the investee, which it can use to affect the amounts of such returns and is often accompanied by a shareholding of more than half of the investee’s voting rights. the existence and effect of potential voting rights that are currently exercisable or convertible are considered when assessing whether the Company controls another entity. Subsidiaries are fully consolidated from the date on which control is transferred to the Company. they are de-consolidated from the date on which control ceases. if the Company loses control of a subsidiary, it accounts for all amounts recognized in other comprehensive income (OCi) in relation to that subsidiary on the same basis as it would if the Company had directly disposed of the related assets or liabilities.
the Company applies the acquisition method to account for business combinations. the consideration transferred for the acquisition of a subsidiary is the fair values of the assets transferred, the liabilities incurred to the former owners of the acquiree and the equity interests issued by the Company. the consideration transferred includes the fair value of any asset or liability resulting from a contingent consideration agreement. identifiable assets and liabilities and contingent liabilities assumed in a business combination are measured initially at their fair values at the acquisition date.
Table of Contents
intercompany transactions and balances are eliminated on consolidation. For subsidiaries where the Company does not own all of the equity, the non-controlling shareholders’ interest is presented in the consolidated statement of financial position as non-controlling interest (nCi) and the related income is disclosed as a separate line in the consolidated statement of income.
Consolidated structured entities are entities over which the Company has control by means of a contractual agreement. the Company established an employee benefit trust as a consolidated structured entity with the purpose of acquiring Class B non-voting shares to be delivered to employees upon vesting of their Restricted Share Units (RSUs). Under the contractual agreement, the Company will provide financial support to the trust to fund the purchase of these shares. Refer to note 3.14 and note 18 for additional information.
the principal subsidiaries and consolidated structured entities of AGF as at november 30, 2014 are as follows:
principal activity Country of incorporation Interest held
AGF investments inc. investment management Canada 100%
AGF investments America inc. investment management Canada 100%
Acuity investment Management inc. investment management Canada 100%
AGF international Advisors Company Limited investment management ireland 100%
AGFiA Limited investment management ireland 100%
AGF Asset Management Asia Limited investment management Singapore 100%
doherty & Associates Limited investment management Canada 100%
Cypress Capital Management Limited investment management Canada 100%
Highstreet Asset Management inc. investment management Canada 100%
AGF Securities (Canada) Limited Securities dealer Canada 100%
20/20 Financial Corporation Holding company Canada 100%
1801882 Alberta Ltd. Alternative investments Canada 100%
employee Benefit Plan trust trust company Canada 100%
(b) Associates and Joint ventures Associates are entities over which the Company has significant influence, but not control, generally accompanying
between 20% and 50% of the voting rights. Joint ventures are arrangements whereby the parties have joint control over, and rights to the net assets of, the arrangement.
Investment type nature of activitiesCountry of incorpo-
ration Interest held
Smith & Williamson Holdings Limited (S&WHL) Associate Asset management, tax, account-ing, and financial advisory
United Kingdom 32.0%
instarAGF inc. (instarAGF) Joint venture Asset manager – alternative/infrastructure
Canada 50.1%
Stream Asset Financial LP Joint venture Limited partnership – investment entity
Canada 23.6%
Stream Asset Financial Management LP (SAFMLP) Joint venture Asset manager – alternative/infrastructure
Canada 37.0%
the Company’s interests in the associates and joint ventures, other than its interest in funds that it manages, are generally accounted for using the equity method of accounting. the Company’s investment in associates includes goodwill and other intangible assets identified on acquisition. AGF’s share of its associates’ post-acquisition profits or losses is recognized in the consolidated statement of income and its share of post-acquisition other comprehensive income (loss) is recognized in OCi. the cumulative post-acquisition movements are adjusted against the carrying amount of the investment. When the Company’s share of losses in an associate or joint venture equals or exceeds its interest in the associate or joint venture, the Company does not recognize further losses, unless it has incurred obligations or made payments on behalf of the associate or joint venture.
notes to consolidated f inancial statements
62 AGF Management Limited
Table of Contents

AGF Management Limited 63
Unrealized gains on transactions between the Company and its associates and joint ventures are eliminated to the extent of the Company’s interest in the associates and joint ventures. Unrealized losses are also eliminated unless the transaction provides evidence of an impairment of the asset transferred. Associates’ and joint ventures’ accounting policies have been changed where necessary to ensure consistency with the policies adopted by AGF.
the Company assesses at each period-end whether there is any objective evidence that its interests in associates and joint ventures are impaired. if impaired, the carrying value of the Company’s share of the underlying assets of associates or joint ventures is written down to its estimated recoverable amounts (being the higher of fair value less costs to sell and value in use) and charged to the consolidated statement of income.
Additionally, the Company has determined that interests it holds in funds it manages may be associates as a result of the Company’s power conveyed through investment management and other agreements it has with the funds that permit the Company to make decisions about their investing and operating activities. none of these interests are individually significant and the Company has elected to designate its investments in these funds at fair value through profit or loss. these funds conduct their trading activities in Canada and ireland, which may include trading of foreign denominated securities. At november 30, 2014, the carrying amount of the Company’s interests in investment funds that it manages was $17.7 million (2013 – $10.8 million), which represent the Company’s maximum exposure to loss with respect to these interests. the fair value adjustment related to the Company’s interests in investment funds recognized on the consolidated statement of income was $0.3 million for the year ended november 30, 2014 (2013 – $2.8 million).
none of the Company’s interests in associates or joint ventures that are accounted for using the equity method are quoted in active markets. Refer to note 4 for additional information about the Company’s investments in funds that it manages. Refer to note 5 for additional information about the Company’s interests in associates and joint ventures.
3.4 Foreign Currency Translation
(a) Functional and Presentation Currency items included in the financial statements of each consolidated entity are measured using the currency of the primary
economic environment in which the entity operates (the functional currency). the consolidated financial statements are presented in Canadian dollars, which is AGF Management Limited’s functional currency.
the financial statements of entities that have a functional currency different from that of AGF Management Limited (foreign operations) are translated into Canadian dollars as follows: assets and liabilities – at the closing rate at the date of the statement of financial position, and income and expenses – at the average rate of the period (as this is considered a reasonable approximation to actual rates). Resulting changes are recognized in OCi.
(b) transactions and Balances Monetary assets and liabilities denominated in foreign currencies are translated at exchange rates prevailing at the
consolidated statement of financial position date and non-monetary assets and liabilities are translated at historical exchange rates. Foreign currency income and expenses are translated at average exchange rates prevailing throughout the year. Unrealized translation gains and losses and all realized gains and losses are included in net income on the consolidated statement of income.
3.5 Assets under management (Aum)
the Company manages a range of mutual funds and other investment assets owned by clients and third parties that are not reflected on the consolidated statement of financial position, certain of which are held through investment funds that meet the definition of structured entities under iFRS. the Company earns fees for providing management and administrative services to these investment funds. Fees from these funds and other investment assets are calculated based on AUM, which was $35.1 billion as at november 30, 2014. the Company does not consolidate these investment funds because the form of fees and ownership interest are not material enough to meet the definition of control under iFRS.
Table of Contents
3.6 Cash and Cash equivalents
Cash represents highly liquid temporary deposits, while cash equivalents consists of bank term deposits, both of which are readily convertible to known amounts of cash, are subject to insignificant risk of changes in fair value and have short-term maturities of less than three months at inception.
3.7 Financial Instruments
Financial assets and liabilities are recognized when the Company becomes a party to the contractual provisions of the instrument. Financial assets are derecognized when the rights to receive cash flows from the assets have expired or have been transferred and the Company has transferred substantially all risks and rewards of ownership. Financial liabilities are derecognized when the obligation specified in the contract is discharged, cancelled or expires. Regular way purchases and sales of financial assets and liabilities are accounted for at the trade date.
Financial assets and liabilities are offset and the net amount is reported in the consolidated statement of financial position when there is a legally enforceable right to offset the recognized amounts and there is an intention to settle on a net basis, or realize the asset and settle the liability simultaneously.
At initial recognition, the Company classifies its financial instruments in the following categories depending on the purpose for which the instruments were acquired:
(a) Financial Assets and Liabilities at Fair value through Profit or Loss (FvtPL) A financial asset or liability is classified in this category if acquired principally for the purpose of selling or repurchasing
in the short term or long term. derivatives are also included in the category unless they are designated as hedges. the Company’s FvtPL consist of certain investments, contingent consideration receivable, acquisition consideration payable, and non-controlling interest put liability. the contingent consideration receivable and acquisition consideration payable were extinguished during the year ended november 30, 2014. the non-controlling interest put liability was extinguished during the year ended november 30, 2013.
the non-cash payment portion of the acquisition consideration payable was classified as FvtPL and was recognized initially and subsequently at fair value. Gains and losses arising from changes in fair value and distributions received from certain investments are presented in the consolidated statement of income under fair value adjustments and other income. transaction costs on FvtPL financial instruments are accounted for in net income as incurred.
(b) Available for Sale Available for sale assets are non-derivatives that are either designated in this category or not classified in any of the
other categories. the Company’s available for sale assets consist of investments in debt and equity securities.
Available for sale assets are recognized initially at fair value plus transaction costs and are subsequently carried at fair value. Gains or losses arising from changes in fair value are recognized in OCi. Available for sale investments are classified as current.
interest on available for sale investments, calculated using the effective interest method, is recognized in the consolidated statement of income as part of fair value adjustments and other income. dividends on available for sale equity instruments are recognized in the consolidated statement of income as part of fair value adjustments and other income on the date they become legally receivable. When an available for sale investment is sold or impaired, the accumulated gains or losses are moved from accumulated OCi to the consolidated statement of income and are included in fair value adjustments and other income.
(c) Loans and Receivables Loans and receivables are non-derivative financial assets with fixed or determinable payments that are not quoted in an
active market. the Company’s loans and receivables consist of accounts receivable and other financial assets.
notes to consolidated f inancial statements
64 AGF Management Limited
Table of Contents
AGF Management Limited 65
Accounts receivable and other financial assets are initially recognized at the amount expected to be received, less, when material, a discount to reduce the asset balance to fair value. Subsequently, accounts receivable and other financial assets are measured at amortized cost using the effective interest method less a provision for impairment.
(d) Financial Liabilities at Amortized Cost Financial liabilities at amortized cost include accounts payable and accrued liabilities, long-term debt, the cash payment
portion of the acquisition consideration payable, and other long-term liabilities.
Accounts payable and accrued liabilities, long-term debt, the cash payment portion of the acquisition consideration payable, and other long-term liabilities are initially recognized at the amount required to be paid, less, when material, a discount to reduce the payables to fair value. Subsequently, these balances are measured at amortized cost using the effective interest method.
A financial liability is derecognized when it is extinguished. When a liability is extinguished, the difference between its carrying amount and the consideration paid including any non-cash assets transferred and any new liabilities assumed is recognized in profit or loss. A modification of the terms of a liability is accounted for as an extinguishment of the original liability and recognition as a new liability when the modification is substantial. the Company deems an amendment of the terms of a liability to be substantially different if the net present value of the cash flows under the new liability, including any fees paid, is at least 10% different from the net present value of the remaining cash flows of the existing liability, both discounted at the original effective interest rate of the original liability.
Financial liabilities are classified as current liabilities if payment is due within 12 months of the consolidated statement of financial position date. Otherwise, they are presented as non-current liabilities.
derivative instruments are used to manage the Company’s exposure to interest rate risks. the Company does not enter into derivative financial instruments for trading or speculative purposes. When derivative instruments are used, the Company determines whether hedge accounting can be applied. the derivative instrument must be highly effective in accomplishing the objective of offsetting either changes in the fair value or forecasted cash flows attributable to the risk being hedged both at inception and over the life of the hedge. in accordance with iAS 39, the accumulated ineffectiveness of hedging relationships must be measured, and the ineffective portion of changes in fair value must be recognized in the consolidated statement of income. Where hedge accounting cannot be applied, changes in fair value are recognized in the consolidated statement of income.
Cash flow hedges are used to hedge the Company’s exposure to fluctuating interest rates on its long-term debt. the effective portion of the change in fair value of the derivative instruments designated as cash flow hedges, net of taxes, is recorded in OCi, while the ineffective portion is recognized in the consolidated statement of income under fair value adjustments and other income. Amounts recorded in OCi are subsequently recognized in the consolidated statement of income consistent with the timing of the recognition of cash flows associated with the hedged instruments. When a hedging instrument expires or is sold, or when a hedge no longer meets the criteria for hedge accounting, any cumulative gain or loss existing in equity at that time remains in equity and is recognized when the forecast transaction is ultimately recognized in the consolidated statement of income. When a forecast transaction is no longer expected to occur, the cumulative gain or loss that was reported in equity is immediately transferred to the consolidated statement of income.
transaction costs related to financial instruments at fair value through profit or loss are accounted for as expense on initial recognition. For all other financial instruments, transaction costs are included in the initial carrying amount in the consolidated statement of financial position.
3.8 Intangibles
(a) Goodwill and Management Contracts Goodwill represents the excess of the fair value of consideration paid over the fair value of the Company’s share of the
identifiable net assets, including management contracts, of the acquired subsidiary at the date of acquisition. Goodwill
Table of Contents
is carried at cost less accumulated impairment losses. Management contracts have been determined to have an indefinite life. Management contracts acquired separately or in a business combination are recorded at fair value on initial recognition and subsequently reduced by the amount of impairment losses, if any.
(b) Customer Contracts and Other intangibles Customer contracts and other intangibles are stated at cost (which generally coincides with their fair values at the
dates acquired), net of accumulated amortization and impairment, if any. Amortization for customer contracts and certain other intangibles is computed on a straight-line basis over five to 15 years based on the estimated useful lives of these assets.
For the remaining other intangibles, amortization is based on the expected discounted cash flow and amortized over the contractual life of the assets. Unamortized customer contracts and other intangibles for which client attrition occurs is immediately charged to net income and included in amortization and derecognition of customer contracts.
(c) deferred Selling Commissions Selling commissions paid to brokers on mutual fund securities sold on a deferred sales charge (dSC) basis are
recorded at cost and are amortized on a straight-line basis over the period that the associated economic benefits are expected to arise, which corresponds with the applicable dSC schedule and ranges from three to seven years. Unamortized deferred selling commissions related to units redeemed prior to the end of the expected investment period are derecognized and immediately charged to net income and included in amortization and derecognition of deferred selling commissions. derecognition is calculated based on actual dSC units redeemed.
3.9 property, equipment and Computer software
Property, equipment and computer software, which consists of furniture and equipment, computer hardware, computer software and leasehold improvements, is stated at cost, net of accumulated depreciation and impairment, if any. depreciation is calculated using the following methods based on the estimated useful lives of these assets:
Furniture and equipment 20% declining balance
Computer hardware 30% declining balance
Leasehold improvements straight-line over term of lease
Computer software straight-line over three years
3.10 Impairment of non-financial Assets
Assets that have an indefinite useful life, for example, goodwill and management contracts, are not subject to amortization and are tested annually for impairment. Assets that are subject to amortization are reviewed for impairment whenever events or changes in circumstances indicate that the carrying amount may not be recoverable. An impairment loss is recognized for the amount by which the asset’s carrying amount exceeds its recoverable amount. the recoverable amount is the higher of an asset’s fair value less costs to sell and value in use. For the purposes of assessing impairment, assets are grouped at the lowest levels for which there are separately identifiable cash flows (cash-generating units, or CGUs). non-financial assets, other than goodwill, that suffered an impairment are reviewed for possible reversal of the impairment at each reporting date. Where such evidence exists, the portion of the previous impairment that no longer is impaired is reversed through net income with a corresponding increase in the carrying value of the asset.
3.11 provisions
A provision is recognized if, as a result of a past event, the Company has a present legal or constructive obligation that can be estimated reliably, and it is probable that an outflow of economic benefits will be required to settle the obligation. Provisions are measured as the best estimate of the expenditure required to settle the present obligation at the end of the reporting period.
notes to consolidated f inancial statements
66 AGF Management Limited
Table of Contents

AGF Management Limited 67
in november 2005, the Company launched AGF elements, which consists of five diversified fund-of-fund portfolios. Four of these portfolios include the elements Advantage Commitment, which is a commitment to the investor that if their portfolio does not match or outperform its customized benchmark over a three-year period, AGF will provide each individual investor up to 90 basis points in additional units. this will be calculated based on the value of such investment at the end of its related three-year period.
the Company records a provision of up to 30 basis points per year of each investor’s AUM and the Company’s expectation of amounts ultimately to be reimbursed to the investor, adjusted for redemptions, until the end of the three-year measurement period of each investment made by such investor. if an individual investor’s returns match or exceed the corresponding benchmark, amounts previously recorded as a provision are reversed and recognized in net income.
effective June 22, 2009, AGF capped the AGF elements Advantage Program (the Program). Any eligible units purchased prior to June 22, 2009 remain eligible for the Program. Any units purchased on or after June 22, 2009 are not entitled to participate in the Program. elements Advantage distributions that are reinvested continue to be eligible to participate in the Program.
3.12 Current and deferred Income Tax
income tax consists of current and deferred tax. income tax is recognized in the consolidated statement of income except to the extent that it relates to items recognized directly in OCi or directly in equity, in which case the income tax is also recognized directly in OCi or equity, respectively.
Management regularly evaluates positions taken in tax returns with respect to situations in which applicable tax regulation is subject to interpretation. Provisions are established where appropriate on the basis of amounts expected to be paid to the tax authorities.
Current tax is the expected tax payable on the taxable income for the year, using tax rates enacted or substantively enacted, at the end of the reporting period, interest and penalties on taxes owing, and any adjustment to tax payable in respect of previous years.
in general, deferred tax is recognized in respect of tax losses and credits carryforwards and temporary differences arising between the tax bases of assets and liabilities and their carrying amounts in the consolidated financial statements. However, deferred tax is not recognized if it arises from the initial recognition of goodwill or the initial recognition of an asset or liability in a transaction other than a business combination that, at the time of the transaction, affects neither accounting nor taxable profit or loss. deferred income tax is provided on temporary differences arising on investments in subsidiaries and associates, except, in the case of subsidiaries or associates, where the timing of the reversal of the temporary difference is controlled by the Company and it is probable that the temporary difference will not reverse in the foreseeable future.
deferred income tax is determined on a non-discounted basis using tax rates and laws that have been enacted or substantively enacted at the date of the consolidated statement of financial position and are expected to apply when the deferred tax asset is realized or liability settled. deferred tax assets are recognized to the extent that it is probable that future taxable profit will be available, against which the deductible temporary differences can be utilized.
deferred income tax assets and liabilities are presented as non-current.
3.13 Revenue Recognition
Revenue is recognized to the extent that it is probable that the economic benefits will flow to the Company and the revenue can be reliably measured. Revenue is measured at the fair value of the consideration received or receivable. in addition to these general principles, AGF applies the following specific revenue recognition policies:
Table of Contents
Management and advisory fees are based on the net asset value of funds under management and are recognized on an accrual basis. these fees are shown net of management fee rebates and distribution fees payable to third parties and selling-commission financing entities.
dSC revenue is received from investors when mutual fund securities sold on a dSC basis are redeemed. dSC revenue is recognized on the trade date of the redemption of the applicable mutual fund securities.
Share of profit of associate and joint venture is recognized using the equity method and is recognized based on the most recent financial information received from the associate and joint venture.
3.14 employee benefits
(a) Stock-based Compensation and Other Stock-based Payments the Company has established stock option plans for senior employees and utilizes the fair-value-based method of
accounting for stock options. the fair value of stock options, determined on the grant date using an option pricing model, is recorded over the vesting period as a charge to net earnings with a corresponding credit to contributed surplus, taking into account forfeitures. Awards are settled by issuance of AGF Class B non-voting shares upon exercise of the options. the stock options are issued with an exercise price not less than the market price of the Class B non-voting shares immediately prior to the grant date. Stock option awards are granted on a four-year graded-vesting basis whereby 25% of the total awards vest each year on the anniversary of the grant date.
the Company also has a share purchase plan under which employees can have a percentage of their annual earnings withheld subject to a maximum of 6% to purchase AGF’s Class B non-voting shares. the Company matches up to 60% of the amounts contributed by the employee. the Company’s contribution vests immediately and is recorded as a charge to net income in the period that the benefit is earned. All contributions are used by the plan trustee to purchase Class B non-voting shares on the open market.
the Company has an executive Share Unit Plan for senior employees under which certain employees are granted Restricted Share Units (RSUs) or Performance Share Units (PSUs) of Class B non-voting shares. RSUs vest three years from the grant date.
the Company has a Partners incentive Plan (PiP) for senior employees under which certain employees are designated to participate. the plan consists of a number of points, which are allocated among participating employees. the value of each point is determined using a funding rate that is based on a set percentage of targeted earnings before interest and tax (eBit) that defines the funding pool for the year. At the end of each fiscal year, the funding pool is adjusted up or down to reflect the Company’s eBit performance. the adjusted dollar value is then settled in the form of RSUs or stock options. Stock options are granted under the Company’s stock option plan, which is described above. RSUs are granted under the PiP. during the first year of the plan, compensation expense and the related liability are expensed based on the targeted funding pool over a graded four-year vesting period. Upon granting of the RSU or stock option, the remaining expense is accounted for under the RSU or stock option model.
On January 30, 2014, the Company amended its plan agreements to require share-based settlement of all RSUs granted to the employees of AGF and its Canadian subsidiaries and communicated this change to affected employees on February 11, 2014. in connection with the amendments, an employee benefit trust was established that is controlled and consolidated by the Company. the purpose of the trust is to acquire Class B non-voting shares of the Company in the open market to be delivered to employees upon vesting of their RSUs. Pursuant to the revised plan, the employees of AGF and its Canadian subsidiaries will not have an option to receive cash settlement for their RSUs and consequently, the Company has transferred the liabilities related to these awards from liabilities to equity. Compensation expense and contributed surplus related to these awards is recognized over the remaining vesting period based on the fair value of the Class B non-voting shares at the date of the plan change communication to employees and taking into account forfeitures. Going forward, new grants will be expensed over the vesting period based on the fair value of the Class B non-voting shares at the date of grant and taking into account forfeitures.
notes to consolidated f inancial statements
68 AGF Management Limited
Table of Contents

AGF Management Limited 69
employees of non-Canadian subsidiaries participating in the plans continue to have the option to receive cash settlement for their RSUs. the compensation expense and the related liability for these awards are recorded equally or graded over the three-year vesting period, taking into account fluctuations in the market price of Class B non-voting shares, dividends paid and forfeitures. AGF will redeem all of the participants’ RSUs in cash equal to the value of one Class B non-voting share for each RSU.
PSU compensation expense and the related liability are recorded equally over the vesting period, taking into account the likelihood of the performance criteria being met, fluctuations in the market price of Class B non-voting shares, dividends paid and forfeitures. these PSUs vest three years from the grant date provided employees meet certain performance criteria. AGF will redeem all of the participants’ PSUs in cash equal to the value of one Class B non-voting share for each PSU.
the Company has a deferred Share Unit (dSU) plan for non-employee directors and certain employees. the plan enables directors of the Company to elect to receive their remuneration in dSUs. these units vest immediately and compensation expense and the related liability are charged to net income in the period the dSUs are granted. dSUs granted to certain employees vest between one to 10 years from the grant date. Compensation expense and the related liability are recorded equally over the respective vesting periods, taking into account fluctuations in the market price of Class B non-voting shares, dividends paid and forfeitures. On termination, AGF will redeem all of the participants’ dSUs in cash equal to the value of one Class B non-voting share at the termination date for each dSU.
the Company had a put agreement with the non-controlling shareholders of one of its subsidiaries. Under the agreement, the Company was obligated to purchase shares from the non-controlling shareholders at a specified price determined in part by reference to earnings. the Company accounted for the obligation as a share-based payment at fair value. the fair value of the obligation was determined as the difference between the strike price of the option and the fair value of the underlying shares, determined using market multiples based on precedent transactions. Changes in the fair value of the put agreement were recorded in net income. the put agreement was settled on May 31, 2013.
(b) termination Benefits the Company recognizes termination benefits at the earlier of when it can no longer withdraw the offer of those
benefits, or when it recognizes costs for a restructuring that involves termination benefits.
(c) Unit Appreciation Rights (UAR) Plan the Company has a UAR plan for certain employees of doherty & Associates Limited (doherty) and Cypress Capital
Management Limited (Cypress). the purpose of the plan is retention of key employees, including senior management and key succession employees, and to promote the profitability and growth of these two subsidiaries by creating a performance incentive for such key employees so that they may benefit from any appreciation in the value of doherty and Cypress. the plan provides for the grant of performance appreciation rights to certain employees, the value of which are linked to the change in value of doherty and Cypress by reference to changes in doherty and Cypress earnings before interest, taxes, depreciation and amortization (eBitdA). Obligations related to the UAR plan are recorded under accounts payable and accrued liabilities and other long-term liabilities on the consolidated statement of financial position.
3.15 Capital stock
AGF Class A voting common shares and Class B non-voting shares are classified as equity. incremental costs directly attributable to the issuance of new shares are shown in equity as a deduction from the proceeds, net of tax.
3.16 dividends
dividends to AGF shareholders are recognized in the Company’s consolidated financial statements in the period in which the dividends are approved by the Board of directors.
Table of Contents
3.17 earnings per share
Basic earnings per share are calculated by dividing net income applicable to AGF Class A voting common shares and Class B non-voting shares by the daily weighted average number of shares outstanding. diluted earnings per share are calculated using the daily weighted average number of shares that would have been outstanding during the year had all potential common shares been issued at the beginning of the year, or when other potentially dilutive instruments were granted or issued, if later.
the treasury stock method is employed to determine the incremental number of shares that would have been outstanding had the Company used proceeds from the exercise of options to acquire shares.
3.18 Accounting standards Issued but not Yet Applied
the following new accounting standards have been issued or amended. the Company is currently evaluating the impact the following new standard will have on its financial statements.
iFRS 9, Financial instruments, was issued by the iASB in July 2014 and will replace iAS 39 Financial instruments: Recognition and Measurement. iFRS 9 introduces a model for classification and measurement, a single, forward-looking ‘expected loss’ impairment model and a substantially reformed approach to hedge accounting. the new single, principle-based approach for determining the classification of financial assets is driven by cash flow characteristics and the business model in which an asset is held. the new model also results in a single impairment model being applied to all financial instruments, which will require more timely recognition of expected credit losses. it also includes changes in respect of own credit risk in measuring liabilities elected to be measured at fair value, so that gains caused by the deterioration of an entity’s own credit risk on such liabilities are no longer recognized in profit or loss. iFRS 9 is effective for annual periods beginning on or after January 1, 2018, however is available for early adoption. in addition, the elements of iFRS 9 related to presentation of gains from changes in an entity’s own credit risk can be early applied in isolation without otherwise changing the accounting for financial instruments. the Company is in the process of assessing the impact of iFRS 9 and has not yet determined when it will adopt the new standard.
iFRS 15, Revenue Recognition, was issued in June 2014. the objective of iFRS 15 is to provide a single, comprehensive revenue recognition model for all contracts with customers to improve comparability within industries, across industries, and across capital markets. it contains principles that an entity will apply to determine the measurement of revenue and timing of when it is recognized. the underlying principle is that an entity will recognize revenue to depict the transfer of goods or services to customers at an amount that the entity expects to be entitled to in exchange for those goods or services. it also contains new disclosure requirements and amended guidance around the capitalization of certain costs related to the acquisition of customer relationships. iFRS 15 is effective for annual periods beginning on or after January 1, 2017, with early adoption permitted. the Company is in the process of assessing the impact of iFRS 15 and has not yet determined when it will adopt the new standard.
3.19 Critical Accounting estimates and Judgements
the preparation of consolidated financial statements in conformity with iFRS requires management to make estimates and assumptions that affect the reported amounts of assets and liabilities and disclosures of contingent assets and liabilities at the date of the consolidated financial statements and the reported amounts of revenue and expenses during the reporting period. Actual results could differ from these estimates. the estimates and underlying assumptions are reviewed on an ongoing basis. Revisions to accounting estimates are recognized in the period in which the estimate is revised if the revision affects only that period or in the period in which the estimate is revised if the revision affects both current and future periods.
Key areas of estimation where management has made difficult, complex or subjective judgements – often about matters that are inherently uncertain – include provision for useful lives of depreciable assets, commitments and contingencies, as well as the specific items discussed below.
notes to consolidated f inancial statements
70 AGF Management Limited
Table of Contents

AGF Management Limited 71
(a) impairment of non-financial Assets the Company determines the recoverability of each of its CGUs based on an analysis of the underlying AUM associated
with the CGU and available AUM multiples from recent transactions for similar assets within the same industry. Such analysis involves management judgement in selecting the appropriate AUM multiple to be used in the assessment of the impairment of non-financial assets. Refer to note 8 for further details on the impairment of non-financial assets.
(b) Stock-based Compensation and Other Stock-based Payments in determining the fair value of stock-based rewards and the related charge to the consolidated statement of
income, the Company makes assumptions about future events and market conditions. in particular, judgement must be formed as to the likely number of shares that will vest, and the fair value of each award granted. the fair value of stock options granted is determined using the Black-Scholes option-pricing model, which is dependent on further estimates, including the Company’s future dividend policy and the future volatility in the price of the Class B non-voting shares. Refer to note 18 for the assumptions used. Such assumptions are based on publicly available information and reflect market expectation. different assumptions about these factors to those made by AGF could materially affect reported net income.
(c) income taxes the Company is subject to income taxes in numerous jurisdictions. there are many transactions and calculations for
which the ultimate tax determination is uncertain. AGF recognizes liabilities for anticipated tax audit issues based on estimates of whether additional taxes will be due. When the estimated outcome of these matters is different from the amounts that were recorded, such differences will impact the current and deferred income tax assets and liabilities in the period in which such determination is made. Refer to note 26 for further details.
(d) Critical Judgements in Applying the Company’s Accounting Policies the application of the Company’s accounting policies may require management to make judgements, apart from those
involving estimates, that can affect the amounts recognized in the consolidated financial statements. Such judgements include the determination of whether intangible assets have finite or indefinite lives and the accounting implications related to certain legal matters. in addition, judgement was applied in determining the recognition and measurement of the provision related to the put option liability for loans related to AGF trust Company (AGF trust). Refer to note 6 for further details.
note 4 Investments
the following table presents a breakdown of investments:
( in thousands of Canadian dollars) november 30
2014
2013
Fair value through profit or loss
AGF mutual funds and other $ 17,676 $ 10,779
equity securities 544 509
18,220 11,288
Available for sale
equity securities and term deposits 5,304 679
Loans and receivables
Canadian government debt – Federal 308 305
$ 23,832 $ 12,272
during the years ended november 30, 2014 and 2013, no impairment charges were required.
Table of Contents
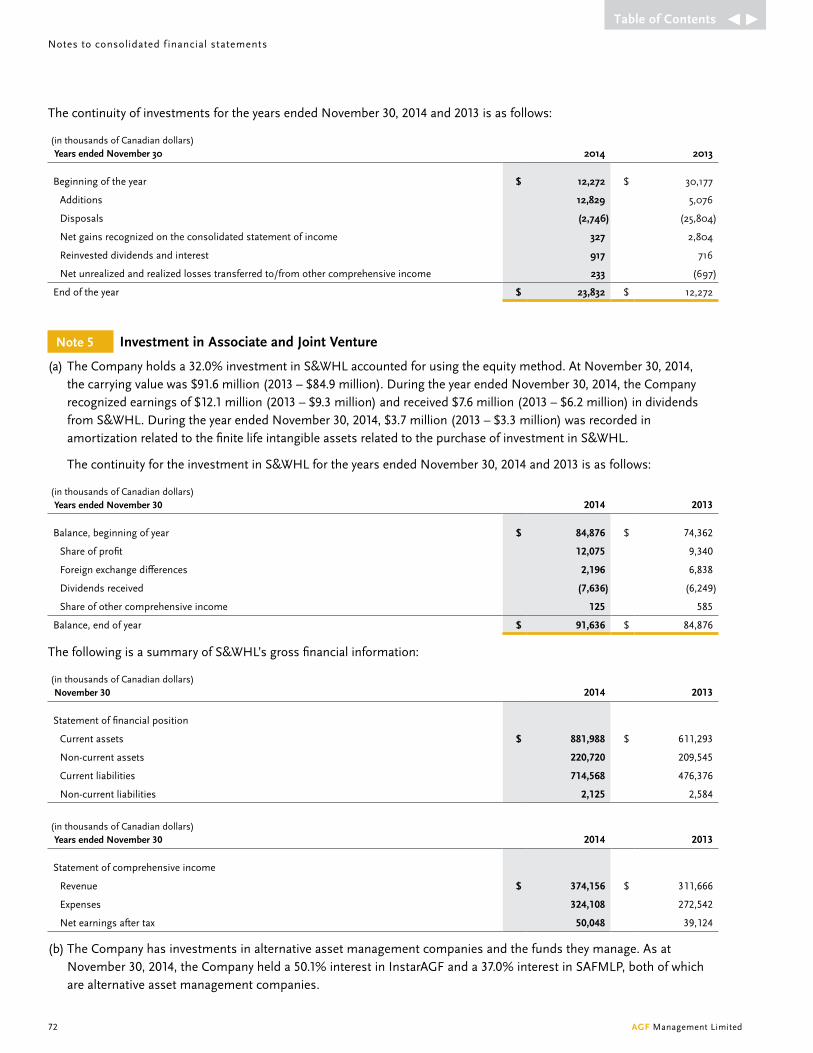
the continuity of investments for the years ended november 30, 2014 and 2013 is as follows:
( in thousands of Canadian dollars) Years ended november 30 2014 2013
Beginning of the year $ 12,272 $ 30,177
Additions 12,829 5,076
disposals (2,746) (25,804)
net gains recognized on the consolidated statement of income 327 2,804
Reinvested dividends and interest 917 716
net unrealized and realized losses transferred to/from other comprehensive income 233 (697)
end of the year $ 23,832 $ 12,272
note 5 Investment in Associate and Joint venture
(a) the Company holds a 32.0% investment in S&WHL accounted for using the equity method. At november 30, 2014, the carrying value was $91.6 million (2013 – $84.9 million). during the year ended november 30, 2014, the Company recognized earnings of $12.1 million (2013 – $9.3 million) and received $7.6 million (2013 – $6.2 million) in dividends from S&WHL. during the year ended november 30, 2014, $3.7 million (2013 – $3.3 million) was recorded in amortization related to the finite life intangible assets related to the purchase of investment in S&WHL.
the continuity for the investment in S&WHL for the years ended november 30, 2014 and 2013 is as follows:
( in thousands of Canadian dollars) Years ended november 30 2014 2013
Balance, beginning of year $ 84,876 $ 74,362
Share of profit 12,075 9,340
Foreign exchange differences 2,196 6,838
dividends received (7,636) (6,249)
Share of other comprehensive income 125 585
Balance, end of year $ 91,636 $ 84,876
the following is a summary of S&WHL’s gross financial information:
( in thousands of Canadian dollars) november 30 2014 2013
Statement of financial position
Current assets $ 881,988 $ 611,293
non-current assets 220,720 209,545
Current liabilities 714,568 476,376
non-current liabilities 2,125 2,584
( in thousands of Canadian dollars) Years ended november 30 2014 2013
Statement of comprehensive income
Revenue $ 374,156 $ 311,666
expenses 324,108 272,542
net earnings after tax 50,048 39,124
(b) the Company has investments in alternative asset management companies and the funds they manage. As at november 30, 2014, the Company held a 50.1% interest in instarAGF and a 37.0% interest in SAFMLP, both of which are alternative asset management companies.
notes to consolidated f inancial statements
72 AGF Management Limited
Table of Contents

AGF Management Limited 73
decisions about investing activities require the unanimous consent of other unrelated owners and therefore, the Company has determined that its interests are joint ventures. the Company accounts for its investments in instarAGF and SAFMLP using the equity method.
the Company’s non-participating voting interest in SAFMLP is held through instarAGF while its participating non-voting interests are held directly by the Company. through its interest in instarAGF and SAFMLP, the Company is entitled to a proportionate share of management fees and carried interest or performance fees from the funds these entities manage. equity incentive awards are available to be awarded to the employees of SAFMLP based on certain conditions, which could dilute the Company’s participation.
the Company has allocated a total of $150.0 million to funds and investments associated with the alternative asset management platform. the Company may temporarily provide capital to warehouse investments prior to formation of a fund. Upon closing of a fund with external investments, the Company receives a return of its capital in excess of its proportionate participation in the fund.
As at november 30, 2014, of its $150.0 million allocation, the Company has committed $50.0 million to Stream Asset Financial LP (Stream), a midstream oil and gas infrastructure fund. As at november 30, 2014, the Company has invested $16.6 million with $33.4 million remaining committed capital to be invested in the Stream fund, which has aggregate capital commitments of $210.0 million. the Company has designated these investments at FvtPL. the Company intends to launch an essential infrastructure fund and has allocated $103.0 million to the fund.
during the year ended november 30, 2014, the Company received $1.1 million (2013 – nil) of income distributions and $0.1 million in charges (2013 – nil) related to the fair value adjustment on the mark to market of its participation in Stream. As at november 30, 2014, the fair value of the Company’s investment in Stream was $16.5 million, which represents the Company’s maximum exposure to loss related to this investment and has been recorded in long-term investments on the consolidated statement of financial position.
the Company has recorded losses with respect to its equity investment in instarAGF only to the extent of its initial investment, which has a carrying value of nil, due to the fact that it is not contractually obligated to fund the losses. during the year ended november 30, 2014, the Company had accumulated unrecognized losses of $0.7 million (2013 – nil) related to its interest in instarAGF. in addition, AGF has agreed to advance up to $5.0 million to instarAGF on an as-needed basis as a working capital loan facility. the loan facility is non-interest bearing and is repayable on a priority basis once instarAGF begins to earn fees from funds under management. As at november 30, 2014, the Company had recorded a receivable of $2.1 million (2013 – nil), which was included in accounts receivable, prepaid expenses and other assets on the consolidated statement of financial position.
during the year ended november 30, 2014, the Company recognized earnings of $0.3 million (2013 – nil) related to its investment in SAFMLP, which was also equal to the carrying amount of its investment at november 30, 2014.
note 6 discontinued operations
On August 1, 2012, the Company completed its sale of 100% of the shares of AGF trust for cash consideration corresponding to the net book value of AGF trust at closing of $246.3 million. the agreement included a contingent consideration to a maximum of $20.0 million over five years if the credit performance of AGF trust’s loan portfolio met certain thresholds. in May 2014, the Company finalized an early settlement of the contingent consideration receivable for $10.0 million. At november 30, 2013, the value of the contingent consideration receivable was estimated at $6.1 million. the amount receivable was settled on June 4, 2014. in addition, the Company indemnified the purchaser of AGF trust against unenforceable loans outstanding or committed as at the date of closing, which may be put back to the Company on a quarterly basis, subject to certain conditions. the put option will expire on October 31, 2017 and indemnifies only against errors in underwriting and not credit deterioration. the carrying value of the loans subject to indemnification was $3.1 billion at the date of sale. the Company records a provision for indemnified loans when the loan is in default and the
Table of Contents

put option becomes probable of being exercised, which generally coincides with the receipt of notification by the purchaser that it intends to exercise the put. during the year ended november 30, 2014, a provision of $0.7 million was recorded related to these loans. As a result, the Company realized a net gain on discontinued operations of $3.1 million, or $2.1 million after tax (2013 – nil) during the year ended november 30, 2014.
the change in stock options related to AGF trust during the year ended november 30, 2013 is summarized as follows:
2013
Years ended november 30 options weighted average
exercise price
Class b non-voting share options related to AGF Trust
Balance, beginning of the year 393,505 $ 17.61
Options granted – –
Options expired (299,905) 20.53
Options exercised (93,600) 8.24
Balance, end of the year – $ –
note 7 Acquisitions
(a) Acquisition of Acuity Funds Ltd. and Acuity investment Management inc. On February 1, 2011, the Company completed its acquisition of 100% of the shares of Acuity Funds Ltd. and Acuity
investment Management inc. (Acuity) for a purchase price of $335.5 million.
On February 1, 2014, the Company fully extinguished its acquisition consideration payable to the Acuity vendors with a payment of $6.4 million, consisting of $4.4 million in cash and a settlement of the Class e exchangeable preferred shares through the issuance of 175,367 Class B non-voting shares valued at $1.9 million. As part of the consideration paid, 185,119 Class B non-voting shares held in escrow were released to the Acuity vendors on February 1, 2014.
On February 1, 2013, $3.9 million was paid to the Acuity vendors, consisting of $2.7 million in cash and a settlement of the Class d exchangeable preferred shares through the issuance of 107,138 Class B non-voting shares valued at $1.2 million.
the following is a summary of the fair values of contingently returnable consideration as at november 30, 2013:
( in thousands of Canadian dollars) november 30
2013
Cash payments due February 1, 2014 $ 4,318
issuance of Class e exchangeable preferred shares, redeemable February 1, 2014 2,413
$ 6,731
Less: current portion 6,731
$ –
during the year ended november 30, 2014, a $0.3 million recovery (2013 – $1.9 million in charges) was recognized related to the fair value adjustment on the mark to market related to the AGF Class B non-voting shares and interest accretion on the acquisition consideration payable.
(b) Acquisition of Highstreet Partners Ltd. during the year ended november 30, 2013, the Company increased its ownership interest in Highstreet Partners Ltd.
(Highstreet) to 100.0% from 89.4%. the Company paid cash consideration of $4.4 million and extinguished receivables of $3.2 million. Refer to note 18 for details regarding the put agreement.
notes to consolidated f inancial statements
74 AGF Management Limited
Table of Contents
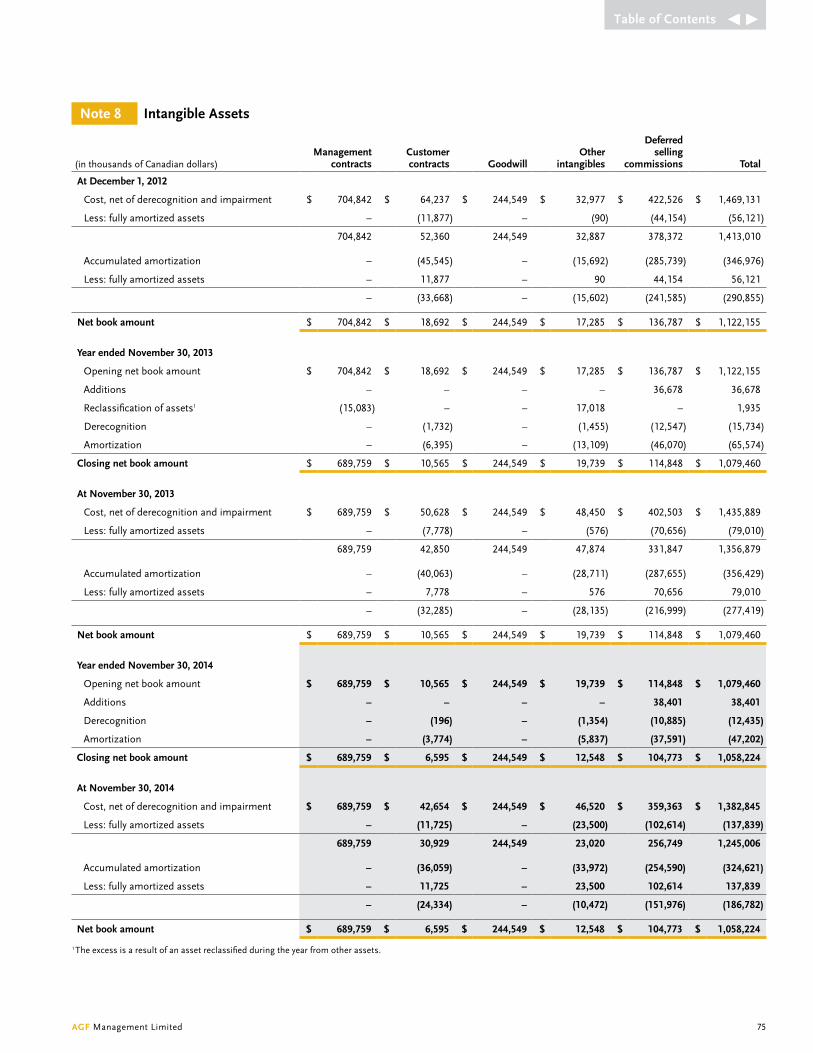
AGF Management Limited 75
note 8 Intangible Assets
(in thousands of Canadian dollars)management
contractsCustomer contracts Goodwill
other intangibles
deferred selling
commissions Total
At december 1, 2012
Cost, net of derecognition and impairment $ 704,842 $ 64,237 $ 244,549 $ 32,977 $ 422,526 $ 1,469,131
Less: fully amortized assets – (11,877) – (90) (44,154) (56,121)
704,842 52,360 244,549 32,887 378,372 1,413,010
Accumulated amortization – (45,545) – (15,692) (285,739) (346,976)
Less: fully amortized assets – 11,877 – 90 44,154 56,121
– (33,668) – (15,602) (241,585) (290,855)
net book amount $ 704,842 $ 18,692 $ 244,549 $ 17,285 $ 136,787 $ 1,122,155
Year ended november 30, 2013
Opening net book amount $ 704,842 $ 18,692 $ 244,549 $ 17,285 $ 136,787 $ 1,122,155
Additions – – – – 36,678 36,678
Reclassification of assets1 (15,083) – – 17,018 – 1,935
derecognition – (1,732) – (1,455) (12,547) (15,734)
Amortization – (6,395) – (13,109) (46,070) (65,574)
Closing net book amount $ 689,759 $ 10,565 $ 244,549 $ 19,739 $ 114,848 $ 1,079,460
At november 30, 2013
Cost, net of derecognition and impairment $ 689,759 $ 50,628 $ 244,549 $ 48,450 $ 402,503 $ 1,435,889
Less: fully amortized assets – (7,778) – (576) (70,656) (79,010)
689,759 42,850 244,549 47,874 331,847 1,356,879
Accumulated amortization – (40,063) – (28,711) (287,655) (356,429)
Less: fully amortized assets – 7,778 – 576 70,656 79,010
– (32,285) – (28,135) (216,999) (277,419)
net book amount $ 689,759 $ 10,565 $ 244,549 $ 19,739 $ 114,848 $ 1,079,460
Year ended november 30, 2014
Opening net book amount $ 689,759 $ 10,565 $ 244,549 $ 19,739 $ 114,848 $ 1,079,460
Additions – – – – 38,401 38,401
derecognition – (196) – (1,354) (10,885) (12,435)
Amortization – (3,774) – (5,837) (37,591) (47,202)
Closing net book amount $ 689,759 $ 6,595 $ 244,549 $ 12,548 $ 104,773 $ 1,058,224
At november 30, 2014
Cost, net of derecognition and impairment $ 689,759 $ 42,654 $ 244,549 $ 46,520 $ 359,363 $ 1,382,845
Less: fully amortized assets – (11,725) – (23,500) (102,614) (137,839)
689,759 30,929 244,549 23,020 256,749 1,245,006
Accumulated amortization – (36,059) – (33,972) (254,590) (324,621)
Less: fully amortized assets – 11,725 – 23,500 102,614 137,839
– (24,334) – (10,472) (151,976) (186,782)
net book amount $ 689,759 $ 6,595 $ 244,549 $ 12,548 $ 104,773 $ 1,058,224
1 the excess is a result of an asset reclassified during the year from other assets.
Table of Contents

during the year ended november 30, 2014, in accordance with its accounting policies, the Company completed its annual impairment test on its goodwill and indefinite life intangibles. For the purposes of assessing impairment, assets are grouped at the lowest levels for which there are separately identifiable cash flows (CGUs). Substantially all of the management contracts are in the retail CGU. the following is a summary of the goodwill allocation by CGU:
( in thousands of Canadian dollars)
Investment management
– Retail
Investment management
– Institutional
Cypress Capital management
ltd.doherty &
Associates ltd. Total
Year ended november 30, 2013
Opening net book amount $ 151,624 $ 76,656 $ 12,548 $ 3,721 $ 244,549
impairment – – – – –
disposal – – – – –
Closing net book amount $ 151,624 $ 76,656 $ 12,548 $ 3,721 $ 244,549
Year ended november 30, 2014
Opening net book amount $ 151,624 $ 76,656 $ 12,548 $ 3,721 $ 244,549
impairment – – – – –
disposal – – – – –
Closing net book amount $ 151,624 $ 76,656 $ 12,548 $ 3,721 $ 244,549
to determine whether an impairment loss should be recognized, the carrying value of the assets and liabilities of the CGU is compared to its recoverable amount. the recoverable amount of a CGU is the higher of its fair value less costs to sell and its value in use. Fair value less costs to sell is the best estimate obtainable from the sale of a CGU in an arm’s length transaction between knowledgeable, willing parties, less the costs of disposal. Accordingly, the Company determined the recoverability of each of its CGUs based on an analysis of the underlying AUM associated with the CGU and available AUM multiples from recent transactions for similar assets within the same industry. Based on the test, the Company concluded that no goodwill or indefinite life intangible assets were impaired for the year ended november 30, 2014 (2013 – nil). Management continues to regularly monitor its intangibles for indications of potential impairment. the AUM and related multiples applied in determining the fair values for each of the CGUs, together with a sensitivity analysis, at november 30, 2014 were as follows:
( in thousands of Canadian dollars)
Investment management
– Retail
Investment management
– Institutional
AUM $ 19,109,000 $ 10,445,000
AUM multiple applied 5.0% 3.2%
Recoverable amount $ 941,200 $ 334,500
Alternative AUM multiple – high 6.0% 3.5%
Recoverable amount $ 1,127,900 $ 361,600
excess of recoverable amount on carrying value $ 361,400 $ 283,100
Alternative AUM multiple – low 4.0% 2.8%
Recoverable amount $ 751,700 $ 284,700
excess (deficiency) of recoverable amount on carrying value $ (14,800) $ 205,200
notes to consolidated f inancial statements
76 AGF Management Limited
Table of Contents
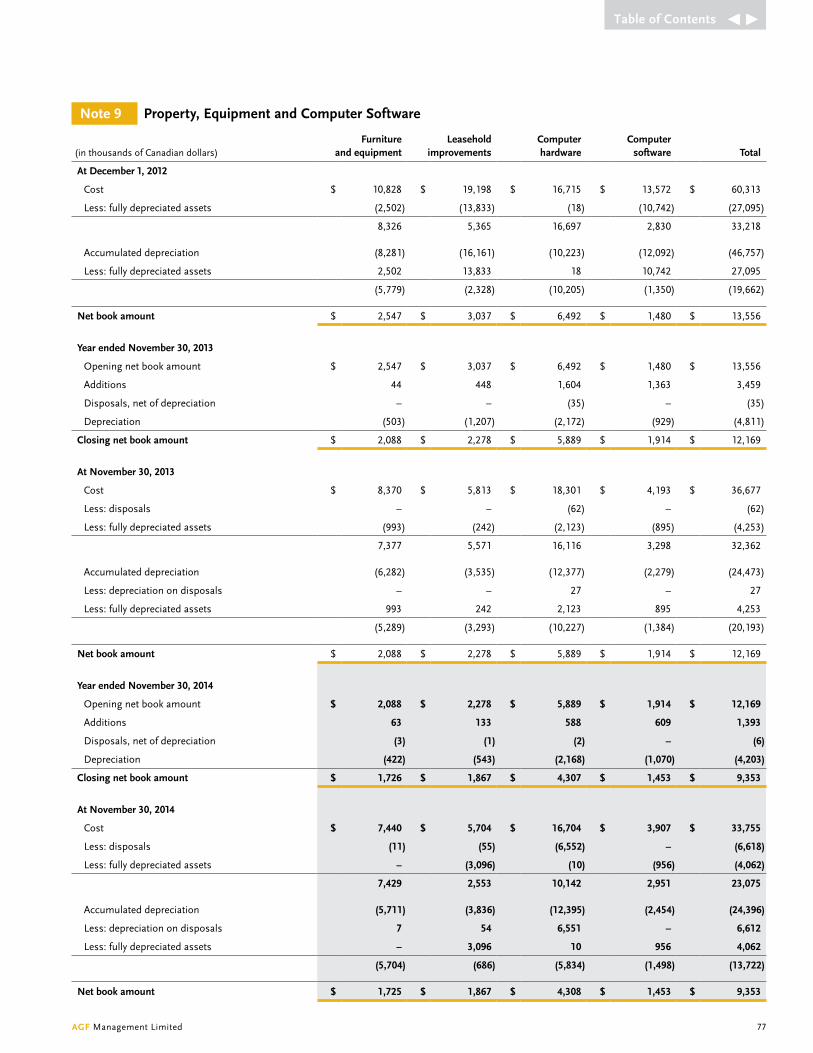
AGF Management Limited 77
note 9 property, equipment and Computer software
(in thousands of Canadian dollars)Furniture
and equipmentleasehold
improvementsComputer hardware
Computer software Total
At december 1, 2012
Cost $ 10,828 $ 19,198 $ 16,715 $ 13,572 $ 60,313
Less: fully depreciated assets (2,502) (13,833) (18) (10,742) (27,095)
8,326 5,365 16,697 2,830 33,218
Accumulated depreciation (8,281) (16,161) (10,223) (12,092) (46,757)
Less: fully depreciated assets 2,502 13,833 18 10,742 27,095
(5,779) (2,328) (10,205) (1,350) (19,662)
net book amount $ 2,547 $ 3,037 $ 6,492 $ 1,480 $ 13,556
Year ended november 30, 2013
Opening net book amount $ 2,547 $ 3,037 $ 6,492 $ 1,480 $ 13,556
Additions 44 448 1,604 1,363 3,459
disposals, net of depreciation – – (35) – (35)
depreciation (503) (1,207) (2,172) (929) (4,811)
Closing net book amount $ 2,088 $ 2,278 $ 5,889 $ 1,914 $ 12,169
At november 30, 2013
Cost $ 8,370 $ 5,813 $ 18,301 $ 4,193 $ 36,677
Less: disposals – – (62) – (62)
Less: fully depreciated assets (993) (242) (2,123) (895) (4,253)
7,377 5,571 16,116 3,298 32,362
Accumulated depreciation (6,282) (3,535) (12,377) (2,279) (24,473)
Less: depreciation on disposals – – 27 – 27
Less: fully depreciated assets 993 242 2,123 895 4,253
(5,289) (3,293) (10,227) (1,384) (20,193)
net book amount $ 2,088 $ 2,278 $ 5,889 $ 1,914 $ 12,169
Year ended november 30, 2014
Opening net book amount $ 2,088 $ 2,278 $ 5,889 $ 1,914 $ 12,169
Additions 63 133 588 609 1,393
disposals, net of depreciation (3) (1) (2) – (6)
depreciation (422) (543) (2,168) (1,070) (4,203)
Closing net book amount $ 1,726 $ 1,867 $ 4,307 $ 1,453 $ 9,353
At november 30, 2014
Cost $ 7,440 $ 5,704 $ 16,704 $ 3,907 $ 33,755
Less: disposals (11) (55) (6,552) – (6,618)
Less: fully depreciated assets – (3,096) (10) (956) (4,062)
7,429 2,553 10,142 2,951 23,075
Accumulated depreciation (5,711) (3,836) (12,395) (2,454) (24,396)
Less: depreciation on disposals 7 54 6,551 – 6,612
Less: fully depreciated assets – 3,096 10 956 4,062
(5,704) (686) (5,834) (1,498) (13,722)
net book amount $ 1,725 $ 1,867 $ 4,308 $ 1,453 $ 9,353
Table of Contents

note 10 long-term debt
(a) Revolving Credit Facility On november 29, 2013, the Company, through its subsidiary AGF investments inc., amended and restated its loan
agreements for a four-year term and decreased the total credit availability. Facility 1, Facility 2 and the acquisition facility were changed to be under one syndicated agreement with two Canadian chartered banks. the Company’s unsecured revolving credit facility (the Facility) has a maximum aggregate principal amount of $400.0 million (2013 – $400.0 million). the agreement includes an accordion feature that allows the Company to increase its Facility by $100.0 million (2013 – $100.0 million) to $500.0 million at a future date, subject to certain terms and conditions. Advances under the Facility are made available by prime-rate loans in U.S. or Canadian dollars, under banker’s acceptances (BAs) or by issuance of letters of credit. the Facility is due in full on november 29, 2017, and no principal repayments are due until this date. As at november 30, 2014, AGF had drawn $310.0 million (2013 – $310.0 million) against the Facility in the form of two one-month BAs at an effective average interest rate of 3.3% per annum.
(b) interest Rate Swap to hedge the Company’s exposure to fluctuating interest rates on its long-term debt, AGF has entered into an interest
rate swap transaction with a Canadian chartered bank, which involves the exchange of a one-month BA rate, plus 150 basis points, to pay a fixed interest rate of 3.8%. the swap transaction expires in July 2016. the swap contract is designated as a cash flow hedging instrument and is used to mitigate interest expense volatility on the issuances of BAs over the term to maturity. As at november 30, 2014, the notional amount of the swap was $125.0 million (2013 – $125.0 million) and its fair value was $2.6 million (2013 – $3.3 million), which was recorded as a liability on the consolidated statement of financial position.
note 11 deferred Income Tax Assets and liabilities
(a) the analysis of deferred income tax assets and deferred income tax liabilities is as follows:
( in thousands of Canadian dollars) november 30 2014 2013
deferred income tax assets
deferred income tax asset to be recovered after more than 12 months $ 3,377 $ 2,712
deferred income tax asset to be recovered within 12 months 1,126 1,239
4,503 3,951
deferred income tax liabilities
deferred income tax liability to be settled after more than 12 months 164,331 165,864
deferred income tax liability to be settled within 12 months 11,141 13,465
175,472 179,329
net deferred income tax liabilities $ 170,969 $ 175,378
notes to consolidated f inancial statements
78 AGF Management Limited
Table of Contents
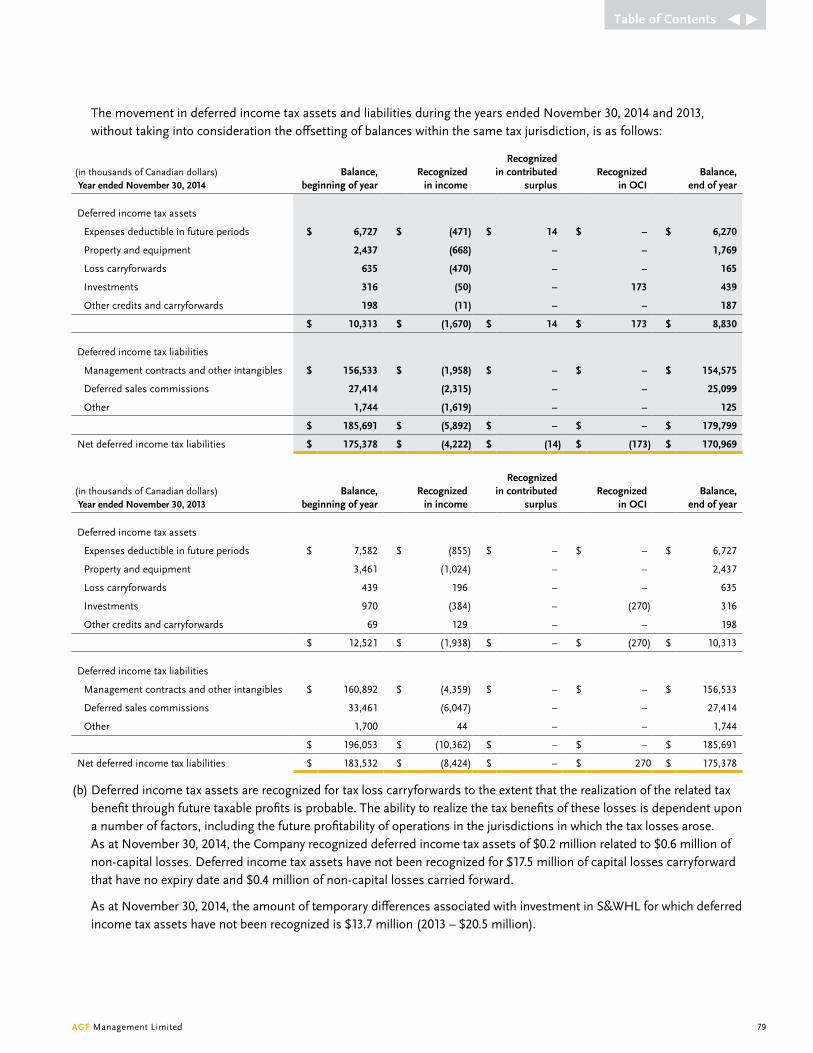
AGF Management Limited 79
the movement in deferred income tax assets and liabilities during the years ended november 30, 2014 and 2013, without taking into consideration the offsetting of balances within the same tax jurisdiction, is as follows:
( in thousands of Canadian dollars) Year ended november 30, 2014
balance, beginning of year
Recognized in income
Recognized in contributed
surplusRecognized
in oCIbalance,
end of year
deferred income tax assets
expenses deductible in future periods $ 6,727 $ (471) $ 14 $ – $ 6,270
Property and equipment 2,437 (668) – – 1,769
Loss carryforwards 635 (470) – – 165
investments 316 (50) – 173 439
Other credits and carryforwards 198 (11) – – 187
$ 10,313 $ (1,670) $ 14 $ 173 $ 8,830
deferred income tax liabilities
Management contracts and other intangibles $ 156,533 $ (1,958) $ – $ – $ 154,575
deferred sales commissions 27,414 (2,315) – – 25,099
Other 1,744 (1,619) – – 125
$ 185,691 $ (5,892) $ – $ – $ 179,799
net deferred income tax liabilities $ 175,378 $ (4,222) $ (14) $ (173) $ 170,969
( in thousands of Canadian dollars) Year ended november 30, 2013
balance, beginning of year
Recognized in income
Recognized in contributed
surplusRecognized
in oCIbalance,
end of year
deferred income tax assets
expenses deductible in future periods $ 7,582 $ (855) $ – $ – $ 6,727
Property and equipment 3,461 (1,024) – – 2,437
Loss carryforwards 439 196 – – 635
investments 970 (384) – (270) 316
Other credits and carryforwards 69 129 – – 198
$ 12,521 $ (1,938) $ – $ (270) $ 10,313
deferred income tax liabilities
Management contracts and other intangibles $ 160,892 $ (4,359) $ – $ – $ 156,533
deferred sales commissions 33,461 (6,047) – – 27,414
Other 1,700 44 – – 1,744
$ 196,053 $ (10,362) $ – $ – $ 185,691
net deferred income tax liabilities $ 183,532 $ (8,424) $ – $ 270 $ 175,378
(b) deferred income tax assets are recognized for tax loss carryforwards to the extent that the realization of the related tax benefit through future taxable profits is probable. the ability to realize the tax benefits of these losses is dependent upon a number of factors, including the future profitability of operations in the jurisdictions in which the tax losses arose. As at november 30, 2014, the Company recognized deferred income tax assets of $0.2 million related to $0.6 million of non-capital losses. deferred income tax assets have not been recognized for $17.5 million of capital losses carryforward that have no expiry date and $0.4 million of non-capital losses carried forward.
As at november 30, 2014, the amount of temporary differences associated with investment in S&WHL for which deferred income tax assets have not been recognized is $13.7 million (2013 – $20.5 million).
Table of Contents
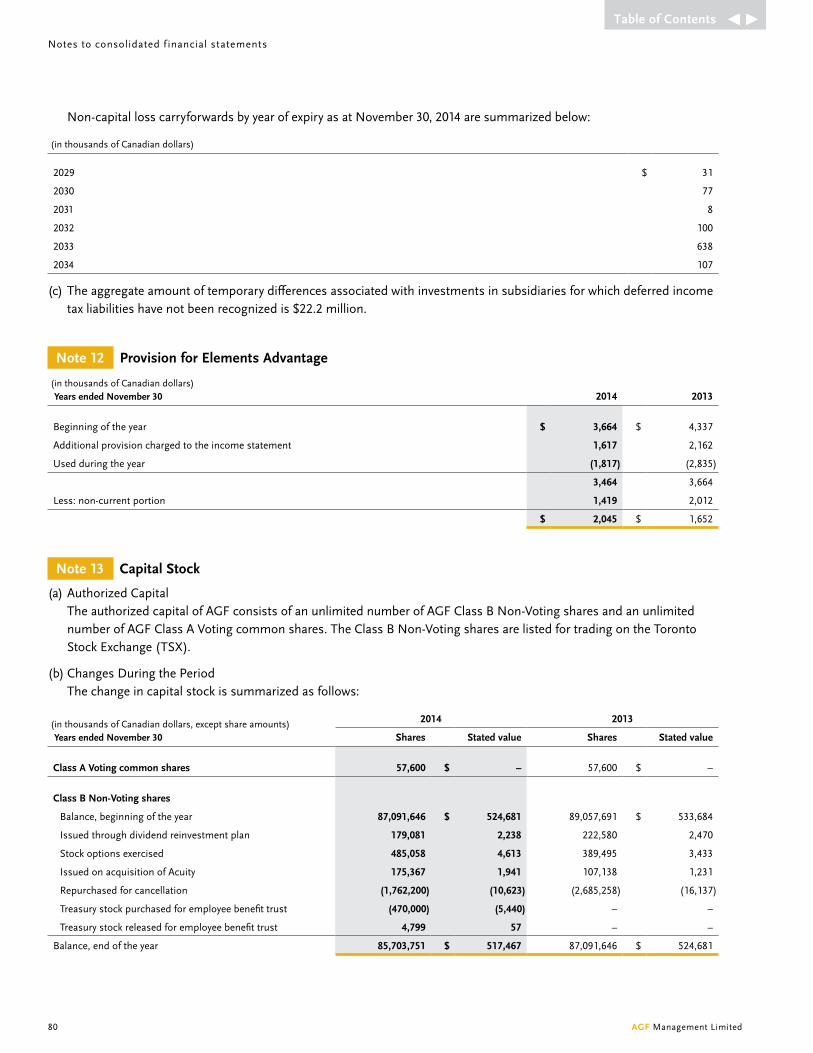
non-capital loss carryforwards by year of expiry as at november 30, 2014 are summarized below:
(in thousands of Canadian dollars)
2029 $ 31
2030 77
2031 8
2032 100
2033 638
2034 107
(c) the aggregate amount of temporary differences associated with investments in subsidiaries for which deferred income tax liabilities have not been recognized is $22.2 million.
note 12 provision for elements Advantage
( in thousands of Canadian dollars) Years ended november 30 2014 2013
Beginning of the year $ 3,664 $ 4,337
Additional provision charged to the income statement 1,617 2,162
Used during the year (1,817) (2,835)
3,464 3,664
Less: non-current portion 1,419 2,012
$ 2,045 $ 1,652
note 13 Capital stock
(a) Authorized Capital the authorized capital of AGF consists of an unlimited number of AGF Class B non-voting shares and an unlimited
number of AGF Class A voting common shares. the Class B non-voting shares are listed for trading on the toronto Stock exchange (tSX).
(b) Changes during the Period the change in capital stock is summarized as follows:
( in thousands of Canadian dollars, except share amounts) Years ended november 30
2014 2013
shares stated value shares stated value
Class A voting common shares 57,600 $ – 57,600 $ –
Class b non-voting shares
Balance, beginning of the year 87,091,646 $ 524,681 89,057,691 $ 533,684
issued through dividend reinvestment plan 179,081 2,238 222,580 2,470
Stock options exercised 485,058 4,613 389,495 3,433
issued on acquisition of Acuity 175,367 1,941 107,138 1,231
Repurchased for cancellation (1,762,200) (10,623) (2,685,258) (16,137)
treasury stock purchased for employee benefit trust (470,000) (5,440) – –
treasury stock released for employee benefit trust 4,799 57 – –
Balance, end of the year 85,703,751 $ 517,467 87,091,646 $ 524,681
notes to consolidated f inancial statements
80 AGF Management Limited
Table of Contents

AGF Management Limited 81
(c) Class B non-voting Shares Purchased for Cancellation AGF has obtained applicable regulatory approval to purchase for cancellation, from time to time, certain of its Class B
non-voting shares through the facilities of the tSX (or as otherwise permitted by the tSX). AGF relies on an automatic purchase plan during the normal course issuer bid. the automatic purchase plan allows for purchases by AGF of its Class B non-voting shares during certain pre-determined black-out periods, subject to certain parameters. Outside of these pre-determined black-out periods, shares will be purchased in accordance with management’s discretion. Under its normal course issuer bid, AGF may purchase up to 10% of the public float outstanding on the date of the receipt of regulatory approval or up to 6,904,647 shares through to February 3, 2015. Subject to regulatory approval, the Company will apply for renewal of its normal course issuer bid. during the year ended november 30, 2014, under AGF’s previous normal course issuer bid, 1,762,200 (2013 – 2,685,258) Class B non-voting shares were repurchased at a cost of $22.1 million (2013 – $30.7 million) and the excess paid of $11.5 million (2013 – $14.5 million) over the recorded capital stock value of the shares repurchased for cancellation was charged to retained earnings.
(d) Class B non-voting Shares Purchased as treasury Stock for employee Benefit trust during the year ended november 30, 2014, 470,000 (2013 – nil) Class B non-voting shares were purchased for the
employee benefit trust. Shares purchased for the trust are also purchased under the Company’s normal course issuer bid and recorded as a reduction to capital stock. during the year ended november 30, 2014, 4,799 (2013 – nil) Class B non-voting shares purchased as treasury stock were released. As at november 30, 2014, 465,201 (2013 – nil) Class B non-voting shares were held as treasury stock. Refer to note 3.14 for additional information.
note 14 Accumulated other Comprehensive Income (loss)
(in thousands of Canadian dollars)
Foreign currency
translation
Available for sale
securities Cash flow
hedge Total
opening composition of accumulated other comprehensive income at november 30, 2012
Accumulated other comprehensive income (loss) $ (673) $ 3,265 $ (4,098) $ (1,506)
income tax recovery (expense) – (432) 1,086 654
balance, november 30, 2012 (673) 2,833 (3,012) (852)
transactions during the year ended november 30, 2013
Other comprehensive income (loss) 7,298 (111) 1,052 8,239
income tax recovery (expense) – 8 (278) (270)
balance, november 30, 2013 6,625 2,730 (2,238) 7,117
transactions during the year ended november 30, 2014
Other comprehensive income 2,717 358 731 3,806
income tax recovery (expense) – 367 (194) 173
balance, november 30, 2014 $ 9,342 $ 3,455 $ (1,701) $ 11,096
Table of Contents

note 15 Fair value Adjustments and other Income
( in thousands of Canadian dollars) Years ended november 30 2014 2013
Fair value adjustment related to investment in AGF mutual funds (note 4) $ 327 $ 2,804
Fair value adjustment related to acquisition consideration payable (note 7(a)) 422 (1,417)
Fair value adjustment related to put agreement with non-controlling shareholders (note 18(c)) – 677
Fair value adjustment related to long-term investments (note 5(b)) (83) –
distributions from long-term investments (note 5(b)) 1,083 –
interest income 4,239 6,136
Other 481 4,181
$ 6,469 $ 12,381
during the year ended november 30, 2014, the Company recognized nil (2013 – $3.7 million) of one-time other income.
note 16 expenses by nature
( in thousands of Canadian dollars) Years ended november 30 2014 2013
Selling, general and administrative
employee benefit expense $ 103,770 $ 111,582
Sales and marketing 13,645 12,637
information technology and facilities 23,745 23,339
Professional fees 16,031 17,711
Fund absorption and other fund costs 15,871 21,467
Other 1,977 4,047
$ 175,039 $ 190,783
note 17 employee benefit expense
( in thousands of Canadian dollars) Years ended november 30 2014 2013
Salaries and benefits, including restructuring and termination $ 98,167 $ 97,723
Stock option plans 1,094 1,612
Share purchase plan 1,169 1,029
RSU and PSU plans 1,843 8,863
dSU plan (157) 1,326
Partners incentive Plan 1,654 1,029
$ 103,770 $ 111,582
notes to consolidated f inancial statements
82 AGF Management Limited
Table of Contents
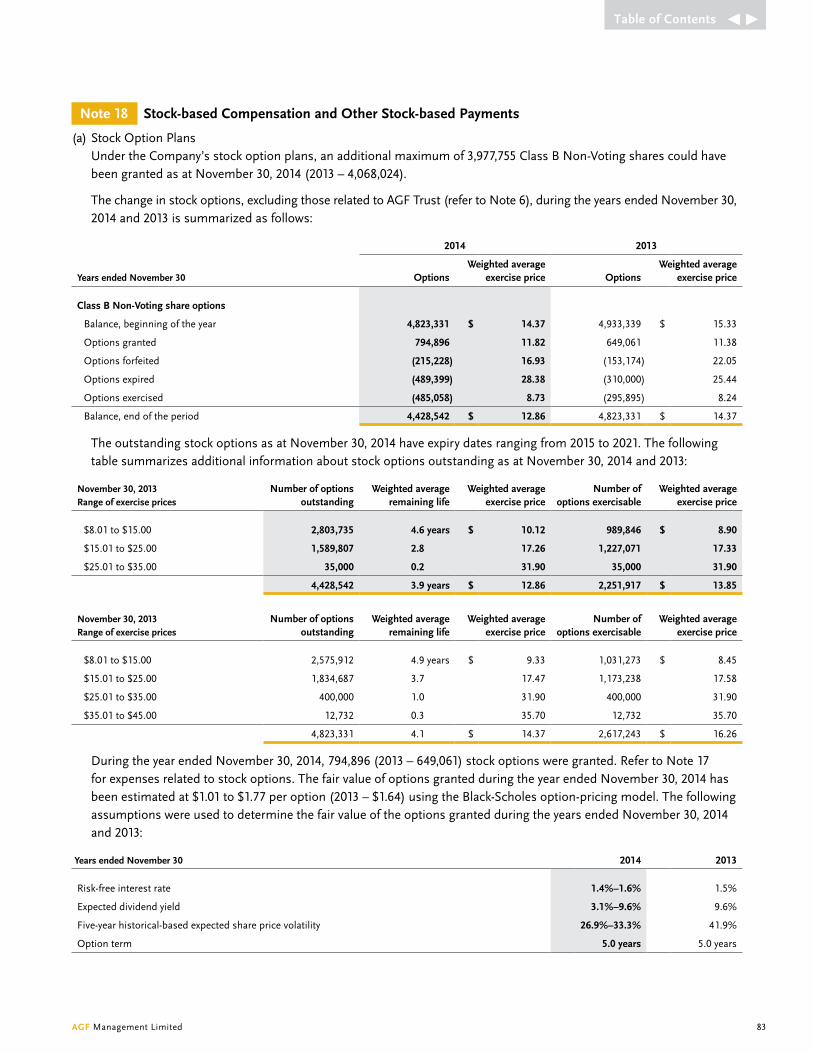
AGF Management Limited 83
note 18 stock-based Compensation and other stock-based payments
(a) Stock Option Plans Under the Company’s stock option plans, an additional maximum of 3,977,755 Class B non-voting shares could have
been granted as at november 30, 2014 (2013 – 4,068,024).
the change in stock options, excluding those related to AGF trust (refer to note 6), during the years ended november 30, 2014 and 2013 is summarized as follows:
2014 2013
Years ended november 30 options weighted average
exercise price options weighted average
exercise price
Class b non-voting share options
Balance, beginning of the year 4,823,331 $ 14.37 4,933,339 $ 15.33
Options granted 794,896 11.82 649,061 11.38
Options forfeited (215,228) 16.93 (153,174) 22.05
Options expired (489,399) 28.38 (310,000) 25.44
Options exercised (485,058) 8.73 (295,895) 8.24
Balance, end of the period 4,428,542 $ 12.86 4,823,331 $ 14.37
the outstanding stock options as at november 30, 2014 have expiry dates ranging from 2015 to 2021. the following table summarizes additional information about stock options outstanding as at november 30, 2014 and 2013:
november 30, 2013 Range of exercise prices
number of options outstanding
weighted average remaining life
weighted average exercise price
number of options exercisable
weighted average exercise price
$8.01 to $15.00 2,803,735 4.6 years $ 10.12 989,846 $ 8.90
$15.01 to $25.00 1,589,807 2.8 17.26 1,227,071 17.33
$25.01 to $35.00 35,000 0.2 31.90 35,000 31.90
4,428,542 3.9 years $ 12.86 2,251,917 $ 13.85
november 30, 2013 Range of exercise prices
number of options outstanding
weighted average remaining life
weighted average exercise price
number of options exercisable
weighted average exercise price
$8.01 to $15.00 2,575,912 4.9 years $ 9.33 1,031,273 $ 8.45
$15.01 to $25.00 1,834,687 3.7 17.47 1,173,238 17.58
$25.01 to $35.00 400,000 1.0 31.90 400,000 31.90
$35.01 to $45.00 12,732 0.3 35.70 12,732 35.70
4,823,331 4.1 $ 14.37 2,617,243 $ 16.26
during the year ended november 30, 2014, 794,896 (2013 – 649,061) stock options were granted. Refer to note 17 for expenses related to stock options. the fair value of options granted during the year ended november 30, 2014 has been estimated at $1.01 to $1.77 per option (2013 – $1.64) using the Black-Scholes option-pricing model. the following assumptions were used to determine the fair value of the options granted during the years ended november 30, 2014 and 2013:
Years ended november 30 2014 2013
Risk-free interest rate 1.4%–1.6% 1.5%
expected dividend yield 3.1%–9.6% 9.6%
Five-year historical-based expected share price volatility 26.9%–33.3% 41.9%
Option term 5.0 years 5.0 years
Table of Contents
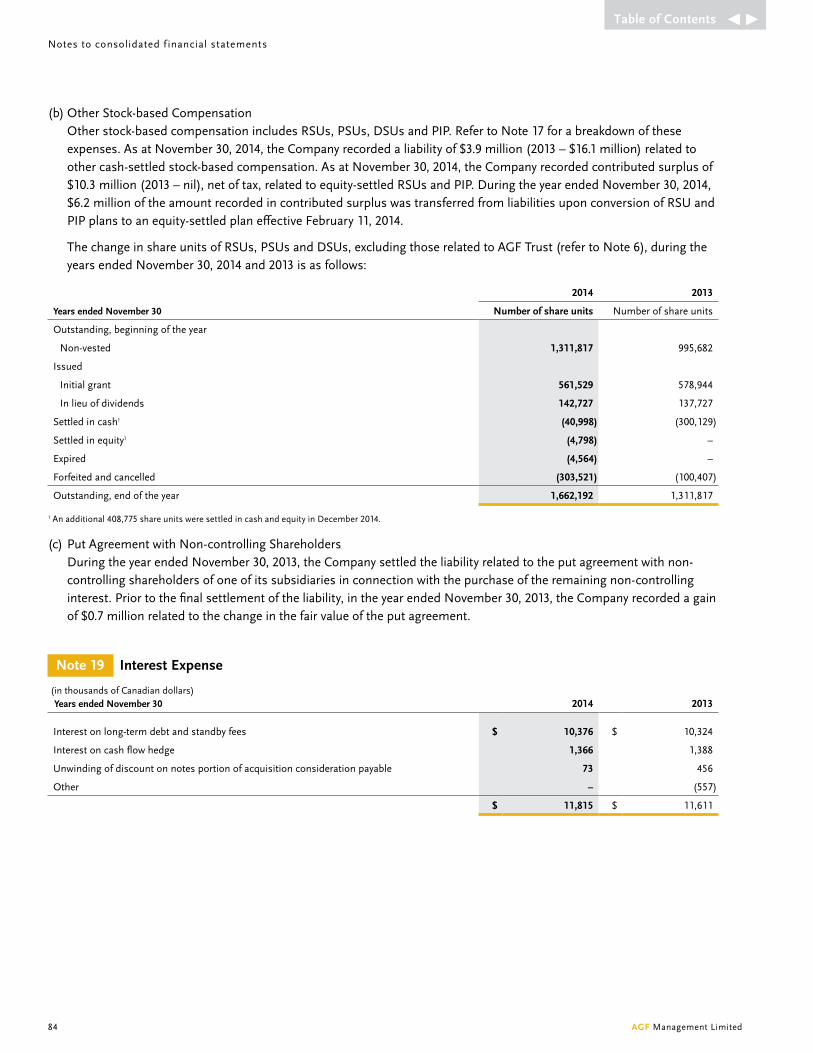
(b) Other Stock-based Compensation Other stock-based compensation includes RSUs, PSUs, dSUs and PiP. Refer to note 17 for a breakdown of these
expenses. As at november 30, 2014, the Company recorded a liability of $3.9 million (2013 – $16.1 million) related to other cash-settled stock-based compensation. As at november 30, 2014, the Company recorded contributed surplus of $10.3 million (2013 – nil), net of tax, related to equity-settled RSUs and PiP. during the year ended november 30, 2014, $6.2 million of the amount recorded in contributed surplus was transferred from liabilities upon conversion of RSU and PiP plans to an equity-settled plan effective February 11, 2014.
the change in share units of RSUs, PSUs and dSUs, excluding those related to AGF trust (refer to note 6), during the years ended november 30, 2014 and 2013 is as follows:
2014 2013
Years ended november 30 number of share units number of share units
Outstanding, beginning of the year
non-vested 1,311,817 995,682
issued
initial grant 561,529 578,944
in lieu of dividends 142,727 137,727
Settled in cash1 (40,998) (300,129)
Settled in equity1 (4,798) –
expired (4,564) –
Forfeited and cancelled (303,521) (100,407)
Outstanding, end of the year 1,662,192 1,311,817
1 An additional 408,775 share units were settled in cash and equity in december 2014.
(c) Put Agreement with non-controlling Shareholders during the year ended november 30, 2013, the Company settled the liability related to the put agreement with non-
controlling shareholders of one of its subsidiaries in connection with the purchase of the remaining non-controlling interest. Prior to the final settlement of the liability, in the year ended november 30, 2013, the Company recorded a gain of $0.7 million related to the change in the fair value of the put agreement.
note 19 Interest expense
( in thousands of Canadian dollars) Years ended november 30 2014 2013
interest on long-term debt and standby fees $ 10,376 $ 10,324
interest on cash flow hedge 1,366 1,388
Unwinding of discount on notes portion of acquisition consideration payable 73 456
Other – (557)
$ 11,815 $ 11,611
notes to consolidated f inancial statements
84 AGF Management Limited
Table of Contents

AGF Management Limited 85
note 20 Income Tax expense
(a) the following are major components of income tax expense from continuing operations:
(in thousands of Canadian dollars) Years ended november 30 2014 2013
Current income tax
Current income tax on profits for the year $ 21,793 $ 23,438
Adjustments in respect of prior years 38 307
Accrual with respect to the transfer pricing tax audit, including one-time true-up 2,000 27,100
Other 439 1,128
total current income tax expense $ 24,270 $ 51,973
deferred income tax
Origination and reversal of temporary differences $ (4,308) $ (8,315)
Adjustments in respect of prior years 6 (66)
Other 80 (43)
total deferred income tax benefit (4,222) (8,424)
income tax expense $ 20,048 $ 43,549
(b) the Company’s effective income tax rate for continuing operations is comprised as follows:
( in thousands of Canadian dollars) Years ended november 30 2014 2013
Canadian corporate tax rate 26.5% 26.5%
Rate differential on earnings of subsidiaries (1.1) (1.7)
tax exempt investment income (4.3) (4.3)
Accrual with respect to the transfer pricing tax audit, including one-time true-up 2.5 41.1
non-deductible expenses 0.9 1.4
impairment and other 0.8 3.0
effective income tax rate 25.3% 66.0%
the income tax expense related to income from discontinued operations for the year ended november 30, 2014 was $1.0 million (2013 – nil).
(c) the Company’s statutory corporate tax rate was 26.5% (2013 – 26.5%).
(d) the tax charged (credited) relating to components of other comprehensive income, excluding discontinued operations, is as follows:
2014 2013
( in thousands of Canadian dollars) Years ended november 30
Current income tax
deferred income tax
Current income tax
deferred income tax
Fair value gains on available for sale investments $ – $ 31 $ – $ (8)
Cash flow hedge – 194 – 278
Other – (398) – –
$ – $ (173) $ – $ 270
(e) the tax credited relating to components of equity is as follows:
( in thousands of Canadian dollars) Years ended november 30 2014 2013
equity-settled share-based compensation $ (14) $ –
Table of Contents
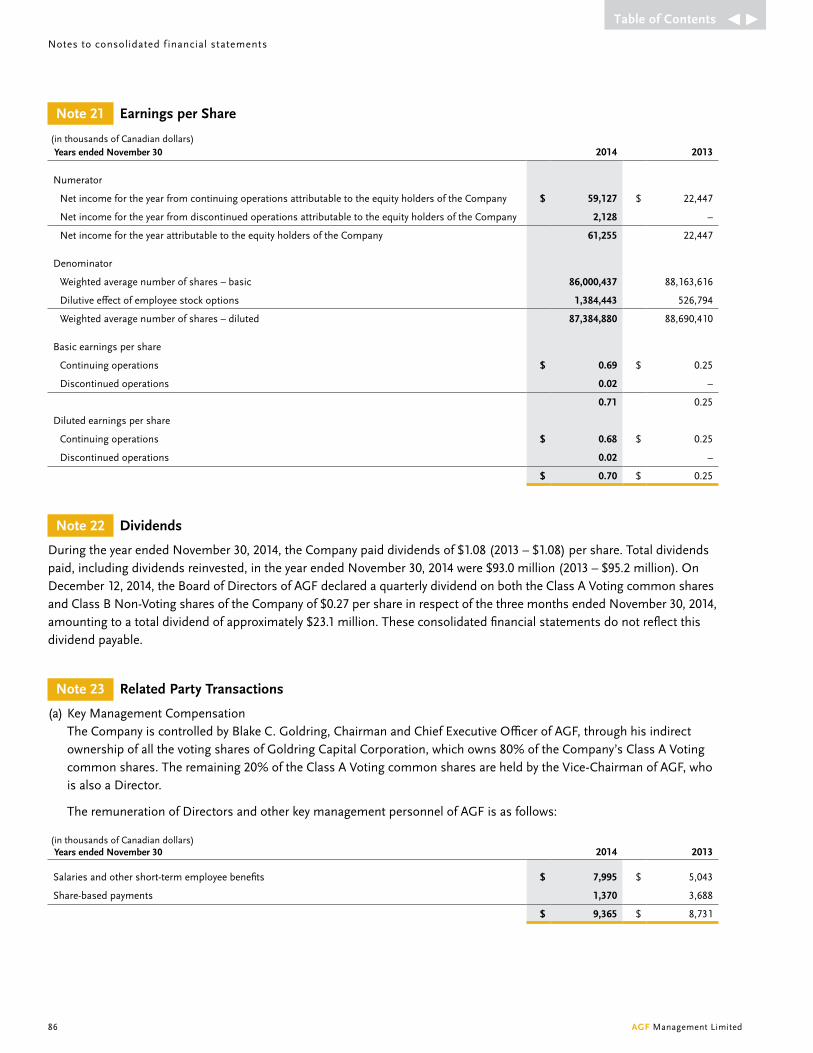
note 21 earnings per share
( in thousands of Canadian dollars) Years ended november 30 2014 2013
numerator
net income for the year from continuing operations attributable to the equity holders of the Company $ 59,127 $ 22,447
net income for the year from discontinued operations attributable to the equity holders of the Company 2,128 –
net income for the year attributable to the equity holders of the Company 61,255 22,447
denominator
Weighted average number of shares – basic 86,000,437 88,163,616
dilutive effect of employee stock options 1,384,443 526,794
Weighted average number of shares – diluted 87,384,880 88,690,410
Basic earnings per share
Continuing operations $ 0.69 $ 0.25
discontinued operations 0.02 –
0.71 0.25
diluted earnings per share
Continuing operations $ 0.68 $ 0.25
discontinued operations 0.02 –
$ 0.70 $ 0.25
note 22 dividends
during the year ended november 30, 2014, the Company paid dividends of $1.08 (2013 – $1.08) per share. total dividends paid, including dividends reinvested, in the year ended november 30, 2014 were $93.0 million (2013 – $95.2 million). On december 12, 2014, the Board of directors of AGF declared a quarterly dividend on both the Class A voting common shares and Class B non-voting shares of the Company of $0.27 per share in respect of the three months ended november 30, 2014, amounting to a total dividend of approximately $23.1 million. these consolidated financial statements do not reflect this dividend payable.
note 23 Related party Transactions
(a) Key Management Compensation the Company is controlled by Blake C. Goldring, Chairman and Chief executive Officer of AGF, through his indirect
ownership of all the voting shares of Goldring Capital Corporation, which owns 80% of the Company’s Class A voting common shares. the remaining 20% of the Class A voting common shares are held by the vice-Chairman of AGF, who is also a director.
the remuneration of directors and other key management personnel of AGF is as follows:
( in thousands of Canadian dollars) Years ended november 30 2014 2013
Salaries and other short-term employee benefits $ 7,995 $ 5,043
Share-based payments 1,370 3,688
$ 9,365 $ 8,731
notes to consolidated f inancial statements
86 AGF Management Limited
Table of Contents
AGF Management Limited 87
(b) Agreements with Mutual Funds Under iFRS, entities are deemed to be related parties if one entity provides key management personnel services to
another entity. As such, AGF investments inc. is deemed for iFRS purposes to be a related party to AGF Funds (the Funds) since it is the manager of the Funds.
the Company receives management and advisory fees from the Funds in accordance with the respective agreements between the Funds and the Company. in return, the Company is responsible for management and investment advisory services and all costs connected with the distribution of securities of the Funds. Substantially all the management and advisory fees the Company earned in the years ended november 30, 2014 and 2013 were from the Funds. As at november 30, 2014, the Company had $19.4 million (2013 – $27.1 million) receivable from the Funds. the Company also acts as trustee for the Funds that are mutual fund trusts.
the aggregate unitholder services costs absorbed and management and advisory fees waived by the Company during the year ended november 30, 2014 on behalf of the Funds were approximately $3.8 million (2013 – $9.8 million).
note 24 Financial Risk management
(a) Financial Risk Factors the Company’s activities expose it to a variety of financial risks: market risk (including foreign exchange risk, interest
rate risk and price risk), credit risk and liquidity risk. in the normal course of business, the Company manages these risks as they arise as a result of its use of financial instruments.
market Risk (i) Foreign exchange Risk the Company operates internationally and is exposed to foreign exchange risk on its foreign currency denominated
financial instruments, of which it has limited use, thus resulting in minimal foreign exchange risk.
(ii) interest Rate Risk the Company’s cash flow interest rate risk arises due to its floating-rate debt and cash balances. the Company
entered into an interest swap to manage interest rate exposure on a portion of its long-term debt. As at november 30, 2014, if interest rates had been 1% higher/lower with all other variables held constant, profit before tax for the year would have been $1.9 million (2013 – $1.9 million) lower/higher, mainly as a result of higher/lower interest expense on floating-rate borrowings.
(iii) Price Risk the Company is not exposed to commodity price risk. the Company is exposed to equity securities price risk on
certain equity securities held by the Company, on certain derivative positions, on its consideration payable that is associated with future share payments and long-term investments in infrastructure funds. the Company’s investments that have price risk include mutual funds managed by the Company of $17.7 million (2013 – $10.8 million), equity securities of $1.5 million (2013 – $1.2 million) and long-term investments of $19.7 million (2013 – nil) as at november 30, 2014. As at november 30, 2014, the effect of a 10% decline or increase in the value of investments would result in a $3.7 million (2013 – $1.1 million) pre-tax unrealized gain or loss in net income and a $0.1 million (2013 – $0.1 million) pre-tax unrealized gain or loss to other comprehensive income.
Credit Risk Credit risk arises from cash and cash equivalents, investments, accounts receivable and other assets. Cash and cash
equivalents consist primarily of highly liquid temporary deposits with Canadian banks, an irish bank and non-irish banks in ireland, as well as bank term deposits. the Company’s overall credit risk strategy and credit risk policy are developed by senior management and further refined at the business unit level, through the use of policies, processes and internal controls designed to promote business activities, while ensuring these activities are within the standards of risk tolerance levels.
Table of Contents
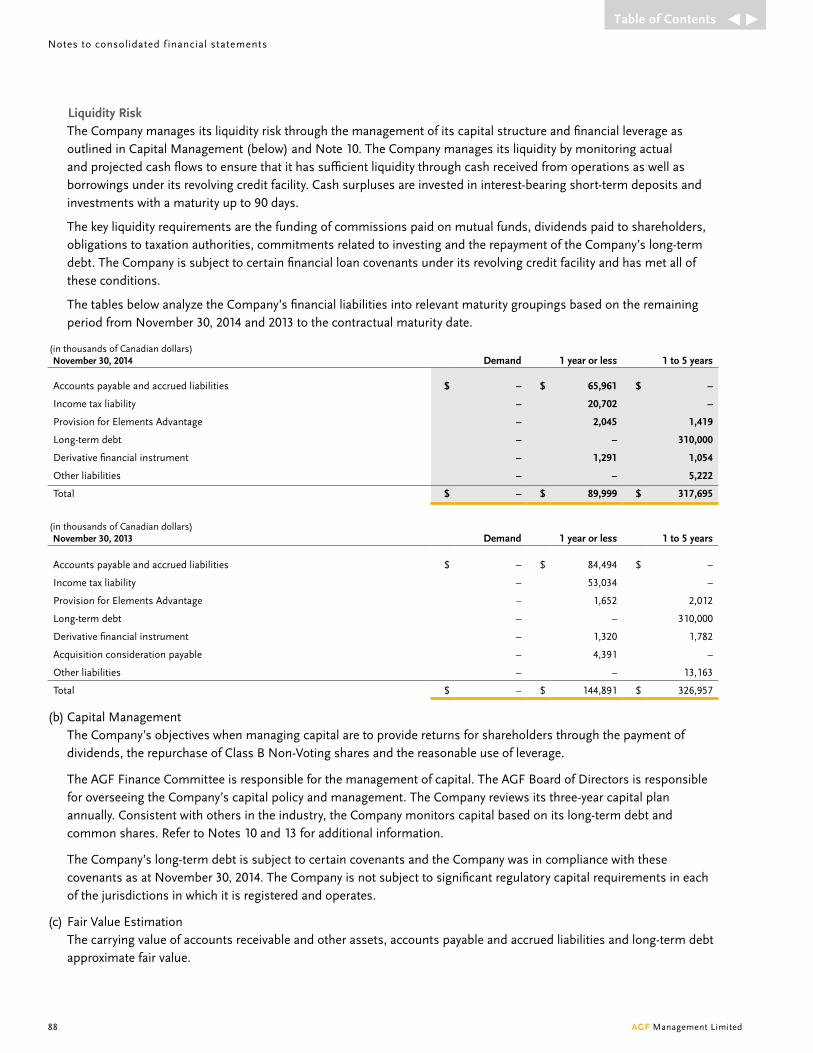
liquidity Risk the Company manages its liquidity risk through the management of its capital structure and financial leverage as
outlined in Capital Management (below) and note 10. the Company manages its liquidity by monitoring actual and projected cash flows to ensure that it has sufficient liquidity through cash received from operations as well as borrowings under its revolving credit facility. Cash surpluses are invested in interest-bearing short-term deposits and investments with a maturity up to 90 days.
the key liquidity requirements are the funding of commissions paid on mutual funds, dividends paid to shareholders, obligations to taxation authorities, commitments related to investing and the repayment of the Company’s long-term debt. the Company is subject to certain financial loan covenants under its revolving credit facility and has met all of these conditions.
the tables below analyze the Company’s financial liabilities into relevant maturity groupings based on the remaining period from november 30, 2014 and 2013 to the contractual maturity date.
( in thousands of Canadian dollars) november 30, 2014 demand 1 year or less 1 to 5 years
Accounts payable and accrued liabilities $ – $ 65,961 $ –
income tax liability – 20,702 –
Provision for elements Advantage – 2,045 1,419
Long-term debt – – 310,000
derivative financial instrument – 1,291 1,054
Other liabilities – – 5,222
total $ – $ 89,999 $ 317,695
( in thousands of Canadian dollars) november 30, 2013 demand 1 year or less 1 to 5 years
Accounts payable and accrued liabilities $ – $ 84,494 $ –
income tax liability – 53,034 –
Provision for elements Advantage – 1,652 2,012
Long-term debt – – 310,000
derivative financial instrument – 1,320 1,782
Acquisition consideration payable – 4,391 –
Other liabilities – – 13,163
total $ – $ 144,891 $ 326,957
(b) Capital Management the Company’s objectives when managing capital are to provide returns for shareholders through the payment of
dividends, the repurchase of Class B non-voting shares and the reasonable use of leverage.
the AGF Finance Committee is responsible for the management of capital. the AGF Board of directors is responsible for overseeing the Company’s capital policy and management. the Company reviews its three-year capital plan annually. Consistent with others in the industry, the Company monitors capital based on its long-term debt and common shares. Refer to notes 10 and 13 for additional information.
the Company’s long-term debt is subject to certain covenants and the Company was in compliance with these covenants as at november 30, 2014. the Company is not subject to significant regulatory capital requirements in each of the jurisdictions in which it is registered and operates.
(c) Fair value estimation the carrying value of accounts receivable and other assets, accounts payable and accrued liabilities and long-term debt
approximate fair value.
notes to consolidated f inancial statements
88 AGF Management Limited
Table of Contents
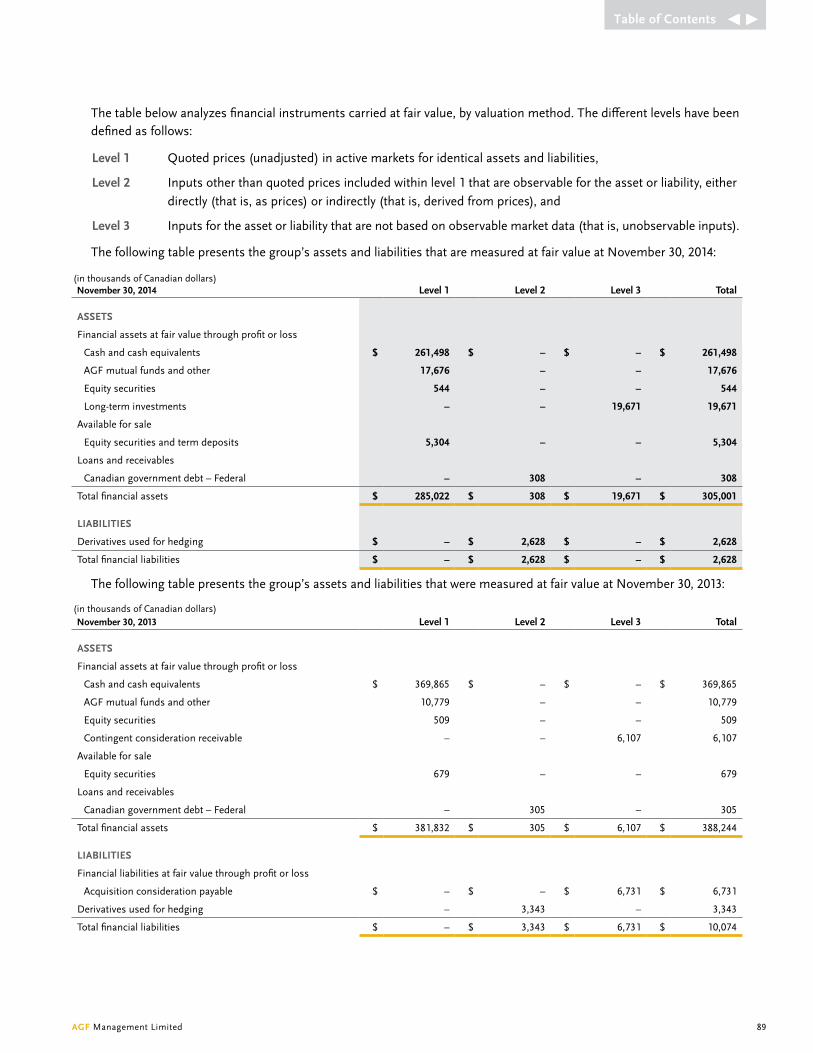
AGF Management Limited 89
the table below analyzes financial instruments carried at fair value, by valuation method. the different levels have been defined as follows:
level 1 Quoted prices (unadjusted) in active markets for identical assets and liabilities,
level 2 inputs other than quoted prices included within level 1 that are observable for the asset or liability, either directly (that is, as prices) or indirectly (that is, derived from prices), and
level 3 inputs for the asset or liability that are not based on observable market data (that is, unobservable inputs).
the following table presents the group’s assets and liabilities that are measured at fair value at november 30, 2014:
( in thousands of Canadian dollars) november 30, 2014 level 1 level 2 level 3 Total
AsseTs
Financial assets at fair value through profit or loss
Cash and cash equivalents $ 261,498 $ – $ – $ 261,498
AGF mutual funds and other 17,676 – – 17,676
equity securities 544 – – 544
Long-term investments – – 19,671 19,671
Available for sale
equity securities and term deposits 5,304 – – 5,304
Loans and receivables
Canadian government debt – Federal – 308 – 308
total financial assets $ 285,022 $ 308 $ 19,671 $ 305,001
lIAbIlITIes
derivatives used for hedging $ – $ 2,628 $ – $ 2,628
total financial liabilities $ – $ 2,628 $ – $ 2,628
the following table presents the group’s assets and liabilities that were measured at fair value at november 30, 2013:
( in thousands of Canadian dollars) november 30, 2013 level 1 level 2 level 3 Total
AsseTs
Financial assets at fair value through profit or loss
Cash and cash equivalents $ 369,865 $ – $ – $ 369,865
AGF mutual funds and other 10,779 – – 10,779
equity securities 509 – – 509
Contingent consideration receivable – – 6,107 6,107
Available for sale
equity securities 679 – – 679
Loans and receivables
Canadian government debt – Federal – 305 – 305
total financial assets $ 381,832 $ 305 $ 6,107 $ 388,244
lIAbIlITIes
Financial liabilities at fair value through profit or loss
Acquisition consideration payable $ – $ – $ 6,731 $ 6,731
derivatives used for hedging – 3,343 – 3,343
total financial liabilities $ – $ 3,343 $ 6,731 $ 10,074
Table of Contents

the fair value of financial instruments traded in active markets is determined using the quoted prices where they represent those at which regularly and recently occurring transactions take place.
Level 1 instruments include listed equity securities on major exchanges, investments in AGF mutual funds, highly liquid temporary deposits with Canadian banks, an irish bank and non-irish banks in ireland, as well as bank term deposits.
Level 2 instruments include derivative instruments with major Canadian chartered banks and Canadian federal government debt. the fair value of derivatives used to manage interest rate exposure on deposits and long-term debt is calculated through discounting future expected cash flows using the BA-based swap curve. Since the BA-based swap curve is an observable input, these financial instruments are considered level 2. Canadian federal government debt is measured at amortized cost and its fair value approximates its carrying value due to its short-term nature.
Level 3 instruments include long-term investments related to the alternative asset management platform, acquisition consideration payable and contingent consideration receivable. instruments classified in this category have a parameter input or inputs that are unobservable and that have a more than insignificant impact on either the fair value of the instrument or the profit or loss of the instrument.
the fair value of the long-term investments is calculated using the Company’s percentage ownership and the fair market value of the investment derived from audited financial information provided by investees.
the acquisition consideration payable was settled on February 1, 2014 and comprised deferred cash payments and Class e exchangeable preferred shares that were subject to an adjustment based on Acuity’s net sales of institutional assets under management between the date of acquisition and the payment or redemption date of these preferred shares. the Class e exchangeable preferred shares were settled by the issuance of a variable number of AGF Class B non-voting shares, the number of which was determined by reference to a fixed exchange ratio.
the contingent consideration receivable was determined based on an early settlement agreement with the purchaser for $10.0 million. during the year ended november 30, 2014, the contingent consideration receivable was transferred from level 3 to level 2 as the amount became fixed and guaranteed upon the signing of the early settlement agreement, at which point it was no longer contingent and thus reclassified to accounts receivable. the amount was settled on June 4, 2014. Refer to note 6 for additional information.
For the year ended november 30, 2013, level 3 instruments also included the nCi put liability as noted in note 18. the fair value of the nCi put liability was determined as the difference between the specified price determined in part by reference to earnings and a market multiple based on precedent transactions.
the following table presents changes in level 3 instruments for the year ended november 30, 2014:
(in thousands of Canadian dollars)long-term
investments
Acquisition consideration
payable
Contingent consideration
receivable
Balance at december 1, 2013 $ – $ 6,731 $ 6,107
Purchase of investment, net of return of capital 19,754 – –
Gains and losses recognized in profit or loss (83) (350) 28
Gain recognized in profit or loss as discontinued operations1 – – 3,865
Consideration paid – (6,381) –
Reclassification to accounts receivable – – (10,000)
Balance at november 30, 2014 $ 19,671 $ – $ –
1 Before taxes of $1.0 million.
notes to consolidated f inancial statements
90 AGF Management Limited
Table of Contents

AGF Management Limited 91
the following table presents changes in level 3 instruments for the year ended november 30, 2013:
(in thousands of Canadian dollars) nCI put liability
Acquisition consideration
payable
Contingent consideration
receivable
Balance at december 1, 2012 $ 6,665 $ 8,802 $ 5,941
Gains and losses recognized in profit or loss (677) 1,873 166
exercised put (5,988) – –
Consideration paid – (3,944) –
Balance at november 30, 2013 $ – $ 6,731 $ 6,107
note 25 offsetting Financial Instruments
Financial assets and liabilities are offset and the net amount reported in the consolidated statement of financial position where AGF currently has a legally enforceable right to set off the recognized amounts and there is an intention to settle on a net basis or realize the asset and settle the liability simultaneously. in the normal course of business, AGF has entered into various master netting agreements or other similar arrangements that do not meet the criteria for offsetting in the consolidated statement of financial position but still allow for the related amounts to be set off in certain circumstances, such as default or bankruptcy.
the following table presents the recognized financial instruments that are offset or subject to enforceable master netting arrangements or other similar agreements but not offset, as at november 30, 2014 and 2013, and shows what the net impact would be on the Company’s consolidated statement of financial position if all set-off rights were exercised:
( in thousands of Canadian dollars) november 30, 2014 Amounts offset
Amounts not offset net
Gross asset
Gross liability offset
net amount presented
FInAnCIAl AsseTs
Cash and cash equivalents (note 25(a),(b),(c)) $ 764,689 $ (503,191) $ 261,498 $ (163,118) $ 98,380
total financial assets $ 764,689 $ (503,191) $ 261,498 $ (163,118) $ 98,380
Amounts offsetAmounts not offset net
Gross liability
Gross asset offset
net amount presented
FInAnCIAl lIAbIlITIes
Long-term debt (note 25(b)) $ 308,199 $ – $ 308,199 $ (160,490) $ 147,709
derivative financial instrument (note 25(c)) 2,628 – 2,628 (2,628) –
total financial liabilities $ 310,827 $ – $ 310,827 $ (163,118) $ 147,709
Table of Contents

( in thousands of Canadian dollars) november 30, 2013 Amounts offset
Amounts not offset net
Gross asset
Gross liability offset
net amount presented
FInAnCIAl AsseTs
Cash and cash equivalents (note 25(a),(b),(c)) $ 863,283 $ (493,418) $ 369,865 $ (287,327) $ 82,538
total financial assets $ 863,283 $ (493,418) $ 369,865 $ (287,327) $ 82,538
Amounts offsetAmounts not offset net
Gross liability
Gross asset offset
net amount presented
FInAnCIAl lIAbIlITIes
Long-term debt (note 25(b)) $ 307,888 $ – $ 307,888 $ (283,983) $ 23,905
derivative financial instrument (note 25(c)) 3,344 – 3,344 (3,344) –
total financial liabilities $ 311,232 $ – $ 311,232 $ (287,327) $ 23,905
(a) Based on an agreement with a Canadian chartered bank, certain bank deposits are pooled into one concentration account and offset with bank overdrafts of the Company and its subsidiaries that are part of the pooling agreement. the net amount is included in cash and cash equivalents in the consolidated statement of financial position.
(b) the Company, through its subsidiary AGF investments inc. (AGFii), has a loan agreement with two Canadian chartered banks. Based on this agreement, in the event of a default or bankruptcy, the creditors have the right to offset the liability against any deposits of the Company and certain subsidiaries held by the creditors. these cash deposits are recorded under cash and cash equivalents in the consolidated statement of financial position.
(c) the Company, through its subsidiary AGFii, has entered into an interest rate swap transaction with a Canadian chartered bank. Under the terms of this agreement, the swap liability may be offset against AGFii’s cash deposits held in the counterparty’s bank, which are recorded under cash and cash equivalents in the consolidated statement of financial position. As the swap transaction is with one of the creditors mentioned in note 25(b), the cash deposits of AGFii held with this creditor have been offset against both financial liabilities in the table above.
note 26 Contingencies
(a) the Company believes that it has adequately provided for income taxes based on all of the information that is currently available. the calculation of income taxes in many cases, however, requires significant judgement in interpreting tax rules and regulations. the Company’s tax filings are subject to audits, which could materially change the amount of the current and deferred income tax assets and liabilities, and could, in certain circumstances, result in the assessment of interest and penalties.
in november 2013, the Company received a notice of reassessment (nOR) from the Canada Revenue Agency (CRA) relating to the transfer pricing and allocation of income between one of the Company’s Canadian legal entities and a foreign subsidiary, which would increase the Company’s taxes payable from its original tax filings by $10.0 million, $10.5 million and $15.4 million (before the application of any interest and penalties of $21.6 million) for its 2005, 2006 and 2007 fiscal years, respectively. in november 2014, the Company has also received an nOR from the CRA relating to the same matter, which would increase the Company’s taxes payable from its original tax filings by $13.6 million (before the application of any interest and penalties of $6.3 million) for its 2008 fiscal year.
notes to consolidated f inancial statements
92 AGF Management Limited
Table of Contents
AGF Management Limited 93
the Company strongly disagrees with the CRA’s position and filed an objection to the nOR for 2005, 2006 and 2007 in February 2014 and will also object to the nOR for 2008. in connection with the filing of an objection to the nOR for the 2005, 2006 and 2007 fiscal years, the Company was required to pay, and has paid, approximately $39.5 million (including interest and penalties) during the year ended november 30, 2014, even though the ultimate outcome may differ from this amount. Subsequent to the year-end, the Company has paid $14.5 million (including interest and penalties) in relation to the 2008 nOR even though the ultimate outcome may differ from this amount. the Company is not expected to make any further significant payments with respect to the nOR for years 2005 to 2008 until the resolution of this matter. including the payments made subsequent to the year-end, the Company has paid approximately $54.0 million with respect to the nOR for years 2005 to 2008.
in relation to this transfer pricing tax audit, the estimated total exposure based on the CRA’s position for years 2005 to 2014 (including interest and penalties and the relief from double taxation) is $85.7 million. in consultation with its external advisors, the Company believes that its tax filing positions continue to be reasonable based on its transfer pricing methodology and the Company is contesting the CRA’s position and any related transfer pricing penalty. the Company believes it is likely that the CRA will reassess its taxes for subsequent years on a similar basis and that these may result in future cash payments on receipt of the reassessments. during the year ended november 30, 2014, the Company has recorded a tax provision of $2.0 million in relation to this transfer pricing audit. the amount of tax provision recorded on the consolidated statement of financial position of $56.1 million (prior to netting the $39.5 million payment described above) reflects management’s best estimate of the final payment to be made on the ultimate resolution of this matter and includes any related estimated interest and penalties for the 2005 to 2014 fiscal years. the final result of the audit and appeals process may vary and may be materially different compared to the estimates and assumptions used by management in determining the Company’s consolidated income tax provision and in valuing its income tax assets and liabilities.
Further to the Company’s objection to the nOR, the Company is also seeking Competent Authority relief from double taxation under the applicable tax treaty. While it is uncertain whether relief from double taxation will be granted, the Company’s provision, which reflects its best estimate of the final payment to be made on the ultimate resolution of this matter includes an expected recovery of approximately $10.5 million for the tax years 2005 through 2008 that are not covered in the Bilateral Advance Pricing Arrangement (BAPA) as described below.
the Company has been accepted by the CRA into a BAPA between Canada and the relevant tax authorities to establish the appropriate transfer pricing methodologies for the tax years 2009 through 2016. Under a BAPA, the taxpayer can avoid potential double taxation on transactions covered by the BAPA according to the provisions of the income tax treaty between Canada and the foreign country.
(b) there are certain claims and potential claims against the Company. none of these claims or potential claims are expected to have a material adverse effect on the consolidated financial position of the Company. the Company has also been notified that the CRA is also reviewing the appropriateness of certain deductions claimed in various taxation years. the amount of such deductions under review is up to $32.2 million and any resulting taxes payable may also be subject to interest and penalties. Management continues to believe that the deductions were reasonable and that its position would be sustained if reassessed. the amounts of the losses related to these claims or potential claims, if any, cannot be determined at this time.
Table of Contents

note 27 Commitments and Guarantees
(a) Commitments the Company is committed under operating leases for office premises and equipment. the Company is also committed
to reimbursing Citigroup Fund Services inc. (Citigroup) and CitiFinancial up to $2.8 million per year should annual revenues derived from AGF fund administration services fall below predetermined levels. this commitment expires in 2015. For the year ended november 30, 2014, AGF met this commitment. the approximate minimum annual cash payments related to the above are as follows:
( in thousands of Canadian dollars) Years ended november 30
2015 $ 12,094
2016 10,327
2017 7,990
2018 6,746
2019 5,828
thereafter 10,135
in addition, the Company has allocated $150.0 million to funds and investments associated with the alternative asset management platform. As at november 30, 2014, of the $150.0 million allocation, the Company has committed $50.0 million to Stream. As at november 30, 2014, the Company has invested $16.6 million with $33.4 million remaining committed capital to be invested in the Stream fund. in addition, AGF will advance up to $5.0 million to instarAGF on an as-needed basis as a working capital loan facility. As at november 30, 2014, the Company has advanced $2.1 million (2013 – nil), which was included in accounts receivable, prepaid expenses and other assets on the consolidated statement of financial position.
(b) Guarantees the Company, under an indemnification agreement with each of the directors of the Company, as well as directors of
the mutual fund corporations, has agreed to indemnify the directors against any costs in respect of any action or suit brought against them in respect of the proper execution of their duties. to date, there have been no claims under these indemnities.
note 28 subsequent events
(a) On december 9, 2014, the Company announced that it intended to reduce the quarterly dividend in fiscal 2015 to $0.08 per share as part of its amended capital allocation strategy.
(b) On January 27, 2015, instarAGF announced the acquisition of the Billy Bishop toronto City Airport passenger terminal by nieuport Aviation infrastructure Partners GP, which is owned by a consortium of investors led by instarAGF. AGF has committed and invested $103.0 million related to this investment, which will form a seed asset for the essential infrastructure fund. to fund this investment, the Company arranged a one-week $100.0 million bridge facility with a Canadian chartered bank. the bridge facility was secured by the Company’s term deposits held by the bank. Upon closing of a fund with external investments, the Company will receive a return of its capital in excess of its proportionate participation in the fund.
notes to consolidated f inancial statements
94 AGF Management Limited
Table of Contents

AGF Management Limited a 95
Consolidated 10-year review
( in thousands of Canadian dollars, except per share amounts) Years ended november 30
IFRs 2014
IFRs 2013
IFRs1
2012 IFRs 2011
GAAp 2010
opeRATIons
total income (continuing operations) $ 464,480 $ 484,535 $ 510,216 $ 585,672 $ 512,967
net income attributable to equity owners of the Company 61,255 22,447 52,260 103,573 116,775
dividends 92,889 95,245 101,973 99,440 91,792
peR shARe
net income – basic $ 0.71 $ 0.25 $ 0.55 $ 1.09 $ 1.31
dividends 1.08 1.08 1.08 1.07 1.04
( in thousands of Canadian dollars, except per share amounts) Years ended november 30
GAAp 2009
GAAp 2008
GAAp 2007
GAAp 2006
GAAp 2005
opeRATIons
total income (continuing operations) $ 476,022 $ 609,104 $ 678,531 $ 540,056 $ 510,968
net income attributable to equity owners of the Company 97,694 128,592 178,687 112,657 91,872
dividends 88,821 84,860 70,151 61,521 50,522
peR shARe
net income – basic $ 1.10 $ 1.44 $ 1.99 $ 1.26 $ 1.02
dividends 1.00 0.95 0.78 0.69 0.56
1 Refer to Annual Report 2012 for transition adjustments from GAAP to iFRS.
This report contains forward-looking statements with respect to AGF, including its business operations, strategy, financial performance and
condition. Although management believes that the expectations reflected in such forward-looking statements are reasonable, such statements
involve risks and uncertainties. Actual results may differ materially from those expressed or implied by such forward-looking statements.
Factors that could cause results to differ materially include, among other things, general economic and market factors including interest rates,
business competition, changes in government regulations or in tax laws, and other factors discussed in materials filed with applicable securities
regulatory authorities from time to time.
Consolidated 10 -year review
Table of Contents

board of directors
AGF management limited Sarah davis, cpa, ca8
douglas L. derry, fcpa, fca3 W. Robert Farquharson, cfa Blake C. Goldring, m.s.m., cfa1 Judy G. Goldring, ll.b. donald G. Lang, hba6
Winthrop H. Smith, Jr., mba7 G. Wayne Squibb5
mutual Fund Corporations and Trusts W. Robert Farquharson, cfa William d. Cameron Judy Goldring, ll.b.Paul Hogan H. ian Macdonald Joseph e. Martin Louise Morwick, mba, fsa, cfa John B. newman2,3,4
AGF Asset management Asia ltd. W. Robert Farquharson, cfa Blake C. Goldring, m.s.m., cfa dr. Soo Ann Lee yong Siang Lee eng Hock Ong, cfa
AGF International Advisors Company limited and AGFIA limited Blake C. Goldring, m.s.m., cfa2 Michael C. Brady Brian Brennanviscount CobhamW. Robert Farquharson, cfaRory Flynndavid M. Kennedy Oliver J. tattan
executive officers
blake C. Goldring, m.s.m., cfa Chairman and Chief executive Officer
w. Robert Farquharson, cfavice-Chairman
kevin mcCreadie, mba, cfaPresident and Chief investment Officer AGF investments inc.
Robert J. bogartexecutive vice-President and Chief Financial Officer
Rose Cammareri executive vice-President, Retail distribution, AGF investments inc.
Gordon Forrester, caexecutive vice-President, Marketing and Product, Head of Retail, AGF investments inc.
Judy G. Goldring, ll.b. executive vice-President and Chief Operating Officer
1 Chairman of the Board of AGF Management Limited 2 Chairman of the Board 3 Chairman of the Audit Committee 4 Chair of the Audit Advisory Committee 5 Chairman of the nominating and Corporate Governance Committee of AGF Management Limited 6 Chairman of the Compensation Committee of AGF Management Limited 7 Lead director 8 Joined the Board of directors in January 2014
96 AGF Management Limited
Board of directors and executive officers
Table of Contents
AGF management limited P.O. Box 50toronto-dominion Centre toronto On M5K 1e9 Website: AGF.com email: [email protected] tel: 416 367-1900
China Representative office Unit 16, 11/F, tower A Beijing Hanwei Plaza (inside the CCBC Office) no. 7, Guanghua Road Beijing, PR China, 10004
shareholder information
Auditors PricewaterhouseCoopers LLP
Registrar and Transfer Agents Computershare trust Company of Canada 1 800 564-6253
stock exchange listing AGF.B
subsidiaries
AGF Investments Inc.P.O. Box 50 toronto-dominion Centre toronto On M5K 1e9
Acuity Investment management Inc.P.O. Box 50 toronto-dominion Centre toronto On M5K 1e9
Cypress Capital management ltd. Suite 1700 1055 West Georgia Street P.O. Box 11136 vancouver BC v6e 3P3
doherty & Associates ltd. 56 Sparks Street, Suite 700 Ottawa On K1P 5A9
highstreet Asset management Inc.244 Pall Mall Street, Suite 350 London On n6A 5P6
AGF International Advisors Company limited34 Molesworth Street dublin, 2, ireland
AGF Investments America Inc. 53 State Street, 13th Floor Boston MA 02109
AGFIA limited 34 Molesworth Street dublin, 2, ireland
AGF Asset management Asia ltd. 30 Cecil Street18-01 Prudential towerSingapore 049712
aGF corporate directory
Annual Report 2014 97
AGF management limitedP.O. Box 50toronto-dominion Centretoronto, On M5K 1e9
website www.AGF.comemail [email protected] 416 367-1900
AGF is dedicated to helping to protect the environment. As a result, this document is printed on Forest
Stewardship Council® (FSC®) certified paper. FSC® certification ensures that the paper in this document
contains fibre from well-managed and responsibly harvested forests that meet strict environmental and
socio-economic standards.
® t
he A
GF
logo
and
‘Wha
t are
you
doi
ng a
fter
wor
k?’ a
re tr
adem
arks
of A
GF
Man
agem
ent L
imite
d an
d us
ed u
nder
lice
nce.
CO
RP1
44 1
1-14