investing basics in a volatile market
TRANSCRIPT


2
Stock CallsComfortDelgro (BUY/S$2.83/Target:S$3.30/ Upside: 16.6% )
• Consistent earnings growth.
• Strong Cash Flow
• Resilient dividend payout.
Singapore Post (BUY/S$1.74 / Target:S$2.19/ Upside: 26%)• An e-commerce enabler in Asia.
• Strong focus to grow top-line with bigger volumes.
• The Alibaba story. (14.5% stake in SingPost)
Riverstone Holdings (BUY/S$1.62/Target: S$2.24/ Upside: 38% )• Expansionary mode with production capacity to grow by 1b annually.
• Strong barriers to entry for its clean room glove segment.
• Solid management team

Investment highlightsComfortDelgro (S$2.83)• Market Capitalisation = S$6,120m
• 2016F EPS : 16.2 S cents
• 2016F P/E : 17.5x
• 2016F Dividend Yield: 3.1%
• 2016F ROE: 14.4%
• BUY Recommendation, Target Price: S$3.30
• Upside: 16.6%

Investment highlightsBackground..
•Formed on 29 March 2003 through the merger of two land transport companies -Comfort Group and DelGro Corporation.
•Both had started out in the 1970s and had, by the time of the merger, grown to become successful listed land transport companies.
• ComfortDelGro has expanded significantly and now operates in seven countries and has a global fleet of about 46,500 vehicles.

Revenue Breakdown
• Bus, Taxi and Rail Operationscontribute more than 85% of CD’s revenue.
60%25%
10%
5%0.1%0.2%
Singapore
United Kingdom/ Ireland
AustraliaChina
Vietnam
Malaysia
• Singapore, UK/Ireland and Australia contribute more than 90% of CD’s revenue.
Source: UOB Kay HianSource: UOB Kay Hian
Business Segments Geographical Segments

Growth DriversPopulation Growth
0
1,000
2,000
3,000
4,000
5,000
6,000
90 92 94 96 98 00 02 04 06 08 10 12 14
-2.0-1.00.01.02.03.04.05.06.0
Population (LHS) Growth
(m) (yoy % chg) • 2014: 5.5m 2020F: 5.8m – 6.0m 2030F: 6.5m - 6.9m
• Steady 5yr CAGR of 1.5% since 2009.
• Public ridership growth has outpaced population growth.
• The ratio of the average daily ridership divided by the Singapore population grew from 1.16 in 2009 to 1.36 in 2013. Stable and Resilient Business model.
Source: UOB Kay Hian

Investment highlightsCapacity Expansion
• 800 new buses to the public bus fleet over 5 years, increasing capacity by 20%.
• 2030: Rail network is expected to grow to 360km from about 178kmcurrently.
• Total rail length grew at a 5-year CAGR of 4.3% in 2013 compared with 1.3% in 2009
• Capacity expansion is expected to drive ridership growth through better connectivity and reliability.
Source: Land Transport Authority

2Q15 Results
• CD delivered a set of comforting 2Q15 results amid the current volatile Singapore equities market.
• Net profits were within our expectations as the group achieved broad-based revenue growth of $20.9m (2.1% yoy).
• Noticeably, CD’s core operations remain resilient with the group’s bus and taxi revenue growing 4.1% and 3.3% yoy respectively.
• CD’s business outlook remain positive

Investment highlights
1) Rail Business
• Average daily ridership on NEL increased by 4.9% to 527k and LRT increased by 15.6% to 97k
• Average daily ridership on DTL1 of 70k• Higher Average fare
2) Bus Business
Singapore• Average daily bus ridership at SBS Transit
increased by 3.5% generating higher revenue, boosted by higher average fares
Improving core business…
Source: ComfortDelgro, UOB Kay Hian
Source: ComfortDelgro, UOB Kay Hian

Investment highlights
Implementation of the Taxi Availability (TA) Standards…
Improving core business…3) Taxi Business
Singapore• Higher rental income from replacement
taxis, larger fleet and higher volume of cashless transactions
• Comfortdelgro’s ability to meet both required standards and lead the other taxicompanies in doing so was within our expectations. As indicated in our reports previously, we assumed that the group would meet standards, raising their fleet by 2% implying an increase of circa 330 new cabs in 2015.
Source: ComfortDelgro, UOB Kay Hian

Share Price Catalyst 1) Possible Special dividend.
We estimate the bus contracting model could lead to a special dividend payout of 21.6-25.0 S cents/share, assuming: a) the government buys bus assets from SBS T at 0.9-1.0x P/B, b) SBS T pays down 50% of its outstanding debt, and c) the remaining net cash gets fully paid out as a special dividend.
In the longer term, we see potential upside for dividend payout as the sector graduate towards an asset light model.
2) The only taxi company allowed to grow it’s fleet size.
Comfortdelgro’s ability to meet the Taxi Availability (TA) Standards were within our expectations. As a result, CD is the ONLY taxi company able to raise their fleet by 2% implying an increase of circa 330 new cabs in 2015.
A 1% increase in taxi fleet is estimated to boost earnings by S$7.2m.
3) A beneficiary of the new asset-light bus contracting model.
Post restructure, Nine bus (out of 12) packages representing 80% of the total bus routes which the incumbent operators will continue to run till 2021-23 (based on a 5+2 years contract).
Currently, core bus operations for both CDG and SMRT are still incurring losses. SMRT’s operating profit for its bus operations in the most recent quarter implies only a 1.5% operating margin. However, with the estimated operating margin of 8-10% for the new government contracting model, we expect the public bus industry to turn profitable in 2H16.

Peer Comparison and Valuation..
1,84311.43.316.819.220.214/151.251.21HOLDMRT SPSMRT6,12014.43.114.414.013.113/142.302.83BUYCD SP
ComfortDelGro
(S$m)(%)(%)(x)(x)(x)End(S$)(S$)Cap.2016F2016F2016F2015F2014YearPrice15-SepRecTickerCompany
MarketROEYield-----------PE-----------LastTargetPrice
BUY recommendation with a DCF-based target price of S$3.30/share (WACC of 9.4% and terminal growth of 3%).
CD continues to deliver resilient growth in earnings due to its diversified overseas operations.
Assuming a payout ratio assumptions of 58%, we expect CD to sustain its 2015F–2017F dividends per share of S8.6 – S9.9 cents, yielding about 3.0-3.5%.
We pick CD over SMRT due to CD’s diversified earnings stream and stronger financial position. CD is trading at a current implied FY16F PE of 14.4x, a 14% discount to SMRT, which is trading at 16.8x.
Source: Bloomberg,UOB Kay Hian

Singapore Post (SPOST SP)
Investment Highlights:•An e-commerce enabler in Asia.
•Strong focus to grow top-line with bigger volumes.
• The Alibaba story. (14.5% stake in SingPost)
•Key Catalysts:• Clarity on Singapore Post Centre redevelopment plans for its retail mall
• Higher-than-expected growth in the e-commerce and logistics businesses.
• Accretive M&As
Valuation:SPOST SP (BUY/ S$1.74 /Target: S$2.19):
• Under-valued despite strong management team and track record of delivering solid results.
• A period of structural transformation.
• FY16F P/E: 23x. Upside: +26%.

Singapore Postal Industry
•Postal services providers in Singapore are governed by the Infocomm Development Authority’s (IDA) Postal Services Act In order to perform basic mail services, postal operators must obtain a licence from the IDA.
•Prior to 2007 SingPost held a monopoly, the government has since then liberalised the market.
•As of 2013, three other competitors have entered the scene – DHL Global Mail (Singapore), Swiss Post International Singapore and WMG.
•SingPost maintains its Public Postal Licence awarded in 1992 which expires on 31 Mar 17
Source: IDA
Barriers to Entry.

Core Business
SingPost’s revenue is mainly derived from three business segments: Mail (56% as of 9MFY14/15), Logistics (48%) and Retail & E-commerce (10%). Over 70% still comes from domestic operations.
We project the three segments to grow at 3-year CAGR’s of 9.9%, 16.6% and 8.5% respectively.
Source: SPOST SP, UOB Kay Hian

Mail and Digital Services
• SingPost is estimated to hold more than 90% market share of all domesticmail in Singapore. Through its ties with foreign postal units, it can deliver mail to any country in the world.
• The group provides a full spectrum of end-to-end mail solutions such as data printing, letter-shopping and delivery. As Singapore’s PPL, SingPostrepresents the country in international and regional postal meetings.
Source: Singpost, UOB Kay Hian Source: Singpost, UOB Kay Hian

Logistics
SingPost provides a wide suite of delivery solutions to suit the needs of its corporate and retail customers.
Speedpost offers door-to-door deliveries both within Singapore and to more than 220 countries and territories worldwide.
SingPost’s subsidiaries add strength to its regional presence and provide a range of value-added services such as warehousing, fulfilment, distribution and inventory management.
Through wholly-owned GS, SingPost also provides self-storage solutions under the Lock+Storebrand.
Source: Singpost, UOB Kay Hian

Retail & Financial Services and E-commerce
Close to 60 post offices, more than 300 SAM and SAMPLUS, and vPOST, SingPost’sinternet portal. Provides round-the-clock convenience for customers for a wide variety of postal, bill payment, ticketing, government application and payment as well as financial services.
Currently, retail also includes the newly set-up e-commerce division, which focuses on brand owners and e-retailers marketing, content management and payments solutions.
Source: Singpost, UOB Kay Hian Source: SPOST SP, UOB Kay Hian

Structural Change• Ongoing challenges in business and operating environment, especially
domestic mail with declining revenue and rising costs of operation in Singapore
•SingPost is undergoing a transformation.
•Executing their strategy to be regional leader in ecommerce logistics and trusted communications.
Source: SPOST SP, UOB Kay Hian Source: SPOST SP, UOB Kay Hian

E-Commerce Growth Potential
Euromonitor projects that in 2016, there will be 205minternet users in the “Big 6”SEA countries (Singapore, Vietnam, Malaysia, Philippines, Thailand, Indonesia) from the 114m in 2011.
This represents a 5-year CAGR of 12.5%. The potential size of the e-commerce market could reach about US$2.7b in 2016, from the US$1.6b as of 2011 (11.0% CAGR).
Source: Euromonitor, ecommerce.milo

Growth DriversE-Commerce Market (in US$m, Transaction Size)
Several factors that drive the e-commerce market in Asiaa) relatively young online populations that are more tech-savvy, b) improvement in overall wealth levels which leads to better web access, c) increasing penetration rate of smartphones, tablets and other similar devices.d) improved infrastructures which lead to higher internet penetration rates
Source: Euromonitor, ecommerce.milo

Raising its stake beyond the Singapore border. SingPost has undertaken strategic M&As to build its logistics presence in Asia. Its cross-border regional network now includes strong operations in at least 10 countries that provide a wide range of capabilities, positioning it well to ride on the demand from e-commerce
Geographical Expansion
Source: SPOST SP, UOB Kay Hian

Round-up For 1Q15/16 Results
Consistent Top and Bottom line growth.
We expect top line to grow at 3 year CAGR of 13.7% while net profit to grow at 3 year CAGR 11.3%.
Source: SPOST SP, UOB Kay Hian

Mail and Digital Services
• Decline in growth for SPOST’s traditional postal businesses
• As expected, 9M15 revenue from domestic mail declined 2.3% yoy due to the structural decline.
• We expect a 3 year CAGR for domestic mail, hybrid mail and International Mail of 1%, 5% and 20% respectively.
Source: SPOST SP, UOB Kay HianSource: SPOST SP, UOB Kay Hian

Logistics
• Growth in ecommerce logistics activities and new acquisitions in freight
• Continued investments to strengthen and expand regional network
• 1QFY15/16 Logistics revenue grew by 43.6% yoy.
• We expect a 3 year CAGR of 16.6% for SingPost logistic segment
Source: SPOST SP, UOB Kay Hian Source: SPOST SP, UOB Kay Hian
Source: SPOST SP, UOB Kay Hian
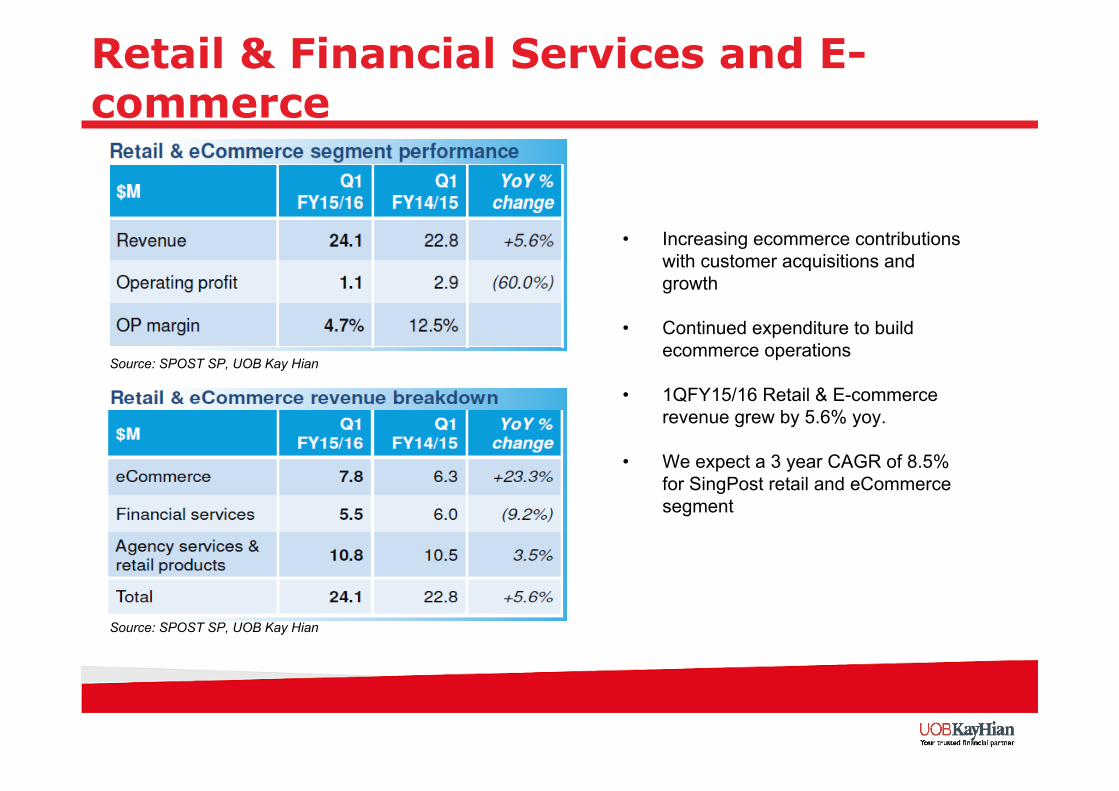
Retail & Financial Services and E-commerce
• Increasing ecommerce contributions with customer acquisitions and growth
• Continued expenditure to build ecommerce operations
• 1QFY15/16 Retail & E-commerce revenue grew by 5.6% yoy.
• We expect a 3 year CAGR of 8.5% for SingPost retail and eCommercesegment
Source: SPOST SP, UOB Kay Hian
Source: SPOST SP, UOB Kay Hian

Stable Dividend Play
•Strong cash flow generation to support base annual dividend of 7 S cents.
•SingPost generates about S$200m in operating cash flow annually. Since FY07, the group has consistently distributed 6.25 S cents in annual dividend and we forecast this level will be sustained until FY17.
•Dividend yield of 3 – 3.5% is considered decent
Source: SPOST SP, UOB Kay Hian

Peer comparison & Valuation..Company Ticker Tradin g Price @ Mkt Cap 2015 2015
Curr 26-Mar-15 (US$m) 2014 2015 2014 2015 Yield (%) ROE (%)
E-commerce relatedVisa Inc-Class A Shares V US USD 65.59 161,063 30.1 25.3 7.3 5.3 0.7 20.9Google Inc-Cl C GOOG US USD 555.17 380,516 n.a. 19.4 n.a. 3.0 0.0 16.0Mastercard Inc-Class A MA US USD 87.93 101,548 28.3 25.3 14.9 12.6 0.6 53.5Ebay Inc EBAY US USD 57.515 69,746 n.a. 18.5 3.5 2.9 0.0 15.9Amadeus It Holding Sa-A Shs AMS SM EUR 39.385 19,179 27.7 23.7 9.6 7.9 2.0 35.0Amazon.Com Inc AMZN US USD 367.35 170,591 n.a. n.a. 15.9 14.5 0.0 6.8Groupon Inc GRPN US USD 7.58 5,119 n.a. 51.9 6.7 6.0 0.0 13.5Rakuten Inc 4755 JP JPY 2135.5 23,797 39.9 37.8 6.7 6.2 0.2 17.6Netfl ix Inc NFLX US USD 418.26 25,304 94.2 99.0 13.6 12.0 0.0 10.5Start Today Co Ltd 3092 JP JPY 3145 2,897 37.1 31.1 13.6 10.5 1.1 37.7Vipshop Holdings Ltd - Ads VIPS US USD 28.07 17,990 n.a. 52.6 39.1 22.4 0.0 50.4E-Commerce China-Spon Adr -A DANG UN USD 8.09 653 39.4 17.4 6.0 4.4 0.0 32.3Averag e 42.4 36.5 12.5 9.0 0.4 25.8
Singapore Post Ltd SPOST SP SGD 1.95 3,056 27.1 24.1 4.9 4.7 3.2 20.9
PE (x) PB (x)
•BUY recommendation, with a target price of S$2.19 based on our DCF model. We used a DCF model with 7.5% cost of equity and a 2% terminal growth to arrive at our valuation.
•Singapore Post is trading cheaper at FY15F 25.3x compared to its e-commerce sector’s FY15 PE of 36.5x, carried by online retailers such as Amazon.com, Groupon and Rakuten. We see a modest re-rating for SingPost to be justified given its venture into end-to-end e-commerce solutions.
Source: Bloomberg, UOB Kay Hian

Risks
Singapore Post• Key risks:
A) Slow takeoff of e-commerce fails to counteract negative growth in traditional mail.
B) Economic Downturn
C) Regulatory, country-specific and business risks

Investment highlights
Riverstone Holdings (S$1.62)
• Market Capitalization = S$361m
• 2016F EPS = 5.5 S cents
• 2016F P/E = 13.1X
• BUY Recommendation, Target Price: S$2.24
• Upside: 38%

The business…..
• High-tech Cleanroom & Premium Healthcare Gloves
Source: Riverstone HoldingsSource: Riverstone HoldingsSource: Riverstone Holdings

Investment highlights
Source: UOB Kay Hian
Source: UOB Kay Hian
Source: UOB Kay Hian

Business Model•Highly Customised Product
•High barrier of entry into clean room glove industry (Key differentiating factor: RSTONS’schemical formulae.)
•Not over reliant on single major customer; well diversified customer base (No single customer accounts for more than 10% of the Group’s revenue.)
•Commands higher price and higher profit margin
•Long standing customers like Western digital, Seagate and Toshiba.

Investment highlightsAnnual Capacity •2014 : 4.2 billion
•2015F: 5.2 billion (Expected)•2016F: 6.2 billion (Expected)
•More than 600 million pieces of finger cots
•More than 1,500 tonnes of cleanroompackaging materials
•Over 40 million pieces of face masks
Source: UOB Kay Hian
70%51%30%Clean room 30%49%70%Healthcare
Gross ProfitRevenueProductionBreakdown
Investment highlights
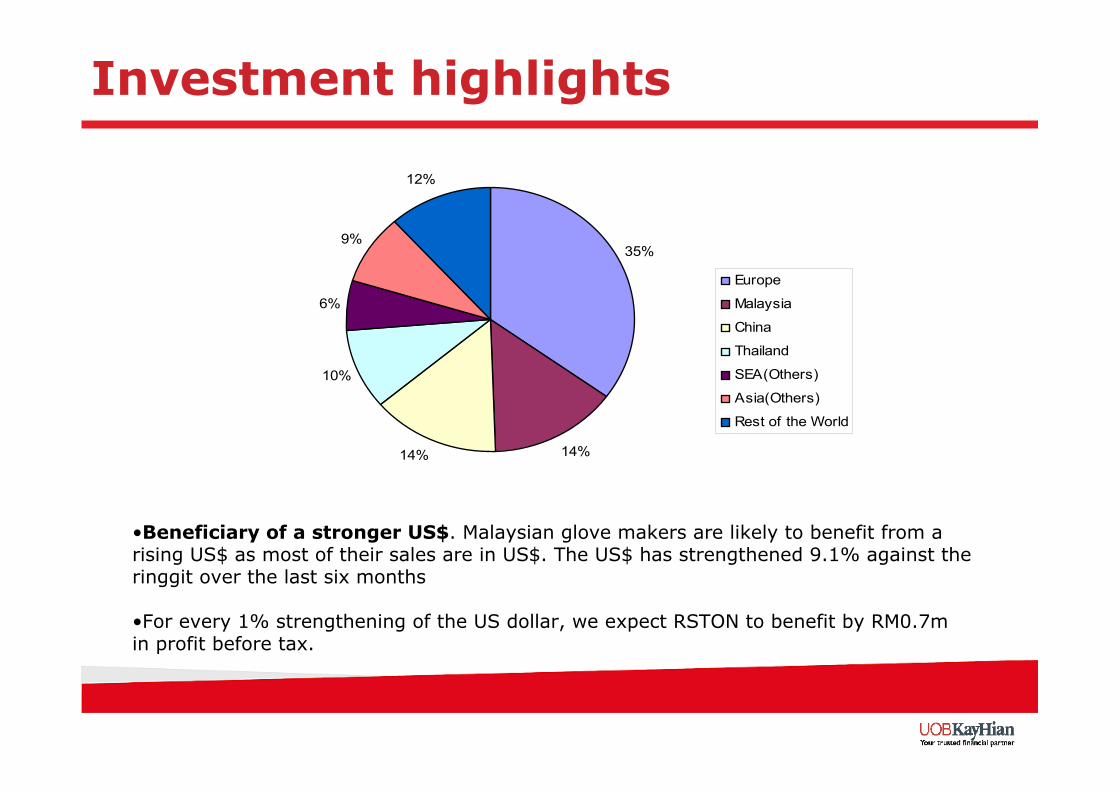
35%
14%14%
10%
6%
9%
12%
Europe
Malaysia
China
Thailand
SEA(Others)
Asia(Others)
Rest of the World
•Beneficiary of a stronger US$. Malaysian glove makers are likely to benefit from a rising US$ as most of their sales are in US$. The US$ has strengthened 9.1% against the ringgit over the last six months
•For every 1% strengthening of the US dollar, we expect RSTON to benefit by RM0.7m in profit before tax.

Investment highlights•Highly Customised Product
b pieces
13.7 16.0 16.0
5.1
43.9
05
101520253035404550
Hartalega Top Glove Supermax KossanRubber
Riverstone
The group’s smaller size compared with its Malaysian peers allows it to specialise in customised medical gloves without incurring significant losses in downtime.
Source: UOB Kay Hian

Investment highlights
•High barrier of entry into clean room glove industry
These gloves command slightly higher Average Selling Price (ASP) and enjoy more resilient demand as there are only a few qualified players that can take on such small customised orders. Higher price and higher profit margin.
Business Model
Net Margin(%)
9.011.4 10.5
16.2
22.7
0.0
5.0
10.0
15.0
20.0
25.0
FY13Hartalega Top Glove Supermax Kossan Rubber Riverstone
29.7
10.513.2 14.2
20.3
0.0
5.0
10.0
15.0
20.0
25.0
30.0
35.0
FY13Hartalega Top Glove Supermax Kossan Rubber Riverstone
EBIT Margin(%)
Source: UOB Kay HianSource: UOB Kay Hian
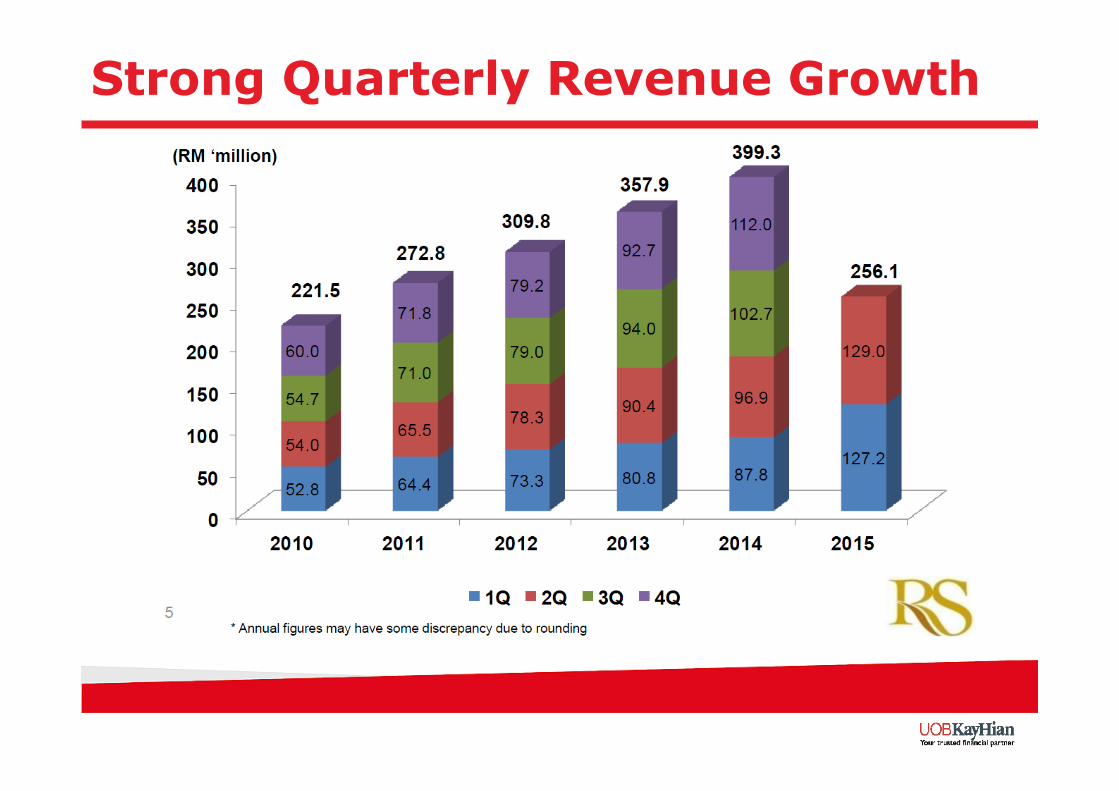
Strong Quarterly Revenue Growth

Strong Quarterly Earnings Growth
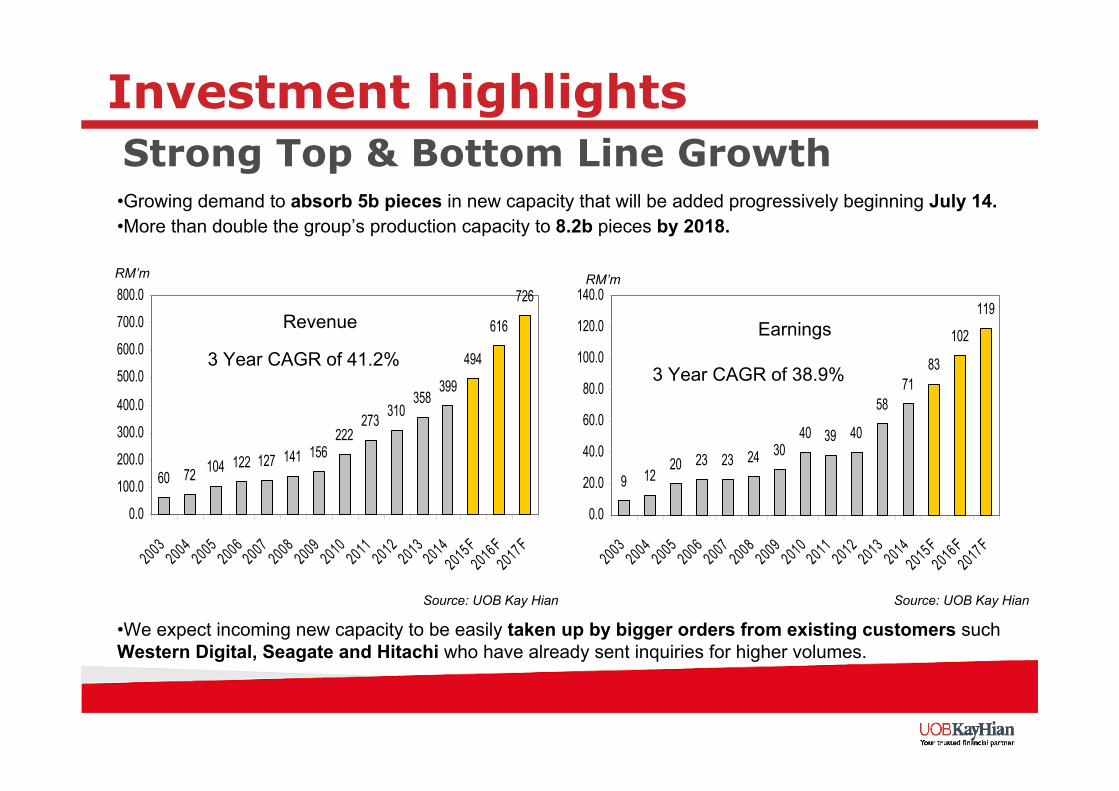
Investment highlights
•Growing demand to absorb 5b pieces in new capacity that will be added progressively beginning July 14.•More than double the group’s production capacity to 8.2b pieces by 2018.
Strong Top & Bottom Line Growth
Earnings
•We expect incoming new capacity to be easily taken up by bigger orders from existing customers such Western Digital, Seagate and Hitachi who have already sent inquiries for higher volumes.
RM’m RM’m
Source: UOB Kay HianSource: UOB Kay Hian
60 72 104 122 127 141 156222
273 310358
399
494
616
726
0.0
100.0
200.0
300.0
400.0
500.0
600.0
700.0
800.0
2003200420052006200720082009201020112012201320142015 F2016 F2017 F
Revenue
9 1220 23 23 24 30
40 39 40
5871
83
102
119
0.0
20.0
40.0
60.0
80.0
100.0
120.0
140.0
2003200420052006200720082009201020112012201320142015 F2016 F2017 F
3 Year CAGR of 41.2%3 Year CAGR of 38.9%

Investment highlightsStrong Balance Sheet, Operating Cash Flow
•Debt-free and cash-generative; well-positioned to support capex needs.• 1Q15 net operating cash flow of RM26m. •Management target to maintain 45% dividend payout ratio.
11 12 21 2742
29 2840
75 80100
21
10988
4151 41
6080 88
2721
2.63.3 3.6
5.35.9 5.9 6.0
6.87.9
9.010.7
0.0
20.0
40.0
60.0
80.0
100.0
120.0
2006 2007 2008 2009 2010 2011 2012 2013 2014 2015 20160.0
2.0
4.0
6.0
8.0
10.0
12.0
Operating Cash Flow (RMm) Capex (RMm) DPS (sen)39.9Cash
-D/E
-Total Debt
-9.9%Net Gearing
354Total Equity
(39.9)Net debt (Cash)
RiverstoneRM’m
Source: Riverstone Holdings, UOB Kay HianSource: Riverstone Holdings, UOB Kay Hian

Valuation
•BUY recommendation with a target price of S$2.24 pegged at the sector’s historical mean PE of 18.2x applied to our 2016F EPS of 12.3 S cents.
•Given the higher ROE and dividend yield, RSTON is trading attractively at 15.1x 2016F PE, vs peers’ average of 16.8x.
Source: UOB Kay Hian
Share Market PE P/B ROE Yield Company Ticker Price Cap FY14 FY15F FY16F FY14 FY15F FY16F FY15F FY15F
(lcy) (US$) (x) (x) (x) (x) (x) (x) (%) (%) Hartalega Holdings HART MK 8.22 1,824 29.5 23.4 20.2 5.9 5.0 4.4 23.2 2.0 Top Glove Corp TOPG MK 5.6 957 19.3 16.5 15.6 2.5 2.3 2.1 14.2 3.1 Supermax Corp SUCB MK 2 375 13.5 10.8 9.8 1.4 1.3 1.2 11.9 2.8 Kossan Rubber Industries KRI MK 6 1,062 26.7 19.7 17.3 4.8 4.1 3.5 21.8 1.8 Average 22.2 17.6 16.8 3.6 3.2 2.8 17.8 2.4 Riverstone Holdings RSTON SP 1.34 356 18.2 15.5 15.1 3.2 3.1 2.7 21.1 2.9

Investment highlights
Riverstone Holdings• Key risks:A) Capacity overexpansion- Risk of oversupply in the Rubber Gloves Market.
B) Slower demand from mobile and tablet manufacturers for cleanroom gloves.
C) Worse-than-expected margins.

Q&AQ&A