investigation of reported cancer among soccer … table 13. number of cancers among people reported...
TRANSCRIPT

Investigation of Reported Cancer among Soccer Players in Washington State Revised April 2017
DOH Pub 210-091 Revised April 2017


Investigation of Reported Cancer among Soccer Players in Washington State Revised April 2017
For more information or additional copies of this report contact the Washington State Department of Health:
Cathy Wasserman Office of the State Health Officer, Non-Infectious Conditions Epidemiology (360) 236-4250 [email protected]
John Wiesman, DrPH, MPH Kathy Lofy, MD Secretary of Health State Health Officer
DOH Pub 210-091 Revised April 2017


i
Contents List of Figures .............................................................................................................................. ii
List of Tables .............................................................................................................................. iii
April 2017 Revisions .................................................................................................................... v
Executive Summary ..................................................................................................................... 1
Background ............................................................................................................................. 1
Methods for Primary Goals ..................................................................................................... 2
Results ..................................................................................................................................... 3
Discussion................................................................................................................................ 4
Conclusions and Recommendations ....................................................................................... 4
Background and Objectives ........................................................................................................ 6
Background on Reports of Cancer among Soccer Players ...................................................... 6
Objectives ............................................................................................................................... 7
Background on Rates of Cancer in Washington and the United States .................................. 7
Background on Leukemia and Lymphoma ............................................................................ 10
Crumb Rubber ....................................................................................................................... 13
Methods .................................................................................................................................... 17
Calculating Observed to Expected Ratios ............................................................................. 17
Descriptive Epidemiology ..................................................................................................... 20
Results ....................................................................................................................................... 22
Meeting the Case Definition ................................................................................................. 22
Response Rate ....................................................................................................................... 23
Observed to Expected Ratios ................................................................................................ 23
Descriptive Epidemiology ..................................................................................................... 24
Demographic Characteristics ............................................................................................ 25
Cancer Diagnoses .............................................................................................................. 25
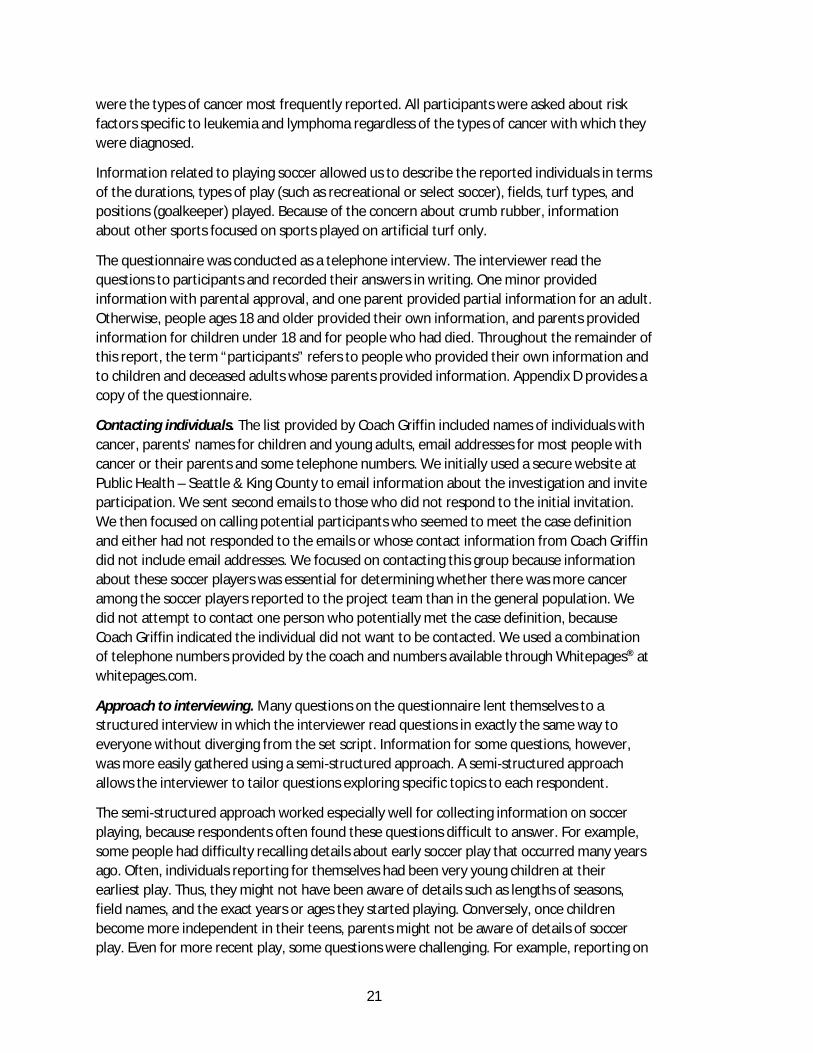
Known or Suspected Potential Risk Factors for Cancer .................................................... 27
Soccer Playing ................................................................................................................... 27
Other Sports ...................................................................................................................... 33
Comments ......................................................................................................................... 33
Discussion.................................................................................................................................. 34
Study Design...................................................................................................................... 34
Observed to Expected Ratios ............................................................................................ 35

ii
Descriptive Epidemiology.................................................................................................. 38
Conclusions and Recommendations ......................................................................................... 42
References ................................................................................................................................ 42
Appendix A: Project Team......................................................................................................... 47
Appendix B: Methods for Calculating Cancer Rates ................................................................. 49
Appendix C. Observed and expected cancers for soccer cohort .............................................. 53
Appendix D: Interview Questionnaire ...................................................................................... 67
Appendix E. Computations for Elements of History of Soccer Play .......................................... 77
List of Figures Figure 1. Age-adjusted cancer incidence (all types combined), ages 5–24, Washington and
United States ....................................................................................................................... 9
Figure 2. Diagram illustrating the possible routes of exposure from chemicals in artificial turf or crumb rubber ................................................................................................................ 16

iii
List of Tables Table 1. Observed and expected cancers: soccer players ages 6–24 years diagnosed during
2002–2015 .............................................................................................................. 3 Table 2. Age-adjusted cancer incidence rates per 100,000 people ages 5–24 in Washington
and the United States, 2009–2013 ......................................................................... 8 Table 3. Annual percent change in age-adjusted cancer incidence rates per 100,000 people
ages 5–24 in Washington and the United States, 1992–2013 .............................. 10 Table 4. Risk Factors for Leukemia among Children and Adolescents ................................. 11 Table 5. Risk Factors for Lymphoma among Children and Adolescents ............................... 13 Table 6. List of published reviews used to assess whether crumb rubber or components of
crumb rubber have been associated with poor health ........................................ 15 Table 7. Observed to expected ratios for cancer: all soccer players diagnosed during 2002–
2015 at ages 6–24 years........................................................................................ 23 Table 8. Observed to expected ratios for cancer: WYS-defined select and premier level
players diagnosed during 2002–2015 at ages 6–24 years .................................... 23 Table 9. Observed to expected ratios for cancer: goalkeepers diagnosed during 2002–2015
at ages 10–24 years .............................................................................................. 24 Table 10. Observed to expected ratios for cancer by age group: all soccer players
diagnosed during 2002–2015 at ages 6–24 years ............................................... 24 Table 11. Sources of information for factors discussed in the descriptive epidemiology
section ................................................................................................................. 24 Table 12. Demographic factors ............................................................................................. 25 Table 13. Number of cancers among people reported to the project team by type of
cancer .................................................................................................................. 26 Table 14. Number of reports of risk factors for cancer ........................................................ 27 Table 15. Years of soccer play in relation to cancer diagnosis.............................................. 28 Table 16. Washington Youth Soccer defined levels of soccer play ....................................... 28 Table 17. Selected characteristics of play by Washington Youth Soccer-defined levels of
soccer play ........................................................................................................... 28 Table 18. Numbers of soccer players on middle school, high school and college teams. .... 29 Table 19. Number of goalkeepers by levels and types of play ............................................. 30 Table 20. Field surfaces used for practice ............................................................................. 32 Table 21. Surfaces during games .......................................................................................... 33

iv

v
April 2017 Revisions After publishing the report “Investigation of Reported Cancer among Soccer Players in Washington State” in January 2017, the Department of Health realized the purpose and conclusions from the investigation were not stated clearly enough in the report. A complete review of the data after publication also identified some minor errors in the data. The department published the following revision to ensure the data were accurate and the conclusions were not misinterpreted.
To clarify the purpose of the investigation and explain why we did not actively look for soccer players with cancer, we provided information on the cluster investigation process used by the Department of Health. Details from the Department of Health Guidelines for Investigating Clusters of Chronic Disease and Adverse Birth Outcomes (Guidelines) are provided below and can be found in the background section of the Executive Summary and main report. The full Guidelines are available upon request.
The Guidelines provide a standardized approach to investigating potential non-infectious disease clusters. Stage 1 of the investigation involves collecting information on the disease of concern and determining if criteria to continue the investigation have been met. These criteria include: at least 3 cases of the same or similar conditions, or a specific exposure of concern where a potential route of exposure is alleged as the cause of the cluster. Initial review of the cases reported by Coach Griffin met these criteria so we proceeded to Stage 2. Stage 2 involves providing an initial assessment of the magnitude of the reported cluster and whether there is enough concern to continue investigating. As part of Stage 2, we developed an initial case definition, validated the reported cancers, explored background rates of disease, conducted a literature review of childhood leukemia and lymphoma, and assessed the literature on crumb rubber and the potential for exposures that could result in elevated rates of cancer. The January 2017 report described methods and findings from Stage 2 of the protocol.
The Guidelines list the following criteria for moving to Stage 3:
· At least 3 cases of the same condition, an excess of cases that is at least marginally statistically significant, AND one or more of the following:
o The disease is of known etiology and there is potential for exposure to the causal agent OR
o Scientific literature supports an association between the reported exposure and the reported condition OR
o The disease is of unknown etiology and there is potential for exposure to a rare or unusual substance (i.e., these exposures are unique to an area or an occupation and are not commonly found in other places in Washington or the United States) OR
o The disease is extremely rare
Our investigation showed that we did not meet the criteria for moving beyond Stage 2 of the investigation. When we explored Coach Griffin’s data, we noted that the people on her list were diagnosed over an extended period of time, across a broad range of ages, and included
vi
a number of different cancer types. While we did have more than three soccer players with leukemia, Hodgkin lymphoma and Non-Hodgkin lymphoma, we did not meet any of the other conditions for continuing our investigation. Thus, we did not progress to Stage 3 which would have entailed efforts to identify all soccer players ages 6–24 years old diagnosed with cancer in the state during 2002–2015.
The purpose of our investigation was to explore whether the information from Coach Griffin’s list warranted further public health response. Our investigation was not designed to determine if soccer players in general were at increased risk of cancer due to exposures from crumb rubber in artificial turf. Our findings do not support further public health response at this time. The available scientific literature suggests exposures to toxic chemicals from crumb rubber are very low, however, questions remain about potential toxicities and levels of exposure. Therefore, we will continue to monitor research in this area.
In addition to clarifying the purpose and conclusions of the report, this revised report corrects the following data errors.
· Executive summary: Review found that two-thirds of respondents were playing soccer at the time of getting cancer and one-third had stopped playing soccer. The original noted three-quarters and one quarter, respectively.
· Table 15: The years between ending soccer play and diagnosis for the 33 participants was changed from 0-13 to 0-9 years. The change was necessitated by gaps in play (e.g., playing for several years, stopping play for several years and then playing again) for several participants that had not been accounted for previously.
· Table 17: The median years of playing recreational level soccer for those meeting the case definition was changed from 5 to 5.5 due to an error in transferring from Microsoft Excel to Microsoft Word.
· Table 18: One person who met the case definition and played soccer in high school was erroneously characterized as playing soccer in high school and college. Correcting this error resulted in increasing the number of high school only players by one (becoming 8 for all participants and 5 for those meeting the case definition) and reducing the number of high school and college players by one (becoming 4 for all participants and 3 for those meeting the case definition).
· Table 19: The same error described for Table 18 resulted in reducing the number of college goalkeepers by one (becoming 4 for all participants and 3 for those meeting the case definition). There was also an unexplained error in the number of total participants playing goalie at any level, changing the count from 14 to 16.
· Table 20: A weighting error in parsing percentage of play on artificial turf into indoor and outdoor play resulted in moving one person meeting the case definition from the 25-<50 percent quartile to the 0-<25 percent quartile for indoor artificial turf (changing 2 to 1 and 22 to 23, respectively) and vice versa for percent of time on outdoor artificial turf (changing 8 to 9 and 11 to 10, respectively). These changes also required changes in the quartiles for all players, because “all players” include those meeting the case definition. The median percent of time on outdoor artificial turf

vii
also increased from 25-29 percent to 30-34 percent for players meeting the case definition.
· Table 21: The same weighting error described for Table 20 affected Table 21. A programming error in the calculation of percent of total time spent on artificial turf compounded the weighting error. This resulted in changes for 6 of the 8 entries for quartiles of percent of time playing on grass or dirt and 5 of the 8 entries, as well as the medians, for playing on outdoor artificial turf. The medians for both players meeting the case definition and all players changed from 30-34 percent of time on outdoor artificial turf to 35-39 percent.


1
Executive Summary Background University of Washington Women’s Associate Head Soccer Coach Amy Griffin became concerned about the amount of cancer among soccer players in Washington State and compiled a list of soccer players with cancer. Coach Griffin was especially concerned about the number of goalkeepers she identified with cancer and wondered whether exposure to crumb rubber infill in artificial turf might be causing it. The list included 53 people, most of whom played soccer. Due to heightened public concern and the large number of people on the list, public health officials at the Washington State Department of Health and researchers from the University of Washington School of Public Health formed a project team to investigate following the Department of Health Cluster Guidelines (see p. iv for additional detail). The overall purpose of the investigation was to explore whether the information from Coach Griffin’s list warranted further public health response. The main goals of the investigation were to:
1) Compare the number of cancers among soccer players on the coach’s list to the number that would be expected if rates of cancer among soccer players were the same as rates among all Washington residents of the same ages.
2) Describe individuals reported by the coach in terms of their demographics, factors related to cancer, and history of playing soccer and other sports. Note: The investigation was not designed to determine if soccer players in general were at increased risk of cancer due to exposures from crumb rubber in artificial turf.
To provide background for accomplishing the two main goals, we:
1) Compared cancer types, rates and changes in rates over time among Washington and U.S. residents, ages five to 24 years old. We did not find unusual patterns of cancer in Washington compared to the United States.
2) Reviewed the scientific and medical literature to understand factors that increase the likelihood of getting leukemia or lymphoma—the two types of cancer most frequently reported by the coach—as a child or adolescent. This review noted that leukemia and lymphoma are complex diseases that can only rarely be attributed to a single cause or exposure. Exposures during the prenatal and early postnatal periods may be particularly important, because they can disrupt processes that are important for normal health and development.
3) Reviewed research on the relationship of crumb rubber, recycled rubber products and artificial turf to human health. Crumb rubber is made from tires or other rubber products that are ground into small pieces to provide a soft infill for artificial turf fields. Crumb rubber has become popular because of its relatively low cost and long life. Seven review articles published in the last 10 years all concluded that playing on artificial turf fields is unlikely to expose children, adolescents or adults to sufficient levels of chemicals from the fields to significantly affect health. However, there are still unanswered questions due to limitations in existing research

2
Methods for Primary Goals Comparing the observed and expected number of cancers To compare the number of cancers observed among soccer players on Coach Griffin’s list to the number that would be expected if rates among soccer players were the same as all Washington residents, we took several steps.
Tabulating the observed number of cancers. For this part of the investigation, we specified how we would count soccer players with cancer. We defined observed cancers as cancers among people who:
· Were diagnosed during 2002–2015. · Were six to 24 years old at the time of the diagnosis. · Played soccer while living in Washington State at some point before getting cancer. · Began playing soccer at least 0.4 years before diagnosis.
We refer to people meeting the above criteria as people who “meet the case definition.” We limited the case definition to people who were ages six to 24 years when diagnosed, because processes leading to the development of cancer are often different for children and adults.
Calculating the number of cancers expected among soccer players. To determine the number of cancers expected among soccer players if rates among soccer players were the same as rates among all Washington residents of the same ages, we needed to estimate the number of people ages six to 24 years old at any point during 2002–2015 who had played soccer while living in Washington. We used Washington Youth Soccer (WYS) enrollment information from 1983–2015 to estimate the number of people who had played soccer. This is a subset of all people ages six to 24 years during each year from 2002–2015. We needed information beginning in 1983, because a person diagnosed with cancer at age 24 in 2002 could have begun playing soccer at age six in 1983. People who played soccer and were ages six to 24 years during each year from 2002–2015 make up the population from which the observed cases of cancer come. For every year that a person could have developed cancer and been considered in the group of observed cases, they contribute one person-year at risk. The number of people who played soccer times the number of years over which they could have developed cancer from 2002–2015 is the total person-years at risk from which we can calculate the expected number of cancers. We multiplied the total person-years at risk in each year of age by Washington cancer rates for each year of age. We added the number of cancers expected at each age to get the total number of expected cancers.
Ratio of the number of cancers observed to the number expected. We computed ratios of the observed number of cancers diagnosed from 2002–2015 among soccer players on the coach’s list who were six to 24 years at diagnosis to the expected number of cancers described above. We computed these ratios for all cancers combined among all players, players at the WYS-defined select and premier levels, goalkeepers and players grouped by age. We also computed these ratios for leukemia, non-Hodgkin lymphoma and Hodgkin lymphoma for the same groups of players.

3
Describing selected characteristics of people reported to the project team. We interviewed people or parents of people on the coach’s list to obtain information on demographics, cancer-related factors, and history of playing soccer and other sports.
Results Response rate. We obtained interviews for 35 of the 53 people on Coach Griffin’s list (66 percent), including 25 of the 27 (93 percent) people who met the case definition.
Comparing the observed number of cancers among soccer players to the expected number. The 27 people meeting the case definition had 28 primary cancer diagnoses. The number of cancers expected to occur in Washington among comparable soccer players was 1,384. Thus, the number of cancer cases on the coach’s list was about two percent of the number expected. The numbers of cancer cases on the coach’s list for specific cancer types, as well as for goalkeepers and for select and premier players were also lower than expected.
Table 1. Observed cancers from coach’s list and expected cancers: soccer players ages 6–24 years diagnosed during 2002–2015
Observed cancers
from coach’s list
Expected cancers
Ratio of observed to
expected
95 percent confidence
interval
All soccer players All types of cancer 28 1,384 0.02 0.01-0.03 Leukemia 6 131 0.05 0.02-0.10 Hodgkin lymphoma 5 147 0.03 0.01-0.08 Non-Hodgkin lymphoma 6 89 0.07 0.02-0.14 Goalkeepers 14 153 0.09 0.05-0.15 Select/premier soccer players 15 284 0.05 0.03-0.09
Selected characteristics of people on Coach Griffin’s list. Demographics and types of cancer. Coach Griffin’s list included more females and more people living in King County than we would expect given WYS enrollment and U.S. Census data. There were 55 primary cancers among the 53 people on the coach’s list: 11 leukemias, 13 non-Hodgkin lymphomas, 11 Hodgkin lymphomas, four bone cancers, three soft-tissue sarcomas and three brain cancers, all of which had multiple subtypes. Ten people had eight other types of cancer. The 53 people ranged from three to 51 years old when they got cancer and all but three were diagnosed during 2002–2015.
Soccer. The shortest amount of soccer play was one season for one year, but about half of the interviews indicated soccer playing for at least 10 years before getting cancer. About half of the interviews showed soccer play beginning at four to six years old, two-thirds as playing soccer at the time of getting cancer, and one-third as having stopped playing soccer for between one and nine years before getting cancer. The proportion of select and premier players on the coach’s list was higher than expected based on WYS estimates of the percent of players at these levels. Based on estimates of the percentage of all soccer players who are goalkeepers, there were also more goalkeepers than expected.

4
Interviews indicated players practiced on about 110 different soccer fields in Washington. Most fields were reported once or twice. Two fields were each reported in four interviews. All interviews with detail on types of artificial surfaces included exposure to crumb rubber through soccer or other activities. Most soccer play, however, was on grass. Averaged across all reported play, half of the soccer players practiced on grass or dirt 70–74 percent of the time; on outdoor artificial turf 20–24 percent of the time; and on indoor artificial turf zero to four percent of the time. Interview participants spent more time on artificial turf for games, but most games for most players were on grass.
Discussion We found that the number of cancers among all soccer players reported by Coach Griffin was less than expected given rates of cancer in Washington residents. This was also true for the number of cancers among select and premier players and goalkeepers on the coach’s list, even though the list included larger percentages of these players than percentages of these groups enrolled with WYS.
Although there were several instances where participants practiced on the same fields, overall participants reported a large number of different fields suggesting that no specific field was potentially problematic. Given the ubiquity of crumb rubber infill, it is not surprising that all participants reported exposure through soccer, other activities or both. For most participants, most soccer play was on grass. Averaging the amount of time spent on outdoor and indoor artificial turf across all years of play, however, can mask intense play on artificial turf for periods of time. This can occur, for example, when someone plays on grass for many years before beginning to play adult recreational soccer on a league that consists exclusively of indoor games on artificial turf.
These findings are subject to several limitations. The list from the coach likely did not include all soccer players ages six to 24 years old who developed cancer during 2002–2015. The coach primarily works with skilled female goalies, which might have resulted in the relatively high percentages of females, select and premier players, and goalkeepers on her list. The coach might also be most familiar with cancer cases among soccer players in King County due to her working primarily in that county. Other soccer players with cancer were likely missed. There are also potential errors in the computation of the expected number of cancers among soccer players resulting from the need to make several assumptions about the numbers and ages of players each year from 1983–2015. None of the limitations are substantial enough to affect our conclusions. The findings from the interviews, however, might best represent characteristics of females, WYS-defined select and premier soccer players, goalies and players from King County, rather than soccer players overall.
Conclusions and Recommendations Our investigation was not designed to determine if soccer players in general were at increased risk of cancer due to exposures from crumb rubber in artificial turf. Rather, its purpose was to explore whether the information from Coach Griffin’s list warranted further public health response.

5
This investigation found less cancer among the soccer players, select and premier players, and goalkeepers on the coach’s list than expected based on rates of cancer among Washington residents of the same ages. In addition, the currently available research on the health effects of artificial turf does not suggest that artificial turf presents a significant public health risk. Assurances of the safety of artificial turf, however, are limited by lack of adequate information on potential toxicity and exposure.
The Washington State Department of Health recommends that people who enjoy soccer continue to play irrespective of the type of field surface. The Washington State Department of Health will continue to monitor new research that emerges on the health and environmental impacts of crumb rubber.
6
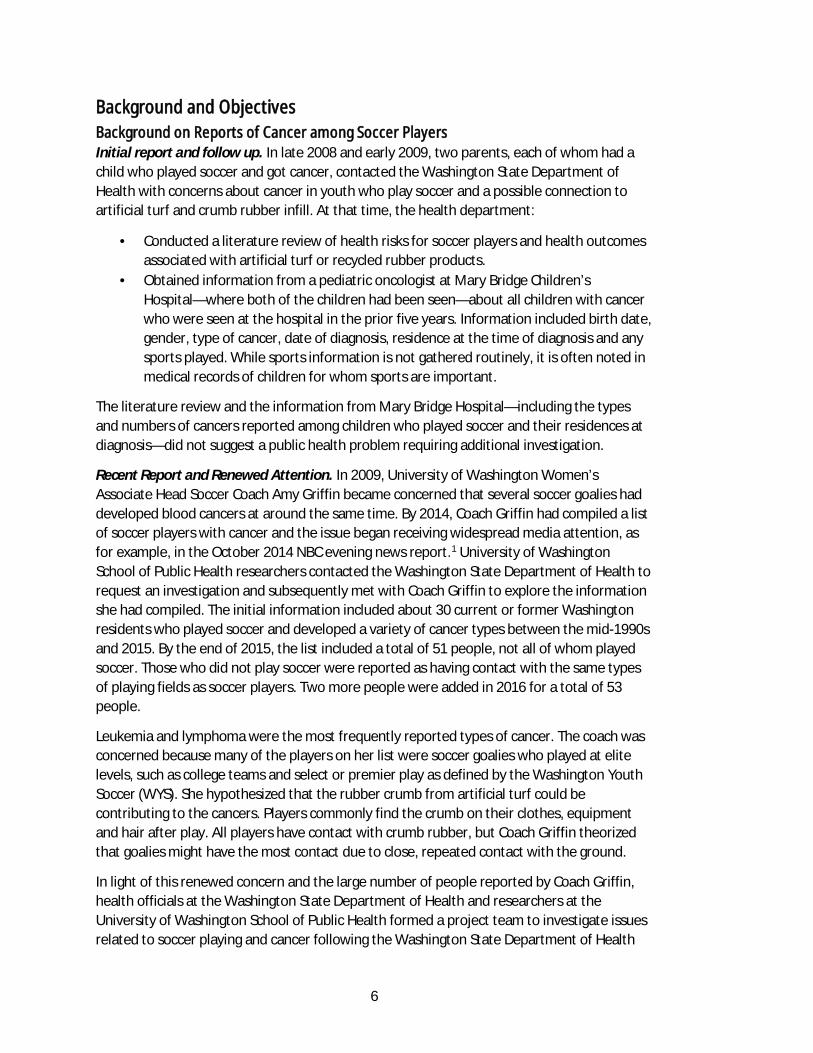
Background and Objectives Background on Reports of Cancer among Soccer Players Initial report and follow up. In late 2008 and early 2009, two parents, each of whom had a child who played soccer and got cancer, contacted the Washington State Department of Health with concerns about cancer in youth who play soccer and a possible connection to artificial turf and crumb rubber infill. At that time, the health department:
· Conducted a literature review of health risks for soccer players and health outcomes associated with artificial turf or recycled rubber products.
· Obtained information from a pediatric oncologist at Mary Bridge Children’s Hospital—where both of the children had been seen—about all children with cancer who were seen at the hospital in the prior five years. Information included birth date, gender, type of cancer, date of diagnosis, residence at the time of diagnosis and any sports played. While sports information is not gathered routinely, it is often noted in medical records of children for whom sports are important.
The literature review and the information from Mary Bridge Hospital—including the types and numbers of cancers reported among children who played soccer and their residences at diagnosis—did not suggest a public health problem requiring additional investigation.
Recent Report and Renewed Attention. In 2009, University of Washington Women’s Associate Head Soccer Coach Amy Griffin became concerned that several soccer goalies had developed blood cancers at around the same time. By 2014, Coach Griffin had compiled a list of soccer players with cancer and the issue began receiving widespread media attention, as for example, in the October 2014 NBC evening news report.1 University of Washington School of Public Health researchers contacted the Washington State Department of Health to request an investigation and subsequently met with Coach Griffin to explore the information she had compiled. The initial information included about 30 current or former Washington residents who played soccer and developed a variety of cancer types between the mid-1990s and 2015. By the end of 2015, the list included a total of 51 people, not all of whom played soccer. Those who did not play soccer were reported as having contact with the same types of playing fields as soccer players. Two more people were added in 2016 for a total of 53 people.
Leukemia and lymphoma were the most frequently reported types of cancer. The coach was concerned because many of the players on her list were soccer goalies who played at elite levels, such as college teams and select or premier play as defined by the Washington Youth Soccer (WYS). She hypothesized that the rubber crumb from artificial turf could be contributing to the cancers. Players commonly find the crumb on their clothes, equipment and hair after play. All players have contact with crumb rubber, but Coach Griffin theorized that goalies might have the most contact due to close, repeated contact with the ground.
In light of this renewed concern and the large number of people reported by Coach Griffin, health officials at the Washington State Department of Health and researchers at the University of Washington School of Public Health formed a project team to investigate issues related to soccer playing and cancer following the Washington State Department of Health

7
Guidelines for Investigating Clusters of Chronic Disease and Adverse Birth Outcomes (see April 2017 Revisions for more details). Appendix A lists the members of the project team.
Objectives The overall purpose of the investigation was to explore whether the information from Coach Griffin’s list warranted further public health response. The primary goals of the investigation were to:
1) Determine whether the number of cancer diagnoses among the soccer players on the coach’s list was higher than would be expected if rates of cancer among these soccer players were similar to rates among all Washington residents of the same ages (referred to as “observed to expected ratios” below).
2) Describe individuals from the coach’s list in terms of their demographics, factors related to cancer and history of playing soccer and other sports (referred to as “descriptive epidemiology” below).
Note: The investigation was not designed to determine if soccer players in general were at increased risk of cancer due to exposures from crumb rubber in artificial turf
Notably, this investigation is not designed to add to our understanding of the risks or benefits of crumb rubber fields or to discover the causes of cancer among the people reported to the project team. These concerns could not be addressed due to the diversity of the types of cancer, the lack of known causes for most cancer in children and young adults, little information about the potential for chemicals in crumb rubber to cause toxic exposures, and no biological or environmental testing.
To provide a background for accomplishing the primary objectives, we also:
1) Compared cancer rates and changes in rates over time among children and young adults in Washington to those seen nationally, in order to consider whether cancer rates and trends in Washington are unusual.
2) Reviewed the scientific and medical literature to understand factors that increase the likelihood of developing leukemia or lymphoma.
3) Reviewed published papers related to crumb rubber and recycled rubber products to determine:
a. Whether crumb rubber or components of crumb rubber have been associated with specific diseases or adverse health conditions.
b. Whether and how athletes who play on crumb rubber fields may be exposed to hazardous levels of chemical components of crumb rubber.
Background on Rates of Cancer in Washington and the United States State law (RCW 70.54.230) authorizes the Washington State Cancer Registry (referred to in this report as “cancer registry”) to collect cancer-related information for Washington residents diagnosed and treated for cancer, including residents diagnosed and treated in other states. The cancer registry can be used to compute Washington’s rates of cancer diagnoses (cancer incidence), compute changes in rates over time, and compare incidence

8
rates in Washington to rates in other places. For this report, we used the cancer registry’s January 2016 data release that included complete information for 1992–2013.2
The Surveillance, Epidemiology and End Results (SEER) program of the National Cancer Institute provides information on cancer incidence nationally. For this report we used national cancer data from 13 SEER regions available from SEER*Stat for all analyses except for the most frequently diagnosed types of cancer. For that analysis, national data are from 18 SEER sites also available from SEER*Stat.3 We used the Washington State Department of Health mortality files to assess death from cancer in Washington and mortality data available through SEER*Stat for national cancer deaths.3,4
Population counts needed for calculating the Washington State rates are from the Washington State Office of Financial Management. These include intercensal interpolations for 1992–1999 and 2001–2009, U.S. Census data for 2000 and 2010, and postcensal estimates for 2011–2013.5 Population counts for calculating national rates are available through SEER*Stat.
SEER data are available by five-year age groups. To compare Washington and national rates, we focused on ages five to 24 years because these ages were the closest to the six- to 24-year age group in the case definition described in the Methods section below. We compared age-adjusted incidence rates for all cancers combined, leukemia, non-Hodgkin lymphoma and Hodgkin lymphoma. Age-adjustment allows us to compare rates among groups with different age distributions. It helps us to understand whether there are differences among groups independent of differences in numbers of people at older or younger ages. This is important when looking at cancer rates because cancer rates are higher for some age groups than for others.
Except for assessing changes over time, we computed age-adjusted rates for 2009–2013 combined so that random year-to-year fluctuations would be less likely to influence the findings. For assessing changes over time, we computed age-adjusted incidence rates for each year from 1992–2013. We used Joinpoint software to analyze changes in these rates over time.6
Appendix B provides additional detail of the methods used for these calculations.
Combining all types of cancer, Washington residents ages five to 24 years had an average of 439 cancers diagnosed and an average of 55 deaths from cancer each year during 2009–2013. Lymphoma, brain and other nervous system, and leukemia were the most frequently diagnosed cancers, followed by thyroid, melanoma of the skin, and testes. These were also the six most frequently diagnosed cancers among U.S. residents ages five to 24 years.
Table 2. Age-adjusted cancer incidence rates per 100,000 people ages 5–24 in Washington and the United States, 2009–2013 Type of Cancer Washington State United States All types of cancer combined 23.6 22.4 Leukemia 3.1 3.3 Non-Hodgkin lymphoma 1.5 1.7 Hodgkin lymphoma 2.3 2.2

9
During 2009–2013, the age-adjusted cancer incidence rate for all types of cancer combined among people ages five to 24 years was statistically significantly higher in Washington than in the United States (23.6 and 22.4 per 100,000 people, respectively). Even though Washington’s rate is statistically significantly higher than the rate in the United States, the difference is small—about one person per 100,000—and does not suggest an unusual amount of cancer in Washington. The age-adjusted death rates were similar (3.0 per 100,000 people in Washington and 2.9 per 100, 000 in the United States). Washington’s age-adjusted rates for new diagnoses of leukemia, non-Hodgkin lymphoma and Hodgkin lymphoma were similar to the national rates, as was the age-adjusted rate for both types of lymphoma combined.
From 1992 to 2013, changes in age-adjusted incidence rates among people ages five to 24 years were slightly different in Washington and the United States. For all types of cancer combined, Washington’s rates fluctuated more than did rates in the United States. Greater random variability in Washington than in the United States due to Washington’s smaller population is likely the reason for this pattern.
Figure 1. Age-adjusted cancer incidence (all types combined), ages 5–24, Washington and United States
After accounting for random variability, incidence rates for all cancers combined among Washington residents ages five to 24 years increased slightly from 1992 to 2013. In the United States, these rates did not change from 1992 to 1994; increased steadily at about three times the rate of the increase in Washington from 1994 to 2009; and leveled off again from 2009 to 2013. Incidence rates of leukemia and non-Hodgkin lymphoma stayed the same in Washington; nationally, the leukemia rate increased slightly and the rate for non-Hodgkin lymphoma increased steadily. The incidence rate of Hodgkin lymphoma decreased steadily in Washington and stayed the same in the United States. Overall, we concluded that changes in Washington were not unusual compared to changes seen nationally.
0
5
10
15
20
25
30
1992
1993
1994
1995
1996
1997
1998
1999
2000
2001
2002
2003
2004
2005
2006
2007
2008
2009
2010
2011
2012
2013
Washington State Rate National (13 SEER Regions) Rate

10
Table 3. Annual percent change in age-adjusted cancer incidence rates per 100,000 people ages 5–24 in Washington and the United States, 1992–2013
Type of Cancer Washington State United States All types of cancer combined
0.4 percent increase per year
1.2 percent increase per year, 1994-2009; no change 1992-1994, 2009-2013
Leukemia No change 0.9 percent increase per year Non-Hodgkin lymphoma No change 1.4 percent increase per year
Hodgkin lymphoma 1.3 percent decrease per year No change
Background on Leukemia and Lymphoma Leukemia. Leukemia, a cancer of the blood and bone marrow, is the most common type of childhood cancer in the United States. This diagnosis accounts for approximately 30 percent of all cancers among children less than 15 years old.7 Leukemia is also one of the most common cancers among adolescents and young adults, ages 15–24.8
There are two primary subtypes of childhood leukemia, acute lymphocytic leukemia (ALL) and acute myelogenous leukemia (AML). ALL comprises about 75 percent of all childhood leukemia and is most common in children between two and four years old. By contrast, AML, which develops from a different type of cell than ALL, is often detected in children under age two, as well as during adolescence.7,8
Lymphoma. Lymphoma is a cancer of the white blood cells, called lymphocytes, that are part of the body’s immune system. Lymphocytes are present in many parts of the body, such as in lymph nodes, the spleen, bone marrow and the digestive tract. Lymphoma is the third most common type of childhood cancer and also one of the most common cancers among adolescents and young adults, ages 15–24.9
The two primary lymphoma subtypes are non-Hodgkin lymphoma (NHL) and Hodgkin lymphoma (HL). NHL accounts for about five percent of all childhood cancer in the United States and most of the lymphoma diagnosed in children less than 14 years old. It is two to three times more common in males than females, and it is more common in white children than African-American children.10 HL is the most commonly diagnosed cancer among adolescents and young adults but is much less common in young children.11,12 In young children, HL is about five times more common among males, while in adolescents, HL is slightly more common among females.12
Risk factors for leukemia and lymphoma. Risk factors for a disease increase the chances of developing the disease. Leukemia and lymphoma are complex diseases that can only rarely be attributed to a single cause or exposure. Rather, both genetic and non-genetic factors, such as infections and toxic chemicals, likely play roles in disease development. The scientific and medical literature describes several factors that most scientific, medical and other cancer-related organizations accept as known risk factors for leukemia, lymphoma or both. Other risk factors are more controversial. Exposures during the prenatal and early postnatal periods may be particularly important, because they can disrupt processes that are important for normal health and development.

11
We investigated risk factors for cancer in children and adolescents through an online search of scientific and medical research using PubMed and Google Scholar. We included search terms such as “‘child’ and ‘leukemia’ and ‘risk factor’” and "‘child’ and ‘lymphoma’ and ‘risk factor.’" We focused on studies that followed groups of children over time who were exposed or not exposed to one risk factor (cohort studies); studies that compared children with and without cancer for exposure to a given risk factor (case-control studies); and studies that combined results from multiple cohort or case-control studies (meta-analyses). We also consulted online information from the American Cancer Society and the National Cancer Institute and a publication of the American Academy of Pediatrics (AAP).13
Below are tables that highlight several known or suspected risk factors for leukemia and lymphoma in children and adolescents. Some factors have been studied extensively and are well accepted as increasing the risk of developing leukemia, lymphoma or both. Others are less well documented or more controversial. The tables include the AAP’s designation of factors as known or suggested risk factor and ACS’ designations of known or possible risk factors.
Table 4. Risk Factors for Leukemia among Children and Adolescents
Risk Factor
AAPa and ACSb Designations or Other Evidencec Brief Description/Notes
Selected References
Ionizing radiation
AAP: known ACS: known
In utero and early life exposure to ionizing radiation is a well-established risk factor for leukemia, particularly AML. Possible sources of ionizing radiation include x-rays and CT scans.
14,15,16,17,18
Family history AAP: known ACS: known
Individuals are at higher risk of developing leukemia if they have siblings (especially a twin), parents, or other close relatives with a prior leukemia diagnosis.
14,19
Inherited genetic conditions
AAP: known ACS: known
Examples of specific genetic conditions that may increase risk of developing leukemia include: Down syndrome, Klinefelter syndrome, Faconi anemia, and Bloom syndrome. These conditions are commonly diagnosed at birth or in early childhood.
20,21
Birth weight AAP: known Birth weight greater than 4,000 grams has been linked to the development of ALL in some epidemiological studies.
14,22,23
Chemotherapy treatment
AAP: known ACS: known
Treatment with certain chemotherapy drugs for cancers lead to higher risk of developing other cancers. These cancers usually develop 5-10 years after the initial treatment.
7,24
Pesticide exposure
AAP: suggested ACS: possible
Studies report associations between preconception, fetal and/or early life exposure to pesticides and the development of leukemia. However, there are only a limited number of studies that have assessed this association and so further work is needed to provide definitive conclusions.
14,22,25,26,27,
28
a AAP = American Academy of Pediatrics13 b ACS = American Cancer Society29 c Other evidence only for factors not included in AAP or ACS classifications

12
Table 4 (continued). Risk Factors for Leukemia among Children and Adolescents
Risk Factor
AAPa and ACSb Designations or Other Evidencec Brief Description/Notes
Selected References
Solvent exposure
AAP: suggested ACS: possible
Preconception, fetal, and early postnatal exposure to solvents has been linked to the development of leukemia. Benzene is one solvent of particular concern, given that it is also an established cause of adult leukemia.
14,30,31,32
Maternal age AAP: suggested ACS: possible
Maternal age older than 35 years during pregnancy has been associated with increased risk of leukemia development.
22,33
First-born child AAP: suggested
There is conflicting evidence about the role of birth order in leukemia risk, but some studies suggest that first-born children are at higher risk. Some theorize that this increased risk is related to decreased early life immune stimulation. (See below.) Children with older siblings are likely to be exposed to communicable diseases from their older siblings, while firstborn children may have fewer extra exposures that help their systems develop.
34,35
Decreased early life immune stimulation
Epidemiological evidence
Some studies suggest that early life immune stimulation (ex: contact with farm animals and daycare attendance) can promote normal immune system development and prevent cancer. Other studies, however, report no association.
14,22,33,35,36
Electromag-netic fields ACS: possible
A 2002 report from the International Agency for Research on Cancer (IARC) classified extremely low frequency electromagnetic fields as “possibly carcinogenic to humans.”
37,38,39,40,41
Hazardous air pollutants/ traffic pollution exposure
Epidemiological evidence
Examples of air pollutants that may increase risk of developing leukemia include: polycyclic aromatic hydrocarbons (PAHs), diesel exhaust, and benzene.
31Error!
Bookmark not
defined.,42,43,
44
Maternal alcohol use during pregnancy
ACS: possible
Fetal alcohol exposure has been associated with increased risk of leukemia, particularly AML.
14,15,22,45
Maternal infection during pregnancy
Epidemiological evidence
Studies suggest that maternal infection during pregnancy could provide an initial genetic disruption that increases the risk of childhood cancer.
34,46
Paint exposure Epidemiological evidence
Studies report associations between preconception, fetal, or early life paint exposure and the development of leukemia.
30,47
a AAP = American Academy of Pediatrics13 b ACS = American Cancer Society29 c Other evidence only for factors not included in AAP or ACS classifications

13
Table 5. Risk Factors for Lymphoma among Children and Adolescents
Risk Factor AAPa and ACSb designations or other evidencec Brief Description/Notes
Selected References
Family history AAP: known ACS: possible
Individuals are at higher risk of developing lymphoma if they have siblings (especially a twin), parents, or other close relatives with a prior lymphoma diagnosis.
48,49
Immune deficiency
AAP: known ACS: known
Weakened immune systems may result from inherited genetic conditions (ex: Wiskott-Aldrich syndrome, Ataxia-telandiectasia, and Bloom syndrome), HIV/AIDS, or specific drug treatments to suppress immune responses after organ transplants.
50,51
Viral infections
AAP: known ACS: known
Epstein-Barr virus (EBV) has been classified by the International Agency for Research on Cancer (IARC) as a known human carcinogen that increases risk of lymphoma. 52,53,54,55,56,
57,58,59
ACS: known
IARC has also classified both Hepatitis B and C as known human carcinogens. Hepatitis C is listed as a causal factor for NHL, while Hepatitis B is listed as positively associated with NHL.
Autoimmune diseases
Epidemiological evidence
Autoimmune diseases including Sjogren disease, celiac sprue, and systemic lupus erythematosus (SLE) increase risk of lymphoma.
51,60,61,62
Decreased early life immune stimulation
Epidemiological evidence
Some studies suggest that early life immune stimulation (ex: contact with farm animals and daycare attendance) can promote normal immune system development and prevent abnormal responses leading to cancer. Other studies, however, report no association.
35,63
Birth weight Epidemiological evidence
Birth weight over 4,000 grams has been linked to the development of lymphoma in some, but not all, studies.
48,64
Hazardous air pollutants or pollution from traffic
Epidemiological evidence
Examples of relevant toxic air pollutants that may increase risk of developing lymphoma include: PAHs, diesel exhaust, and benzene.
31
Maternal smoking during pregnancy
Epidemiological evidence
Maternal smoking during pregnancy has been linked to increased risk of NHL.
65
Pesticide exposure
Epidemiological evidence
Some studies report associations between preconception, fetal and/or early life exposure to pesticides and the development of lymphoma, but overall results are inconsistent.
26,27,66,67
Solvent exposure
Epidemiological evidence
Preconception, fetal, and early postnatal exposure to solvents has been linked to the development of lymphoma.
31
aAAP = American Academy of Pediatrics13 bACS = American Cancer Society50,51 c Other evidence only for factors not included in AAP or ACS classifications
Crumb Rubber Artificial or synthetic turf fields were first introduced in the 1960s, under the brand “Astro-turf.” Over the next several decades, artificial turf fields became very popular. Now, many different manufacturers produce their own brands of artificial turf. Because artificial turf fields are not cushioned like natural grass fields, manufacturers use an infill to adjust the

14
firmness of fields to make them safer for athletes. Originally, manufacturers used sand as infill. However, the sand infill was quite hard and quickly became even more compacted through normal athletic play. Additionally, the sand infill often produced dust during play.68 Manufacturers looking for a softer and less dusty alternative soon turned to recycled rubber. Tires or other rubber products are processed into small pieces to provide a better infill for artificial turf fields. Although there are other types of infill—such as organic substances, virgin rubber, and coated sand—crumb rubber became very popular because of its relatively low cost and long life.68 First introduced in the 1980s, crumb rubber now is used as an infill in 98 percent of all artificial turf fields.69 Our understanding is that the first artificial turf fields with crumb rubber infill were installed in Washington in the late 1990s.70
Artificial turf may save water, avoid the need for fertilizers and pesticides, and provide a cushion to help prevent injuries from impact. Artificial turf provides a year-round playable surface, which may make it easier for youth and adults in Washington to be more physically active. However, in the past several years, people have voiced concerns about potential health effects from both artificial turf and crumb rubber infill. These include concerns about cancer, dehydration, and infection. If an artificial turf field is under direct sunlight, temperatures are often higher than natural turf temperatures71 and this may contribute to more heat-associated illnesses, like heat stress or dehydration.69 One study also found an association between “turf burns” from artificial turf and methicillin-resistant bacteria infections, commonly known as MRSA.72 Other concerns are related to the chemicals in the crumb rubber infill. Rubber tires used as infill contain many different chemicals, some of which have been linked to cancer. For example, the benzene found in some samples of crumb rubber is known to cause cancer.73,74 To understand if the chemicals in crumb rubber found in artificial turf fields may be linked to health risks, we reviewed recent publications about potential health effects from recycled rubber products and artificial turf fields.
Using Google Scholar and UWLibraries with search terms such as “’chemical’ and ‘artificial turf’” or “’health’ and ‘recycled tires’ and ‘hazard,’” we located review papers that were published in the last 10 years. Review papers are designed to examine the larger body of literature as a whole.
We found seven publications (Table 6), only one of which went through the scientific peer review process before publication.68 The remaining papers were gray literature published either by government agencies or consulting firms hired by a person, company, or government agency. Gray literature includes material such as government documents, research or materials published by non-governmental organizations, working papers, and white papers. Gray literature does not go through the scientific peer review process that characterizes publications in scientific journals. Papers that do not go through the scientific peer review process may be less reliable than those that do. One paper75 was published for the Rubber Manufacturers’ Association raising questions about potential conflicts of interest.
All seven publications concluded that children, teenagers, and adults are unlikely to be exposed to sufficient levels of the chemicals found in artificial turf fields to significantly affect health. One report discussed that indoor facilities using crumb rubber and lacking proper

15
ventilation may experience higher chemical concentrations in the air,76 but another paper contradicted this conclusion.77
Table 6. List of published reviews used to assess whether crumb rubber or components of crumb rubber have been associated with poor health
Title Author Published for Year of Publication
Evaluation of Health Effects of Recycled Waste Tires in Playground and Track Products
Government - Office of Environmental Health Hazard Assessment
State of California 2007
A Review of the Potential Health and Safety Risks from Synthetic Turf Fields Containing Crumb Rubber Infill
Consulting firm – TRC
New York City Department of Health 2008
Initial Evaluation of Potential Human Health Risks Associated with Playing on Synthetic Turf Fields on Bainbridge Island
Consulting firm – Windward Environmental LLC
Bainbridge Island Metro Parks and Recreation District; Bainbridge Island School District
Review of the Impacts of Crumb Rubber in Artificial Turf Applications
Academic Consulting – University of California Berkley
Manex 2010
Review of the Human Health and Ecological Safety of Exposure to Recycled Tire Rubber found at Playgrounds and Synthetic Turf Fields
Consulting firm – Cardno ChemRisk
Rubber Manufacturers’ Association 2013
Environmental and Health Impacts of Artificial Turf: A Reviewa
Academic Researchers – H. Cheng, Y. Hu, and M. Reinhard
Journal – Environmental Health and Technology Sciences
2014
Evaluation of Human Health Risks for Synthetic Field Turf
Consulting firm – Gradient
Lynnwood School District 2015
a Peer-reviewed paper
Although these papers all reached similar conclusions, there are still unanswered questions about the health effects from these chemicals due to limitations in existing research. To determine if health effects are associated with artificial turf or crumb rubber exposure, researchers need to understand realistic routes of exposure and estimated doses for each route as illustrated in the following diagram. To determine potential health effects, each step of the diagram shown below needs to be measured and studied to identify chemical exposure concentrations, duration of exposure and the dose received.

16
Figure 2. Diagram illustrating the possible routes of exposure from chemicals in artificial turf or crumb rubber
The routes of exposure show potential pathways chemicals travel from artificial turf infill into a human body. The most common routes of exposure to crumb rubber infill may be breathing (inhalation), eating (ingestion), and absorption through the skin, broken skin or cuts, or eyes. The potential dose describes exactly how much of a chemical that travels through a specific route of exposure ends up inside of the human body. The dose that ultimately ends up inside the body cannot be determined without information on the levels of chemicals in the exposure medium (for example, in the air or tire crumbs), as well as routes and durations of exposure. Without information on dose, scientists cannot determine the potential for chemicals to cause harm. Sometimes even when chemicals are present, the dose that enters the body is not large enough to cause harm. Most of the papers included in the reviews did not measure chemicals in the air or in crumb rubber or artificial turf, but rather estimated potential doses from information in other published reports. Thus, definitive conclusions about health risks cannot be made.
In addition to challenges from missing information on the route of exposure and dose, understanding any potential health effects from the chemicals in artificial turf or infill is difficult because the chemicals inside crumb rubber might differ depending on where the rubber came from and where and how it was recycled. A recent federal report by multiple agencies notes limited information on the variability of chemicals in crumb rubber, because most studies assessing the composition of the crumb rubber have been relatively small and restricted to a few fields or playgrounds.78 Furthermore, crumb rubber and artificial turf degrade over time.68 This means that the chemical exposures from a field that is one day old may be different from the exposures of the same field when it is one year old. These uncertainties make it difficult to understand the varying chemicals and potential amounts of chemicals in each field and crumb rubber infill and limit the ability of any paper to draw definite conclusions about potential health effects.
Thus, before we can more definitively understand the potential for artificial turf and crumb rubber infill to affect health, researchers need to describe routes of exposure, the specific chemical contents of turf fields in different areas and over different time periods, and doses. The recent federal report included an extensive literature review of information related to
Inhalation
Ingestion
Absorption through skin, broken skin,
mucous membranes
Off-gassing
Potential Health Effects Turf
Chemicals

17
the toxicity and human exposure to chemical constituents of crumb rubber. The report also detailed gaps in knowledge. Among other things, the report identified the need for greater understanding of exposures through the skin, eyes, and ingestion; identifying situations resulting in the highest exposures; monitoring levels of chemicals of concern in people; and assessing the feasibility of more in-depth epidemiologic study.78
Methods Calculating Observed to Expected Ratios Determining the number of observed individuals with cancer. One goal of the investigation was to determine whether the number of cancer cases on the coach’s list (the “observed” number) was more than what we might expect based on cancer rates among people of the same ages (the “expected” number). To do this, we first developed a “case definition” that specified how we would count observed cancers.
For this investigation people met the case definition if they met all of the following conditions:
· Were diagnosed with cancer during 2002–2015. · Were six to 24 years old at the time of the diagnosis. · Played soccer while living in Washington State at some point before getting cancer.
They did not need to be playing soccer or living in Washington when they were diagnosed.
· Began playing soccer at least 0.4 years before getting cancer.
We limited our time period for people meeting the case definition to 2002–2015, because reports of people with cancer were more likely to be complete during this time period than in earlier time periods. The only person who got cancer before 2002 was diagnosed in the mid-1990s before artificial turf fields were installed in Washington. Information for 2016 might not have been complete, because most of the work for this investigation was completed before the end of 2016. Two people were excluded from the case definition because they were diagnosed with cancer in 2016.
We limited the case definition to people who were ages six to 24 years when diagnosed, primarily because processes leading to the development of cancer are often different for children and adults. Most cancer investigations and research focus on children and adults separately, with children defined as under ages 15 or 20 years old. We opted to include people diagnosed up to age 24 years, because we wanted to include as many people as possible in the case definition without becoming so inclusive that we would lessen the potential to find a problem if one existed. This age group included about 70 percent of people reported to the project team.
We focused on soccer players, because this was the original group of concern, and most of the individuals reported to the project team played soccer. A relatively small number of people played a variety of other field sports or were exposed to crumb rubber through other activities.

18
Because cancer takes time to develop and be diagnosed, we also required a time lapse of about five months (0.4 years) between first playing soccer and diagnosis. The time between exposure to a cancer-causing agent and getting cancer is called the latency period. A 2012 publication on the Center for Disease Control and Prevention’s website noted a latency period of 0.4 years for the development of leukemia after exposure to low-level ionizing radiation.79 We used this minimum latency period to err on the side of including as many cancers as possible in the observed number of cancers. The time between beginning to play soccer and developing cancer was greater than 0.4 years for everyone reported to the project team. Thus, no one was excluded from meeting the case definition for this reason.
We limited our investigation to Washington residents because that is our jurisdictional authority, and information from the cancer registry was limited to Washington residents.
We used the cancer registry, reports to the project team and interviews (described below) to determine the number of people who met the case definition and the numbers and types of their primary cancers. Most of the demographic and cancer information from the cancer registry matched the information provided in interviews and from Coach Griffin. In the few instances where demographic or cancer information from these three sources did not match, we used information from the interviews where available, then information from the cancer registry, and finally information from the coach. Information about soccer playing was available from interviews and the coach. We relied on information from the interviews where possible and from Coach Griffin for people we did not interview.
Because of concerns about elite players and goalkeepers, we also tabulated the number of primary cancers among: 1) WYS-defined select and premier players and 2) goalkeepers. For this portion of the investigation, people were counted as goalkeepers if information from interviews indicated that they played goalkeeper at least 50 percent time at the WYS-defined select or premier levels or at least 25 percent time at the recreational level. We also included as goalies, one recreational level player who did not play the position for the first six years and then played goalie 30–50 percent of the time for three years and two people who were reported to the department as goalkeepers but were not interviewed. (See Descriptive Epidemiology in the Results section below for more detail.)
Calculation of expected number of cancer cases. The expected number of cancers is the number of cancers that would have occurred among soccer players if they experienced the same cancer rates as people of similar ages living in Washington. To compute the number of Washington soccer players ages six to 24 years expected to get cancer during 2002–2015, we needed to identify who would be “at risk” of developing cancer. The “at risk” population is the population from which the observed cancers come. People are included in the at-risk population if they were six to 24 years in any year of the study (2002–2015) and had played soccer in Washington for at least 0.4 years prior to the time during 2002-2015 they are considered to enter the at risk population. For every full year that they would have been included in the observed cases had they been diagnosed with cancer, they contribute one person-year at risk. “At-risk” refers only to the number of people times the number of years

19
over which they could get cancer. It does not refer to any theoretical risks from playing soccer or living in Washington.
To estimate the size of the at-risk population, we had to estimate the number of people who had ever played soccer who were ages six to 24 during 2002–2015. They did not have to play soccer during 2002–2015. For example, a person who began playing as a six-year-old in 1983, played for three years and was diagnosed with cancer before their 25th birthday in 2002 could be included as an observed case in this study. Thus, our count of the at-risk population needed to include people who had played from 1983 to 2015. We counted a person as contributing to the at-risk population if they were enrolled with the WYS between the ages of six and 15 (players ages 16 and older were assumed to have begun playing when they were 15 or younger) during 1983–2015. We calculated the total number of years lived by people during 2002–2015 while meeting these conditions: they were at least six years old and less than 25 years old and had started playing soccer at least 0.4 years previously. This is called the “person-years at risk.” Appendix C includes a detailed description of this calculation.
To make a definitive calculation of the person-years at risk, we would have needed a roster of everyone who played soccer in Washington State at ages six to 24 from 1983 through 2015. However, because the WYS only provided a tabulation of the number of youth players by age from 2000–2015, we had to make several assumptions.
First, because we only had counts of the total number of players for 1983–1999,80 we assumed that the age distribution of youth soccer players in each year during 1983–1999 was the same as in 2000. Second, we assumed a 10 percent turnover among players each year. If the previous year had fewer players than the current year, then we assumed that 90 percent of the previous year's players returned, and the difference was made up with new players. This was the case, for example, with the age seven enrollment in 2006 as less than the age eight enrollment in 2007. If the previous year had more players, then we assumed that the current year's players were 90 percent returnees and 10 percent new players. This was the case, for example, with the age 10 enrollment in 2006 being more than the age 11 enrollment in 2007. (See Table 2, Appendix C)
Third, we assumed that everyone who played on a soccer team at age 16 and older had also played at a younger age. We made this assumption because the WYS enrollment by age showed a big drop in the number of players at age 16. Fourth, we assumed that middle and high school players also played on a WYS team at some point.
Using these assumptions, we computed the person-years at risk at each year of age from six to 24 individually. To compute the expected number of cancer diagnoses among people who met the criteria for the case definition except for a known diagnosis of cancer, we multiplied the age-specific person-years at risk by Washington cancer rates from the cancer registry for 2002–2013 for each year of age. This calculation provided the number of cancer cases at each age that would be expected among all soccer players in Washington State if those players had the same cancer rates as all state residents of the same ages. We summed the

20
expected cancers at each age to determine the total number of cancer cases expected among soccer players ages six to 24 years from 2002-2015. We made similar calculations for WYS-defined select and premier players. WYS estimated that 20 percent of their athletes played at these levels.81
We made similar calculations to compute the person-years at risk for goalkeepers so that we could compute the expected numbers of cancer cases separately for them. Coach Griffin provided estimates of the numbers of goalkeepers at each age from ages 10–19. She compiled these estimates by talking with directors of coaching, club coaches or both from five of the larger clubs in Washington for both WYS-affiliated select and premier clubs. She also contacted a few smaller clubs to verify that their numbers were similar. Additionally, she talked with coaches at recreational clubs and noted that the number of goalkeepers on recreational teams was more difficult to assess, because players are not as specialized.82 Thus, the case definition for goalkeepers required a cancer diagnosis between ages 10–24. We computed the person-years at risk for each year of age 10 to 24. As above, we multiplied the age-specific person-years at risk by age-specific cancer rates to get the number of cancers expected for each year of age. We added the number of cancers expected at each age to get the total number of cancers expected among goalkeepers.
We compared the observed number of cancer diagnoses (described above) to the expected number of diagnoses by computing the observed to expected ratio (observed/expected or O/E). If the O/E ratio is one, we conclude that the observed and expected numbers of cancer diagnoses are the same. If the O/E is more than one, there are more observed cancers than expected; if it is less than one, there are fewer cancers than expected. We used an R software83 function to compute exact Poisson 95 percent confidence intervals for O/E. The 95 percent confidence interval provides an indication of the random variability of an estimate; wide confidence intervals indicate more random variability than narrow intervals. If the confidence interval for the O/E does not include one, we conclude that our observed number of cancers is statistically significantly different from the expected number. We computed O/E ratios for all cancers combined and O/Es individually for leukemia, non-Hodgkin lymphoma, and Hodgkin lymphoma. Details of these calculations are available in Appendix C.
Descriptive Epidemiology Our primary purpose for the descriptive section of this report was to better understand similarities and differences of the people reported to the project team in terms of their histories of cancer and playing soccer. The information on playing soccer might also be useful to researchers designing risk and exposure assessments.
Questionnaire. We developed a questionnaire that allowed us to broadly describe characteristics of the individuals reported to the project team in terms of their demographics, factors related to their cancer diagnoses, and history of playing soccer and other sports. We included questions on race and Hispanic ethnicity in the section on demographics, because some types of cancer are more common in some racial and ethnic groups than in others. We focused on risk factors for leukemia and lymphoma because those
21
were the types of cancer most frequently reported. All participants were asked about risk factors specific to leukemia and lymphoma regardless of the types of cancer with which they were diagnosed.
Information related to playing soccer allowed us to describe the reported individuals in terms of the durations, types of play (such as recreational or select soccer), fields, turf types, and positions (goalkeeper) played. Because of the concern about crumb rubber, information about other sports focused on sports played on artificial turf only.
The questionnaire was conducted as a telephone interview. The interviewer read the questions to participants and recorded their answers in writing. One minor provided information with parental approval, and one parent provided partial information for an adult. Otherwise, people ages 18 and older provided their own information, and parents provided information for children under 18 and for people who had died. Throughout the remainder of this report, the term “participants” refers to people who provided their own information and to children and deceased adults whose parents provided information. Appendix D provides a copy of the questionnaire.
Contacting individuals. The list provided by Coach Griffin included names of individuals with cancer, parents’ names for children and young adults, email addresses for most people with cancer or their parents and some telephone numbers. We initially used a secure website at Public Health – Seattle & King County to email information about the investigation and invite participation. We sent second emails to those who did not respond to the initial invitation. We then focused on calling potential participants who seemed to meet the case definition and either had not responded to the emails or whose contact information from Coach Griffin did not include email addresses. We focused on contacting this group because information about these soccer players was essential for determining whether there was more cancer among the soccer players reported to the project team than in the general population. We did not attempt to contact one person who potentially met the case definition, because Coach Griffin indicated the individual did not want to be contacted. We used a combination of telephone numbers provided by the coach and numbers available through Whitepages® at whitepages.com.
Approach to interviewing. Many questions on the questionnaire lent themselves to a structured interview in which the interviewer read questions in exactly the same way to everyone without diverging from the set script. Information for some questions, however, was more easily gathered using a semi-structured approach. A semi-structured approach allows the interviewer to tailor questions exploring specific topics to each respondent.
The semi-structured approach worked especially well for collecting information on soccer playing, because respondents often found these questions difficult to answer. For example, some people had difficulty recalling details about early soccer play that occurred many years ago. Often, individuals reporting for themselves had been very young children at their earliest play. Thus, they might not have been aware of details such as lengths of seasons, field names, and the exact years or ages they started playing. Conversely, once children become more independent in their teens, parents might not be aware of details of soccer play. Even for more recent play, some questions were challenging. For example, reporting on

22
the overall percent of time players practiced on crumb rubber fields or the overall percent of indoor play was challenging when participants practiced at multiple fields throughout the year or different fields over a period of years.
The semi-structured approach allowed the interviewer to explore these questions with respondents, allowing reporting in a manner that made most sense to them. For example, while the questionnaire specifies years of beginning and ending play, the semi-structured approach allowed reporting of ages or grades in school rather than calendar years. As another example, the semi-structured approach permitted reporting the percentage of total practice on each field with artificial turf, rather than estimating an overall percentage of practice on artificial turf. The interviewer used the information collected from the semi-structured approach to compute and summarize responses, as needed. For example, if a respondent provided a grade in school or age rather than a year of beginning play, the interviewer assigned the year of beginning play based on birthdate and other information provided. Appendix E provides detail on computations.
Descriptive statistics. For the descriptive statistics, we included ranges of responses and medians. The range is the span of responses from the lowest to highest values. The median is the value that lies at the midpoint of a range. Medians are often similar to averages, but extremely high or low values can skew the average so that it does not provide a good representation of the entire group. The median is generally not affected by extreme values. We used functions in Microsoft Excel to determine ranges and medians.
Results Meeting the Case Definition Confirming a diagnosis of cancer. Information from the cancer registry on types of cancer, birthdate, and age and year at diagnosis was available for 48 of the 53 people reported to the project team. The cancer registry only includes Washington residents. Interviews for two of the remaining five individuals confirmed that they were not Washington State residents when they got cancer. A third person, whom we did not interview, was also likely to have been a resident of another state based on information from Coach Griffin. One person was diagnosed in mid-2016 and so cancer registry information was not available at the time of this writing. There was no apparent reason why the cancer registry had no information on the final person, whom we were unable to reach. We did not include this person as meeting the case definition, because the information from Coach Griffin did not clearly indicate whether this person met the age criteria.
Overall 27 people met the case definition and 26 did not. People did not meet the case definition for the following reasons:
· Age at diagnosis: 15 people were diagnosed after age 24, one person was diagnosed before age six and one person (described in the previous paragraph) might have been diagnosed after age 24.
· Soccer: Five people did not play soccer. · Year of diagnosis: Three people were diagnosed before 2002 or after 2015.

23
· Residence: One person likely never lived in Washington.
Response Rate We sent emails inviting participation in the investigation to 41 people for whom we had email addresses. This resulted in seven interviews for people who met the case definition and 10 individuals who did not. Our efforts then focused on obtaining interviews for the remaining people who were most likely to meet the case definition. This resulted in 18 additional interviews for people who met the case definition. Thus, in total, we obtained interviews for 35 of the 53 (66 percent) people reported to the project team and for 25 of the 27 (93 percent) people meeting the case definition.
Observed to Expected Ratios Tables 7–10 provide information on the numbers of primary cancer diagnoses among people meeting the case definition (observed), the expected number of cancer diagnoses among soccer players given rates for Washington residents of the same ages during the same time period (expected), ratios of the observed to expected (O/E) numbers, and the 95 percent confidence intervals around the O/Es. All of the O/Es are less than one and in no instance does the 95 percent confidence interval include one. Based on these O/E ratios, we conclude that the number of cancer cases on the coach’s list is much less than was expected to occur among soccer players in Washington.
Table 7. Observed to expected ratios for cancer: all soccer players diagnosed during 2002–2015 at ages 6–24 years
Cancer type Observed cancers from
the coach’s list
Expected cancers
Ratio of observed to
expected
95 percent confidence interval
All 28 1,384 0.03 0.01-0.03 Leukemia 6 131 0.05 0.02-0.10 Hodgkin lymphoma 5 147 0.03 0.01-0.08
Non-Hodgkin lymphoma 6 89 0.07 0.03-0.15
Table 8. Observed to expected ratios for cancer: WYS-defined select and premier level players diagnosed during 2002–2015 at ages 6–24 years
Cancer type Observed cancers from
the coach’s list
Expected cancers
Ratio of observed to
expected
95 percent confidence interval
All 15 284 0.05 0.03-0.09 Leukemia 3 26 0.11 0.02-0.33 Hodgkin lymphoma 4 30 0.13 0.04-0.34
Non-Hodgkin lymphoma 4 18 0.22 0.06-0.56

24
Table 9. Observed to expected ratios for cancer: goalkeepers diagnosed during 2002–2015 at ages 10–24 years
Cancer type Observed cancers from
the coach’s list
Expected cancers
Ratio of observed to
expected
95 percent confidence interval
All 14 153 0.09 0.05-0.15 Leukemia 3 14 0.21 0.04-0.61 Hodgkin lymphoma 4 17 0.24 0.07-0.62
Non-Hodgkin lymphoma 2 10 0.20 0.02-0.73
Table 10. Observed to expected ratios for cancer by age group: all soccer players diagnosed during 2002–2015 at ages 6–24 years
Age at diagnosis
Observed cancers from
the coach’s list
Expected cancers
Ratio of observed to
expected
95 percent confidence interval
All ages 28 1,384 0.03 0.01-0.03 6–9 years old 1 30 0.03 0.00-0.19 10–14 years old 12 180 0.07 0.03-0.12
15–19 years old 8 427 0.02 0.01-0.04
20–24 years old 7 747 0.01 0.00-0.02
Descriptive Epidemiology For some factors in this portion of the report, we used information from the interviews, the cancer registry and reports to the project team. For other factors, however, the interviews provided the only source of information. In general, with all three sources of information, we could describe the 53 people reported to the project team. Interview information was available for 35 people.
Table 11. Sources of information for factors discussed in the descriptive epidemiology section Factors with information from interviews, cancer registry and reports to the project team Demographics Birth year Gender Cancer diagnosis Type of cancer Year of diagnosis Age at diagnosis Primary sport played Factors with information from interviews Demographics Race Hispanic ethnicity Residence All medical, health-related and familial risk factors for cancer All aspects of soccer play Other sports played among soccer players

25
Demographic Characteristics Birth years for the 53 people reported to the project team ranged from the 1960s to the 2000s. The range for people meeting the case definition was narrower—early 1980s to the mid-2000s—due to the case definition’s criteria for age and year of diagnosis. During 1983–2010, about 28 percent of soccer players on WYS teams were female.80 Thus, the number of females reported to the project team, 50 percent overall and 63 percent for those meeting the case definition, is greater than we would expect from random variation alone. In 2015, the 73 percent of state residents reported their race and ethnicity as non-Hispanic white.84 The percentage of participants who classified themselves or their children as non-Hispanic white is similar to that of Washington residents overall after accounting for random variation.
Table 12. Demographic factors 53 people reported
to the project teama 27 people who met the
case definition Year of birtha
Range 1961-2008 1980-2005 Median 1991 1994
Gender: number (percent in parentheses)a Female 26 (50) 17 (63) Male 26 (50) 10 (37)
Race and Hispanic ethnicity: number (percent) 35 interviews 25 people who met the
case definition Non-Hispanic white 28 (80) 19 (76) Other including more than one race 7 (20) 6 (24)
a Information on this factor was missing for one person.
Residence. The 35 interviews included many in- and out-of-state residences from birth to getting cancer, including living abroad. Only one participant, however, lived primarily in Eastern Washington before getting cancer. Considering only residences in Washington State, 20 participants lived exclusively or mostly in King County; eight in Pierce County; two each in Kitsap and Snohomish counties; and one each in Skagit, Thurston and Spokane counties.
Cancer Diagnoses Types of cancer. Most of the 53 people had one primary type of cancer. Two people, however, had two primary cancers for a total of 55 cancers. The 10 cancers shown in Table 13 below as “other” include eight different types of cancer.

26
Table 13. Number of cancers among people on the coach’s list by type of cancer
Type of cancer
55 total cancers among 53
individuals
28 cancers among 27
individuals meeting the
case definition
Leukemia 11 6 Non-Hodgkin lymphoma 13 6 Hodgkin lymphoma 11 5 Bone (Ewing sarcoma or osteosarcoma) 4 3
Soft tissue sarcoma 3 2 Brain 3 1 Other 10 5
Years of diagnosis. Year of diagnosis was missing for one primary cancer. Figure 2 provides the years in which 54 cancers were diagnosed. The peaks in 2008 and 2014 are consistent with reports of healthcare providers mentioning to patients or their parents that there seemed to be a lot of cancer among soccer players and similar concerns arising from the public.
Figure 2. Year of cancer diagnosis among people on the coach’s list
Ages at diagnosis. The 53 people ranged from under five to over 50 years old when first diagnosed with cancer. The median age was 18 years. Because the case definition included a diagnosis of cancer between six and 24 years old, the 27 people meeting the case definition had a narrower range of ages—nine to 23 years old—with a median of 15 years.
0
2
4
6
8
10
12
Num
ber o
f Dia
gnos
es
Year
Does not meet case definitionMeets case definition
27
Known or Suspected Potential Risk Factors for Cancer Nineteen of the 35 interviews contained no reports of potential risk factors for cancer. Nine participants had one potential risk factor: one report of infectious mononucleosis, one chronic condition, two CT scans not connected to the cancer diagnosis, and five biological parents who had cancer. Four participants had two or more potential risk factors. Three respondents were not sure about CT scans. Two of these respondents reported no other risk factors, and one was also unsure of autoimmune disease.
Biological parents of three participants had melanoma in their mid-20s. The remaining four parents had four different types of cancer in their 50s, 60s, or 70s. No interviews indicated cancer among biological sisters or brothers.
Table 14. Number of reports of risk factors for cancer
Cancer risk factor 35 interviews 25 people who met the case definition
History of smoking 2 1 Autoimmune diseasea 0 0 Hepatitis B 0 0 Mononucleosis (Epstein Barr virus) 3 1 Human immunodeficiency virus (HIV) 0 0 Chronic diseaseb 4 4 Computer tomography (CT) scanc 5 4 Parent or sibling with cancer 7 4
a Two people were not sure and information was missing for one person. b Information was missing for two people. c Three participants, who each reported a possible CT scan, were either unsure that the scan was CT or unsure if the scan was done to diagnose cancer.
Soccer Playing We present information on reported soccer play prior to initial diagnosis. Because the case definition included playing soccer, the 25 participants who met the case definition played soccer. Eight of the 10 participants who did not meet the case definition played soccer. Thus, information for soccer play was available for 33 people overall and 25 people who met the case definition.
Amount of Play. The shortest amount of soccer play reported was one season for one year, but about half of the players played soccer for at least 10 years before getting cancer. Two participants started playing soccer in preschool and one person did not play soccer until their 40s. Of the remaining 30 players, 17 began playing soccer at ages four to six, nine at ages seven to nine, and four at ages 10 to 12. About two-thirds of the soccer players were still playing when they got cancer, resulting in a median of zero years between ending soccer play and getting cancer. One-third had stopped playing soccer for about one to nine years before getting cancer.

28
Table 15. Years of soccer play in relation to cancer diagnosis 33 interviews with
reported soccer play 25 people meeting the
case definition Total years of playing soccer before diagnosis Range 1-30 1-17 Median 10 9 Years between first playing soccer and diagnosis Range 3-43 3-18 Median 10 9 Years between ending soccer play and diagnosis Range 0-9 0-9 Median 0 0
Washington Youth Soccer levels of play. The WYS defines recreational, select and premier soccer play. Most commonly, children first play on recreational teams and move to select or premier teams depending on their abilities and interest. In general, players on select or premier teams play soccer more days of the week and more months of the year than recreational-level players. Several participants reported playing with the Catholic Youth Organization (CYO). We classified CYO as recreational soccer, because they seem to follow the recreational season, with less total time throughout the year playing soccer. We included the Olympic Development Program as premier play based on information at the WYS website.85
Table 16. Washington Youth Soccer defined levels of soccer play
Level of Washington Youth Soccer play
33 interviews with reported
soccer play
25 individuals meeting the case
definition Recreational only 11 10 Recreational and select 11 9 Recreational and premier 5 4 Recreational, premier and select 4 2
No recreational, select or premier play 2 0
Table 17. Selected characteristics of play by Washington Youth Soccer -defined levels of soccer play
Level Number of
playersa Median age of beginning play
Median years played
Median months of play per year
33 total soccer players Recreational 31 6 5 3 Select 15 11 3 9.5 Premier 9 12 4 9 25 who meet the case definition Recreational 25 6 5.5 3 Select 11 10 3.5 10 Premier 6 11 6 9
a Because information is provided by level of play, soccer players who played at more than one level are included more than once.

29
Overall, the 31 soccer players who played at WYS-defined levels played for a total of 276 years. This includes 176 years of recreational-level play and 100 years of play at select and premier levels. Thus, about 36 percent of the WYS play described in the interviews was at the select or premier levels.
School teams. Some participants’ middle schools did not offer team soccer. Additionally, if participants got cancer before entering a given level of school, we did not ask about soccer playing for that level of school or schools with higher grades. For example, if someone got cancer in middle school, we did not ask about high school or college teams. To determine the number of participants potentially able to play on a school team, we used information directly from the interview when available. For example, someone might report getting cancer in middle school and so, for this investigation, we would not include play on high school or college teams. If participants did not provide grades in school when they got cancer, we considered players eligible to play middle school soccer pre-diagnosis if they got cancer after age 11, eligible for high school soccer if they got cancer after age 13, and eligible for college soccer if they got cancer after age 17. Overall, 29 participants were eligible to play on middle school teams, 20 on high school teams and 15 on college teams. Among people meeting the case definition 22 were eligible for middle school, 13 for high school and eight for college teams.
The season for most middle and high school soccer was about two to four months. Most of the school players also played WYS soccer either concurrently with school soccer or during the schools’ off-seasons. College play ran from about nine or 10 months to 12 months of the year.
Table 18. Numbers of soccer players on middle school, high school and college teams.
Level of school soccer 29 participants overalla 22 participants meeting the case definitiona
Middle school only 5 5 High school only 8 5 College only 1 0 Middle and high school 1 1 High school and college 4 3 Middle school, high school and college 2 2
No school-related play 8 6 a Overall, four people got cancer before middle school and so were not eligible for any school-related play pre-diagnosis. Three of these people met the case definition.
Other soccer play. Fifteen individuals—eight of whom met the case definition—got cancer at ages 18 or older. We considered them eligible to play organized adult recreational soccer, such as co-ed and indoor leagues with games only. Eight of these participants, including one who met the case definition, played organized adult recreational soccer. Four of the seven who did not play on adult recreational teams continued playing as adults on college teams.
Other types of play included two participants who played preschool soccer, five reports of summer camps or weekend workshops, and four reports of pick-up games. Five respondents noted a variety of other games, including one outdoor tournament and four who noted a

30
variety of indoor games that did not fit into other categories. Most soccer that was not part of WYS, school teams or organized adult recreational play was of relatively short duration, but several participants played pick-up games for seven to 12 months per year for two to six years.
Goalkeeper. For each level of play, respondents reported the amount of time participants played goalie. We classified select and premier players as goalies if they played the position at least 50 percent of the time, but most players classified as goalkeepers played the position for at least 90 percent of the time. Most select and premier players not classified as goalies played the position for less than 10 percent of the time.
The WYS rules state that there are no goalkeepers until “under 9” teams.86 This means that for the most part goalkeeping begins at age eight. At age eight and older, however, recreational players often rotate through positions before becoming more specialized. Thus, the same overall percentage of time playing goalkeeper on WYS-defined recreational teams can have a variety of meanings. For example, it could mean that someone rotated through the position with limited goalkeeping practice. It could also mean that players never played the position in their early years of play, but primarily played and practiced as goalkeeper in later years. Thus, we classified people as playing goalkeeper at the recreational level if they played the position at least 25 percent of the time overall. We also included one person who did not play goalkeeper for the first six years, but played the position 30–50 percent of the time for the final three years of recreational play. Of the 10 participants classified as goalies at the recreational level, seven played the position at least 50 percent of the time and all played recreational level soccer at ages eight or older. Nineteen of the 20 recreational players not categorized as goalkeepers played the position at most 10 percent of the time overall; one participant played the position 20 percent overall. Information on goalkeepers was missing for one participant who played recreational level soccer.
Table 19. Number of goalkeepers by levels and types of play Level of Play 32a participants with
reported soccer play 24a players meeting the case definition
Any level of play 16 12 Recreational 10 9 Select, premier or both 10 8
Middle school 3 3 High school 9 6 College 4 3 Adult recreational 5 1
a Information on playing goalie was missing for one person. Players who played goalkeeper at more than one level are counted more than once.
Overall, about half of the participants were categorized as goalkeepers. Most goalkeepers played the position for many years for considerable proportions of their play. All of the players categorized as goalkeepers in middle and high school were also goalies at WYS-defined levels of play. College goalkeepers also played goalkeeper at WYS-defined levels of play, pre-college school teams, or both. The 31 soccer players, who played at the WYS-

31
defined levels of play, played for a total of about 218 years beginning at ages eight or older. Players spent about half of those years (112) playing goalkeeper.
Names of fields. One respondent did not provide names of fields. Thirty-two respondents provided the names of about 110 fields in Washington at which participants practiced soccer. They also noted 11 fields located out-of-state. Most fields were reported by one or two respondents only, but five practice fields were each reported for three participants and two practice fields were each reported for four participants. We did not collect field names for games, because home games are often played on the same fields as the practice fields and away games are played in many different locations.
Types of surfaces. The initial eight interviews—five for people who met the case definition—asked about playing soccer on artificial turf, but did not ask about the specific type of artificial surface. Nonetheless, two of the initial respondents provided information on the types of artificial surfaces. Interviews after the initial eight systematically collected this information.
If participants reported artificial turf, but did not know what type of artificial turf, the interviewer asked whether the surface resulted in their having little black balls in their shoes or clothes. Little black balls in shoes and clothes are commonly reported by soccer players who play on fields with crumb rubber infill. Artificial turf was classified as crumb rubber if participants answered “yes” and as non-crumb rubber if they answered “no.”
An interview for one person did not contain any field-related information. Thus, information classifying fields as artificial turf, without specifying the type of turf, was available for 32 of the 33 soccer players, of whom 24 met the case definition. Due to the initial interviews not asking about the types of artificial surfaces, one person who did not know the types of surfaces and one person who played soccer only on grass, information on specific types of artificial turf was available for 24 participants overall and 18 who met the case definition.
Grass and artificial turf with crumb rubber infill were the most frequently reported field surfaces. Other surfaces included dirt, AstroTurf®, and red rock cinder. AstroTurf® is a brand of artificial turf, but the term is also used generically. The interview did not distinguish between the brand name and the generic use of the term. The earliest AstroTurf® fields did not include crumb rubber infill, but fields installed more recently are likely to have crumb rubber infill. Four participants reported playing on “astroturf” between 1982 and 2010.
Practicing or playing games for some portion of the time on fields with crumb rubber infill was reported for 22 of the 24 soccer players for whom at least partial detailed information was available. The two participants who did not report playing on crumb rubber participated in the early interviews and so were not specifically asked about the type of surface. They might have played on crumb rubber. These participants specified “astroturf” for some, but not all, artificial turf fields. This might imply that artificial turf not specified as “astroturf” was, in fact, crumb rubber.
Another eight soccer players played on artificial turf but participants either did not know or were not asked the specific type of turf. Seven of these eight players played on artificial turf

32
after 2005 and so it is likely that they played on crumb rubber. The eighth person might also have played on crumb rubber. This participant specified “non-crumb rubber” for some, but not all, artificial turf fields. This might imply that artificial turf not specified as “non-crumb rubber,” was, in fact, crumb rubber. Thus, it is likely that 31 of the 32 soccer players for whom field information was available, had some exposure to crumb rubber through soccer.
The one soccer player who played soccer only on grass fields, played another sport on crumb rubber for several years. The two participants who did not play soccer reported exposure to crumb rubber fields through other activities.
We calculated the percentage of time athletes played soccer on grass or dirt, outdoor artificial turf, and indoor artificial turf fields. We made separate calculations for practice and games. The percentages combine all types of artificial turf and all types of play: WYS-defined levels, school play, adult recreational play and other types of play. We calculated these percentages in five percentage point increments. Appendix E provides information about the calculations.
Tables 20 and 21 show the number of players who practiced and played games on grass or dirt, outdoor artificial turf and indoor artificial turf by specified percentages of time. The tables also provide the median percentage of time playing on each surface type.
Table 20. Field surfaces used for practice
Percentage of time spent on selected types of fields
Number (percent) of 31a players with reported
soccer practice
Number (percent) of 24a players meeting the case definition
Grass or dirt
75–100 14 (45%) 8 (33%) 50– <75 12 (39%) 11 (46%) 25– <50 3 (10%) 3 (13%) 0– <25 2 ( 6%) 2 ( 8%) Median percent of time on grass 70-74 65-69
Outdoor artificial turf 75–100 2 ( 6%) 2 ( 8%) 50– <75 3 (10%) 3 (13%) 25– <50 10 (32%) 9 (38%) 0– <25 16 (52%) 10 (42%) Median percent of time on outdoor artificial turf 20-24 30-34
Indoor artificial turf
75–100 0 ( 0%) 0 ( 0%) 50– <75 0 ( 0%) 0 ( 0%) 25– <50 1 ( 3%) 1 ( 4%) 0– <25 30 (97%) 23 (96%) Median percent of time on indoor artificial turf 0-4 0-4
aField-related information was missing for one person and one person reported all soccer playing as games only and thus, did not provide information for practice.

33
Table 21. Surfaces during games
Percentage of time spent on selected types of fields
Number (percent) of 31a players with reported soccer
practice
Number (percent) of 23a players meeting the case definition
Grass or dirt
75–100 4 (13%) 3 (13%) 50– <75 16 (52%) 12 (52%) 25– <50 7 (23%) 5 (22%) 0– <25 4 (13%) 3 (13%) Median percent of time on grass field 60-64 60-64
Outdoor artificial turf 75–100 3 (10%) 2 ( 9%) 50– <75 5 (16%) 4 (17%) 25– <50 15 (48%) 11 (48%) 0– <25 8 (26%) 6 (26%) Median percent of time on outdoor artificial turf 35-39 35-39
Indoor artificial turf
75–100 0 ( 0%) 0 ( 0%) 50– <75 1 ( 3%) 1 ( 4%) 25– <50 0 ( 0%) 0 ( 0%) 0– <25 30 (97%) 22 (96%) Median percent of time on indoor artificial turf 0-4 0-4
aField-related information was missing for one person; information on field surfaces for games was missing for one person.
The tables combine grass and dirt, but almost all of the participants played on grass with very little play on dirt. While all but one soccer player practiced, played games or both for some of the time on artificial turf, most players practiced and played games primarily on grass. Overall, half of the players practiced at least 70–74 percent of the time on grass or dirt, less than 25 percent of the time on outdoor artificial turf and zero to four percent of the time on indoor artificial turf. Games were more likely than practice to be on artificial turf, but most games were on grass.
Other Sports Seven—including four meeting the case definition—of the 35 participants reported they or their children played other organized sports on artificial turf. Sports included fast pitch, softball, baseball, football, ultimate Frisbee and track. Most of this play was reported on fields with crumb rubber infill, but one person reported a clay surface.
Comments Sixteen people responded to an open-ended question about whether there was anything that might be important in relation to their or their children’s cancer that had not been covered in the interview. Most of these comments focused on crumb rubber including:
· The large quantity of little black balls or black pellets that were brought home in shoes, gloves, socks and clothes and tracked into the house.

34
· The large quantity of the pellets that got in the nose and mouth and were then inhaled or swallowed, especially for goalkeepers.
· Getting the pellets in the eyes and open cuts or embedded in the skin. · The large amount of time spent on surfaces with crumb rubber infill, including
spending time at very young ages during organized activities for toddlers, accompanying parents or siblings to sports fields, or during “free” play on surfaces with crumb rubber fill.
· Concerns about increased exposures during extreme heat.
Several participants mentioned concerns about exposure to pesticides from a variety of sources including playing on grass fields and international travel. Several also reported that other team members, coaches or parents of team members got cancer during the same time periods as they or their children.
A few participants mentioned non-crumb rubber potential causes for their or their children’s cancers that were unique to their situation or from information given to them by their healthcare providers.
Discussion Study Design This investigation was prompted by perceptions of an unusually high number of soccer players, especially goalkeepers, with cancer. We did not find the number of cancers among soccer players, select and premier players, or goalkeepers on the coach’s list to be higher than expected based on Washington cancer rates for people of the same ages.
The investigation was not designed to discover the causes of cancer among the people reported to the project team. One common type of study to find causes of cancer involves comparing people who already have cancer, as was the case in this investigation, to people who do not have cancer. These studies try to determine whether exposures or other factors are different among people who have and do not have cancer. These studies usually involve hundreds of people with the same type of cancer, as well as people who do not have cancer. They generally focus on relatively narrow age ranges, especially when searching for causes of cancer among children and adolescents. These types of studies often involve lengthy interviews, as well as biological measures, environmental measures or both. Because biological factors often change after the onset of cancer and both biological and environmental factors can change over time, studies that make these measurements usually include only people diagnosed relatively recently. Academic or research organizations specializing in cancer are generally best suited to conducting these types of study.
Thus, even narrowing the list of people reported to those meeting the case definition, we could not design this type of study. The reports included people with many different types of cancer who were diagnosed over a 14-year period beginning in 2002. Additionally, the number of soccer players with cancer, while perhaps large for a small, well-defined community, is still too small for a study aimed at investigating the causes of cancer.

35
This investigation was also not designed to add to our understanding of the risks or benefits of crumb rubber fields. Basic research looking at whether substances cause cancer often begins with laboratory studies using animals or cell-culture systems. Most laboratory toxicological studies are conducted on a single chemical at a time. Therefore, in situations where exposure to numerous chemicals is of concern, such as with artificial turf and crumb rubber, standard toxicological studies can rarely provide adequate information. We were unable to find any studies that investigated the effects of simultaneous exposure to the dozens of chemicals that have been identified in artificial turf crumb rubber. Additionally, potential exposures from crumb rubber likely vary depending on factors such as the source and processing of the rubber; the age of the crumb rubber; characteristics of the field, such as ambient temperature and the amount of ventilation; and the route of exposure, such as swallowing entire crumbs, having crumb rubber embedded under the skin, absorption through the skin or open cuts, rubbing the eyes, or inhaling substances that off-gas from the crumb rubber.
Our review of the scientific and medical literature found a number of risk factors that most scientific, medical and other cancer-related organizations accept as known risk factors for childhood leukemia, lymphoma or both. Studies also suggest possible additional risk factors, some of which may be related to chemicals found in artificial turf. For example, solvent exposures are associated with the development of leukemia, and benzene is a solvent that has been detected in crumb rubber infill. However, while benzene may be present in crumb rubber, not all crumb rubber necessarily contains benzene, and people can be exposed to benzene from a variety of common sources such as gas stations, industrial emissions, glues or paints. Further, even if benzene is present in crumb rubber, it might not be at a level sufficiently high to cause cancer. The International Agency for Research on Cancer has classified the rubber manufacturing process as causing leukemia and lymphoma and other types of cancer in people.87 However, occupational exposures during manufacturing are usually different from exposures to a finished product. Thus, it is unlikely that athletes playing on crumb rubber infill are exposed to the same toxicants, at the same levels and by the same routes of exposure as workers in rubber manufacturing facilities.
Benzene is an example of one potential chemical exposure from crumb rubber. The recent literature review from the multi-agency federal status report identified research gaps related to numerous chemicals and potential exposure pathways. The report also described federal research that is being undertaken to better characterize the components of crumb rubber infill made from tires. This research includes samples from 40 synthetic turf fields across the United States. In addition, the report describes ongoing research to better understand how people may be exposed to chemicals from crumb rubber infill.78 Researchers in California are also engaged in characterizing potential exposures from turf fields and playground mats under a variety of climate conditions and ages of field. The California research further seeks to understand potential exposures based on human activities and to develop methods for monitoring chemicals of interest in people exposed to crumb rubber.88
Observed to Expected Ratios Our investigation was not designed to determine if soccer players in general were at increased risk of cancer due to exposures from crumb rubber in artificial turf. Rather, its

36
purpose was to explore whether the information from Coach Griffin’s list warranted further public health response. We found that the number of cancers on the coach’s list was less than was expected to occur among soccer players in Washington. This was true for soccer players on the coach’s list playing at all WYS-defined levels combined, for those who played at select and premier levels and for those who played goalkeeper.
The list from Coach Griffin likely undercounted the number of Washington soccer players who got cancer during 2002–2015 at ages six to 24 years. That is, our observed number of people who met the case definition was likely fewer than the true number. Initially, we considered that we may have identified all or nearly all of the soccer players with cancer because of the breadth of the news reports and publicity in fall 2014. After the interviews, which showed disproportionate numbers of females, people from King County, select and premier players, and goalkeepers, we considered this less likely. However, with 28 cancers observed and 1,384 expected, we would need to have missed hundreds of people who met the case definition to change our conclusion.
Excluding people who did not meet the case definition from the observed number of cancers reduced the total number of observed cancers. These restrictions, however, also resulted in fewer expected cancers. For example, if we had included the one cancer diagnosed in the mid-1990s, we would have added one cancer to the observed number, while adding hundreds of thousands of person-years to the calculation of the expected number of cancers. Thus, expanding the case definition to include cancers among all people reported to the project team would have most likely resulted in even smaller O/Es than those computed.
Our computations for goalkeeper were restricted to players ages 10–24. Because all goalkeepers who played the position before age 10 also played at older ages, we did not exclude any of the cancers among goalkeepers from the observed number of cancers. If we had included goalkeepers beginning at age eight, our observed number of cancers would not have changed. The expected number of cancers, however, would have increased as we added person-years at risk for goalkeepers ages eight and nine. Thus, expanding the computations to goalkeepers beginning at age eight would have resulted in even smaller O/Es than those computed.
In addition to underestimating the observed number of cancers, this investigation may have over- or underestimated the number of cancers expected among soccer players based on cancer rates among Washington residents ages six to 24 years. Over- or underestimation could have occurred by not correctly defining the number of residents ages six to 24 years who play soccer. We used a readily available data source (WYS) to determine the number of Washington residents who play soccer. We recognize that this source likely does not account for all soccer players and may exclude those playing exclusively for Catholic Youth Organizations, summer camps, private instruction or other groups that do not require a youth soccer “player card” for participation.
Over- or underestimation of the number of soccer players expected to get cancer might also have occurred if our four assumptions about soccer players were not accurate. Two of these assumptions—everyone who played on a soccer team at age 16 and older had also played at a younger age and middle and high school players also played on a WYS team at some

37
point—are accurate for the 25 players with interviews who met the case definition. These assumptions, however, might not be accurate for all youth soccer players in Washington.
We have no direct way to check our assumption that the distribution of players by age was the same from 1983–1999 as in 2000. The WYS counts of players by age from 2000–2015 showed small changes in the distribution of players by age from year to year. For example, each year for all 16 years, about one to three percent of players were six years old, nine to 11 percent were 10 years old, and two to four percent were 16 years old. If this same pattern is true for earlier years, inaccuracies in the assumption about the distribution of players by age would not introduce large errors.
We assumed a 10 percent turnover in players each year. This assumption was needed to count how many people played soccer. We did not have a roster of individual players; we only had the total number of players registered each year. Assuming that some players stopped and new players started (that is, there is turnover) each year leads to a higher estimate of the number of different players than assuming no turnover. The larger the turnover, the larger the number of soccer players. Thus, if turnover was more than 10 percent, we underestimated the number of soccer players; if it is less than 10 percent, we overestimated the number.
The 1,384 expected cancers might seem high. From 2002–2013 there were almost 5,000 cancer diagnoses among Washington residents ages six to 24 years. Registry data for 2014 and 2015 are not yet complete, but there likely have been about 900 diagnoses in 2014–2015 given an average of 439 such diagnoses each year during 2009–2013. Thus, we estimate a total of about 5,900 cancers diagnosed among Washington residents ages six to 24 years during 2002–2015. The 1,384 expected cancers is about 23 percent of the total cancers. Although less than 23 percent of the population ages six to 24 years plays soccer each year, once someone begins playing soccer, they contribute to the person years at-risk whether or not they continue playing. Using the assumption of a 10 percent turnover each year, we can estimate the number of children in each age group who ever played soccer. For example, using the WYS enrollment data, we estimated that 22,827 of the children who turned age 15 in 2015 played soccer for at least one year between ages six and 15. The estimated number of 15-year-olds living in Washington in 2015 was 89,944.89 Thus, about 25 percent of 15-year-olds played soccer at some point in their lives
It is not possible to determine the net effect of potential inaccuracies from these four assumptions. If we overestimated the number of soccer players in Washington, we would also overestimate the expected number of cancers and underestimate the O/E ratios. For example, we observed 28 cancers altogether and expected 1,384 based on our estimated number of players and cancer rates in Washington. The O/E ratio was 0.03. If there were only half the number of players (and assuming the same age distributions), we would expect half the number of cancers or 692. The O/E ratio would then be 28/692 or 0.04, which is still very small and does not indicate an increased risk of cancer among the soccer players on the coach’s list. Even with half the expected number of soccer players, we would need hundreds of additional observed cancers for the number of cancers among soccer players to approach the expected number.

38
Conversely, if we underestimated the number of soccer players and there were really more soccer players than we estimated, the number of expected cancers would increase and the O/E would become even smaller. This would happen if, for example, there is more than 10 percent turnover each year.
We did not calculate observed to expected ratios for select and premier goalkeepers. We did not do this because we could not adequately compute the expected number of cancers among this population. We did not have information on the number of premier and select goalkeepers by age and year of play.
Descriptive Epidemiology Demographics. The findings for all participants for whom we had interviews were similar to the findings for participants who met the case definition. This is not surprising given that 71 percent of the interviews were for participants who met the case definition. Unless otherwise noted, the information discussed below is for the group as a whole.
The interview information was collected to help determine who met the case definition, who played goalkeeper, who played at WYS-defined select and premier levels and whether players had commonalities that might be unusual. Soccer-related information might also help researchers design studies to measure potential exposures from artificial turf soccer fields. We were not able to present the descriptive information by type of cancer, because numbers of specific types of cancer were too small for this to be meaningful. Overall, there were 11 diagnoses of leukemia, 13 of non-Hodgkin lymphoma, 11 of Hodgkin lymphoma and 20 of 11 other types of cancer. Interviews with information on soccer playing were available for eight of the leukemias, six of the non-Hodgkin lymphomas, eight of the Hodgkin lymphomas and 10 of the other types of cancer.
The percentages of females and males reported to the project team and the percentages of people by race and Hispanic ethnicity were similar to those of Washington residents overall after accounting for random variation.84 However, we do not know the percentages of people by race and Hispanic ethnicity who play soccer. If these differ from those of the general Washington population, we could have missed an unusual pattern.
During 1983–2010, about 28 percent of soccer players on WYS teams were female.80 Thus, there were more females reported to the project team—overall and among those meeting the case definition—than we would expect due to random variation. This remains true even though rates of cancer during 2009–2013 were slightly higher among Washington’s female population ages six to 24 years (24.6 per 100,000 females) than among males (22.6 per 100,000 males).2 The disproportionate number of females reported to the project team might have resulted from missing male soccer players with cancer. Coach Griffin is a woman’s soccer coach and so might have had more contact with female players. There might also be other reasons for the disproportionate number of females. For example, women might be more comfortable than men with sharing medical information. Thus, the descriptive portions of this investigation might reflect soccer play and other factors among females more accurately than among males.

39
While living in Washington, 34 of the 35 interviews (97 percent) indicated participants living primarily in the western part of the state. Only one person living in Eastern Washington might seem unusual given that the project team understood that reports were from all of Washington. The 97 percent, however, does not differ from what we would expect due to random variation. U.S. Census data for 2000 and 2010 show about 78 percent of the total state population and about 75 percent of the population ages five to 24 years living in counties west of the Cascades.90
The same U.S. Census data show about 29 percent of Washington residents and 26 percent of residents ages five to 24 years living in King County. Twenty of the 35 participants (57 percent) living primarily in King County is more than we would expect due to random variation. However, as with race and ethnicity, we do not know the overall proportions of soccer players by county. If a larger proportion of King County residents plays soccer compared to residents of other counties, the large proportion of participants from King County might not be usual. Alternatively, the large proportion of participants from King County might be due to other factors, such as the issue possibly receiving more media attention in King County compared to other counties or the coach being more likely to know of soccer players with cancer from King County. As with the disproportionate number of females, more participants than expected from King County is unlikely to affect our conclusion about the O/E ratios, but the descriptive portions of this report might better reflect soccer playing and other factors among residents of King County than among residents of other counties.
Cancer. The 53 people reported to the project team had about 13 different types of cancer depending on how cancers are categorized. For example, we could count lymphoma as one type of cancer with non-Hodgkin and Hodgkin being two subtypes, or we could count non-Hodgkin and Hodgkin as two separate types of cancer. Within the 13 types of cancer, there were many more distinct subtypes of cancer. That leukemia and lymphoma were the types of cancer most frequently diagnosed in this group is not surprising given that leukemia and lymphoma are among the most commonly diagnosed types of cancer in children and young adults in the United States.
Despite years of study, the causes of most cancers remain unknown. The interviews conducted for this investigation included some known risk factors for leukemia and lymphoma and some more general risk factors, such as smoking and family history of cancer. The Epstein-Barr virus and CT scans might have played roles in the development of some cancers, but it is difficult to know.
Epstein-Barr virus causes infectious mononucleosis and increases risk of lymphoma. Two participants who had infectious mononucleosis also developed Hodgkin lymphoma and another participant with infectious mononucleosis developed non-Hodgkin lymphoma. Developing any type of lymphoma after infection with Epstein-Barr virus is rare.91 In the United States, Epstein-Barr virus is most closely associated with development of non-Hodgkin lymphoma among people who also have HIV.92
The National Cancer Institute reports that for every 10,000 children who receive a single CT scan, one will develop cancer at some point during their life. 93 Children who have multiple CT

40
scans before the age of 15 are at higher risk of developing CT-related cancers in the decade after the scans.93 Of the eight people who had or might have had CT scans, only one had multiple scans before age 15 years. The remaining seven each had a single scan with three having had the scan when they were 15 years or older.
The remaining risk factors were unlikely to have increased risk for the specific cancers reported: people who smoked did not develop types of cancer known to be associated with smoking; types of cancer among biological parents were not related to the types of cancer among the participants; and the chronic diseases were not those related to development of cancer.
Soccer. The soccer information describes the experience of the 33 interviewed participants, all of whom got cancer. We do not know whether these experiences are unusual, because we do not have information from soccer players who did not get cancer. The cumulative amount of soccer play ranged from one season for one year to year-round for more than a decade. Most players played at least 10 years, but we do not know whether the cumulative amount of play is higher, lower or the same as for soccer players overall.
The 31 soccer players, who played at WYS-defined levels, played for a total of 276 years. This includes 176 years of recreational-level play and 100 years of play at select and premier levels. Thus, about 36 percent of the WYS play described in the interviews was at the select or premier levels. Given the WYS report of 20 percent of their enrollees playing at these levels,81 select and premier players appear to be overrepresented in the reports to the project team. This is also true for goalkeepers. The 31 soccer players, who played at the WYS-defined levels of play, played for a total of about 218 years beginning at ages eight or older. Players spent about half of those years (112) playing goalkeeper. This proportion is high compared to the estimate of about 10 percent of players as goalies annually.82
The large percentages of select and premier players and goalies might have resulted from Coach Griffin having more contact with these groups than with other soccer players. Nonetheless, we do not feel that additional response by the health department is needed at this time to further explore whether select and premier players or goalkeepers are at increased risk for cancer given the very low O/E ratios among select and premier players and among goalies from the coach’s list.
About a third of the participants were unable to list all practice fields for some levels of play. Additionally, because names of fields can change, we might have missed some fields that players had in common. Thus, the number of fields or the number of participants playing at the same field might be greater than reported. Nonetheless, the diversity of practice fields argues against implicating any particular field in this potential cancer cluster.
Of the 24 respondents who provided detailed information on type of artificial turf, 22 noted fields with crumb rubber infill for some portions of soccer practice or competitive games. A few of the reports might have been coded to crumb rubber incorrectly, due to the interviewer classifying all reports of “little black balls” as crumb rubber. Other surfaces, such as those with coated sand infill, might look similar. We expect this happened rarely and does not significantly affect results. That most players had exposure to crumb rubber through

41
soccer is not surprising given the ubiquity of crumb rubber infill. All of these 24 participants also played on grass fields and several played on other types of artificial turf.
Although most play was outdoors on grass or dirt fields, participants who played a lot of soccer could still have substantial amounts of time on indoor artificial turf. For example, participants who played year round might play outdoors for three seasons and indoors during the winter. If the seasons were of equal length, overall, about 25 percent of their play would be on indoor artificial turf. This average masks the two to three months of play exclusively on indoor artificial turf that could occur for several years. Likewise, participants could play almost entirely outdoors for years and then play for several years exclusively indoors. Playing outdoors for six years and indoors for two years, for example, averages to 25 percent of time indoors. This average masks the two years of 100 percent indoor play. Thus, while the averages provide a summary description of the types of surfaces on which participants played, researchers designing studies to measure exposures might need more detailed information.
Limitations of information in interviews. Limitations on information collected during the interviews resulted from the interview form, itself; the information collection process; respondents’ difficulty in recalling details of soccer play and other information; and potential overrepresentation of females, people from King County, select and premier players and goalkeepers among those interviewed.
The interview form was not formally pilot-tested, but rather evolved over the first nine interviews. Thus, some of the first nine interviews did not include all of the information collected later, such as specific types of artificial surfaces and percent of play on indoor artificial surfaces. Additionally, the questionnaire did not cover the full array of risk factors for cancer. For example, we did not ask about potential exposures to the developing fetus even though many of those are known to affect one’s risk of developing leukemia. We included some of the risk factors for leukemia and lymphoma, but we did not include risk factors that might have contributed to the development of other types of cancer. Thus, while few people reported known risk factors for leukemia and lymphoma, we might have missed other known risk factors, as well as risk factors for other types of cancer.
The interview was conducted as a paper and pencil survey and not a computer-assisted survey. With a computer-assisted survey, potential reporting inconsistencies—such as dates that resulted in unusual ages for grades in school—could possibly have been identified during the interview and corrected as needed. In a few instances, the interviewer inadvertently skipped questions. Computer-assisted interviews reduce the potential for skipping questions.
Respondent difficulty in recalling details of soccer play and other factors likely resulted in some inaccuracies in reporting. Minor inaccuracies that did not represent an extreme response would not have affected ranges of responses and most likely would not have large impacts on medians.
Finally, the overrepresentation of females, King County residents, select and premier players and goalies among those interviewed limits the ability to generalize information on soccer play obtained in the interviews to soccer players in general.

42
Conclusions and Recommendations Our investigation was not designed to determine if soccer players in general were at increased risk of cancer due to exposures from crumb rubber in artificial turf. Rather, its purpose was to explore whether the information from Coach Griffin’s list warranted further public health response.
This investigation did not find increased cancer among the soccer players on the coach’s list compared to what would be expected based on rates of cancer among Washington residents of the same ages. This finding is true for all soccer players on the coach’s list, as well as soccer players on the list at the WYS-defined select and premier levels, and goalkeepers on the list. The variety of fields and residences suggests that no specific field or geographic residence is problematic in terms of soccer players getting cancer.
In addition, the currently available research on the health effects of artificial turf does not suggest that artificial turf presents a significant public health risk. Assurances of safety, however, are limited by lack of adequate information on potential toxicity and exposure. The Washington State Department of Health will continue to monitor new research on health and environmental impacts of crumb rubber.
Thus, the Washington State Department of Health recommends that people who enjoy soccer continue to play irrespective of the type of field surface.
References
1 NBC News, Artificial Turf Debate, October 8, 2014, 5:06 PM ET. http://www.nbcnews.com/storyline/artificial-turf-debate/how-safe-artificial-turf-your-child-plays-n220166. Accessed November 30, 2016. 2 Washington State Department of Health, Washington State Cancer Registry, issued January 2016. 3 Surveillance, Epidemiology, and End Results (SEER) Program (www.seer.cancer.gov) SEER*Stat Database version 8.3.2, National Cancer Institute, DCCPS, Surveillance Research Program, Surveillance Systems Branch, public use file released April 2016. 4 Washington State Department of Health, Center for Health Statistics Vital Registration System Annual Statistical Files, Washington State Deaths 1980–2013 issued August 2014. 5 Washington State Office of Financial Management, Forecasting Division. Estimates of Age, Sex, Race, and Hispanic Origin by 2010 Census: County. Population estimates for 1992-1999 released March 2013; U.S. Census counts and intercensal estimates for 2000-2010 released February 2013; estimates for 2011-2013 released June 2016. 6 National Cancer Institute, Statistical Research and Applications Branch. Joinpoint Regression Program, Version 4.2.0.2, released June 2015. 7 American Cancer Society. Leukemia in Children. 2016; http://www.cancer.org/cancer/leukemiainchildren/index. Accessed June 15, 2016. 8 National Cancer Institute. Leukemia. 2016; http://www.cancer.gov/types/leukemia. Accessed June 15, 2016. 9 National Cancer Institute. A snapshot of Adolescent and Young Adult Cancers. 2014; http://www.cancer.gov/research/progress/snapshots/adolescent-young-adult. Accessed August 6, 2016. 10 American Cancer Society. Non-Hodgkin Lymphoma in Children. 2016; http://www.cancer.org/cancer/non-hodgkinlymphomainchildren/index. Accessed June 15, 2016.

43
11 de Alarcon PA. Pediatric Hodgkin Lymphoma. 2015; http://emedicine.medscape.com/article/987101-overview?pa=MA0wx2SacinAz3c2IAB0bSS2879FAv8NXUeupzm%2FV%2FLeifdAVMxNtvFv6%2FkFqYtamQ7dvZ87eNIaqPmGRQT9MlaycSibeA0Q%2FJsWK%2BpGHzs%3D. Accessed August 4, 2016. 12 National Cancer Institute. Childhood Hodgkin Lymphoma Treatment (PDQ) - Health Professional Version. 2016; http://www.cancer.gov/types/lymphoma/hp/child-hodgkin-treatment-pdq - section/all. Accessed August 4, 2016. 13 American Academy of Pediatrics Council on Environmental Health. Chapter 45, Cancer. In Etzel RA, ed. Pediatric Environmental Health, 3rd Edition. Elk Grove Village, IL. American Academy of Pediatrics; 2012: 668. 14 Belson M, Kingsley B, Holmes A. Risk Factors for Acute Leukemia in Children: A Review. Environmental Health Perspectives. 2007;115(1):138-145. 15 Lightfoot TJ, Roman E. Causes of childhood leukaemia and lymphoma. Toxicol Appl Pharmacol. 2004;199(2):104-117. 16 Wakeford R. The risk of childhood leukaemia following exposure to ionising radiation--a review. J Radiol Prot. 2013;33(1):1-25. 17 Miglioretti DL, Johnson E, Williams A, et al. Pediatric Computed Tomography and Associated Radiation Exposure and Estimated Cancer Risk. JAMA pediatrics. 2013;167(8):700-707. 18 Doll R, Wakeford R. Risk of childhood cancer from fetal irradiation. Br J Radiol. 1997;70:130-139. 19 Infante-Rivard C, Guiguet M. Family history of hematopoietic and other cancers in children with acute lymphoblastic leukemia. Cancer Detection and Prevention. 2004;28(2):83-87. 20 American Cancer Society. What are the risk factors for acute lymphocytic leukemia? 2016; http://www.cancer.org/cancer/leukemia-acutelymphocyticallinadults/detailedguide/leukemia-acute-lymphocytic-risk-factors. Accessed August 4, 2016. 21 Seif AE. Pediatric leukemia predisposition syndromes: clues to understanding leukemogenesis. Cancer Genetics. 2011;204(5):227-244. 22 Puumala SE, Ross JA, Aplenc R, Spector LG. Epidemiology of childhood acute myeloid leukemia. Pediatr Blood Cancer. 2013;60(5):728-733. 23 Hjalgrim LL, Westergaard T, Rostgaard K, et al. Birthweight as a risk factor for childhood leukemia: a meta-analysis of 18 epidemiologic studies. Am J Epidemiol. 2003;158(8):724-735. 24 Pedersen-Bjergaard J, Andersen MK, Christiansen DH. Therapy-related acute myeloid leukemia and myelodysplasia after high-dose chemotherapy and autologous stem cell transplantation. Blood. 2000;95(11):3273. 25 Bailey HD, Infante-Rivard C, Metayer C, et al. Home pesticide exposures and risk of childhood leukemia: Findings from the childhood leukemia international consortium. Int J Cancer. 2015;137(11):2644-2663. 26 Chen M, Chang C-H, Tao L, Lu C. Residential Exposure to Pesticide During Childhood and Childhood Cancers: A Meta-Analysis. Pediatrics. 2015. 27 Vinson F, Merhi M, Baldi I, Raynal H, Gamet-Payrastre L. Exposure to pesticides and risk of childhood cancer: a meta-analysis of recent epidemiological studies. Occup Environ Med. 2011;68(9):694-702. 28 Ma X, Buffler PA, Gunier RB, et al. Critical windows of exposure to household pesticides and risk of childhood leukemia. Environ Health Perspect. 2002;110(9):955-960. 29 American Cancer Society. What are the risk factors for childhood leukemia? 2016; http://www.cancer.org/cancer/leukemiainchildren/detailedguide/childhood-leukemia-risk-factors . Accessed August 5, 2016 30 Freedman DM, Stewart P, Kleinerman RA, et al. Household solvent exposures and childhood acute lymphoblastic leukemia. American Journal of Public Health. 2001;91(4):564-567. 31 Miligi L, Benvenuti A, Mattioli S, et al. Risk of childhood leukaemia and non-Hodgkin's lymphoma after parental occupational exposure to solvents and other agents: the SETIL Study. Occup Environ Med. 2013;70(9):648-655. 32 Carlos-Wallace FM, Zhang L, Smith MT, Rader G, Steinmaus C. Parental, In Utero, and Early-Life Exposure to Benzene and the Risk of Childhood Leukemia: A Meta-Analysis. Am J Epidemiol. 2016;183(1):1-14.

44
33 Wiemels J. Perspectives on the causes of childhood leukemia. Chem Biol Interact. 2012;196(3):59-67. 34 Maia Rda R, Wunsch Filho V. Infection and childhood leukemia: review of evidence. Rev Saude Publica. 2013;47(6):1172-1185. 35 Rudant J, Lightfoot T, Urayama KY, et al. Childhood acute lymphoblastic leukemia and indicators of early immune stimulation: a Childhood Leukemia International Consortium study. Am J Epidemiol. 2015;181(8):549-562. 36 Kinlen L. Childhood leukaemia, nuclear sites, and population mixing. Br J Cancer. 2011;104(1):12-18. 37 Ahlbom A, Day N, Feychting M, et al. A pooled analysis of magnetic fields and childhood leukaemia. Br J Cancer. 2000;83(5):692-698. 38 Greenland S, Sheppard AR, Kaune WT, Poole C, Kelsh MA. A pooled analysis of magnetic fields, wire codes, and childhood leukemia. Childhood Leukemia-EMF Study Group. Epidemiology. 2000;11(6):624-634. 39 Kheifets L, Ahlbom A, Crespi CM, et al. Pooled analysis of recent studies on magnetic fields and childhood leukaemia. British Journal of Cancer. 2010;103(7):1128-1135. 40 Teepen JC, van Dijck JA. Impact of high electromagnetic field levels on childhood leukemia incidence. Int J Cancer. 2012;131(4):769-778. 41 National Cancer Institute. Electromagnetic Fields and Cancer. 2016; http://www.cancer.gov/about-cancer/causes-prevention/risk/radiation/electromagnetic-fields-fact-sheet. Accessed August 6, 2016. 42 Reynolds P, Von Behren J, Gunier RB, Goldberg DE, Hertz A, Smith DF. Childhood cancer incidence rates and hazardous air pollutants in California: an exploratory analysis. Environ Health Perspect. 2003;111(4):663-668. 43 Boothe VL, Boehmer TK, Wendel AM, Yip FY. Residential traffic exposure and childhood leukemia: a systematic review and meta-analysis. Am J Prev Med. 2014;46(4):413-422. 44 Heck JE, Park AS, Qiu J, Cockburn M, Ritz B. Risk of leukemia in relation to exposure to ambient air toxics in pregnancy and early childhood. Int J Hyg Environ Health. 2014;217(6):662-668. 45 Latino-Martel P, Chan DS, Druesne-Pecollo N, Barrandon E, Hercberg S, Norat T. Maternal alcohol consumption during pregnancy and risk of childhood leukemia: systematic review and meta-analysis. Cancer Epidemiol Biomarkers Prev. 2010;19(5):1238-1260. 46 Lehtinen M, Koskela P, Ögmundsdottir HM, et al. Maternal Herpesvirus Infections and Risk of Acute Lymphoblastic Leukemia in the Offspring. American Journal of Epidemiology. 2003;158(3):207-213. 47 Bailey HD, Metayer C, Milne E, et al. Home paint exposures and risk of childhood acute lymphoblastic leukemia: findings from the Childhood Leukemia International Consortium. Cancer Causes Control. 2015;26(9):1257-1270. 48 Crump C, Sundquist K, Sieh W, Winkleby MA, Sundquist J. Perinatal and family risk factors for Hodgkin lymphoma in childhood through young adulthood. Am J Epidemiol. 2012;176(12):1147-1158. 49 Chatterjee N, Hartge P, Cerhan JR, et al. Risk of Non-Hodgkin's Lymphoma and Family History of Lymphatic, Hematologic, and Other Cancers. Cancer Epidemiology Biomarkers & Prevention. 2004;13(9):1415-1421. 50 American Cancer Society. What are the risk factors for non-Hodgkin lymphoma in children? 2016; http://www.cancer.org/cancer/non-hodgkinlymphomainchildren/detailedguide/non-hodgkin-lymphoma-in-children-risk-factors. Accessed August 5, 2016. 51 American Cancer Society. What are the risk factors for non-Hodgkin lymphoma? 2016; http://www.cancer.org/cancer/non-hodgkinlymphoma/detailedguide/non-hodgkin-lymphoma-risk-factors. Accessed August 17, 2016. 52 Hjalgrim H, Smedby KE, Rostgaard K, et al. Infectious mononucleosis, childhood social environment, and risk of Hodgkin lymphoma. Cancer Res. 2007;67(5):2382-2388. 53 Glaser SL, Lin RJ, Stewart SL, et al. Epstein-Barr virus-associated Hodgkin's disease: epidemiologic characteristics in international data. Int J Cancer. 1997;70(4):375-382. 54 Gandhi MK, Tellam JT, Khanna R. Epstein–Barr virus-associated Hodgkin's lymphoma. British Journal of Haematology. 2004;125(3):267-281 55 Parkin DM. Cancers attributable to infection in the UK in 2010. Br J Cancer. 2011;105(S2):S49-S56.

45
56 International Agency for Research on Cancer (IARC). List of classifications by cancer sites with sufficient or limited evidence in humans, Volume 1-116. 2016; http://monographs.iarc.fr/ENG/Classification/index.php. Accessed August 2016. 57 Marcucci F, Spada E, Mele A, Caserta CA, Pulsoni A. The association of hepatitis B virus infection with B-cell non-Hodgkin lymphoma – a review. American Journal of Blood Research. 2012;2(1):18-28. 58 Taborelli M, Polesel J, Montella M, et al. Hepatitis B and C viruses and risk of non-Hodgkin lymphoma: a case-control study in Italy. Infectious Agents and Cancer. 2016;11:27. 59 Marcucci F, Mele A. Hepatitis viruses and non-Hodgkin lymphoma: epidemiology, mechanisms of tumorigenesis, and therapeutic opportunities. Blood. 2011;117(6):1792-1798. 60 Ekström Smedby K, Vajdic CM, Falster M, et al. Autoimmune disorders and risk of non-Hodgkin lymphoma subtypes: a pooled analysis within the InterLymph Consortium. Blood. 2008;111(8):4029-4038. 61 Fallah M, Liu X, Ji J, Forsti A, Sundquist K, Hemminki K. Autoimmune diseases associated with non-Hodgkin lymphoma: a nationwide cohort study. Ann Oncol. 2014;25(10):2025-2030. 62 Mellemkjaer L, Pfeiffer RM, Engels EA, et al. Autoimmune disease in individuals and close family members and susceptibility to non-Hodgkin's lymphoma. Arthritis & Rheumatism. 2008;58(3):657-666. 63 Wang J, Mack TM, Hamilton AS, et al. Common immune-related exposures/conditions and risk of non-Hodgkin lymphoma: a case-control study of disease-discordant twin pairs. Am J Epidemiol. 2015;182(5):417-425. 64 Papadopoulou C, Antonopoulos CN, Sergentanis TN, Panagopoulou P, Belechri M, Petridou ET. Is birth weight associated with childhood lymphoma? A meta-analysis. International Journal of Cancer. 2012;130(1):179-189. 65 Antonopoulos CN, Sergentanis TN, Papadopoulou C, et al. Maternal smoking during pregnancy and childhood lymphoma: a meta-analysis. Int J Cancer. 2011;129(11):2694-2703. 66 Buckley JD, Meadows AT, Kadin ME, Le Beau MM, Siegel S, Robison LL. Pesticide exposures in children with non-Hodgkin lymphoma. Cancer. 2000;89(11):2315-2321. 67 McNally RJQ, Parker L. Environmental factors and childhood acute leukemias and lymphomas. Leukemia & lymphoma. 2006;47(4):583-598. 68 Cheng H, Hu Y, Reinhard M. Environmental and health impacts of artificial turf: a review. Environ Sci Technol. 2014;48:2114–2129. 69 Synthetic Turf Council. Frequently Asked Questions about Crumb Rubber Infill. No date; https://syntheticturfcouncil.site-ym.com/page/CRIFAQs. Accessed September 19, 2016. 70 Personal communication, Michael Peterson, Gradient toxicologist, 1/07/2017. 71 Petrass L, Twomey D, Harvey J, Otago L, LeRossignol P. Comparison of surface temperatures of different synthetic turf systems and natural grass: Have advances in synthetic turf technology made a difference? Proceedings of the Institution of Mechanical Engineers, Part P: Journal of Sports Engineering and Technology. 2014;229(1);10-16. 72 Kazakova SV, Hageman JC, Matava M, et al. A clone of methicillin-resistant staphyloccus aureus among professional football players. N Engl J Med. 2005;352:468-475. 73 Atkinson TJ. A review of the role of benzene metabolites and mechanisms in malignant transformation: Summative evidence for a lack of research in nonmyelogenous cancer types. Int J Hyg Environ Health. 2009;212(1):1-10. 74 International Agency for Research on Cancer (IARC). Benzene. IARC Monographs Evaluating Carcinogenic Risk of Chemicals in Humans. 2012;100F(24):1–46. 75 Cardno ChemRisk. Review of the Human Health and Ecological Safety of Exposure to Recycled Tire Rubber Found at Playgrounds and Synthetic Turf Fields. 2013. 76 Ginsberg G, Toal B, Simcox N, et al. Human health risk assessment of synthetic turf fields based upon investigation of five fields in Connecticut. J Toxicol Environ Health. 2011;A74:1150–1174. 77 Norwegian Institute of Public Health and the Radium Hospital. Artificial turf pitches – an assessment of the health risks for football players. 2006; http://c.ymcdn.com/sites/syntheticturfcouncil.site-ym.com/resource/resmgr/Docs/Artificial_turf_pitches_-_an.pdf. Accessed December 2016. 78 U.S. Environmental Protection Agency, Centers for Disease Control and Prevention/Agency for Toxic Substances and Disease Registry, U.S. Consumer Product Safety Commission/Directions for Health

46
Sciences. Federal Research Action Plan on Recycled Tire Crumb Used on Playing Fields and Playgrounds. Status Report. 2016; https://www.epa.gov/sites/production/files/2016-12/documents/federal_research_action_plan_on_recycled_tire_crumb_used_on_playing_fields_and_playgrounds_status_report.pdf. Accessed January 3, 2017. 79 World Trade Center Health Program. Minimum Latency & Types of Cancer. 2012; https://www.cdc.gov/wtc/pdfs/wtchpminlatcancer2012-10-17.pdf. Accessed May 2016. 80 Washington Youth Soccer. The History Book. 2012: http://www.washingtonyouthsoccer.org/washington_youth_soccer_presents_the_history_book/. Accessed December 15, 2016. 81 Personal Communication, Branko Dugalic, Washington Youth Soccer, 11/10/2015. 82 Personal Communication, Amy Griffin, Coach University of Washington, Fall 2015. 83 R Core Team. R: A Language and Environment for Statistical Computing. R Foundation for Statistical Computing, Vienna, Austria. 2015; http://www.R-project.org. Accessed January 26, 2016. 84 U.S. Census Bureau. QuickFacts Washington. No date; http://www.census.gov/quickfacts/table/PST045215/53. Accessed December 15, 2016. 85 Washington Youth Soccer. Elite Player Development. No date: http://www.washingtonyouthsoccer.org/programs/elite_player_development/. Accessed December 2016. 86 Washington Youth Soccer. Rules of Competition (R) -- Internal Procedures Revision: January 5, 2016. 2016; http://www.washingtonyouthsoccer.org/resources/forms_downloads/?DocumentId=iWJ8FJPZzLh1BwgJoEUfgjpaHiELcPrJbuOFzr4eFro= . Accessed December 22, 2016) 87 International Agency for Cancer Research (IARC). Occupational Exposures in the Rubber-Manufacturing Industry. No date; http://monographs.iarc.fr/ENG/Monographs/vol100F/mono100F-36.pdf . Accessed January 2, 2017. 88 California Environmental Protection Agency. Environmental Health Study of Synthetic Turf – August 2016 Update. 2016; http://oehha.ca.gov/risk-assessment/fact-sheet-environmental-health-study-synthetic-turf. Accessed January 3, 2017. 89 Washington State Office of Financial Management. Preliminary Postcensal Estimates of April 1 Population by Age and Sex, 2010-Present. Version 20161201; http://www.ofm.wa.gov/pop/asr/agesex/ofm_pop_age_sex_postcensal_2010_to_2016_s.xlsx, Accessed January 12, 2017. 90 Washington State Office of Financial Management. Small Area Demographic Estimates (SADE) of the total population by Race Categories for Counties. Release version 20160422_R01; http://www.ofm.wa.gov/pop/asr/default.asp. Accessed December 16, 2017 91 American Cancer Society. Viruses that can lead to cancer. 2016; http://www.cancer.org/cancer/cancercauses/othercarcinogens/infectiousagents/infectiousagentsandcancer/infectious-agents-and-cancer-viruses. Accessed December 22, 2016. 92 American Cancer Society. What are the risk factors for non-Hodgkin lymphoma? 2016; http://www.cancer.org/cancer/non-hodgkinlymphoma/detailedguide/non-hodgkin-lymphoma-risk-factors. Accessed December 22, 2016 93 National Cancer Institute. Computed Tomography (CT) Scans and Cancer. What are the risks of CT scans for children? 2013; https://www.cancer.gov/about-cancer/diagnosis-staging/ct-scans-fact-sheet. Accessed Dec 5 2016

47
Appendix A: Project Team Washington State Department of Health
Office of the State Health Officier
Cathy Wasserman, PhD, MPH
Eric Ossiander, PhD
Juliet VanEenwyk, PhD, MS
Office of Environmental Health, Safety and Toxicology
Lauren Jenks, MPH, CHES
Office of Healthy Communities
Mahesh Keitheri Cheteri, PhD
University of Washington School of Public Health, Department of Environmental and Health Sciences
Tania m. Busch Isaksen, PhD, MPH
Rachel M. Shaffer, BA
Rebekah Petroff, MS
Public Health – Seattle & King County, Communicable Disease Epidemiology and Immunization Section
Vance Kawakami, DVM, MPH

48

49
Appendix B: Methods for Calculating Cancer Rates Definition of types of cancer
Incidence. The Washington State Cancer Registry (WSCR) collects information on newly diagnosed cancers among Washington residents even if the individuals are diagnosed and treated out-of-state. The North American Association of Central Cancer Registries (NAACCR) and the Centers for Disease Control and Prevention (CDC) National Program of Cancer Registries review the WSCR incidence data annually for quality and completeness. The national program also conducts in-depth audits of WSCR on a regular basis. WSCR continues to be recognized by both organizations for the completeness (more than 95 percent complete) and quality of its data. The cancer registry uses the International Classification of Disease for Oncology Third Edition (ICD-O-3) primary site and histology codes information to determine types and subtypes of cancer, as does the National Surveillance, Epidemiology and End Results (SEER). We used SEER classifications to group types and subtypes of cancer into categories of leukemia, non-Hodgkin and Hodgkin lymphoma (http://seer.cancer.gov/siterecode/icdo3_dwhoheme/index.html).
The all cancers combined category included in situ and invasive cancers. In situ cancers have not invaded or penetrated surrounding tissues. The “in-situ” designation does not apply to leukemia, non-Hodgkin and Hodgkin lymphoma.
Cancer Type International Classification of Diseases for Oncology Third Edition Codes
All cancers combined C00.0 - C80.9, all histology codes
Leukemia All sites with histology 9733, 9742, 9800-9810, 9820, 9826, 9831-9836, 9838-9948, 9963, 9964; for sites C420, C421 and C424 only, histology 9823, 9827, 9837, or 9811-9818
Non-Hodgkin lymphoma
All sites with histology 9590-9597, 9670-9729, 9735, 9737, 9738; and except for sites C420, C421 and C424 all other sites with histology 9823, 9827, 9837, or 9811-9818
Hodgkin lymphoma All primary sites with histology codes 9650-9667
Death. The Washington State Department of Health, Center for Health Statistics collects information on causes of death for all Washington residents including those who die out of state. According to the National Center for Health Statistics, more than 99 percent of all deaths occurring in the United States are registered in the death certificate system. Accuracy of reporting specific causes of death varies since classification of disease conditions is a medical-legal opinion subject to the best information available to the physician, medical examiner, or coroner certifying the cause of death. Causes of death in Washington and nationally are coded to the International Classification of Diseases 9th Revision for deaths during 1980–1998 and 10th Revision for deaths beginning in 1999. This change in coding did not have substantively affect classification of deaths due to cancer. Following SEER standards, we used the following ICD-9 and ICD-10 codes. (http://seer.cancer.gov/codrecode/1969+_d04162012/index.html).
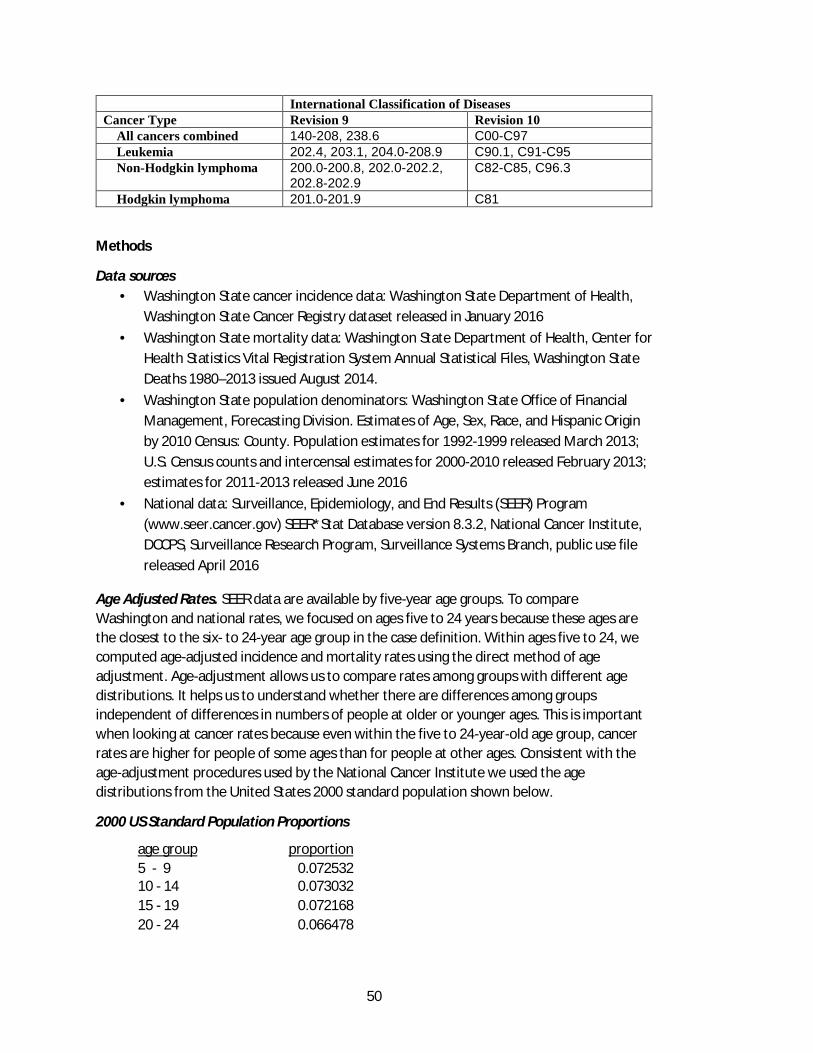
50
International Classification of Diseases Cancer Type Revision 9 Revision 10 All cancers combined 140-208, 238.6 C00-C97 Leukemia 202.4, 203.1, 204.0-208.9 C90.1, C91-C95 Non-Hodgkin lymphoma 200.0-200.8, 202.0-202.2,
202.8-202.9 C82-C85, C96.3
Hodgkin lymphoma 201.0-201.9 C81
Methods
Data sources · Washington State cancer incidence data: Washington State Department of Health,
Washington State Cancer Registry dataset released in January 2016 · Washington State mortality data: Washington State Department of Health, Center for
Health Statistics Vital Registration System Annual Statistical Files, Washington State Deaths 1980–2013 issued August 2014.
· Washington State population denominators: Washington State Office of Financial Management, Forecasting Division. Estimates of Age, Sex, Race, and Hispanic Origin by 2010 Census: County. Population estimates for 1992-1999 released March 2013; U.S. Census counts and intercensal estimates for 2000-2010 released February 2013; estimates for 2011-2013 released June 2016
· National data: Surveillance, Epidemiology, and End Results (SEER) Program (www.seer.cancer.gov) SEER*Stat Database version 8.3.2, National Cancer Institute, DCCPS, Surveillance Research Program, Surveillance Systems Branch, public use file released April 2016
Age Adjusted Rates. SEER data are available by five-year age groups. To compare Washington and national rates, we focused on ages five to 24 years because these ages are the closest to the six- to 24-year age group in the case definition. Within ages five to 24, we computed age-adjusted incidence and mortality rates using the direct method of age adjustment. Age-adjustment allows us to compare rates among groups with different age distributions. It helps us to understand whether there are differences among groups independent of differences in numbers of people at older or younger ages. This is important when looking at cancer rates because even within the five to 24-year-old age group, cancer rates are higher for people of some ages than for people at other ages. Consistent with the age-adjustment procedures used by the National Cancer Institute we used the age distributions from the United States 2000 standard population shown below.
2000 US Standard Population Proportions
age group proportion 5 - 9 0.072532 10 - 14 0.073032 15 - 19 0.072168 20 - 24 0.066478

51
For the national age-adjusted incidence rates for 2009–2013 combined and for trends from 1992–2013, we used the National Cancer Institute’s 13 SEER regions. For the 1992–2013 trend analysis, the SEER*Stat software provided incidence data from the 13 regions. We used the same 13 SEER regions to compute national incidence rates for 2009–2013 combined. For the national listing of the most frequently diagnosed cancers among people ages five to 24 years, we used incidence data from 18 SEER regions, because SEER*Stat provides frequencies only for the 18 SEER regions.
We used a z-test statistic to test for differences in rates in Washington and the United States. If the probability of the differences between Washington and the United States were more than five percent (Z ≥ 1.96), we considered Washington and the United States to be statistically significantly different.
Changes in Incidence Rates Over Time. We used Joinpoint software, version 4.2.0.2, developed by the National Cancer Institute to test for changes over time.1 This software calculates the annual percent change (APC). Following the method described by Ries et al.2 to interpret findings from the Joinpoint analyses, we describe rates as level over time when the APC is not statistically significantly different from zero (p≥ 0.05). For statistically significant trends (p<0.05), the increase or decrease is described as slight if the APC is less than 1 percent, steady if the APC is between 1 to 3.9 percent and sharp if the APC is greater than or equal to 4 percent.
___________________________________________________________________________
1. Joinpoint Regression Program, Version 4.2.0.2, released June 2015; Statistical Research and Applications Branch, National Cancer Institute.) 2. Ries LAG, Wingo PA, Miller BF, Miller DS, Howe Hl et al. The annual report to the nation on the status of cancer, 1973-1997, with a special section on colorectal cancer. Cancer, 2000, 88:2398-2424.

52

53
Appendix C. Observed and expected cancers for soccer cohort

Appendix CObserved and expected cancers for soccer cohort
Washington State Department of HealthJanuary 17, 2017
This documents the calculation of the expected number of cancers from the soccer cohort, anddisplays those results, along with the observed numbers and the observed/expected ratios.
The basic case definition is a cancer diagnosis from 2002–2015 among persons age 6–24 atdiagnosis, who have a history of playing soccer in Washingon State. We assume a minimum 0.4year latency; therefore cases must have started playing soccer at least 0.4 years before the date ofdiagnosis. We consider 4 variations of this case definition: all cancers, Hodgkin lymphoma,non-Hodgkin lymphoma, and leukemia.
The person-years-at-risk consists of all the years spent by people in which they would beconsidered a case if they had a cancer diagnosis. According to this case definition, the person-yearsat risk include all the years that soccer players spend that meet these 3 conditions: they playsoccer or have played in the past, and began playing at least 0.4 years before they are consideredto be at risk; the time period for diagnosis is 2002–2015; and they are age 6–24 at diagnosis. Someexamples: if Jack started playing soccer at age 10 in 1996, he would become eligible to be a case in2002 when he was 16 years old. He would be eligible for 9 years, until he turned 25, so hecontributes 9 person-years at risk. The case definition requires only a history of playing soccer, soJack contributes 9 person-years even if he stopped playing soccer in 1997. If Mary started playingsoccer at age 6 in mid-2011, she would be eligible to become a case from 0.4 years after she starteduntil the end of 2015, so she contributes 4.1 person-years at risk.
To make a definitive calculation of person-years at risk, we would need a roster of everyone whoplayed soccer from 1983 to the present. What we have are counts of players from 2000–2015 byage, for approximately ages 6–19 (Table 2), and counts of the total number of players for years1983–1999. Therefore, we need to make several approximations in order to calculate person-years.
Here is a list of the approximations and/or assumptions made:
• The age distribution of youth soccer players during 1983–1999 was the same as in the year2000.
• There is some player turnover at ages 7–15, meaning that some players stop playing at theend of each year, and each year sees some new players who have never enrolled before. Iassume 10% turnover each year, defined like this: if the previous year had fewer players thanthe current year (for example, as the age 7 enrollment in 2006 is less than the age 8enrollment in 2007), then I assume that 90% of the previous year’s players have returned,and the difference is made up with new players. If the previous year had more players (forexample, as the age 10 enrollment in 2006 is more than the age 11 enrollment in 2007), then Iassume that the current year’s players are 90% returnees and 10% new players. There is abig drop in the number of players at age 16, and I assumed that every player who wasenrolled at age 16 and older had been enrolled in the past. (This means that enrollmentfigures for players age 16 and older are not needed for calculating person-years at risk.)
• Follow-up ends at the end of 2015. This provides 9 months lag for case ascertainment (as Iwrite this in September 2016). This also means that people diagnosed in 2016 do not meetthe case definition and are not considered as cases in the computations.
The player registration spreadsheet (Table 2) shows the number of players of each age registered ineach year. The age displayed in the table is the age the player was when he or she registered that
54

year. Players who registered in April are listed under their age in April; players who registered inAugust are listed under their age in August. Therefore, players who are the same age may belisted as different ages in the spreadsheet if some registered in April, some registered in August,and their birthdays fall between April and August. My understanding is that most players registerin August. Among players who registed in August, the average month at which they became theirregistration age was February. For example, players who registered as 9 year olds in August couldhave turned 9 anytime between the previous August and the current August, with the averagemonth being February. Similarly, among players who registered in April, the average month atwhich they became their registration age was November of the previous year. If 80% of playersregistered in August, then among both groups of players, the average month at which they turnedtheir registration age was January of the registration year. Among players registering for the firsttime, the average month of registration (and average month during which exposure begins) is July.
Although I have approximated player turnover to be 10% at ages 6–15, I also computedperson-years at risk under an assumption of no turnover (defined like this: if the current year’senrollment is less than the previous year’s enrollment, then all players are assumed to be returningplayers). This provided a lower bound on the effect of this assumption on person-years (and anupper bound on its effect on O/E).
We can partition the years-at-risk calculation into 4 types of players:
1. Players who started playing before 2002 and reached age 25 between 2002 and the end of2015. For example, consider players who started at age 8 in 1995. The average such playerturned 8 in mid-January 1995, and turned 25 in mid-January 2012. They entered the at-riskcohort on January 1, 2002, and spent an average of 10 years and 0.5 month at risk. Theiryears at-risk are computed as the (year they turn 25) - 2002 + 0.5 month. The year theyturn 25 is computed as 25 - (age at registration) + (year they began playing). Therefore,their average years-at-risk are 25 - (age at registration) + (year they began playing) - 2002 +0.5 month.
2. Players who began playing in 2002 or later and reached age 25 by the end of 2015. Forexample, consider players who began at age 14 in 2004. The average date at which theseplayers begin exposure is mid-July 2004, and after a 0.4 year latency period, the average dateat which they become eligible to be a case is mid-December 2004. The average date at whichthey reach their 25th birthday is mid-January 2015. Their average years-at-risk is 10 yearsand 1 month each. The average years-at-risk for players of this type is 24.5 - (the age atwhich they began playing + 0.4).
3. Players who began playing before 2002 and have not reached age 25 by the end of 2015.These players have spent the entire period January 2002–December 2015 at risk, and theyears-at-risk for each of them is 14 years.
4. Players who began playing in 2002 or later and have not reached age 25. For example,consider players who started at age 8 in 2005. After a 0.4 year latency, these players enter theat-risk state in mid-December 2005, and have spent the entire period since then at risk, so theyears-at-risk for each of them is 10 years and 0.5 months (to the end of December 2015). Theyears-at-risk for players of this type is 2015 - (year they began playing + 0.4) + 5.5 months.
The way to identify these players is like this:
1. Players who started playing before 2002 and reached age 25 between 2002 and the end of2015. These players meet three conditions:
(a) (year began playing) ≤ 2001
(b) 25 - (age began playing) ≤ 2015 - (year began playing)
55
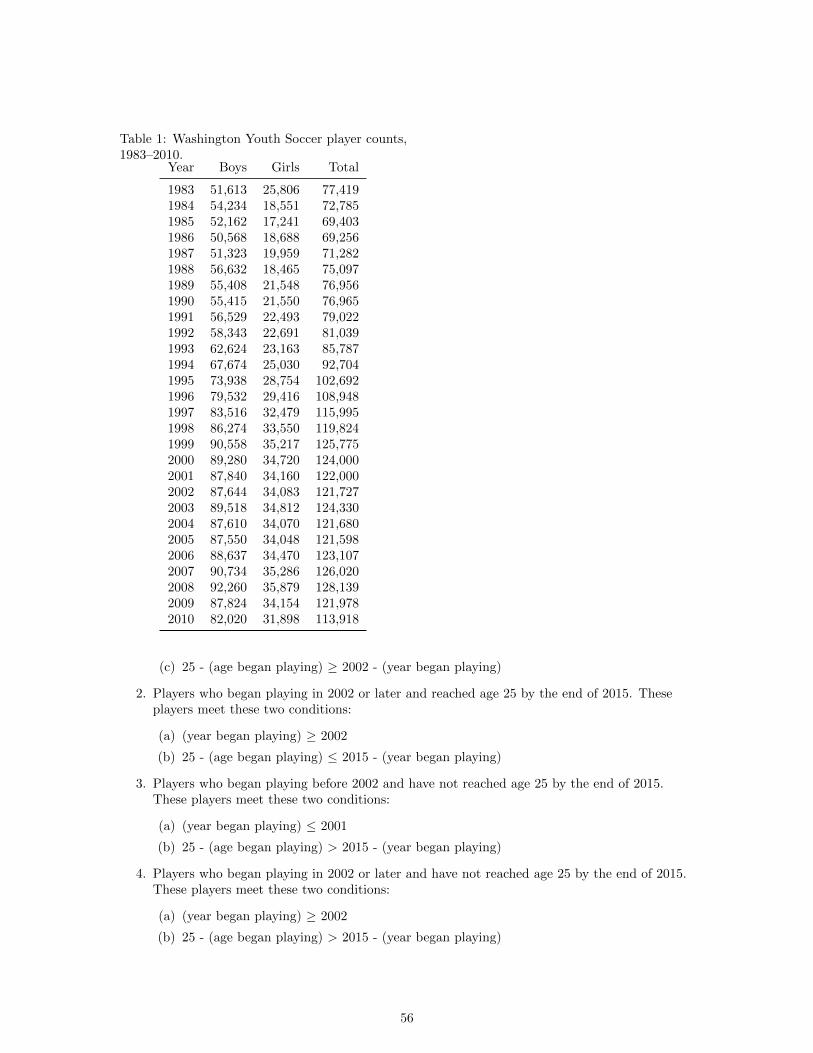
Table 1: Washington Youth Soccer player counts,1983–2010.
Year Boys Girls Total
1983 51,613 25,806 77,4191984 54,234 18,551 72,7851985 52,162 17,241 69,4031986 50,568 18,688 69,2561987 51,323 19,959 71,2821988 56,632 18,465 75,0971989 55,408 21,548 76,9561990 55,415 21,550 76,9651991 56,529 22,493 79,0221992 58,343 22,691 81,0391993 62,624 23,163 85,7871994 67,674 25,030 92,7041995 73,938 28,754 102,6921996 79,532 29,416 108,9481997 83,516 32,479 115,9951998 86,274 33,550 119,8241999 90,558 35,217 125,7752000 89,280 34,720 124,0002001 87,840 34,160 122,0002002 87,644 34,083 121,7272003 89,518 34,812 124,3302004 87,610 34,070 121,6802005 87,550 34,048 121,5982006 88,637 34,470 123,1072007 90,734 35,286 126,0202008 92,260 35,879 128,1392009 87,824 34,154 121,9782010 82,020 31,898 113,918
(c) 25 - (age began playing) ≥ 2002 - (year began playing)
2. Players who began playing in 2002 or later and reached age 25 by the end of 2015. Theseplayers meet these two conditions:
(a) (year began playing) ≥ 2002
(b) 25 - (age began playing) ≤ 2015 - (year began playing)
3. Players who began playing before 2002 and have not reached age 25 by the end of 2015.These players meet these two conditions:
(a) (year began playing) ≤ 2001
(b) 25 - (age began playing) > 2015 - (year began playing)
4. Players who began playing in 2002 or later and have not reached age 25 by the end of 2015.These players meet these two conditions:
(a) (year began playing) ≥ 2002
(b) 25 - (age began playing) > 2015 - (year began playing)
56
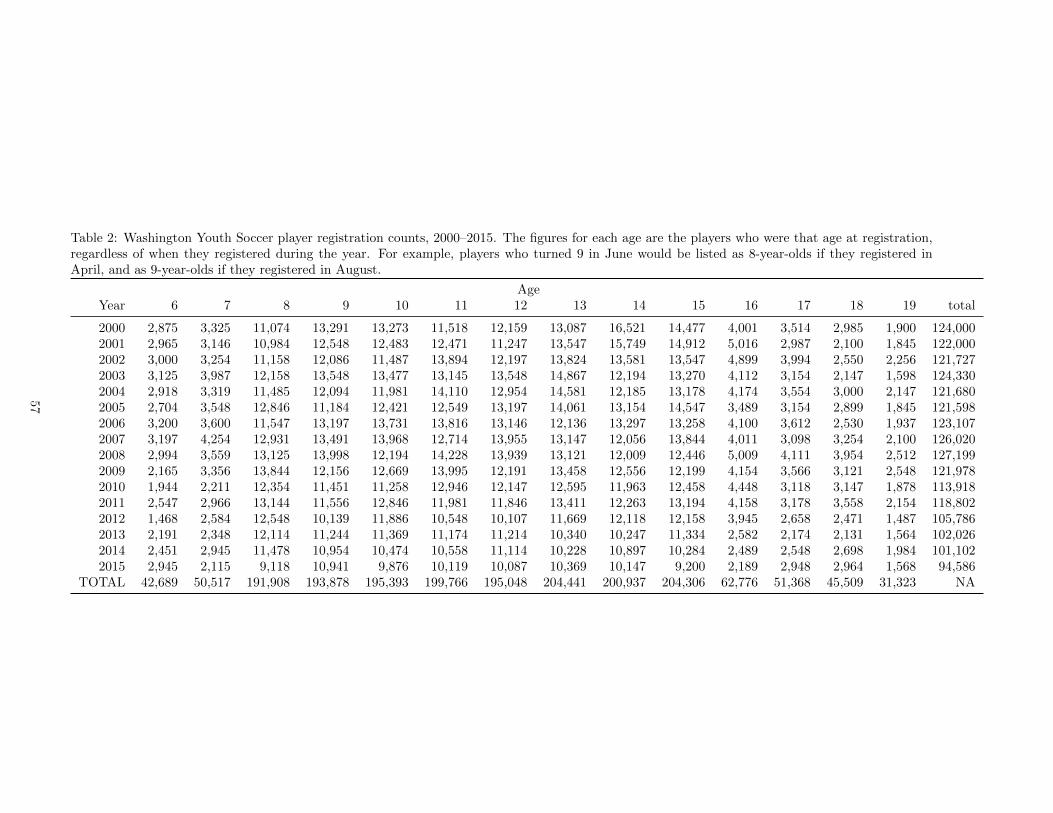
Table 2: Washington Youth Soccer player registration counts, 2000–2015. The figures for each age are the players who were that age at registration,regardless of when they registered during the year. For example, players who turned 9 in June would be listed as 8-year-olds if they registered inApril, and as 9-year-olds if they registered in August.
AgeYear 6 7 8 9 10 11 12 13 14 15 16 17 18 19 total
2000 2,875 3,325 11,074 13,291 13,273 11,518 12,159 13,087 16,521 14,477 4,001 3,514 2,985 1,900 124,0002001 2,965 3,146 10,984 12,548 12,483 12,471 11,247 13,547 15,749 14,912 5,016 2,987 2,100 1,845 122,0002002 3,000 3,254 11,158 12,086 11,487 13,894 12,197 13,824 13,581 13,547 4,899 3,994 2,550 2,256 121,7272003 3,125 3,987 12,158 13,548 13,477 13,145 13,548 14,867 12,194 13,270 4,112 3,154 2,147 1,598 124,3302004 2,918 3,319 11,485 12,094 11,981 14,110 12,954 14,581 12,185 13,178 4,174 3,554 3,000 2,147 121,6802005 2,704 3,548 12,846 11,184 12,421 12,549 13,197 14,061 13,154 14,547 3,489 3,154 2,899 1,845 121,5982006 3,200 3,600 11,547 13,197 13,731 13,816 13,146 12,136 13,297 13,258 4,100 3,612 2,530 1,937 123,1072007 3,197 4,254 12,931 13,491 13,968 12,714 13,955 13,147 12,056 13,844 4,011 3,098 3,254 2,100 126,0202008 2,994 3,559 13,125 13,998 12,194 14,228 13,939 13,121 12,009 12,446 5,009 4,111 3,954 2,512 127,1992009 2,165 3,356 13,844 12,156 12,669 13,995 12,191 13,458 12,556 12,199 4,154 3,566 3,121 2,548 121,9782010 1,944 2,211 12,354 11,451 11,258 12,946 12,147 12,595 11,963 12,458 4,448 3,118 3,147 1,878 113,9182011 2,547 2,966 13,144 11,556 12,846 11,981 11,846 13,411 12,263 13,194 4,158 3,178 3,558 2,154 118,8022012 1,468 2,584 12,548 10,139 11,886 10,548 10,107 11,669 12,118 12,158 3,945 2,658 2,471 1,487 105,7862013 2,191 2,348 12,114 11,244 11,369 11,174 11,214 10,340 10,247 11,334 2,582 2,174 2,131 1,564 102,0262014 2,451 2,945 11,478 10,954 10,474 10,558 11,114 10,228 10,897 10,284 2,489 2,548 2,698 1,984 101,1022015 2,945 2,115 9,118 10,941 9,876 10,119 10,087 10,369 10,147 9,200 2,189 2,948 2,964 1,568 94,586
TOTAL 42,689 50,517 191,908 193,878 195,393 199,766 195,048 204,441 200,937 204,306 62,776 51,368 45,509 31,323 NA
57

To calculate the total person-years at risk, I used Washington Youth Soccer (WYS) enrollmentfigures to estimate the number of players who enroll for the first time each year. We have beengiven enrollment figures by age only back to 2000. For years 1983–1999, I assumed the agedistribution was the same as in 2000, but I scaled the number of players per year of age so that thetotal for each year matches the total enrollment reported in each year in The History Book (seeTable 1).
To compute person-years, first, I created a matrix with rows for each year 1983–2015 and columnsfor each age 6–15. For each cell in the matrix, I computed the estimated number of players whobegan playing soccer in that year and at that age (I called this the newplayers matrix). Next, Iprepared a similar matrix and assigned to each cell a code of 1 to 4 defining which of the 4 types ofplayers described above were represented by that cell (cells that corresponded to none of those 4definitions could not contribute person-years and received a code of 0) (I called this theplayerType matrix). Then I applied the one of the 4 formulae descibed above for computingyears-at-risk to each cell of the newplayers matrix, by using the codes in the playerType matrix.This resulted in a matrix with the each cell having the person-years contributed by the playersdefined by that cell. For example, consider the cell for players who began playing soccer at the ageof 7 in 2004. After applying the 10% turnover assumption, there are an estimated 506 such players.These players are of type 4 (players who began playing in 2002 or later and have not reached age25 by the end of 2015). The person-years-at-risk for each player of type 4 is given by 2015 - (yearthey began playing + 0.4) + 5.5 months, which computes to 11.0583 years per player. So the 506players who began playing in 2004 at age 7 contributed a total of 5,595.5 person-years.
By these calculations, assuming 10% turnover, the total person-years-at-risk is 4,977,989.
Assuming no turnover
I repeated the calculations assuming no turnover. Here, if the enrollment for the current yearexceeds that for the previous year, then the excess players were counted as new players. Otherwise,there were no new players.
Under the assumption of no turnover, the total person-years-at-risk is 3,479,355. This is muchdifferent from the figure for 10% turnover, and indicates that the calculation is sensitive to thisassumption.
Person-years by age
I computed the person-years-at-risk by individual year of age, for ages 6–24, to help compute theexpected numbers of cancers. The personYears matrix has the person-years that each cell, whichis defined by the year and age at which a player started playing, accumulated. I took the entries ineach cell of the personYears matrix and distributed them over the years of age that the playersdefined by that cell were at risk. The details of how person-years were distributed by age dependon the player type category, as described below. The average time at which players are assumed tohave started playing is mid-July of the year they began playing.
1. Type 1 players donate half a month of their person-years to their first year of eligibility, anda full year to all their later years of eligibility. For example, players who started at age 6 in1985 turned 23 in mid-January 2002, so they are at risk from Jan 1 to Jan 15 when they are22, then for 2 full years until they turn 25 in mid-January 2004.
2. Type 2 players give 0.1 years of their person-years to the year in which they began playing,and a full year to each year until they turn 25. For example, players who started at age 14 in
58

Table 3: Person-years-at-risk by age, forall the players in the at-risk population.
Age person-years
6 3,8087 38,0278 62,0859 182,461
10 206,87211 232,69712 258,93113 278,90914 306,19715 325,51816 349,00817 351,33418 349,83919 348,83220 345,25621 342,75922 338,21023 332,83224 325,111
2002 are at risk for 0.1 years at age 14, from about mid-December 2002 to the followingmid-January 2003, then for 10 full years until they turn 25 in mid-January 2013.
3. Type 3 players give half a month of person-years to their first year of eligibility, 11.5 months(mid-January to end of December) to their last, and a full year to each of the years inbetween.
4. Type 4 players give 0.1 years of their person-years to the year in which they began playing,11.5 months (mid-January to end of December) to their last year of eligibility, and a full yearto each of the years in between.
Compute cancer rates
I computed Washington State cancer rates by single year of age, for ages 6–24, for each of thegroupings in the case definition (all cancers, non-Hodgkin lymphoma, Hodgkin lymphoma, andleukemia).
I used the 2002–2013 WSCR data and the 2002–2013 OFM population files to compute cancerrates. The rates for each single year of age 6–24 are in Table 4.
Expected numbers of cancers
To compute the expected numbers of cancers in the soccer player cohort, I applied the age-specificrates to the person-years-at-risk, then summed across all ages (see Table 5).
59

Table 4: Age-specific cancer rates among Washington residents, 2002–2013. The rates are diagnosesper 100,000 population per year.
cancer rates per 100,000 population per yearage all cancers leukemia Hodgkin lymphoma non-Hodgkin lymphoma
6 12.14 4.11 0.4894 0.8817 13.31 3.82 0.0979 1.3708 11.35 3.62 0.3915 1.0779 9.49 2.64 0.1958 0.979
10 11.06 2.17 0.6618 1.22911 11.35 3.03 0.6618 0.75612 14.65 3.97 1.3236 0.66213 14.37 2.74 1.3236 1.60714 17.11 3.31 1.5127 1.70215 19.29 2.85 2.2959 1.92916 20.94 2.39 2.2959 1.46917 25.25 2.76 3.2142 1.74518 28.47 2.66 3.3979 1.46919 29.48 2.39 4.2244 2.02020 38.31 2.72 3.9944 2.08821 39.04 2.45 4.9930 2.90522 45.03 2.36 3.6313 2.45123 46.57 1.36 4.6299 2.17924 53.56 2.45 6.0824 2.542
Table 5: Expected numbers of cancers diagnosedfrom January 1, 2002 to December 31, 2015 amongWashington residents age 6–24 who have a historyof playing organized soccer.
cancer type expected cases
All cancer 1,384Leukemia 131
Hodgkin lymphoma 147Non-Hodgkin lymphoma 89
Observed/Expected ratios
There are 55 cases on the case master list (including 2 people with 2 cancer diagnoses each). Ofthose, 51 have had the diagnosis of cancer confirmed by DOH. Of those confirmed, 49 werediagnosed between 2002 and 2015. Of those, 43 played soccer. Of those, 28 were between 6 and 24years old at diagnosis (see Table 6).
I computed observed/expected ratios for the age groups 6–9, 10–14, 15–19, and 20–24 for allcancers, along with the observed/expected ratios for all ages combined for all cancers and for thethree cancer types listed in the case definition: leukemia, non-Hodgkin lymphoma, and Hodgkinlymphoma.
The observed cancer cases that fit the case definition are tabulated in Table 8. The numbers arefrom the spreadsheet “SoccerPlayerCaseMasterList.xlsx.” One person who fit the case definitionhad 2 cancer diagnoses; both are counted.
The expected numbers of all cancers by age group are shown in Table 7.
60

Table 6: Number of cases and their eligibility sta-tus.
condition Yes No Unknown
Age 6-24 36 16 3Diagnosis confirmed 51 4 0Played soccer 49 6 0
Total reported cases 55 . .
Total eligible cases 28 . .
Table 7: Expected cancers by age group,for all cancer types diagnosed betweenJanuary 2002 and December 2015, inpeople age 6–24 at diagnosis, and whohave a history of playing organized soc-cer.
Age group expected cancers06-09 29.910-14 179.715-19 427.020-24 747.5
Total 1,384.1
To compute observed/expected ratios, I just divided the observed numbers by the expectednumbers of cancers (see Table 8). I computed 95% exact Poisson confidence intervals for theobserved to expected ratio.
Goalkeepers
I computed the expected numbers of cancers for players who have a history of playing thegoalkeeper position. Players are generally not assigned to be goalkeepers until they play on ‘10 and
Table 8: Observed to expected ratios for cancer by age group and by type, in the soccer playerscohort.
observed expected observed/ 95% CI for O/EAge group cancers cancers expected lower upper
06-09 1 30 0.033 0.0008 0.1910-14 12 180 0.067 0.0345 0.1215-19 8 427 0.019 0.0081 0.0420-24 7 747 0.009 0.0038 0.02
observed expected observed/ 95% CI for O/ECancer type cancers cancers expected lower upper
All cancers 28 1,384 0.020 0.013 0.029Leukemia 6 131 0.046 0.017 0.099Hodgkin lymphoma 5 147 0.034 0.011 0.079Non-Hodgkin lymphoma 6 89 0.067 0.025 0.146
61

Table 9: Washington Youth Soccer goalkeeper estimates, 2000–2015. The figures for each age arethe number of goalkeepers estimated to play on teams for that age and under.
AgeYear 10 11 12 13 14 15 16 17 18 19
2000 2,172 1,595 1,368 1,472 1,239 1,086 300 264 224 1422001 2,043 1,727 1,265 1,524 1,181 1,118 376 224 158 1382002 1,880 1,924 1,372 1,555 1,019 1,016 367 300 191 1692003 2,205 1,820 1,524 1,673 915 995 308 237 161 1202004 1,961 1,954 1,457 1,640 914 988 313 267 225 1612005 2,033 1,738 1,485 1,582 987 1,091 262 237 217 1382006 2,247 1,913 1,479 1,365 997 994 308 271 190 1452007 2,286 1,760 1,570 1,479 904 1,038 301 232 244 1582008 1,995 1,970 1,568 1,476 901 933 376 308 297 1882009 2,073 1,938 1,371 1,514 942 915 312 267 234 1912010 1,842 1,793 1,367 1,417 897 934 334 234 236 1412011 2,102 1,659 1,333 1,509 920 990 312 238 267 1622012 1,945 1,460 1,137 1,313 909 912 296 199 185 1122013 1,860 1,547 1,262 1,163 769 850 194 163 160 1172014 1,714 1,462 1,250 1,151 817 771 187 191 202 1492015 1,616 1,401 1,135 1,167 761 690 164 221 222 118
under’ or older teams. Therefore, for this computation, the case definition is a person diagnosedwith cancer between 2002 and the present, who was age 9–24 at diagnosis, and has a history ofplaying the goalkeeper position in organized soccer in Washington State. The person-years at riskare computed as all the years spent by people such that they would meet the case definition if theywere diagnosed with cancer.
The goalkeeper calculations do not incorporate a latency period, since it is assumed that mostgoalkeepers played organized soccer for at least a short time before officially becoming goalkeepers.
To calculate the total person-years at risk, I used the estimated number of goalkeepers (Table 9) toestimate the number of players who play goalkeeper for the first time each year. We have beengiven estimates only back to 2000. For 1983–1999, I assumed that the age distribution was thesame as in 2000, but I scaled the number of players so that the total number of players was thesame as the total reported in each year in The History Book. The estimated number of playersdeclines a lot at the age ‘16 and under’ team, and I assume that all goalkeepers on the ‘16 andunder’ or older teams have played goalkeeper before.
By these calculations, assuming 10% turnover, the total person-years-at-risk is 527,076.
Person-years by age
I computed the person-years-at-risk among goalkeepers by individual year of age, for ages 10–24,to help compute the expected numbers of cancers.
Expected numbers of cancers
To compute the expected numbers of cancers in the goalkeeper cohort, I applied the age-specificrates to the person-years-at-risk, then summed across all ages (see Table 11).
62

Table 10: Person-years-at-risk by age,for all the goalkeepers in the at-risk pop-ulation.
Age person-years
10 17,07611 31,68112 33,96213 36,58414 38,82615 40,25116 41,17517 40,88218 40,33719 39,43820 38,44621 37,65922 36,88223 35,77824 34,724
Table 11: Expected numbers of cancers diagnosedfrom January 1, 2002 to August 31, 2015 amongWashington residents age 10–24 who have a his-tory of playing the goalkeeper position in orga-nized soccer.
cancer type expected cases
All cancer 153.48Leukemia 14.42Hodgkin lymphoma 16.59Non-Hodgkin lymphoma 9.87
Observed/Expected ratios
To ascertain goalkeeper status, I used both the data reported by Coach Griffin, and the dataobtained by interviewing the cases. If a case was interviewed, I used that information, unless it wasmissing. Otherwise, I used the information from the coach.
To compute observed/expected ratios, I just divided the observed numbers by the expectednumbers of cancers (see Table 12). I computed 95% exact Poisson confidence intervals for theobserved to expected ratio.
Table 12: Observed to expected ratios for cancer by type, in the goalkeepers cohort.
observed expected observed/ 95% CI for O/ECancer type cancers cancers expected lower upper
All cancers 14 153.5 0.091 0.050 0.15Leukemia 3 14.4 0.208 0.043 0.61Hodgkin lymphoma 4 16.6 0.241 0.066 0.62Non-Hodgkin lymphoma 2 9.9 0.203 0.025 0.73
63

Table 13: Person-years-at-risk by age,for elite players.
Age person-years
6 07 08 3,0029 32,095
10 41,37811 46,89812 51,82513 56,79114 62,38615 66,81516 72,27717 72,76818 72,59119 72,46320 71,69221 71,23822 70,28623 69,26224 67,729
Table 14: Expected numbers of cancers diagnosedfrom January 1, 2002 to August 31, 2015 amongWashington residents age 7–24 who have a historyof playing elite organized soccer.
cancer type expected cases
All cancer 283.6Leukemia 26.2Hodgkin lymphoma 30.4Non-Hodgkin lymphoma 18.2
Expected cancers among elite players
The spreadsheet Player Distribution - Will Holden Model Updated 9-24.xlsx hasestimates of the numbers of “premier” and “select” players by age for 2013–2014. Together, thesetwo categories comprise the elite players. Elite players are of particular interest because they playmore months of the year than recreational players, and are more likely to play on crumb rubberfields (because they play during seasons with poor weather).
I computed the proportion of elite players by age, and applied that proportion to the cohort ofplayers I used for computing expected cancers among all players. Then I computed theperson-years at risk and expected cancers as before.
By these calculations, assuming 10% turnover, the total person-years-at-risk is 1,001,496.
64
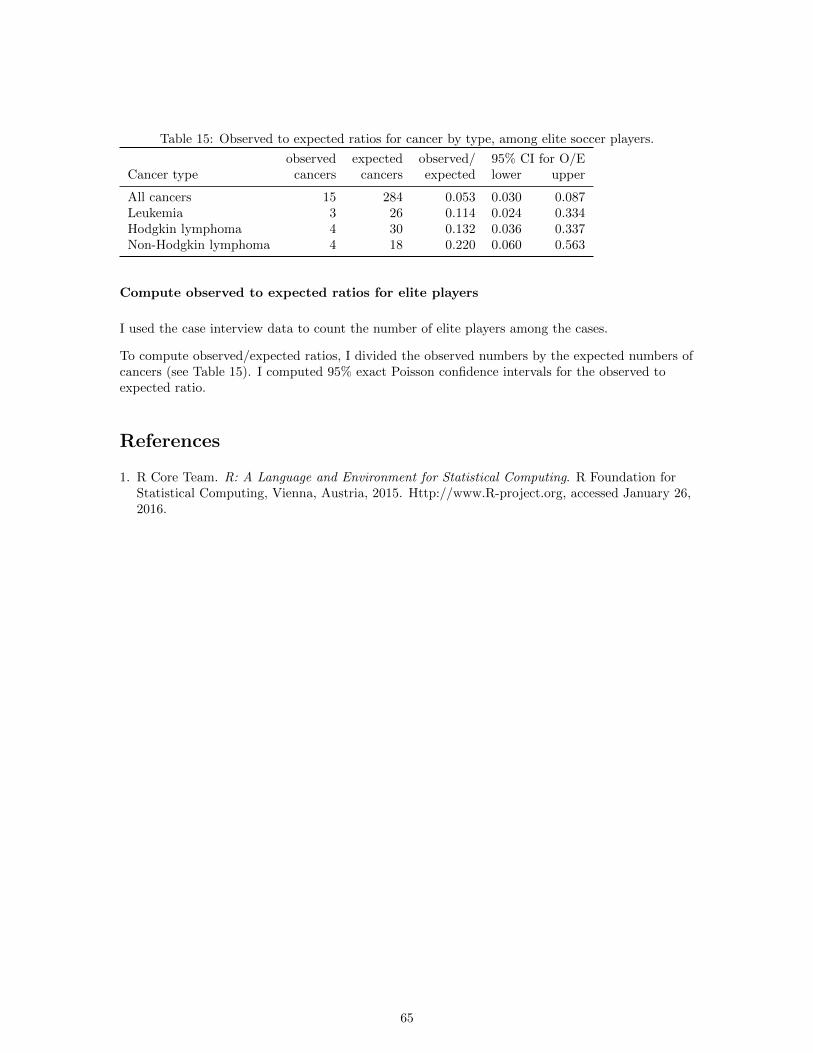
Table 15: Observed to expected ratios for cancer by type, among elite soccer players.
observed expected observed/ 95% CI for O/ECancer type cancers cancers expected lower upper
All cancers 15 284 0.053 0.030 0.087Leukemia 3 26 0.114 0.024 0.334Hodgkin lymphoma 4 30 0.132 0.036 0.337Non-Hodgkin lymphoma 4 18 0.220 0.060 0.563
Compute observed to expected ratios for elite players
I used the case interview data to count the number of elite players among the cases.
To compute observed/expected ratios, I divided the observed numbers by the expected numbers ofcancers (see Table 15). I computed 95% exact Poisson confidence intervals for the observed toexpected ratio.
References
1. R Core Team. R: A Language and Environment for Statistical Computing. R Foundation forStatistical Computing, Vienna, Austria, 2015. Http://www.R-project.org, accessed January 26,2016.
65

66

67
Appendix D: Interview Questionnaire Washington State Department of Health ID#:__________ Revised 2016 Version 4.3
Soccer Cancer Cluster Investigation Initial Inquiry Survey
Consent Form You have been invited to take part in a survey about soccer playing and a possible association with your (child’s) cancer diagnosis. The Washington State Department of Health is conducting interviews as part of a public health investigation. The University of Washington soccer coach, Amy Griffin, gave us your name and contact information. Your participation will take 30-45 minutes. Questions include asking about your (child’s) health history (and cancer diagnosis), and detailed information about playing soccer. You may find it difficult to discuss your (child’s) diagnosis and health history, but there are no other risks to participation. You can choose not to participate. There will be no bad effects from this decision; it will not affect the healthcare or services you or your family receives. If you choose to participate in this survey, you can stop at any time and decline to answer any specific questions. Your responses will be kept confidential and your (child’s) identity will remain private. Survey forms are kept in a locked file cabinet and the information is entered onto a computer file on a secure Department of Health server with limited access. The information you provide may be shared with other investigators, but without information that could identify you (your child). There is no payment for answering the survey, but your participation is helpful in our investigation. Any report of this research that is made available to the public will not include your (child’s) name or any other information by which you (your child) could be identified. If you have questions, you can contact WA State Epidemiologist Cathy Wasserman at 1-800-525-0127. Do you wish to continue with the survey? Yes No If respondent does not want to participate, thank them for their time and verify that they have Washington State Department of Health contact information for questions or concerns.

Washington State Department of Health ID#:__________ Revised 2016
68
Section 1: Interviewer Information (Questions 1-4 to be completed before interview.) 1. Patient id: _____ 2. Date Interview Completed: ___/___/_____ MM DD YYYY 3. Interviewer Information Name: _______________________ Agency or Organization: ______________________
4. Respondent was: 1 Self 2 Parent 3 Spouse 4 Other (Specify):_____________________ 5. Before this interview, has a local, state, or federal public health representative interviewed you about your (child’s) illness? If so, how many times? : None Once Twice Other ________ Unknown Section 2: Demographic Data: I’d like to begin by asking a few questions about yourself (your child). (Can fill in information from the Washington State Cancer Registry for questions 6 and 7 and ask for verification.) 6. Date of Birth: _____/_____/_______ MM DD YYYY 7. Sex: 1 Male 2 Female
8. Are you (your child) Hispanic or Latino oirigin: 1 Yes 0 No 9 Unknown 9. How would you describe 1 White 2 Black/African American 3 American Indian/Alaska Native your (child’s) race ? 4 Asian 5 Native Hawaiian/Pacific Islander 6 Other _____________
Section 3: Clinical Information: Now I have a few questions about your (your child’s) cancer(s) diagnosis.
10. From the Washington State Cancer Registry, I understand that you (your child) was diagnoses with [Check all that apply and add diagnosis dates.]
1. Leukemia—no subtype 2. Acute lymphoid leukemia (ALL) 3. Acute myeloid leukemia (AML) 4. Chronic lymphoid leukemia (CLL) 5. Chronic myeloid leukemia (CML) 6. Leukemia—other (specify: _______________________)
7. Non-Hodgkin’s lymphoma—no subtype 8. NHL--diffuse B-cell 9. NHL—B-cell 10. NHL—T-cell 11. NHL—Other (specify: _____________________)
12. Hodgkin’s Lymphoma—no subtype 13. Classic Hodgkin’s Lymphoma 14. HL—nodular-sclerosis 15. HL—mixed-cellularity 16. HL—lymphocytic-rich 17. HL—lymphocyte-depleted 18. HL—nodular lymphocyte-predominant 19. HL—Other (specify: _____________________)
20. Other (specify _________________________________________)
11. Is this correct? 1 yes 2 no If no, note errors

Washington State Department of Health ID#:__________ Revised 2016
69
12. Have you (has your child) been diagnosed with any additional types of cancer? 1 yes 0 no If yes, collect following information
Type of cancer: _______________________________ Diagnosis date _ _ / _ _ _ _ MM YYYY Facility of diagnosis: ___________________________________________ (hospital/clinic [city, state]) Health care provider: __________________________________________ (who made diagnosis) Type of cancer: _______________________________ Diagnosis date _ _ / _ _ _ _ MM YYYY Facility of diagnosis: ___________________________________________ (hospital/clinic [city, state]) Health care provider: __________________________________________ (who made diagnosis) Type of cancer: _______________________________ Diagnosis date _ _ / _ _ _ __ MM YYYY Facility of diagnosis: ___________________________________________ (hospital/clinic [city, state])
Health care provider: __________________________________________ (who made diagnosis)
13. Have you (has your child) ever been diagnosed with any autoimmune disease? 1 Yes 0 No 9 Unknown If yes, what was the condition and date of diagnosis? __________________________________
14. Have you (has your child) ever been diagnosed with any other chronic condition? 1 Yes 0 No 9 Unknown If yes, what was the condition and date of diagnosis? _________________________________
Section 4: Personal Background Information: Now, I have a few questions about your (your child’s) personal and family health history.
15. Not counting CT or CAT scans that you (your child’s) had in diagnosing your (child’s) (first) cancer, did you (your child) ever have a CT or CAT scan? 1 Yes 0 No 9 Unknown
16. If yes, number of scans? ____ date of first scan? _ _ / _ _ _ _ MM YYYY
17. Before your (child’s) (first) cancer diagnosis, did you (your child) ever smoke cigarettes?: Yes 0 No 9 Unknown If yes, were you (your child) smoking at the time of diagnosis?: 1 Yes 2 No (former smoker)
9 Unknown

Washington State Department of Health ID#:__________ Revised 2016
70
_ _ / _ _ _ _ to _ _ / _ _ _ _ City/town______________________ State abbr. _____ MM YYYY MM YYYY
_ _ / _ _ _ _ to _ _ / _ _ _ _ City/town______________________ State abbr. _____ MM YYYY MM YYYY
_ _ / _ _ _ _ to _ _ / _ _ _ _ City/town______________________ State abbr. _____ MM YYYY MM YYYY
_ _ / _ _ _ _ to _ _ / _ _ _ _ City/town______________________ State abbr. _____ MM YYYY MM YYYY
_ _ / _ _ _ _ to _ _ / _ _ _ _ City/town______________________ State abbr. _____ MM YYYY MM YYYY
18. Were any of your (child’s) biological brothers, sisters or parents diagnosed with cancer? 1 Yes 0 No 9 Unknown
If no, do you (does your child) have brothers or sisters? 1 Yes 0 No
If yes, collect type of cancer, diagnosis date, age at diagnosis and relation to case
1 Mom 2 Dad 3 Sis 4 Bro Type MM/YYYY (diagnosis) Age at dx Relation 1 Mom 2 Dad 3 Sis 4 Bro Type MM/YYYY (diagnosis) Age at dx Relation 1 Mom 2 Dad 3 Sis 4 Bro Type MM/YYYY (diagnosis) Age at dx Relation
19. Prior to your (child’s) (first) cancer diagnosis, Were you (your child) ever diagnosed with the following:?
1 Yes 0 No 9 Unknown Hepatitis B 1 Yes 0 No 9 Unknown Human Immunodeficiency virus (HIV) 1 Yes 0 No 9 Unknown Infectious mononucleosis or Epstein-Barr virus (also known as human herpesvirus 4)
Section 5: Residence: Now, I have a question about where you (your child) lived up to the time of diagnosis. You can start with birth and work forward or with diagnosis and work backward, whichever is easiest for you.
20. Residence 1
21. Did you (your child) live anywhere else? If answered no, skip to section 6 If answered yes, complete boxes below for previous residences. Use additional residence sheet if needed.

Washington State Department of Health ID#:__________ Revised 2016
71
Section 6: Soccer Related Play:
Now, I have several questions about your (your child’s) history of playing soccer up to the time of your (child’s) (most recent) cancer diagnosis.
NOTE: See appendix for definition of different skill levels of soccer play
22. Before your (child’s) (most recent) diagnosis, did you (your child) play for a school team [check all levels that apply]? Middle School team High School Team College Team College Other
23. Before your (child’s) (most recent) diagnosis did you (your child) play for a club team? If yes, check all levels that apply
Recreational Select Premier/Elite Adult Recreational Semi Pro/Pro
24. For each level of play identified in the previous questions, I will ask more specific details. You can start with your (your child’s) level of play at your (his/her) (most recent) diagnosis and work backwards or start at your (his/her) earliest play and work forwards, whichever is easiest for you. (Use 1 box for each school, club or league at each level.)
Level of Play: _______________________ Years : _ _ _ _ to _ _ _ _ School, club or league name: __________________________________ City________________ State ___ Season: fall 1 Yes 0 No # months/year______ winter 1 Yes 0 No # months/year______ spring 1 Yes 0 No # months/year______ summer 1 Yes 0 No # months/year______ Did you (your child) play goalie? 1 yes % time ______ 0 Never Name/location of practice field(s): __________________________________ City _________________ State ____ Name/location of practice field(s): _____________ ______________ City _________________ State ____ Did you (your child) practice on artificial turf? 0 No 9 Unsure/Don’t know Yes 1 crumb rubber 2 astroturf 3 red rock 4 other 5 unknown If yes, state as a percentage (%) or season(s) _________ Percentage indoors ______ Did you (your child) play matches on artificial turf? 0 No 9 Unsure/Don’t know Yes 1 crumb rubber 2 astroturf 3 red rock 4 other 5 unknown If yes, state as a percentage (%) or season(s) _________ Percentage indoors ______

Washington State Department of Health ID#:__________ Revised 2016
72
Section 6: Soccer Related Play Continued
Level of Play: _______________________ Years : _ _ _ _ to _ _ _ _ School, club or league name: __________________________________ City________________ State ___ Season: fall 1 Yes 0 No # months/year______ winter 1 Yes 0 No # months/year______ spring 1 Yes 0 No # months/year______ summer 1 Yes 0 No # months/year______ Did you (your child) play goalie? 1 yes % time ______ 0 Never Name/location of practice field(s): __________________________________ City _________________ State ____ Name/location of practice field(s): ______ _____________________ City _________________ State ____ Did you (your child) practice on artificial turf? 0 No 9 Unsure/Don’t know Yes 1 crumb rubber 2 astroturf 3 red rock 4 other 5 unknown If yes, state as a percentage (%) or season(s) _________ Percentage indoors ______ Did you (your child) play matches on artificial turf? 0 No 9 Unsure/Don’t know Yes 1 crumb rubber 2 astroturf 3 red rock 4 other 5 unknown If yes, state as a percentage (%) or season(s) _________ Percentage indoors ______ Level of Play: _______________________ Years : _ _ _ _ to _ _ _ _ School, club or league name: __________________________________ City________________ State ___ Season: fall 1 Yes 0 No # months/year______ winter 1 Yes 0 No # months/year______ spring 1 Yes 0 No # months/year______ summer 1 Yes 0 No # months/year______ Did you (your child) play goalie? 1 yes % time ______ 0 Never Name/location of practice field(s): __________________________________ City _________________ State ____ Name/location of practice field(s): ______ _____________________ City _________________ State ___ Did you (your child) practice on artificial turf? 0 No 9 Unsure/Don’t know Yes 1 crumb rubber 2 astroturf 3 red rock 4 other 5 unknown If yes, state as a percentage (%) or season(s) _________ Percentage indoors ______ Did you (your child) play matches on artificial turf? 0 No 9 Unsure/Don’t know
Yes 1 crumb rubber 2 astroturf 3 red rock 4 other 5 unknown
If yes, state as a percentage (%) or season(s) _________ Percentage indoors ______

Washington State Department of Health ID#:__________ Revised 2016
73
Section 6: Soccer Related Play Continued
Level of Play: _______________________ Years : _ _ _ _ to _ _ _ _ School, club or league name: __________________________________ City________________ State ___ Season: fall 1 Yes 0 No # months/year______ winter 1 Yes 0 No # months/year______ spring 1 Yes 0 No # months/year______ summer 1 Yes 0 No # months/year______ Did you (your child) play goalie? 1 yes % time ______ 0 Never Name/location of practice field(s): __________________________________ City _________________ State ____ Name/location of practice field(s): ______ _____________________ City _________________ State ____ Did you (your child) practice on artificial turf? 0 No 9 Unsure/Don’t know Yes 1 crumb rubber 2 astroturf 3 red rock 4 other 5 unknown If yes, state as a percentage (%) or season(s) _________ Percentage indoors ______ Did you (your child) play matches on artificial turf? 0 No 9 Unsure/Don’t know Yes 1 crumb rubber 2 astroturf 3 red rock 4 other 5 unknown If yes, state as a percentage (%) or season(s) _________ Percentage indoors ______ Level of Play: _______________________ Years : _ _ _ _ to _ _ _ _ School, club or league name: __________________________________ City________________ State ___ Season: fall 1 Yes 0 No # months/year______ winter 1 Yes 0 No # months/year______ spring 1 Yes 0 No # months/year______ summer 1 Yes 0 No # months/year______ Did you (your child) play goalie? 1 yes % time ______ 0 Never Name/location of practice field(s): __________________________________ City _________________ State ____ Name/location of practice field(s): ______ _____________________ City _________________ State ___ Did you (your child) practice on artificial turf? 0 No 9 Unsure/Don’t know Yes 1 crumb rubber 2 astroturf 3 red rock 4 other 5 unknown If yes, state as a percentage (%) or season(s) _________ Percentage indoors ______ Did you (your child) play matches on artificial turf? 0 No 9 Unsure/Don’t know
Yes 1 crumb rubber 2 astroturf 3 red rock 4 other 5 unknown
If yes, state as a percentage (%) or season(s) _________ Percentage indoors ______

Washington State Department of Health ID#:__________ Revised 2016
74
Section 7 : Sports played other than soccer:
Now, I have some questions about your (child’s) history of playing sports other than soccer before your (child’s) most recent cancer diagnosis. We are interested in sports that you (your child) played at least 12 times a year.
25. What sports did you (your child) play [may list more than one]? _______________________________________
26. Were any of these sports played on artificial turf? 1 Yes 2 No 3 Unknown For each sport played on artificial; turf collect the following
Sport: _____________ percent on artificial turf ______ turf type 1 crumb rubber 2 astroturf 3 red rock 4 other 5 unknown
Field name, city, state_______________________________________________ Dates _ _ _ _ to _ _ _ _ Y Y Y Y Y Y Y Y
Sport: _____________ percent on artificial turf ______ turf type 1 crumb rubber 2 astroturf 3 red rock 4 other 5 unknown
Field name, city, state_______________________________________________ Dates _ _ _ _ to _ _ _ _ Y Y Y Y Y Y Y Y
27. Is there any other information that we did not ask about that you want to share (e.g. something relating to your cancer diagnosis)?
In the unlikely event that the Washington State Department of Health would like to contact you again, can we call you at the number I called today?
Yes No
It will take a while to collect and analyze the information and develop a report. We hope to have a completed report by the end of the year. Are you interested in being kept updated: Yes No
If yes, collect current mailing address
If you have questions or further information you want to share, you can contact me or WA State epidemiologist Cathy Wasserman whose contact information was in the original letter you received. (If asked for Cathy’s contact give: 1-800-525-0127. Thank you again for your time and willingness to participate.

Washington State Department of Health ID#:__________ Revised 2016
75
APPENDIX:
Definitions
Recreational (soccer): Typically practices begin in the summer with play starting in the fall months with the season complete by the end of the calendar year. Coaches are required to play all players 50% of the games and are not chosen to participate based on soccer ability. Teams sometimes do 1 or 2 tournaments in the summer as training for the season starting the first weekend in September.
Select (soccer): In between recreational and premier soccer in terms of commitment and competition level. Select level players often participate in other sports. Attendance is not as strict and players typically paly 7-9 months of the year. Select teams often participate in 2 or 3 summer tournaments and then play their regular season in the fall, which can lead to tournament play in January and February each year.
Premier/Elite (soccer): Highest level of play with the most commitment from players, parents, and coaches. Premier players generally focus on soccer as their number 1 sport interest with many only playing soccer. Premier teams practice and play year round (which includes numerous tournaments, both indoor and outdoor soccer leagues).

76

77
Appendix E. Computations for Elements of History of Soccer Play The interviewer used a semi-structured approach to obtain information on soccer play. This approach allowed participants to report information in the way they most easily remembered it, rather than requiring them to make computations during the interview. For example, participants often remembered ages or grades in school, rather than calendar years, of playing Washington Youth Soccer (WYS)-defined recreational, select or premier soccer. As another example, some participants reported percentages of play on artificial turf at each field and number of years of play at that field for a given WYS-defined level, rather than providing an overall percentage of play on artificial turf. Thus, as needed, for each type of play, the interviewer assigned ages or years of beginning play and number of years played. For each type of play, interviewer also computed as needed the average number of months of play per year and the average percentages of time spent playing goalkeeper, playing on grass or dirt, outdoor artificial turf and indoor artificial turf. Assigning ages and years of play. While many interview responses required assigning ages at beginning play and years of play, in some instances, these assignments required using one or more of the following conventions:
· Children enter kindergarten at age five. · The soccer season begins in late August or early September. · A player needed to be a given age by September 15 of a given year. For example, a
person who reported starting soccer play at age 10 and was born September 15 or later of 2000 would be assigned a starting year of 2011, while a person who began play at 10 and was born before September 15, 2000 would have a starting year of 2010. Conversely, a person born before September 15, 2000 who reported beginning play in 2010 would be given a starting age of 10, while a player born September 15 or later 2000 would be given a starting age of nine.
· For WYS-defined levels of play and adult recreational play, we used “school years” or calendar years to calculate the number of years of play depending on the number of seasons played and whether the starting year for the next level was the same as the ending year of the previous level.
· Several participants reported starting and ending years for a given category of play, grades, ages or total years of play that resulted in unrealistic scenarios such as starting kindergarten at age three. In these instances, we adjusted the starting or ending years or the total years of play working backward from the most recent play. We used this approach, because reports of the most recent play were likely to be the most accurate especially when the most recent play occurred at the time of cancer diagnosis and was, thus, associated with specific dates, ages, and often specific grades in school.
These conventions were used only when we did not have other information. For example, if a participant provided calendar years and grades in school such that a child would have begun kindergarten at age four, we did not adjust that information or use the convention that children begin kindergarten at age five. Likewise, if someone reported starting to play soccer

78
in January, we did not use the convention that the soccer season starts in late August or September.
Computing averages. To describe a specific category of soccer play (such as, recreational, select, or premier) for each participant, we developed weighted averages for participants who reported differing percentages of time playing goalkeeper, playing on artificial turf, or playing indoors or who reported playing different numbers of seasons per year over time for a given category of play. The weights for percentages were most often weeks of play computed from the reported seasons or months of play provided in the interviews. For example, a three-month season was considered 13 weeks; a two and a half month season was counted as 10 weeks.
The following computations illustrate computing a weighted average for someone who played on artificial turf on a select team 25 percent of the time for two years when they played for nine months a year and then 95 percent of the time for three years when they played for ten months a year:
· 9 months/year for 2 years = 78 weeks (39 weeks/year x 2 years) · 10 months/year for 3 years = 129 weeks (43 weeks/year x 3 years) · Weighted average = [(78 x .25) + (129 x .95)] / (78 + 129) x 100 = 68.6
We then classified percentages in five percentage point increments. Thus, 68.6 was classified as “65 to less than 70 percent.”
For number of months of play per year, we rounded to the nearest half. For example, we rounded an average of 3.3 months of play per year to 3.5 months. For participants with minimal missing data, we used median values to replace the missing information related to soccer play for all calculations except percent of time spent playing goalkeeper beyond the recreational level. After the recreational level, most players played goalie most of the time or almost never. Thus, the median was unlikely to represent the actual time spent playing. This affected one player whose information about the percentage of time playing goalie was not included in the overall statistics.