cancer mortality among mormons · cancer mortality among mormons james e. enstrom, phd* preliminary...
TRANSCRIPT

CANCER MORTALITY AMONG MORMONS JAMES E. ENSTROM, PHD*
Preliminary results show that the 1970-72 cancer mortality rate among Cslifor- nia Mormon adults is about one-half to three-fourths that of the general California population for most cancer sites, including many sites with an un- clear etiology. Furthermore, the cancer death rate in the predominately Mormon state of Utah is about two-thirds to three-fourths of the United States rate, and the lowest in the entire country. Mormons are a large, health- conscious religious group whose Church doctrine forbids the use of tobacco, alcohol, coffee, and tea, and recommends a nutritious diet. Initial indications are that Mormons as a whole smoke and drink about half as much as the general population, and that active Mormons abstain almost completely from tobacco and alcohol. However, they appear to be fairly similar to the general white pop- ulation in other respects, such as socioeconomic status and urbanization. The significance of these findings is discussed.
Cancer 96:825-841, 1975.
ANY EPIDEMIOLOGIC STUDIES OVER THE M past 25 years"~'6-11 have shown that for each type of cancer there is a large, often 10-fold or more, variation in incidence and death rates throughout the world. These differences are largely unexplained at this time. However, cer- tain human activities have been highly cor- related with certain cancers, most notably the strong link between cigarette smoking and lung cancer. 1 8 9 3 6 ~ 3 8 * 3 8 Previous studies have shown that nonsmokers experience substantially lower death rates than cigarette smokers from cancer as well as from other major diseases, such as cardiovascular diseases.
One particularly interesting study has focused on Seventh-day Adventists, 21-20*41 a religious group of about 450,000 U.S. members, who abstain almost completely from the use of
From the School of Public Health, University of Califor- nia, Los Angeles, C h 90024.
Supported in part by Grant IN-87C from the American Cancer Society, by a grant from the California Institute for Cancer Research, and by cancer research funds of the University of California. Computing assistance was obtained from the UCLA Health Sciences Computing Facility.
Celeste Durand Rogers Fellow in Cancer Research. The author thanks the numerous people who have been of
assistance during the course of this research, in particular Dr. James 0. hlason and Earl E. Olson of the hlormon Church, and Drs. Lester Breslow, Leona M. Libby, and Hardin B. Jones of the University of California, without whose help. encouragement, and cooperation this work would not have been possible. H e also thanks Dr. Breslow for a critical review of this paper.
Received for publication July 31, 1974.
tobacco and alcohol, and, to a lesser extent, from coffee, tea, fish, and meat. Findings as early as 1960 showed that California Adventists at least 30 years of age had mortality rates from all cancer and all causes which were 50-80% of the average California rates. 27*28 Recently com- piled deaths over the period 1958-19653s~s4 similarly indicate that all California Adventists at least 35 years of age have cancer and total mortality rates which are about 60% of the cor- responding California rates, and that lifetime Adventists have mortality rates which are about 40% of the California rates. T h e Adventist mor- tality rates might be low in part because of the fairly high socioeconomic status of Adventists, but they still demonstrate substantially lower cancer and total death rates among a well- defined group in the United States. This is note- worthy because previous studies among other religious groups, such as Protestants, Catholics, and Jews, have shown no substantial differences in their total cancer rates from those of the gen- eral population, although there are some notable variations in the rates for individual sites4'
The Mormons, another religious group which has practices similar to the Seventh-day Adven- tists in regard to smoking and drinking, are to be examined here. The Church of Jesus Christ of Latter-day Saints (more popularly known as the Mormon Church) has approximately 2.3 million members in the United States today and about 3.4 million members world wide. They are located mainly in the Rocky Mountain states,
825

826 CANCER September 1975 Vol. 36
particularly Utah, where they currently com- prise over 800,000 of the state’s 1.2 million pop- ulation. There are almost 400,000 members in C a l i f ~ r n i a . ~ ~ ~ ~ ~ There are about the same number of male and female members, and in America they are almost entirely Caucasian. They are interesting from an epidemiologic standpoint because their “Word of Wisdom” forbids the use of tobacco, alcohol, coffee, tea, and drugs, especially addictive drugs. 9*44 Also, to a lesser extent, the religion stresses a well- balanced diet, particularly the use of wholesome grains and fruits and moderation in the eating of meat.’ I t has been informally estimated that about one-half to two-thirds of Mormons adhere to essentially all of this doctrine, except in respect to diet, where Mormons are probably not too much different from the general pop- ulation. *‘ An indirect measurement of adherence is given in Table 1, which shows 1960 and 1970 per capita consumption of cigarettes,” distilled spirits (liquor),’3*’4 ~ i n e , ‘ ~ * ~ malted beverages beer),"^'^ and total absolute alcohol for Utah, California, and the United States. All the con- sumption figures are based on taxes collected
from sales and hence are only an approximation of true consumption. The figure for total ab- solute alcohol is obtained by assuming that li- quor is 50% alcohol, wine is 12%, and beer is 3.5%.” The per capita consumption in Utah is approximately 50% of that of California and the United States, and furthermore, the 1960 tobacco and 1970 alcohol and tobacco figures for Utah are the lowest in the United States. Because of their “Word of Wisdom,” one might reasonably expect Mormons to experience a low incidence of and death from various cancers, similar to that of the Adventists.
SOURCES OF INFORMATION
State Mortality Data
Some indication of Mormon cancer rates can be obtained by studying the state of Utah with its large (currently about 70%) Mormon popula- tion. Recent cancer mortality data show that Utah does indeed have very low rates. I n Table 1, a comparison of Utah with California and the United States is given, using the latest available
TABLE I . Summary Comparisons of hiortality and Tobacco and Alcohol Consumption for Utah, California. and the United States
Utah California United States
1969-7 1 crude total mortality rate per 100.000 1969-7 1 average age-adjusted total death rate per 100,000 using the 1940 standard population
white males white females
1969-71 average age-adjusted cancer death rate per 100,000 using the 1940 standard population
white males white females
1950-67 average age-adjusted cancer death rate per 100,000 using the 1960 standard population
white males white females
1950-69 average age-adjusted cancer death rate per 100,000 using the 1960 standard population
white males white females
cigarettes (packs/yr) liquor (gallons/yr) wine (gallons/yr) beer (gallons/yr) absolute alcohol (gallons/yr)
cigarettes (packs/yr) liquor (gallons/yr) wine (gallons/yr) beer (gallons/yr) absolute alcohol (gallons/yr)
1960 per capita consumption
1970 per capita consumption
66 I
787. 454.
113. 79.
132.5 102.4
133.1 102.1
69.0 0.78
8 .3 0.44
0.73
65.5 0.88
u.90
0.52 11.5
83.5
856. 492.
151. 110.
166.0 126.9
171.4 120.1
142.0 1.75 2.09
1.64 14.8
123.0 2.26 2.93
2.12 18.2
943
891. 505.
154. 107.
169.5 130.0
174.0 130.1
132.3 1.33 0.9 1
1.30 15.1
126.7 1.83 1.31
1.72 18.6

No. 3 CANCER MORTALITY AMONG MORMONS - Enshorn 827
1969-71 age-adjusted death rates from all causes and all cancer." T h e 1969-71 data in- dicate that the ratio of Utah mortality to United States mortality is as follows: for white males, 88% for all causes and 73% for all cancer; and for white females, 90% for all causes and 74% for all cancer. Also included in Table 1 are 1950-67 and 1950-69 age-adjusted total cancer death rates.'*'' These cancer rates and total mortality rates for Utah are the lowest of any state in the United States.'-"
Additional Utah cancer mortality data are presented in Table 2. Age-adjusted cancer mor- tality rates by site over the period 1950-69 are given for whites in Utah county, Utah State, and the United States." Averaged over the same period, 1950-69, Utah County, which includes Provo, was approximately 85% Mormon, Utah was approximately 70% Mormon, and the United States was approximately 0.5% Mor- m ~ n . ~ * T h e s e results show that the ratio of Utah County to United States cancer mortality is 67% for white males and 72% for white females. The Utah County rates are lower than the Utah rates
and both are lower than the United States rates for all major sites, except prostate in men and nervous system for men and women. The rates are particularly low for the buccal cavity, es- ophagus, colon, rectum, lung, and bladder in both sexes.
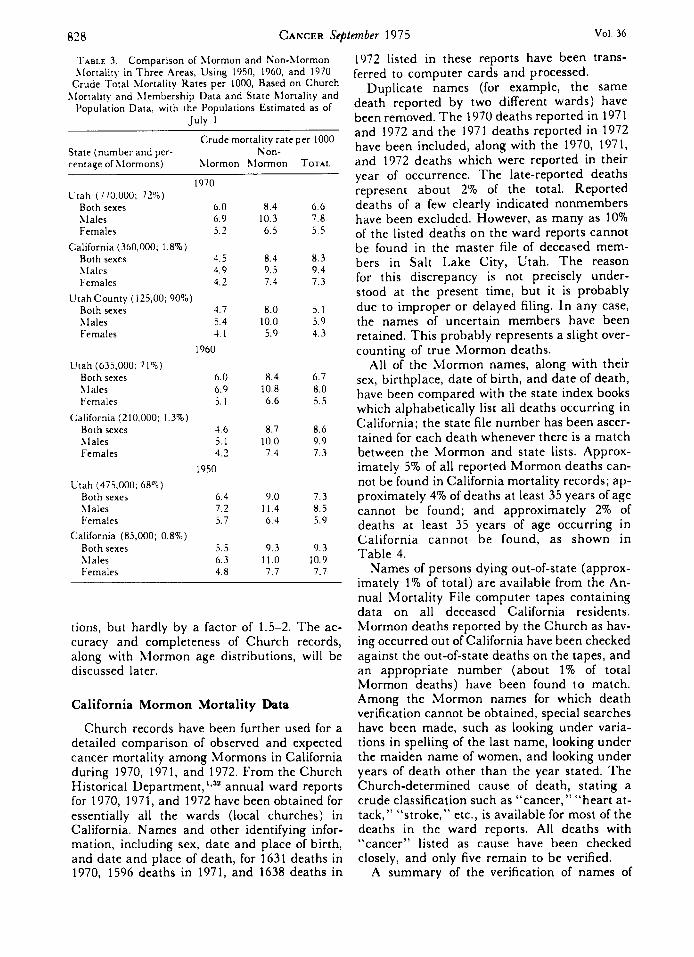
More direct data on Mormon mortality are also available. Crude total death rates have been calculated for Mormon and non-Mormon pop- ulations in each state based on Church membership and death records and state death and population data. 8*323 Table 3 shows 1970 crude death rates for three areas with large hlormon populations. The ratio of Mormon to non-Mornion crude death rates is: 71% in Utah, 59% in Utah county, and 53% in California. T o show the longtime trend of these differences, the Mormon and non-Mormon rates for Utah and California in 1950 and 1960 are also shown in Table 3; similarly low Mormon mortality rates dating as far back as 1900 have been calculated by Church officials.44 These results could be in- fluenced by differences in the age distribution between the Mormon and non-Mormon popula-
TABLE 2. Comparison of 1950-69 Average Annual Age-Adjusted Cancer Death Rates per 10l),OUU by Site for Utah County. Utah State. and the United States, Standardized to the 1960 U.S. Population
Death rate per 100,000 White males White females
I C D number Utah United Utah United Cancer site (6th revision) County Utah States County Lrtah States
Entire buccal cavity
Esophagus Stomach Large intestine (colon) Rectum Biliary passages and liver Pancreas Lung, bronchus, trachea Breast Uterine cervix Body of uterus Ovary, uterine tube.
broad ligament Prostate Bladder Kidney Nervous system All lymphomas All leukemia All other sites
All cancer
and pharynx
(not given above)
(malignant neoplasms)
( 140- 148) 2 .3 ( 15)
( 1 50) 0.7(5) ( 1 5 1 ) 10.1(65) (1 53) 0.7(63) ( 154) 4.5(29)
( 1 57) 5.2(33) (162, 163) 17.1(115)
( 1 55) 3.0(20)
( 1 70) (171) (172-174)
( 1 75) (177) 20.0( 120)
( 1 80) I . l (8) ( 193) 4.8(39)
(181) 2.9( 18)
(200, 202, 205) 3.0(23) (204) 7.0(56)
22.3( 155)
( 1 40-205) 113.7(764)
3.36
1. -56 13.43 10.89 4.28 3.37 7.93
21.98
19.71 5.11 3.00 4.58 4.47
21.30 8. 17
133.14
5. 36
4.10 15.22 16.54 7.6.5 -5.16 0.63
37.98
17.84 6.7H 3.86 4.42 4.89 8.81
25.80
174.04
0 . 3 ( 3 )
0.3(2) 5.3(40)
10.2( 76) 2.6(20) 3.4(25) 4.4(33) i . n ( i 3 )
20.7( 1.57) 4.1(3 I ) 6.0( 45 )
.5.7(42)
1.1(8) 1.4(12) 2.9(26) 1.9( 15 ) 4.8(43)
17.2( 13.5)
94.1 (726)
0.93
0.26 7.08
10.77 2.99 4. i0 4.s4 3.26
20.76 5.17 3.27
6.77
1.58 I . .53 3.29 2.81 i . 4 9
15.06
102.06
1.42
1.03 7.70
16.25 4.82 -5.34 5.83 6.29
2 5 . .i 1 7.79 6. I3
8.57
2.39 1.99 2.91 3.25 5.74
17.14
130. I 0
Averaged over the period 1950-69, Utah County was 8570 hlormon. Utah State was 70'6 Alormon, and the lrnited States
Number of cancer deaths are given in parentheses. was 0.5% hlormon.
828 CANCER September 1975 Vol. 36
TABLE 3. Comparison of Xlormon and Non-Mormon Llortality in Three Areas, Using 1950, 1960, and 1970
Crude Total Mortality Rates per 1000, Based on Church hlortality and Llembership Data and State hlortality and
Population Data, with the Populations Estimated as of Ju ly 1
Crude mortality rate per 1000 State (number and per- Non- centage of Llormons) hlormon hlormon TOTAL
1970 Ltah (770.000; 71%)
Both sexes 6.0 Llales 6.9 Females 5.2
Both sexes 4.5 Llales 4.9 Females 4.2
Both sexes 4.7 Llales 5.4 Females 4. I
California (360,000; 1.8%)
Utah County ( 125,00; 90%)
1960 L’tah (635.000; 71%)
Both sexes 6.0 LIales 6.9 Frmales 5.1
California (210.000; 1.3%) Both sexes 4.6 Llales 5.1 Females 4.2
1950 Utah (475,000: 68%)
Both sexes 6.4 Llales 7.2 Females 5.7
Both sexes 5.5 Llales 6.3 Females 4.8
California (85,000; 0.8%)
8.4 10.3 6.5
8.4 9.5 7.4
8.0 10.0 5.9
8.4 10.8 6.6
8.7 10.0 7.4
9.0 11.4 6.4
9.3 11.0 7.7
6.6 7.8 5.5
8 . 3 9.4 7.3
5.1 5.9 4.3
6.7 8.0 5.5
8.6 9.9 7.3
7.3 8.5 s.9
0.3 10.9 7.1
tions, but hardly by a factor of 1.5-2. The ac- curacy and completeness of Church records, along with Mormon age distributions, will be discussed later.
California Mormon Mortality Data
Church records have been further used for a detailed comparison of observed and expected cancer mortality among Mormons in California during 1970, 1971, and 1972. From the Church Historical Department, ‘J’ annual ward reports for 1970, 1971, and 1972 have been obtained for essentially all the wards (local churches) in California. Names and other identifying infor- mation, including sex, date and place of birth, and date and place of death, for 1631 deaths in 1970, 1596 deaths in 1971, and 1638 deaths in
1972 listed in these reports have been trans- ferred to computer cards and processed.
Duplicate names (for example, the same death reported by two different wards) have been removed. T h e 1970 deaths reported in 1971 and 1972 and the 1971 deaths reported in 1972 have been included, along with the 1970, 1971, and 1972 deaths which were reported in their year of occurrence. The late-reported deaths represent about 2% of the total. Reported deaths of a few clearly indicated nonmembers have been excluded. However, as many as 10% of the listed deaths on the ward reports cannot be found in the master file of deceased mem- bers in Salt Lake City, Utah. The reason for this discrepancy is not precisely under- stood at the present time, but it is probably due to improper or delayed filing. In any case, the names of uncertain members have been retained. This probably represents a slight over- counting of true Mormon deaths.
All of the Mormon names, along with their sex, birthplace, date of birth, and date of death, have been compared with the state index books which alphabetically list all deaths occurring in California; the state file number has been ascer- tained for each death whenever there is a match between the Mormon and state lists. Approx- imately 5% of all reported Mormon deaths can- not be found in California mortality records; ap- proximately 4% of deaths at least 35 years of age cannot be found; and approximately 2% of deaths at least 35 years of age occurring in California cannot be found, as shown in Table 4.
Names of persons dying out-of-state (approx- imately 1% of total) are available from the An- nual Mortality File computer tapes containing data on all deceased California residents. Mormon deaths reported by the Church as hav- ing occurred out of California have been checked against the out-of-state deaths on the tapes, and an appropriate number (about 1% of total Mormon deaths) have been found to match. Among the Mormon names for which death verification cannot be obtained, special searches have been made, such as looking under varia- tions in spelling of the last name, looking under the maiden name of women, and looking under years of death other than the year stated. The Church-determined cause of death, stating a crude classification such as “cancer,” “heart at- tack,” “stroke,” etc., is available for most of the deaths in the ward reports. All deaths with “cancer” listed as cause have been checked closely, and only five remain to be verified.
A summary of the verification of names of

z ?
W
TA
BL
E
4.
Ver
ific
atio
n of
Chu
rch-
Rep
orte
d 19
70,
1971
, and
197
2 C
alif
orni
a hl
orm
on D
eath
s w
ith C
alif
orni
a X
lort
ality
Rec
ords
9 1:
n
Mor
talit
y da
ta
Mal
es
Fem
ales
hl
ales
Fe
mal
es
Mal
es
Fem
ales
hl
ales
Fe
mal
es
Mal
es
Fem
ales
M
ales
Fe
mal
es
!Z
1970
19
71
1972
A
ll ag
es
2 3
5 ye
ars
All
ages
A
ll ag
es
2 3
5 ye
ars
m 2 3
5 ye
ars
7
Tot
al d
eath
s re
port
ed i
n C
hurc
h st
atis
tical
com
pila
tion
of a
ll w
ard
repo
rts
All
iden
tifie
d de
aths
(tot
al
deat
hs in
ava
ilabl
e war
d re
port
s)
All
verif
ied
deat
hs
(con
firm
ed b
y C
alif
orni
a m
orta
lity
reco
rds)
A
ll no
nver
ified
dea
ths
(not
con
firm
ed b
y C
alif
orni
a m
orta
lity
reco
rds)
Non
veri
fied
dea
ths o
ccur
ring
ou
tsid
e of
Cal
ifor
nia
Non
veri
fied
dea
ths o
c-
curr
ing
in C
alif
orni
a A
ll ve
rifie
d ca
ncer
dea
ths
All
nonv
erifi
ed “
canc
er”
deat
hs
836
837
78 1 56
46
10
135 0
794
794
755 39
22
17
150 0
-
663
640 23
17 6
121 0
-
685
654 31
18
13
145 0
859
834
784 50
32
18
130 0
794
762
722 40
19
21
154 1
-
654
627 27
14
13
I16 0
-
664
637 27
13
14
145 1
847
807
77 I 36
9 27
134 1
850
83 1
797 34
10
24
179 3
20
21
h
127
162
$ 1
3s
830 CANCER September 1975 Vol. 36
1970, 1971, and 1972 deceased California hlormons has been given in Table 4. The verified names with state file numbers have been further compared with the cancer deaths listed on the 1970, 1971, and 1972 California Annual Mortality File computer tapes to determine the site of cancer according to the International Classification of Disease (ICD) number, 8th revision. 'I'he distribution by site of the 816 (364 male and 452 female) verified cancer deaths at least 35 years of age is shown in Table 5. The 66 cancer deaths occurring under age 35 have not been included.
In order to estimate the number of cancer deaths per year expected among California Mormons, the size and age distribution of the population at risk has been estimated. The offi- cial Church total of California Mormons was 348, U37 at the end of 1969, 367,615 at the end of 1970, 367,521 at the end of 1971, and 372,938 at the end of 1972.32 A compilation of the membership statistics in the same ward reports used to obtain the deaths yielded a total Califor- nia membership of 357,492 (169,198 males and 188,294 females) as of December 31, 1970 and 362,636 (171,610 males and 191,026 females) as of December 31, 1971. The average membership for the 3-year 1970-72 period as of July 1, 1971 has thus been taken to be 360,000 (170,000 males and 190,000 females).
T h e age distribution of the California Mormon population as of July 1, 1971 is not available, because no compilation of hlormon birthdates has been previously undertaken. I t would be essentially impossible to recreate an individually identified population-at-risk, be- cause this would mean searching through 3.4 million alphabetically-filed membership cards in Salt Lake City in order to find and manually tabulate data on 360,000 California Mormons. However, during the last 2 years the Mormon Church has been computerizing its living membership file, and this process is now about 80 to 90% complete in California and Utah. The address and birthdate are among the items in- cluded in the computerized record of each member. A special compilation has been made of age-sex distributions using the computerized records of California and Utah Mormons as of July 1 , 1975.26 These data must be considered preliminary; there exist problems in assessing its accuracy. In particular, the computerized membership records may not be entirely representative of the total membership; an es- timated 20% of the computerized members are listed twice under different addresses, reflecting
a recent move from one ward to another. The raw distributions compiled by the Church have been modified by using what is known about population mobility as a function of age.'These matters are discussed in more detail later.
The July 1, 1975 modified age distribution for Utah Mormons is very young, but fairly close to the July 1, 1970 Utah state age distribution, with both having about 34% of the population at least 35 years of age and 7.5% at least 65 years of age. This is reasonable since Utah is about 70% Mormon. The July 1, 1975 modified age dis- tribution for California Mormons is extremely young, with only 33% of the members at least 35 years of age and only 5% at least 65 years of age. This is in contrast to the California state age dis- tribution of July 1, 1970, with 42% at least 35 years of age and 9% at least 65 years of age.
The expected number of cancer deaths per year among the California Mormon population is determined by multiplying the number of Mormons in each 10-year age group by the cor- responding 1970 age-specific mortality rate for each cancer site, and then summing over all age groups from 35 years of age and up.'." These numbers are then all multiplied by 3.03 to give expected mortality among California hlormons for the 3-year time period 1970-72, including a 1% increase each year in the 1971 and 1972 rates as indicated by California cancer trend^.^.^' I t should be mentioned that the cancer and total mortality rates for whites are identical to rates for everyone in California to within 1 % o . " ~ ~ " This is pointed out because California Mormons are almost all white. The observed and expected numbers of deaths among California Mormons at least 35 years of age are given in Table 5 for 18 of the most common sites, as well as for all sites of cancer and all causes. The expected number of deaths has been calculated for three underlying age distributions: the July 1, 1975 modified ditribution and the July 1, 1970 Utah and California state distributions. The state dis- tributions have been included for comparison because there are some indications that the true distribution may be closer to these, as will be shown later.
For all three assumed Mormon age distribu- tions, the ratio of observed to expected mortality is substantially less than one for the male sites of esophagus, stomach, colon, rectum, pancreas, lung, prostate, bladder, and kidney, and for the female sites of colon, lung, breast, and entire uterus. This is particularly interesting because, except for lung and esophagus, these sites have not been definitively related to specific risk fac-

21
?
W
TA
BL
E
5.
Obs
erve
d an
d Ex
pect
ed C
ance
r an
d T
otal
Dea
ths
in 1970, 1971, an
d 1972 A
mon
g C
alif
orni
a M
orm
ans
at L
east
35
Yea
rs o
f A
ge
Dea
ths
(2
35 y
ears
) M
ales
Fe
mal
es
Obs
erve
d'
Exp
ecte
d'
Obs
erve
d E
xpec
ted
ICD
num
ber
Ass
umed
age
dis
trib
utio
n A
ssum
ed
age
dist
ribu
tion
C
ance
r site
(8
th re
visi
on)
Mod
ifie
d U
tah
Cal
ifor
nia
Uta
h C
alif
orni
a hl
odif
ied
Ent
ire
bucc
al c
avity
and
pha
rynx
E
soph
agus
St
omac
h L
arge
inte
stin
e (c
olon
) R
ectu
m
Bili
ary
pass
ages
and
live
r Pa
ncre
as
Lun
g, b
ronc
hus,
trac
hea
Bre
ast
Ute
rine
cer
vix
Bod
y of
ute
rus
Ova
ry, u
teri
ne tu
be, b
road
lig
amen
t Pr
osta
te
Bla
dder
K
idne
y N
ervo
us s
yste
m
All
lym
phom
as
All
leuk
emia
A
ll ot
her s
ites (
not g
iven
abo
ve)
20.4
14.3
31.1
46.3
17.2
11.1
33.5
177.9
-
-
-
- 45.4
20.5
13.5
16.0
16.8
20.8
78.2
23.8
16.8
39.9
60.3
22.5
1 3.5
41.3
211.9
-
-
-
-
66.3
27.5
16.1
17.0
19.9
26.1
93.4
28.0
19.7
46.7
70.5
26.3
15.9
48.4
248.5
-
-
-
- 77.2
32.1
18.9
20.1
23.4
30.5
109.3
11 6 18
42
16
11
31
40
103 17
16
24 7 5 10
16
19
60
-
10.3
6.8
21.7
62.9
16.8
8.8
29.4
62.6
123.3
23.9
19.0
44.1
9.6
7.1
12.7
19.0
19.7
76.1
11.0
13.7
7.4
9.3
24.9
31.5
72.9
92.6
19.4
24.6
10.0
12.6
33.8
42.8
65.8
81.7
129.6
161.0
24.7
30.5
21.4
27.0
46.9
58.4
11.7
15.0
8.1
10.2
13.0
16.0
21. I
26.5
22. I
27.9
85.6
107.6
~ -
i n
m
s 2 0 z R z E z, 0
0
All
canc
er (
mal
igna
nt n
eopl
asm
s)
(140-209)
364
563.0
696.3
815.5
452
573.8
629.4
788.9
All
caus
es (
all v
erifi
ed d
eath
s)
1893
2867.1
3628.0
4246.2
1978
2572.3
3019.7
3854.6
All
caus
es (
all i
dent
ifie
d de
aths
) 1969
2867.1
3628.0
4246.2
2067
2572.3
3019.7
3854.6
h
a O
bser
ved
deat
hs (235 y
ears
) re
pres
ent
the
num
ber
of c
onfi
rmed
dea
ths
occu
rrin
g am
ong
Cal
ifor
nia
Mor
mon
s du
ring
1970, 1971, an
d 1972 b
ased
upo
n th
e na
mes
of
de- 3
ceas
ed f
ound
in
the
war
d re
port
s, a
s su
mm
ariz
ed i
n T
able
4.
' Exp
ecte
d de
aths
(235
year
s) r
epre
sent
the
num
ber
of d
eath
s w
hich
wou
ld o
ccur
in 3
year
s am
ong
the J
uly
I, 1971
Cal
ifor
nia
Mor
mon
pop
ulat
ion (170,OoO m
ales
and
190,000
fem
ales
) if
it h
ad t
he a
ge-s
peci
fic c
ance
r m
orta
lity
rate
s of
all
Cal
ifor
nian
s. T
hree
age
dis
trib
utio
ns h
ave
been
ass
umed
for
the
Cal
ifor
nia
Mor
mon
pop
ulat
ions
: th
e Ju
ly
I,
1975 m
odif
ied
dist
ribu
tion
desc
ribe
d in
the
text
, the
July
I, 1970 U
tah
Stat
e di
stri
butio
n, a
nd t
he Ju
ly
I, 1970
Cal
ifor
nia
Stat
e di
stri
butio
n.

832 CANCER September 1975 Vol. 36
tors. The ratio is less than 1 to a very high degree of statistical significance (p << .001) for all cancer sites and for all causes of death. It is not meaningful to discuss the statistical signifi- cance of differences for individual sites because of the uncertainty in the underlying age dis- tribution.
In order to provide additional detail, the 1970-72 California Mormon age-specific cancer death rates are presented in Table 6, assuming the modified age distribution. They are com- pared with the 1969-71 Utah, 1970 California, and 1970 United States age-specific rates. The United States data are for whites, and the California Mormon, Utah, and California are essentially for whites, because they are un- changed by their nonwhite component. The California Mormon rates do not differ much from the Utah rates; however, they would be substantially lower if either the Utah or Califor- nia age distribution were assumed.
Furthermore, the age-specific rates and observed-to-expected ratios for a number of sites should drop even lower when only nonsmoking and nondrinking Mormons are analyzed. For in- stance, previous s t ~ d i e s ” * ~ ’ ~ ~ ~ have shown that nonsmokers have only about 20% of the lung cancer deaths expected among the general pop- ulation, much lower than the 45-6070 observed for all hlormons in Table 5. The data in Table 5 for California Alormons are generally consistent
with the low Utah County and Utah State cancer rates given in Table 2, and in fact are higher than the Utah County data if the modified age distribution is assumed. The only notable discrepancy is the male prostate cancer rate, which is low in California, but slightly above the national average in Utah.
Alameda County Data
Independent data on Mormons come from the results of a 1965 “Health and Ways of Living” survey and subsequent followup of a probability sample of 6928 adult residents of Alameda County, California, conducted by the Human Population Laboratory of the California State Department of Public Health (now called Department of Health). 2 * 3 . 2 1 9 2 3 Included in the survey were 111 hlormons. They have been compared with the total sample for Alameda County in Table 7. The Mormons comprised 111/6928 = 1.6% of this adult sample, which was their percentage in the total population as estimated from the available 1965 Alameda County ward statistics, namely 16,000/ 1,020,000 = 1.61. Furthermore, the 1965 results showed that Alameda County hlormons had an age distribution which was similar to that of other citizens; that 67% of the male Mormons and 76% of the female Xlormons did not smoke, compared with 51% of the men and 60% of the
TABLE 6. Age-Specific Cancer Death Rates per 100,000 for California hlormons Assuming the hlodified Age Distribution. Compared with Rates for L’tah. California, and the United States
hlales Females 1970-72 1970-72
California California 5 1 orrnon hlorrnon
death rates 1970 death rates 1970 (assuming the 1969-71 I970 United (assuming the 1961-71 I970 United
;\ge modified age Utah death California States white modified age 1:tah death California States white (years) distribution) rates death rates death rates distribution) rates death rates death rates
35-44 35.5 31.3 51.7 50. 1 70.7 41.1 68.3 62.4 45-54 83.7 103.8 166.0 172.0 110.6 115.3 186.1 177.3 5.5-64 325.9 328.9 480.6 498. I 209.3 257.1 3.59.2 338.6 65-74 680.0 804.3 002.9 097.0 420.6 429.2 575.5 554.7
1080.3 1299.5 I61 1.2 1502.7 702.3 682.9 900.2 903.5 .‘>-R4 85+ 1351.4 1303.9 I 90 1 .8 1772.2 I 188.0 740.7 1 154.0 1126.6
- -
T i n ’ A L (3643 (1566) (15,387) (155,360) (452) (1243) (13,739) (131,826) cancer deaths 2 3.5
All the rates can be considered representative for &hires. because nonwhites do not significantly alter the California llorrnon. Iltah. or California rates.

No. 3 CANCER MORTALITY AMONG MORMONS . Enstrom 833
women in the total sample; and that 46% of the male Mormons and 59% of the female Mormons did not drink, compared with 1690 of the men and 29% of the women in the total sample. Surveys of the United States showed that among the 1966population at least 17 years ofage, 51% of the males and 68% of the females did not smoke, 38 and that among the 1965 population at least 21 years of age, 23% of the males and 40% of the females did not drink." Table 7 shows that the differences in habits between Mormons and the total sample are concentrated among Mormon "every week" church attenders, almost 100% of whom do not smoke or drink. About 42% of the Mormons regularly attend services
every week. Infrequent church attenders among the Mormons tend to smoke and drink as the general population. Additional results from the study showed that Mormons are similar to the total sample in most other respects, including socioeconomic status, as measured by amount of education and amount of income, and health care as measured by frequency of dental checkups, frequency of medical checkups, and number of visits to the doctor. Finally, the results showed that during the 6%-year fol- lowup period, 3.6% of the Mormons died, as compared with 6.5% of the total sample. In other words, the hlormons have had 55% of the mortality rate of the total sample. Furthermore,
TABLE 7. Results from the 1965 "Health and M'ays of Living" Survey Conducted by the Human Population 1,aboratory. California State Department of Public Health of a Probability Sarnplr from :\lameda <:outit\ ol f102H 'l'otal
Persons, Including 1 1 1 hlormons (48 Llales and 63 Fenialrs) ~~ ~~
Both sexes hlales tc.n1alrs "Every "Evcry "l-very week" week" \ \ C c . k "
TOTAL hlormons hlormons TOTAI. hlormons hlornions 1 . 0 . r ~ .\lomion* Alornioti\
Age distribution 10-29 23.7% 32.5% (25) 22.5°fi 16.87, ( H ) 74.O";m 27.0% (17) 30-44 33.0 34.2 (38) 33.8 42.7 (20) 3ll.H 28.6 (18) 45-64 31.4 30.7 ( 3 4 ) 32.4 30.2 ( 1 7 ) 30.5 27.0 (17) 6.5-99 12.9 13.6 (14) 11.4 6.3 ( 3 ) 14.1 17.5 ( 1 1 ) TOTAL (6928) ( 1 1 1 ) (3133) (48) (37711) (63)
Percentaye mortality after 6 ' 2 years' followup
Cigarette smoking distribution
6..54: (449) 3.6% ( 4 ) 0% (0) 7hob (2391 4.1% (2) O'?, ((1) 5.6% (7IO) 3.2";5 ( 2 ) ( 1 % (0 )
Never smoked 79.1% 37.5"b (IHI 04.H";> (13)' 47.0"u f17.0"A ( 3 0 ) X6.')";& (241' Formerly smoked 21 .1 27.1 (131 31.6 (01 11.2 11 .2 ( 7 ) 7.4 ( 2 ) N o u smoke 49.2 33.3 ( 1 6 ) o.o ( ( I ) $ 30.7 2 3 . 6 ( I S ) ' O.(I ( 0 ) 5
L'nknown ( 1 1 ((1) ( 2 ) ( 1 ) Drinking quantity distribution
Never drink 15.7% 4.5.') (22)8 IO(l'5i ( 1 0 ) s 36.X";, SH.-";) ( 7 ) s t(X.O"b ( 2 4 ) s 1-2 drinks at a time 40,6 27.1 (13)' 0.1) 1 1 ) ) s 5 .5 .C 2H.0 ( 1 8 ) l i i . i (31s 3 - j drinks at a time 24 .3 18.7 ( 9 ) 0.11 (0 ) ' 17.0 0 . 0 ( 0 ) 11.(1 (0)' j+ drinks at a time l ( 1 . I 0 .3 ( 3 ) 0 . l I ( 0 ) 2.0 3 . 2 ( 7 ) (1.0 ( 0 ) Lhknown ( 1 ) (0) (0) ( 0 )
Drinking frequency distribution
Never drink l S . 7 5 45.940 ( 2 2 ) s I O I I U b ( 1 0 1 ~ 2H.x";, 3u,7";, (37)s XH.O"<> ( 2 4 ) s < I times a week 20.6 22.5, I l l ) (1.0 ( 0 1 ' 3O.O 72.2 ( I 4 ) ' l l . l ( 3 ) ' 1-3 times a week 24.7 1 4 . 6 ( 7 1 O . ( l ~ I l ) ' I ,7 14.3 ( 9 ) I I . 0 (0)' >2 times a wrek 30.1 16.7 (8). II.0 [ ( I ) ' I , o 4.x ( 3 ) ' 0.0 (0) ' C n k n o w n (01 10) I 0 1 (01 TOIAI. (31.581 (481 (1 ' ) ) (37711) (031 ( 2 7 )
The sample includes the tioninstitutional adult popular ion of a t least 2 0 years of aqr . plus 47 married p c r ~ n ~ 1)ctcvcrti I6 and 19 years of age. Comparisons are made between the total sample. a11 I I I hlormonr. atid 4 6 A l ~ i r i i i o i i ~ nlio attend church every week. For each cell. the percentaqe of persons is always qiven a n d lor rhr Alormons tlir ncrrnIrc*r of persons is included in parentheses. The percentages \*.here hlormons i r e statistically difl'rrcnt from the to t ; i I are inilir-iited as follocvs: ' 11 < .Oj. I p < .01, 5 p < .001. assuming Poisson variation.

834 CANCER Sektember 1975 Vol. 36
not a single one of the 46 regular church- attending Mormons in the sample died during the 6 Yz-year followup period. Because of the small number of Mormons involved, the mor- tality differences are not statistically significant, but it is useful to note that they are consistent with the differences between Mormon and non- Mormon crude mortality rates shown in Table 3.
Estimates made for Mormons in Los Angeles County indicate that about 40% of the members are very active and attend church regularly, about 20% are moderately active and attend church fairly often, and about 40% are inactive and almost never attend church. ’‘ Essentially all the active members abstain from tobacco, alcohol, coffee and tea. These estimates are similar to the Alameda County results.
POSSIBLE SYSTEMATIC ERRORS
In order to have confidence in the validity of these results, i t is important to understand all the possible sources of systematic error, in addi- tion to the statistical error which has been dis- cussed. The most probable sources of error are inaccuracy and incompleteness of the reporting of either Mormon deaths or membership figures and the age distribution of the Mormon popula- tion.
Record Keeping System
The Mormon Church places emphasis on genealogy because of its strong belief in the im- portance of the family, both present and former generations. This gives rise to one of the most extensive record keeping systems in existence. The Church clerks throughout the world, in- cluding the clerks for the approximately 850 in- dividual California wards, are instructed to file complete and accurate records in their annual ward report, including membership data and deaths.” Both the bishop and the clerk of each ward must sign that their ward report is com- plete and accurate before mailing it to Salt Lake City. I t is from these ward data that Church summary statistics are compiled and upon which the hslormon mortality rates in this paper are based.
A single ward clerk keeps an up-to-date record of membership, as well as missionaries, marriages, births, blessings, baptisms, ordina-
tions, divorces, and deaths among the members of his ward. Each ward clerk is given explicit in- structions from Church headquarters on how to complete a “Certificate of Membership” for each new ward member. lo Members include all children, adults, and converts above 8 years of age who are baptized, as well as unbaptized children of adult members. Unbaptized children are removed from membership upon reaching 21 years of age. One copy of the membership record is retained in the ward and another copy is forwarded to the Membership Department at Mormon Church headquarters in Salt Lake City. When a member moves out of the area of a ward, the membership record for that person is sent to Salt Lake City and then forwarded to the ward for the area to which the person moved.
Membership records in each ward are kept up to date by the ward clerk on a very regular b a ~ i s . ~ ‘ . ~ ~ Each ward has several members who serve as “home teachers;” these home teachers try to make a house call on all the other members in the ward once a month. Depending on the ward and the time of the year, they are usually able to make personal contact with 50-90% of the members in any given month. Those members who cannot be reached in person are phoned; if they still cannot be reached, then letters of concern are mailed to them. Address corrections are requested on these letters; if the members have moved the ward clerk will know very promptly. There is usually a small percentage of inactive members in each ward, not more than 10% of the total membership, who never want to be visited by the home teachers. These people are visited on an annual basis by the ward bishop. Thus it is highly unlikely that inactive members will re- main on the membership list of a given ward if they have moved, died, or otherwise left the ward.
Since the members of a ward are usually quite familiar with one another, most events, such as deaths, are reported to the ward clerk almost immediately, especially among active members. Such occurrences among very inactive members may take somewhat longer to be reported, but usually friends of the inactive member will learn of the event and report it to the ward clerk, if it has not already been ascer- tained by the normal monthly contact procedures. I n addition, ward clerks sometimes report the deaths of former members who moved to a new ward shortly before they died or of non- members who were related to members. These

No. 3 CANCER MORTALITY AMONG MORMONS . Enstrom 835
procedures are the same for each ward of the Mormon Church throughout the world.
Accuracy
A check on the accuracy of the membership data in California and Utah as reported in Church records is available to some extent. In Alameda County, the 1965 sample survey of the Human Population Laboratory showed that the percentage of Mormons in the total population was the same as the percentage obtained from the Church statistics, namely l.6%, as men- tioned earlier. From the 1970 Utah County ward reports, the membership statistics and deaths have been processed and tabulated. T h e membership statistics show that the county was 90% Mormon (125,000 out of 139,000) as of July 1, 1970. The age and sex distributions of the deaths, which were not verified with state records, show a number of deaths close to but not exceeding the county total in each 5-year age group. This indicates that in an area which is known to be almost entirely Mormon, the Church membership and death statistics are consistent with census and mortality records ob- tained independently of the Church. Specifical- ly, there is no obvious overcounting of membership statistics and there are no noticeable errors in the recording of deaths. Finally, a historical indication of the accuracy of Church membership figures is given by the last Bureau of the Census survey of religious groups in 1936.’ This special census collected membership data from individual churches and then compiled them by denomination. I t showed that in 1936 there were 34,623 Mormons in California and 336,184 Mormons in Utah, in agreement with official Church membership figures of 35,585 and 333,472, respectively.
A check on the accuracy of the mortality data, i.e. the extent to which Church-reported deaths are consistent with external records, comes from the fact that among 4036 Church-reported deceased Mormons at least 35 years of age, sum- marized in Table 3, 3871 or 96% have been con- firmed as valid deaths in California Annual Mortality Files for 1970-72. The remaining 165 names have not been initially confirmed as valid deaths, but it appears from Church data that only 88 of these deaths occurred in California. T h e persons who died out-of-state were probably not California residents at the time of their death. Also, there may have been some er-
rors or omissions in the California mortality records. Further checking is necessary in order to determine the exact status of the 165 un- confirmed names, but the fact that there is already a 96% matching shows the high quality of the Church data.
Completeness
Equally important to accuracy is the extent to which Church-reported deaths are complete. This is the most obvious possible source of systematic error giving rise to falsely low death rates. A first check on the completeness of the mortality records comes from the characteristics of the membership lists. From Table 3 i t can be seen that the Mormons in Utah and California have experienced substantially lower mortality rates than the general population for decades. If this lower mortality was largely due to the un- der-reporting of deaths, then the membership lists which are kept by each ward and by the Church headquarters would by this time con- tain the names of a substantial number of “lost,” actually deceased persons. This is an unlikely possibility, because the membership lists are kept up-to-date almost continuously. Because of the contact of the home teachers, ward clerks, and ward bishops with all the mem- bers, using techniques discussed earlier, the whereabouts and status of most of the mem- bers are well known. However, for the members whose exact location is uncertain, the Church maintains a “lost and unknown” category, which is completely separate and distinct from the membership and mortality records of the known members. ”
A second check on completeness is the fact that the Mormon mortality rate is consistently lower than the general mortality rate throughout California. To demonstrate this, California has been broken into 23 groups of one or more coun- ties each, and the 1970 crude mortality rate has been calculated for Mormons3’ and the total population’ in each group. If the ward death reporting system were randomly incomplete and the death rates among Mormons and the rest of the population actually were equal, then the mortality ratio of Mormons to total population for the county groups should vary from 0 (no reporting) to 1 (complete reporting). However, what is observed, as given in Table 8, is that the ratio is very narrowly distributed about a weighted mean of 0.53 with a weighted standard

836 CANCER September 1975 Vol. 36
T.ABLE 8. 1970 Distribution of Population and 1970 Crude Mortality Rates for hlormons and the l 'otal Popularion in Various County Groups in California
hlormon population Crude death rate per 1000 Percent Ratio
County group Number Percent urban hlormon TOTAI (9.5% conf. limits)
Alameda Butte + Colusa +Glenn
Contra Costa Fresno + Kings + .\ladera
+ Sutter + Yuba
+ Slariposa + hlerced + Tulare
Humbolt + Del Norte Kern + Inyo Los .Angeles .\larin Slonterey + San Benito + Orange Placer + Eldorado + Nevada Riverside Sacramento + Yo10 San Bernardino San Diego San Francisco San,Joaquin + Amador +
Stanislaus + Tuolumne San Luis Obispo San .\late0 Santa Clara Shasta + Siskiyou + Tehama Sonoma + Lake + llendocino
i'entura + Santa Barbara
Santa Cruz
+ Napa + Solano
State
19,439
6.073 12,092
9,864 2.237 5.908
114.589 3,34 I
4,571 31.681
7,185 9,361
15,736 15,639 23,054
4,954
2,001 8,618
6,963 22,973 4.125
8,566
357.492 14,099
1 .8?0
2.8 2.2
1.2 2.0 1.7 1.7 1.6
1.2 2.2 4.9 2.1 2.2 2.3 1.7 0.7
1.7 1.9 I .3 2.2 3.0
1.7 2.2 1.8
99%
59 94
63 46 77 99 92
73 99 37 79 92 89 94
100
70 75 98 0 H 41
66 90 9 I
4.9
5.4 3.7
5 . 3 3.0 4 . 9 j . 2 3.2
4.2 3.0 3.2 4.1 5.4 4. I j .0 6.6
3.7 j . 8 5.2 2.0 5.4
4 .3 3.0 4.4
H.7
9.H 6.9
H.7 9,s 9.9 H. H 7 . I
9. I 6.11
10.0 9.9 7.6 H.3 7.4
12.5
0 . 2 0.7 7. I 5.H 0 . 9
9.7 0, i H.3
.S6 (.46-.6H)
.iS (.311-.77)
.54 (.30-.72)
.61 (.46-.HO)
.32 (, 13-.66) .49 (.33-.7(1) . -59 (. 54 -. 04 ) * .4s (.22-.HI)
.46 (.2H-.71)
..SO (.4L-.6l)
.32 (.21-.4H)
.41 (.20-..56)
.71 (.57-.UH)'
.19 (.38-.63)
.6H (.i7-.H2)*
. i 3 (.37-.74)
.40 (.28-.56)
.60 (.SI-l.(15)'
.73 ( .SZ-I .O( l ) '
.55 (.35-.83)
.34 (.25-.45)*
.44 (.31-.60)
.40 (.33-.62)
.53 (.SO-.SO)
9.i% confidence limits do not encompass the state ratio of .53. ' 9 5 1 confidence limits encompass the ratio of 1 .OO.
deviation of 0.10, with a minimum of 0.32 and a maximum of 0.73. Total population of each group was the weighting factor. For only 2 groups is the ratio consistent with 1 to the 95% confidence level (p < .05); both of these groups are very small and there is large statistical error. All but 4 groups are consistent with the state ratio of 0.53; the small fluctuations which exist in the 4 groups may be due either to differences in the underlying age distributions or in the ac- tual mortality rates. If the consistently low mor- tality ratio throughout the state is not genuine, then it could only occur in this manner if all of the wards were systematically reporting only about one-half of their deaths. No evidence for such systematic under-reporting has yet been uncovered.
A third check on the completeness of Mormon mortality records comes from the Los Angeles
County Cancer Surveillance Program of the University of Southern California. This program began in 1972 and now receives reports on essentially all of the diagnosed cancer cases in Los Angeles County, excluding cervix in situ and nonmelanomic skin cancer cases. Approx- imately 50 Los Angeles County Mormons who were both incident and fatal cancer cases in 1972 have been found in the records of both the Cancer Surveillance Program and the Mormon Church. A search of all the cancer cases iden- tified as "Mormon" in the files of the Cancer Surveillance Program yielded not one name of an actual Mormon Church member who died in 1972 beyond the names already known to the Church. This is, of course, only a partial check on completeness of mortality data, because the Cancer Surveillance Program records only inci- dent cancer cases and then finds deaths just

No. 3 CANCER MORTALITY AMONG MORMONS Enstsorn 837
among these incident cases. In any case, this check is a reasonable indication that the Mormon mortality records are not grossly in- complete and, in fact, it tends to show that they may be quite thorough.
A fourth check on completeness is indicated by the consistency between Utah County and Utah State cancer mortality rates in Table 2, the California Mormon cancer deaths in Table 5, and the age-specific rates in Table 6. Generally the California-Mormon to total-California cancer mortality ratio is about the same as the Utah County (85% Mormon) to United States (0.5% Mormon) cancer mortality ratio. For all cancer, assuming the modified age distri- bution, the California ratio is 0.65 for males and 0.79 for females, and the Utah County to United States ratio is 0.65 for males and 0.72 for females. The California and Utah data are not directly comparable because they cover different time periods and different geographical re- gions. But they suggest that Mormons do in- deed have lower mortality rates than the general population for most cancer sites, and that the Church records for California yield results which are similar to Church-independent results for Utah and Utah County.
Finally, Table 3 shows that the Church- determined 1970 Mormon crude mortality rate in Utah (6.0 per 1000) is only 9% less than the crude rate for the entire state (6.6 per lOOO), as determined from state population and mortality data. Furthermore, the 1970 Mormon crude mortality rate in Utah County (4.7 per 1000) is only 8% less than the crude rate for the entire county (5.1 per 1000). Thus if the Mormon and non-Mormon rates were actually the same in Utah, the Church under-reporting of deaths would be no more than about lo%, since there appears to be no major difference between the Mormon and total age distributions in Utah. This could be considered as a reasonable upper limit on under-reporting. More exhaustive checks are necessary, particularly following an individually identified Mormon population at risk, but based on the available evidence there is no indication that the Mormon membership or mortality records are inaccurate or incomplete to any substantial degree.
Age Distributions
The next important aspect is the age distribu- tion of the California Mormon population. Data
presented in Table 7 show that the Mormons in the I965 Alameda County study have the same age distribution as the total population, but this small sample is not necessarily representative of all California Mormons in 197 1. The .1975 com- puterized Mormon membership file indicates that the modified age distribution is more cor- rect. However, this distribution may not be com- pletely accurate either because the entire membership is not computerized. Furthermore, there may have been some changes in California Mormon age distribution between 1971 and 1975. Also, about 20% of the computerized names are entered twice under different ad- dresses due to members moving from one ward to another. This means double counting of many members under 35 years of age, who are the most mobile part of the population. An attempt has been made to estimate and adjust for this effect in arriving at the modified age distribu- tion, but it has not been possible to verify this or any other possible inaccuracies. The fact that the modified distribution for Utah Mormons is not greatly different from the predominately Mormon Utah state distribution is an indication of no gross errors, but there may be important modifications yet to be determined. The total Utah age distribution is already the youngest in the United States, with a median age of 23.1 years, as compared with 28.1 years in both California and the United States in 1970.6 This is largely due to the high birth rate in Utah.
The fact that the age-specific rates in Table 6 are similar for California Mormons and Utahans indicates that the modified age dis- tribution is not unreasonable, but it is so young that even small adjustments in the older age groups mean significant changes in the expected deaths and age-specific rates. As can be seen in Table 5, the ratio of observed to expected cancer deaths for California Mormons at least 35 years of age is 0.65 for males and 0.79 for females, as- suming the modified age distribution; 0.52 for males and 0.72 for females, assuming the Utah age distribution; and 0.45 for males and 0.57 for females, assuming the California age distribu- tion. Based on a comparison of Tables 2 and 5, if the modified age distribution is correct, then the male and female esophagus and lung cancer rates for California Mormons would be higher than the rates in Utah and substantially higher than the rates in Utah County. Also, the female rates for several other sites would be higher among California Mormons. One might expect

838 CANCER September 1975 \'ol. 36
that California Mormons and Utah County resi- dents, who are almost entirely hlormon, would have rather similar rates, thereby implying that the modified age distribution is too young. Furthermore, if California hlormons and Utah Alormons have similar age distributions, then the Lltah state distribution is most appropriate. Thus, i t appears plausible that the true Califor- nia Mormon age distribution lies somewhere between that of the modified and California dis- tributions. However, any more definite state- ment must await confirmation of the accuracy of the computerized membership file or examina- tion of a large representative sample of in- dividually identified California Mormons. This constitutes the greatest uncertainty in the results as they are now presented.
Demographic Characteristics
Some indication of the urbanization of Mormons is obtained by comparing Utah with the United States. According to the 1970 cen- sus," the percentage of the population in urban areas (places of more than 2500 people) was 80% in Utah, 88% in Utah County, and 74% in the United States. In order to determine the ur- ban-urual distribution of California Mormons, the percentage of Mormons has been calculated for 23 county groups throughout California, in- cluding almost the entire 1970 state Mormon population. T h e county groups, the percentage of the population in urban areas, and the Mormon population and their percentage are given in Table 8. T h e percentage of Alormons in the state is 1.8%; the Xlormons are very uni- formly distributed throughout the state, with most counties close to the state percentage. There are both urban and rural counties which are either above or below the state average, but most Mormons live in areas where their percen- tage is close to the state average. hlormon county membership figures are based on assign- ing each entire ward to a certain county group without regard to the exact county residence of individual members; uncertainty in county residence arises only for wards located near county boundaries.
I t should be noted that this is a highly migratory population, since only about 10% of the California Mormons who died in 1970 were born in California. But, by comparison, only about 10% of all Californians who died in 1970 were born in the state, reflecting the migratory
nature of the entire population. Indeed, the growth of the Mormon Church in California, as well as of the entire state, has been rapid in the past 20 or more years, as seen in Table 3. In fact, if the California hlormon age distribution is un- usually young, it may be due to a large influx of young Mormons from other states and of young converts within California, along with a high birth rate.
Socioeconomic Status .4s a check on the socioeconomic status of
Mormons, a study has been made of the dis- tribution of the last occupation as assigned by the state registrar and given on the state death certificate for the census year 1970. O c - cupational groups based on the Hollingshead classification of occupations have been used. 22
The hlormons have been compared with the California white population using cancer deaths among males, females, and both sexes. These distributions are very similar, with the Mormon percentage and the California white percentage statistically equal for each occupational group, as shown in Table 9. Indirect information on the socioeconomic status of Mormons is available by comparing 1970 census data for Utah with data for California and the United States." Com- parisons of occupational distribution and of family income distribution show no great differences in the different geographical areas. For instance, the median white family income in 1969 was $9356 in Utah, $8381 in Utah County, $10,969 in California, and $9960 in the United States. T h e Mormons in Alameda County had average incomes. T h e educational level in Utah is substantially higher than the national average, but the h,lormons in Alameda County have a n average educational level. All this sug- gests Alormons are close to average in soc ioeconomic st at us.
Additional Factors
I t is possible that Mormons seek earlier diagnosis and treatment for cancer, resulting in better survival. This could partially explain their lower risk of cancer deaths, if in reality the differential in risk of developing cancer is not as great. However, there is no evidence available to support this possibility, as indicated by the Alameda County study which showed no more extensive health care among Mormons, as measured by frequency of dental and medical

No. 3 CANCER MORTALITY AMONG MORMONS . Ensirom 839
TABLE 9. Occupational Distribution of California Mormons and California Whites at Least 35 Years of Age Who Died of Cancer in 1970, According to Last Occupation as Given on Death Certificate
Percent Distribution Both sexes h4ales Females California California California
Occupational group Mormons Whites hlormons Whites Mormons Whites
Professional Technical and administrative Clerical and sales Skilled Semiskilled Laborers, except farm and mine Farm laborers and foremen Farmers and farm managers Students Housewives, retired, never
worked, no occupation, unemployed
2.3% (6)* 4.8% 4.2% (5 ) 16.3 (43) 16.1 23.5 (28) 15.2 (40) 14.0 16.8 (20) 11.0 (29) 14.3 21.9 (26) 16.3 (43) 13.3 22.7 (27) 4.2 (1 I ) 5.1 9.2 ( I I ) 0.0 1 . 1 0.0 0.8 (2) 2.0 1.7 (2 ) 0.0 0.0 0.0
33.9 (89) 29.3 0.0
7.8% 0.7% ( I ) 20.7 10.4 ( 1 5 ) 13.2 13.0 ( 2 0 ) 26.3 2.1 ( 3 ) 15.0 1 1 . 1 (16) 9.5 n.0 2.0 0.0 3.7 0.0 0.0 0.0
0.8 .50.8 (89)
I .5 0;" 1 1 . 1 14.7
1.1
0 . 3
0.2 0.0
10.4
n. I
60.6
* Number of hlormon deaths in parentheses.
checkups and in number of visits to the doctor. Alternatively, it should be mentioned that about 40% of Mormons in California are converts; that is, they joined the Church as adults as opposed to being born and raised in a Mormon family.32 Conversion often involves a rather marked shift in lifestyle. In addition, as pointed out earlier, about 40% of the members are inactive and tend to ignore Mormon health practices. If some of the components of Mormon lifestyle are signifi- cantly related to cancer risk, then the mortality rates presented above might considerably overestimate the mortality rates for observant lifetime Mormons, because a large proportion of hlormons have followed or still follow a lifestyle similar to the general population. This would be especially important if environmental carcino- genic factors exert their influence primarily in the early years of life.
SIGNIFICANCE A N D CONCLUSION
Assuming these results are correct within the limitations discussed above, their significance lies in the fact that the mortality rates for Mormons are substantially lower than those of the general population and similar to those of previously reported nonsmoking populations in the United States,36 including Seventh-day Adventists as a ~ h o l e . ~ ~ . ~ ' For the six major American studies of U.S. white males reported as of 196435 and the two major followup studies reported in 1966, lS the average age-adjusted
total mortality ratio for nonsmokers at least 35 years of age to U.S. white males in 1960 was 55%, with a range from 46% to 64% in the eight studies. The 1970-72 age-adjusted total mor- tality ratio for California Mormon men at least 35 years of age is between 46 and 69%, depending on the age distribution assumed. For each of these studies the age-adjusted cancer mortality ratio is the same as the age-adjusted total mortality ratio to within a couple of percentage points. These studies each included between 50,000 and 2 million man-years of ex- posure to mortality.
Furthermore, the earlier studies involved self- selected populations which as a whole were healthier than average U.S. white males.'8 For instance, these studies enrolled persons with above average socioeconomic status, excluding seriously ill persons, and may not have traced all deaths.35 Data in this paper refer to all Mormons, including members who ignore Church regulations, as evidenced by the sub- stantial number of lung cancer deaths shown in Table 5 and the substantial percentage of smokers and drinkers in Alameda County. Sick members have not been excluded; Mormons have an average socioeconomic status. When results of a true comparison are available, active lifetime Mormons should be shown to have lower mortality rates than all Mormons and possibly to be healthier than any sizeable group of Americans thus far studied.
Equally significant is the fact that the

840 CANCER September 1975 Vol. 36
Mormons have low cancer mortality rates for most sites, including many sites which have not been clearly associated with specific etiologic factors, such as smoking or drinking. This phenomenon of universally low cancer rates has not been observed to such an extent in any other group of Americans, except Seventh-day Adven- t i s t ~ . ~ ~ This suggests the development and ex- ploration of new etiologic hypotheses for cancer and may lead to understanding a lifestyle which produces low risk to cancer of all types.
I t remains to be determined exactly what components of hlormon lifestyle, including the
"Word of Wisdom," are related to their low mortality rates. Several possible factors are: low consumption of tobacco, alcohol, coffee, tea, soft drinks, and drugs; certain dietary habits; general health practices, including exercise and proper sleep and weight; various social and psy- chological aspects connected with the nature of their religion; and other environmental effects. Elucidation of previously undiscovered factors protective against cancer could have con- siderable implication for cancer control and prevention. These factors are to be studied further.
KEFEKENCES
I , ;\rrington. L. J . : Personal communication. October 26. 1072.
2. Belloc. N. H.. and Hreslow, L. ; Kelationship of physical health status and health practices. Prw. .\frd. 1 :40')-42I. 1972.
3. Belloc. N . B.: Kelationship of health practices and nior- tality. / ' r w . \/rd. 2:67-8 I , 1073.
4. Buell, P.: Trends in Cancer hlortality-Calilornia, l9SO- 1970. Berkeley. State of CAifornia Department of Public Health, 1972.
-5. Burbank. F. : Patterns in cancer mortality in the Llnited States- 1950- 1967. ,\it/. (.bnrr-r fnrr. .\fonogr. 3 3 : 1-594, 1071.
6. Bureau of the Census: l'nited States Census of the Population- lO7O. Ll'ashington. IlC, U.S. Government Printinq Office. 1972.
7 . Hureau of the Census: Religious Bodies- 1936. \l'ashington. UC:. L'.S. Government Printing Office, 104 I .
8. C:alifornia State Department of Public Health: \'ital Statistics of (:alifornia. 1970. Berkeley. 1973.
9. Church of,Jesus Christ of Latter-day Saints: The Ll'ord of \\isdoni. From the Doctrine and Covenants of the Church of ,Jesus Christ of the Latter-day Saints, Section 89, Salt I.ake City, l!tah. 1972.
10. Church of Jesus Christ of Latter-day Saints: Instruc- tions for \Vard Record of l lembers and Children. Form PB- 94. Salt Lake City. L'rah, 1065.
I I . Clemniesen. J . : Statistical Studies in the Aetiology of l1:iligriant h'eoplasms-I. Keview and Results. Copen- hirgen, Xlunksyaard, 1965.
12. Ilepartment of Health, Education and \\:elfare: :\lcohol and Health. \\ashinston, DC:. U.S. Government Printing Office. 1971.
13. I)istilled Spirits Institute. Inc.: Annual Statistical Keview-The Distilled Spirits Industry- 1060. \\ashington, IX. I9GO; p. 39.
14. I listilled Spirits I nstitute. Inc. : Annual Statistical Keview-The Distilled Spirits Industry- 1970. \Vashington, IK, 1070.
15. Iloll, K . : Prevention of Cancer-Pointers from Epidemiology. landon, Nuffield Provincial Hospitals Trust, 1967.
16. I h l l . K.. hluir. C:. S., and \Yarerhouse. J . : Cancer In- ridence in Five Continents. vol. 2. Switzerland. International L'nion ..\gainst Cancer, 1070.
17. Ilunham. L. ,I., and Bailar. J . C , 1 1 1 ; World maps of
cancer mortality rates and frequency ratios. J . .\.at/. C ' a n ~ 7
/ ! I \ / . 41:l55-203, 1968. 18. Encyclopedia Britannica. Inc. : Encyclopedia Britan-
nica. Chicago, 1970; vol. I , p . 542, vol. 3, p. 379, vol. 23, p . 577.
19. Haenszel. \V.: Epidemiological approaches to the study of cancer and other chronic diseases. .\L/. C'uncr-7 Inst. . \ / m ~ ~ r . 19: 1-204. 1966.
20. Hisserich, J . C.. hlartin, S. P., and Henderson, B. E.: An areawide cancer reporting network. A b l i r Hmlth Rep. 90:15-17~ 1975.
21. Hochstirn, J . R. , and Athanasopoulos, D. A,: Personal follow-up in 'a mail survey-Its contribution and its cost.
22. Hollingshead, A., and Kedlick. F. C . : Social Class and Alental Illness-.A Community Study. New York. Wiley, l9SM.
23. Human Population Laboratory, C:alifornia State Department of Public Health: Alameda County Population 1065. Series :I. KO. 7, ;\pril, 1966.
24. Iba. C;. B. : Personal communication, July 3 , 1974. 25. Kleinman. C:. L.: Personal communications. April 1 I ,
1973 and July 30, 1974. 26. Koelliker. P. E.: Personal communication, July 2,
197.5. 27. Lemon, F. K., Walden, R. T . , and \,Voods, R . M , :
Cancer of the lung and mouth in Seventh-day Adventists. (,'anc.r~ 17:486-497, 1964.
28. Lemon. F. R.! and LValden, K. T.: Death from respiratory system disease among Seventh-day Adventist men. ,J.i.\f.i 198: 117-126, 1966.
29. Lemon, F. K . , and Kuzma, ,J. \V.: A biologic cost of smoking-Ilecreased life expectancy. .4irh. Enurron. Heallh 18:950-955, 1969.
30. hlach'airy. L. N . : Personal communication, May 22, 1974.
31. hlason, T. J. . and hlcKay, F. \V . : U.S. Cancer hlor- tality b y County- 1050- 1969. DHECV Publication No. ( N I H ) 74-615. LVashington. DC, U.S. Government Printing Office, 1974.
32. Olson, E. E.: Personal communications, hlarch 22, 1073 and April 16, 1973.
33. Phillips, R . L.: Cancer and Adventists. Scienre 183:471, 1974.
34. Phillips, R . L.: Prepublication data and personal com- munication. hlay 21, 1974.
/'lfh[/f' (I/J/r/lfJr/ q. 34:69-81, 1970.

No. 3 CANCER MORTALITY AMONG MORMONS Enstrom 84 1
35. Public Health Service: Smoking and Health-Report of the Advisory Committee to the Surgeon General of the Public Health Service. Public Health Service Publication No. 1103. Washington, DC, U.S. Government Printing Office, 1964.
36. Public Health Service: T h e Health Consequences of Smoking-A Report to the Surgeon General-1971. \Vashington, DC. US. Government Printing Office, 197 1.
37. Public Health Service: Viral Sratistics Rates in the L'nited States. 1940-1960. Public Health Service Publication No. 1677. IVashington, DC, U.S. Government Printing Office. 1968.
38. Public Health Service: Vital statistics of the United States-1969, 1970. and 1971. Washington, DC, National Center for Health Statistics, 1974.
39. Royal College of Physicians: Smoking and Health Now-A New Report and Summary on Smoking and Its Effects on Health from the Royal College of Physicians. London, Pitman hledical and Scientific. 1971.
40. Seidman. H. : Cancer death rates by site and sex for religious and socioeconomic groups in New York City. En- a r o r i . Rr\ , 3:234-249. 1970 (and references sited therein).
41. Tobacco Tax Council: The Tax Burden on Tobacco- Historical Compilation, vol. 7. Richmond, VA, 1972; p. 18.
42. United States Brewers Association, Inc.: Brewers Almanac 1966. New York, 1966; p. 56.
43. Lrnited States Brewers Association, Inc.: Brewing In- dustry in the United States-Brewers Almanac 1972. Washington, DC, 1972.
44. N'idtsoe, J . A,, and Widtsoe, L. D.: The \Vord of Wisdom: A hlodern Interpretation. Salt Lake City, Deseret Book Company, 1950.
45. Wine Institute: Economic Research Report, No. EK- 3, September 26, 1968. San Francisco, 1968; p. 14.
46. Wine Institute: 1971 Wine Industry Statistical Report. Economic Research Report No. ER-19, October 13, 1972. San Francisco, 1972.
17. Wynder, E. L., Lemon, F. R., and Bross, I . J . : Cancer and coronary artery disease among Seventh-day Adventists. (.'nncu 12: 1016-1028, 1959.
48. Yerushalmy. J . : Statistical considerations and evalua- tion of epidemiological evidence. In Tobacco and Health, C;. James and T. Rosenthal, Eds. Springfield, IL, Charles C Thomas, 1962.