investigation of deforestation in east africa on regional ...450729/fulltext01.pdf · investigation...
TRANSCRIPT

Master’s thesisGeography, 30 HECs
Department of Physical Geography and Quaternary Geology
Investigation of deforestation in East Africa
on regional scales
Yi-Hua Wu
GA 102011


Preface
This Master’s thesis is Yi-Hua Wu’s degree project in Geography, at the Department of
Physical Geography and Quaternary Geology, Stockholm University. The Master’s thesis
comprises 30 HECs (one term of full-time studies).
Supervisor has been Ian Brown, at the Department of Physical Geography and Quaternary
Geology, Stockholm University. Examiner has been Karin Holmgren, at the Department of
Physical Geography and Quaternary Geology, Stockholm University.
The author is responsible for the contents of this thesis.
Stockholm, 9 September 2011
Clas Hättestrand
Director of studies


Investigation of Deforestation in East Africa on Regional Scales
I
Abstract
Tropical forests contain abundant natural resources and play an important role in the
balance of the ecosystems and environment. Depletion of forests could
destroy habitats of endangered plants and animals and cause biodiversity loss. Rapid
deforestation is a major problem in East Africa and seriously affects desertification and
climate change in East Africa. More monitoring of the deforestation in East Africa are
emergent. Therefore, this study was conducted to identify and evaluate the spatial and
temporal distributions and determinants of deforestation in East Africa. Two kinds of
satellite image datasets, including Landsat images and GIMMS data were used to map
the deforestation in Kenya, Tanzania and Uganda. Possible drivers of deforestation were
analyzed, including population statistics, economic and climate data. The analysis of
Landsat images was focus on the forests, including Mount Kenya, Mao forest, Aberdares
forest as well as Mount Kilimanjaro in Tanzania and its surroundings. Supervised
classification was carried out on the images comprising PCA component images and
Tassel Cap transformed images to identify forest area and non forest area. High Kappa
coefficient of the classification indicated that using the images that comprising the
enhancement images transformed from original images would be a better approach to
mapping forest areas. The obvious deforestation was observed in Mau forest, Mountain
Kilimanjaro and Aberdares forest close to Nairobi city from 1980s to 2000s. The
analysis using the GIMMS NDVI dataset did not show a significant decline of NDVI
values during the study period. The results indicate that the GIMMS NDVI is not a good
proxy of total forest areas because of the coarse resolution of GIMMS dataset and the
characteristics of NDVI. Future studies should use higher resolution satellite images and
collect enough information to monitor deforestation.
Keywords: Deforestation, Landsat, GIMMS NDVI, Supervised Classification, PCA,
Tasseled Cap Transformation, Kenya, Tanzania, Uganda.

Yi-Hua Wu
II
Acknowledgements
I would like to thank my supervisor, Ian Brown, for giving me this opportunity to
carry out this project. Thank you so much for leading me into the field of remote
sensing, helping me to deal with image processing, and providing all the assistance and
valuable comments to bring out this study. My special thanks to my examiner, Karin
Holmgren, for her substantial opinions and detailed suggestions for my thesis.
Furthermore, I would like to thank my family and friends in Taiwan for supporting
and encouraging me. Special thanks to Hong-Mao Lin for his understanding and
company.

Investigation of Deforestation in East Africa on Regional Scales
i
Contents
List of Figures .................................................................................................................. ii
List of Tables .................................................................................................................... ii
1. Introduction ................................................................................................................. 1
1.1 Background ......................................................................................................... 1
1.2 Literature review ................................................................................................. 3
1.2.1 Deforestation in Africa ............................................................................. 3
1.2.2 Possible drivers of deforestation .............................................................. 4
1.2.3 Previous studies in East Africa ................................................................ 4
1.3 Aim and objectives .............................................................................................. 5
2. Method ......................................................................................................................... 6
2.1 GIMMS dataset ................................................................................................... 7
2.1.1 Study area................................................................................................. 7
2.1.2 Analysis of GIMMS dataset ..................................................................... 7
2.2 Landsat images ................................................................................................... 8
2.2.1 Study area................................................................................................. 8
2.2.2 Image preprocessing ................................................................................ 9
2.2.3 Image enhancement ............................................................................... 10
2.2.4 Image classification ............................................................................... 12
2.2.5 Accuracy assessment .............................................................................. 13
2.3 Statistical analysis ............................................................................................. 13
3. Results ........................................................................................................................ 14
3.1 Landsat images classification ........................................................................... 14
3.2 NDVI of GIMMS .............................................................................................. 22
3.3 Relationships between deforestation and possible drivers ............................... 26
4. Discussion .................................................................................................................. 30
5. Conclusion ................................................................................................................. 35
6. References .................................................................................................................. 36

Yi-Hua Wu
ii
List of Figures
Fig. 1 The location of the study area ................................................................................. 2
Fig. 2 Flow chart illustrating the image processing and method used in this study .......... 6
Fig. 3 An example of the GIMMS data: mean monthly NDVI of July in 1981 ................ 8
Fig. 4 Different image processing in Mau forest............................................................. 12
Fig. 5 Forest areas during 1976 to 1980 .......................................................................... 18
Fig. 6 Forest areas during in 1980s ................................................................................. 19
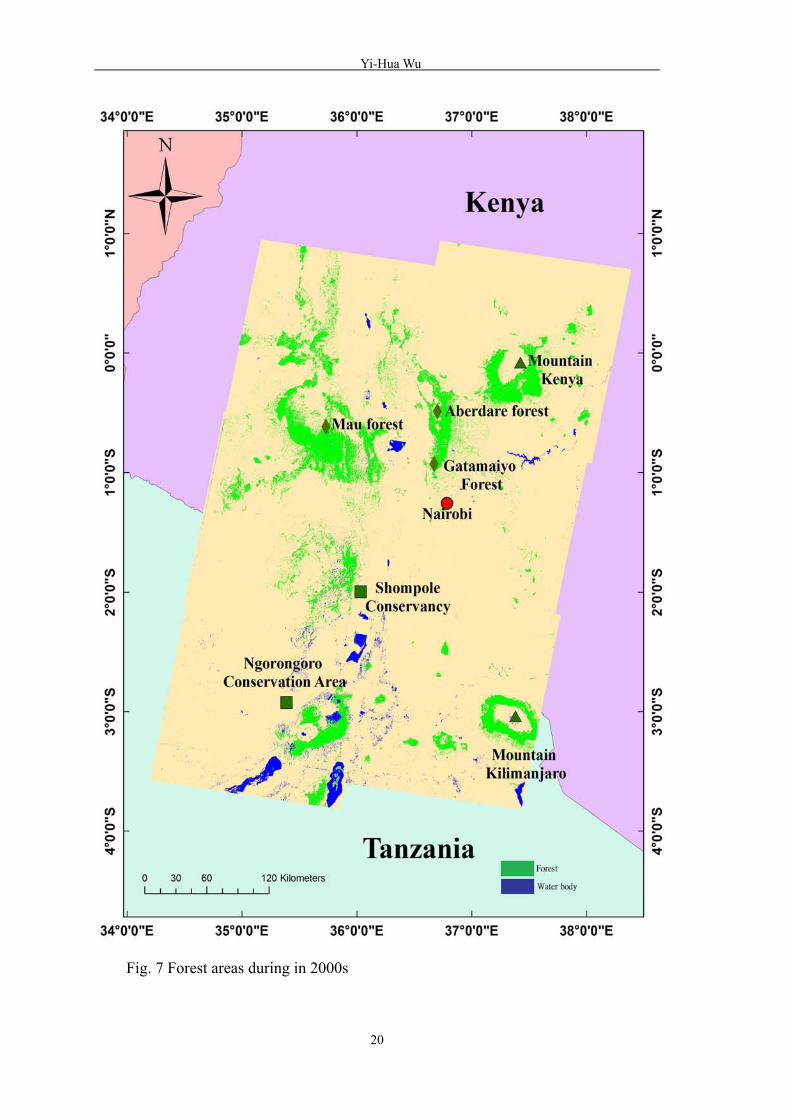
Fig. 7 Forest areas during in 2000s ................................................................................. 20
Fig. 8 The relationship between annual mean dry season NDVI of GIMMS and forest
areas in Landsat images ....................................................................................... 22
Fig. 9 The distirbution of annual mean NDVI of dry season from 1981 to 2006 in Kenya,
Tanzania and Uganda .......................................................................................... 23
Fig. 10 The spatiotemporal pattern of annual mean NDVI of dry season in East Africa in
1980s, 1990s and 2000s. ...................................................................................... 24
Fig. 11 The distirbution of annual mean NDVI of dry season from 1981 to 2006 in four
major forest areas ................................................................................................ 25
List of Tables
Table 1. Data of Landsat images used in this study ........................................................ 10
Table 2. The results of classification of Landsat images ................................................. 16
Table 3. The pattern of deforestation identified by Landsat images ............................... 17
Table 4. The accuracy of classification for Landsat images ............................................ 21
Table 5. Descriptive statistics for annual mean NDVI of dry season and related indicators
in Kenya during study period ............................................................................ 27
Table 6. Descriptive statistics for annual mean NDVI of dry season and related indicators
in Tanzania during study period ........................................................................ 28
Table 7. Descriptive statistics for annual mean NDVI of dry season and related indicators
in Uganda during study period .......................................................................... 29
Table 8. Univariate linear regression models for deforestation in three countries .......... 30
Table 9. Multiple regression models for deforestation in three countries ....................... 30

Investigation of Deforestation in East Africa on Regional Scales
1
1. Introduction
Forests, especially tropical forests, contain abundant natural resources and influence
the balance of the ecosystems and environment. Depletion of forests could
destroy habitats of endangered plants and animals and cause biodiversity loss (Boahene,
1998). Kiage et al. (2007) indicated soil erosion and increases in sediment transport
caused by deforestation affecting Lake ecosystems as well as the biodiversity. Forest loss
changes the balance of hydrological cycle and decreases rainfall (Boahene, 1998).
Meanwhile, forests play an important role in earth’s carbon cycle and act as massive
carbon stores. Removing forests releases carbon into atmosphere and exacerbates the
global warming. Research has estimated that deforestation caused about 0.5 gigatonnes of
carbon to be released from forests each year in last decade (FAO, 2010). At the same time,
climate change enhances the occurrence of extreme weather events, such as storms,
droughts and floods, which would also seriously damage forest ecosystems (FAO, 2010).
Hence, adequate forest management to reduce and control deforestation is urgent. More
assessments that completely monitoring the distribution of deforestation are needed to
provide enough information for policy makers.
1.1 Background
In the last decade forest areas lost about 13 million hectares per year due to
overpopulation, agricultural expansion, logging and so on (Boahene, 1998, FAO, 2010).
Deforestation mostly occurs in developing countries. In Africa, over 50% of new
agricultural land came from forests. In East Africa, farmland increased 50% since 1980
(Gibbs et al., 2010). Meanwhile, forests are a major source of fuelwood in East Africa
(FAO, 2001). Rapid deforestation is a major problem in East Africa and seriously affects
desertification and climate change in East Africa (FAO, 2001). More monitoring of the
distribution of deforestation in East Africa are needed. Nevertheless, a comprehensive
field study of deforestation is very time and cost consuming. A more efficient way is to
use remote sensing data to identify deforestation.

Yi-Hua Wu
2
Fig. 1 The location of the study area
Remote sensing provides a useful mean to map and monitor the change of forest area.
Methods include visual interpretation of deforestation with aerial photos or satellite
images (Roy et al., 2002). Such methods can collect data in different scales, including
local, regional and global scale, during a short time or over an inaccessible area. More and
more research uses satellite images to investigate deforestation. For example, Global
Forest Resources Assessment carried out by the Food and Agriculture Organization
(FAO) (2010) used Landsat satellite images to map the pattern of deforestation over times
at a global scale. Classification is performed on the satellite images to distinguish the

Investigation of Deforestation in East Africa on Regional Scales
3
forest area. In addition, vegetation indices calculated by satellite images are also a good
proxy to identify the presence of forest. Based on different reflectance properties of
vegetation types within different spectral bands, researchers can use vegetation indices to
recognize the forest area (Campbell, 2002d). Therefore, a longitudinal study in this
project was implemented to monitor deforestation in East Africa using high resolution
satellite images.
1.2 Literature review
1.2.1 Deforestation in Africa
Numerous investigations have addressed deforestation on local, regional and global
levels. One global forest resources assessment has been conducted by FAO since 1946
(FAO, 2010). This assessment used remote sensing data, such as Landsat images, to
identify forest areas and estimate the change of forest areas over time. FAO reported that
there are about 4 billion hectares of total forest area in the world and these are decreasing
at about 13 million hectares per year. Highest rate of deforestation majorly occurred in
developing countries and tropical zone, especially in South America and Africa.
Based on the research of FAO, the forest in Africa covers about 675 million hectares
and around 3.5 million hectares per year has been lost in last decade, with annual
deforestation rate of about 0.5%. The Tropical Ecosystem Environment observation by
Satellite (TREES) II projects also used Landsat satellite data to map the forest area in
1990s (Achard et al., 2002, Mayaux et al., 2005), but this project focused on humid
tropical forests. The results were similar to the results of FAO and showed that the forest
loss in tropical forest was about 4.9 million hectares per year. Average deforestation rate
in Africa was 0.43%.
Hansen and DeFries (2004) used Advanced Very High Resolution Radiometer
(AVHRR) Data with resolution of 8 km to examine the long term change of global forest
cover. Their results revealed that the tree cover of the world decreased between 1984 and
1997 and the annual deforestation rate in tropical Africa was about 0.09%. The
deforestation rate in the study of Hansen and DeFries was lower than the studies of FAO
and TREES II which could be due to the difference of resolution and sensors. The patchy
distribution of deforestation in Africa could increase the difficulties to define the
deforestation in Africa (Hansen and DeFries, 2004). All these research indicate that

Yi-Hua Wu
4
deforestation in tropical forests is difficult to map and remote sensing is a useful tool for
forest monitoring.
1.2.2 Possible drivers of deforestation
There are many reasons for deforestation, such as agriculture expansion, population
growth, industrialization and so on. Agriculture expansion was indicated as the main
cause for loss of forest areas (FAO, 2010). In Africa, forest is the major source for new
agriculture land (Gibbs et al., 2010). Excessive population growth increases the demand
for resources. Hence, more nature resources, such as forests, are required to meet people’s
needs. Economic development also plays an important role in deforestation. In
developing countries, people overexploit natural resources to improve financial incomes.
In East Africa, fuelwood use and population growth are important contributors to
deforestation (FAO, 2001). Rudel et al. (2009) use a Meta analysis to examine the
possible reasons for deforestation in East Africa. They indicated that smallholders,
increasing population, fuelwood use and forest products sold in urban markets were
important drivers of deforestation in 1980s and 1990s. They also indicated that rural
population, location of forest and economic growth were important drivers of
deforestation in Uganda and Kenya. For Tanzania, population density and rural
population growth were main causes (Rudel and Roper, 1996). These results showed that
drivers of deforestation varied in different countries because of the difference of
socioeconomic condition and environmental characteristics.
1.2.3 Previous studies in East Africa
The report of FAO (2010) indicated that in 2010 there were about 73 million
hectares of forest in East Africa and the annual loss of forests was around 0.7 million
hectares. Kenya still remained a deforestation rate of about 0.3 % per year. Large loss of
forest area was indicated in Tanzania and Uganda about 1.2% and 2.7% per year,
respectively. At the same time, several research projects have been carried out to map the
distribution pattern of deforestation in East Africa. Remote sensing data were frequently
used as a main source of data. Landsat satellite images acquired from several periods
were used in studies conducted in Kenya (Kiage et al., 2007, Ochego, 2003), Tanzania
(Halperin and Shear, 2005, Strömquist and Backéus, 2009) and Uganda (Malinverni and

Investigation of Deforestation in East Africa on Regional Scales
5
Fangi, 2010, Mwavu and Witkowski, 2008) to identify forest areas and land cover change.
These researchers classified satellite images into different classes to identify forest areas.
Vegetation indices were also used in some of these studies as an auxiliary data to
determine changes in forest (Kiage et al., 2007, Malinverni and Fangi, 2010, Ochego,
2003). The results all showed that forest loss has been severe in these countries during the
last decades. Kiage et al. (2007) indicated that soil erosion caused by deforestation in
Lake Baringo catchment of Kenya damaged the Lake ecosystem and affected the
biodiversity in this area. Agriculture expansion, population growth and logging for
charcoal were indicated as important reasons for deforestation (Kiage et al., 2007,
Mwavu and Witkowski, 2008, Strömquist and Backéus, 2009).
According to these studies, remote sensing data is a good tool that can successfully
map the pattern of deforestation in East Africa. However, the process and possible drivers
of deforestation in East Africa are very complex. Information about forest resources is
still lacking for East Africa to establish well forest management (FAO, 2001). More
research using remote sensing data covering more areas and acquired over longer periods
are required to completely monitor the spatiotemporal distribution of deforestation and
further clarify the interrelations between deforestation and possible drivers. Therefore, a
longitudinal study was implemented in this study to monitor deforestation in East Africa
using high resolution satellite images.
1.3 Aim and objectives
The research question of this study is “how does the long term pattern of
deforestation change in different forests and countries of East Africa?”, as well as “what
are the possible factors of the deforestation in East Africa? and how do these factors
affect the deforestation in East Africa?”.
Therefore, the main goal is to use remote sensing data to identify and evaluate the
spatial and temporal distributions and determinants of deforestation in East Africa.
The objectives include:
A. To identify and map deforestation in East Africa using two kinds of satellite
images datasets, including Landsat images and Global Inventory Modeling and
Mapping Studies (GIMMS) data.
B. To examine the temporal and spatial patterns of deforestation in East Africa.
C. To analyze possible drivers of deforestation, including population statistics,

Yi-Hua Wu
6
economic and climate data.
2. Method
This study includes two parts since two kinds of satellite images datasets were used
to identify and map deforestation, including Landsat images and Global Inventory
Modeling and Mapping Studies (GIMMS) data. GIMMS dataset with coarse spatial
resolution was used to compare the deforestation in different countries in East Africa,
and Landsat images with high resolution was used to analyze the deforestation in
several major forests in East Africa.
Fig. 2 Flow chart illustrating the image processing and method used in this study

Investigation of Deforestation in East Africa on Regional Scales
7
2.1 GIMMS dataset
2.1.1 Study area
The focus of this study is deforestation in East Africa, including Kenya, Tanzania
and Uganda. Kenya is located at the equator, between latitudes 5° south and 5° north, and
longitude 34° and 42° east. The total area of Kenya is about 580,000 km2 and the forest
area covers about 3.5 million hectares (FAO, 2010). The mean annual temperature of
Kenya is 23.9 °C. The two rain seasons in Kenya occur in March to May and October to
December (McSweeney et al., 2008a).
Tanzania lies between latitude 1° and 12° south, and longitude 29° and 41° east with
area of 947,300 km². There are about 33 million hectares of forest area (FAO, 2010). It
has a tropical climate with a mean annual temperature 22.2 °C. The two rain seasons in
Tanzania occur in March to May and October to December (McSweeney et al., 2008b).
Uganda is situated between latitude 1˚30 south and 4˚ north and longitude 29˚30 and
35˚ west with area about 241,500 km2 (Obua and Agea, 2010, UNEMA, 2007). Forest
area is about 3 million hectares. Uganda has a tropical climate with a mean temperature
of 22.0 °C. Uganda has two wet seasons, October to December and March to May
(McSweeney et al., 2008c).
2.1.2 Analysis of GIMMS dataset
The GIMMS dataset comprises the Normalized Difference Vegetation Index (NDVI)
data averaged over 15-day periods using cloud free daily images collected by the
Advanced Very High Resolution Radiometer (AVHRR) on board the National Oceanic
and Atmospheric Administration (NOAA) satellite series. The data are resampled to a
spatial resolution of 8 km (Tucker et al., 2005).
The NDVI is calculated by the reflectance of the near-infrared and visible red bands
as NDVI= (NIR-R) / (NIR+R), where NIR and R are the spectral reflectance in the
near-infrared and visible red regions by the AVHRR, respectively. Radiometric
calibration, atmospheric correction and solar zenith angle correction were carried out to
prevent the error by sensors, sun elevation, atmospheric scattering and volcanic eruption
(Tucker et al., 2005).
The original values in GIMMS data does not range from -1 to 1, and then rescale

Yi-Hua Wu
8
must be done by dividing with 1000. The NDVI of dry season could be a good indicator
to detect deforestation since only forest remains green during dry season (Hudak and
Wessman, 2000, Prins and Kikula, 1996). In this study, the mean NDVI values during dry
season of three countries were calculated from GIMMS NDVI data between 1981 and
2006. The calculation and analysis of GIMMS dataset was processed with ENVI
software.
Fig. 3 An example of the GIMMS data: mean monthly NDVI of July in 1981
2.2 Landsat images
2.2.1 Study area
The analysis of Landsat images in this study was focus on the forests, including
Mount Kenya, Mao forest, Aberdares forest nearby Nairobi in Kenya, the largest and
populous city of East Africa, as well as Mount Kilimanjaro in Tanzania, the highest
mountain in East Africa and its surroundings.
Mount Kilimanjaro is located in Tanzania, close to the border with Kenya. It is an
area with significant natural resources, such as fertile soil, water and forest. It contains
several types of forests: about 1200 species of vascular plants, 130 species of trees, and
170 species of shrubs grow on Mount Kilimanjaro (Hemp, 2006, Lambrechts et al., 2002).
It is also an important habitat with high biodiversity and many endemic species, including
about 140 species of mammals (Lambrechts et al., 2002). Moreover, Mount Kilimanjaro
is an important water catchment for both Kenya and Tanzania. It contributes to water

Investigation of Deforestation in East Africa on Regional Scales
9
supply for agriculture, irrigation, industry and so on (Lambrechts et al., 2002, William,
2003).
Mau forest is a forest complex in Kenya. It is a large montane forest in Kenya and
also the largest water catchment area in Kenya. Rivers in Mau forest are the major source
for surface and groundwater reserves, supporting important water supply for agriculture
and power generation (Baldyga et al., 2007, Kinyanjui, 2010, Ngigi and Tateishi, 2004).
The forest on Mount Kenya is a large continuous indigenous forest in Kenya. Mount
Kenya forest is an important catchment in Kenya, providing water supply for agriculture,
irrigation and power generation (Ndegwa, 2005, Ngigi and Tateishi, 2004). Aberdares
forest is close to Nairobi city. Like Mau forest and Mount Kenya, it is one of the
important catchments in Kenya (Ochego, 2003). These forests provide various resources
and services in Kenya, such as fuelwood for local people. They all are important habitats
for numerous endangered species and they have high biodiversity of fauna and flora.
2.2.2 Image preprocessing
Seventeen Landsat images were acquired (Table 1) by Landsat 2 Multi-Spectral
Scanner (MSS), Landsat 3 MSS, Landsat 5 Thematic Mapper (TM) and Landsat 7
Enhanced Thematic Mapper Plus (ETM+). These images were chosen in the dry season
for getting better identification between forest and non forest areas.
For these Landsat satellite images, general calibration and dark object subtraction
were conducted to reduce bias caused by differences of sensors, sun elevation and
atmospheric scattering.

Yi-Hua Wu
10
Table 1. Data of Landsat images used in this study Image date Satellite/Sensor Path/ Row Spatial Resolution
1976.01.24 Landsat 2/ MSS 180/ 062 79 m
1976.02.12 Landsat 2/ MSS 181/ 061 79 m
1976.01.25 Landsat 2/ MSS 181/ 062 79 m
1980.02.17 Landsat 3/ MSS 180/ 060 75m
1980.02.17 Landsat 3/ MSS 180/ 061 75m
1978.12.31 Landsat 3/ MSS 181/ 060 75m
1984.12.17 Landsat 5/ TM 168/ 061 30m
1987.02.25 Landsat 5/ TM 168/ 062 30m
1986.01.28 Landsat 5/ TM 169/ 060 30m
1986.01.28 Landsat 5/ TM 169/ 061 30m
1987.02.16 Landsat 5/ TM 169/ 062 30m
2000.02.21 Landsat 7/ ETM+ 168/ 060 30m
2002.02.10 Landsat 7/ ETM+ 168/ 061 30m
2000.02.21 Landsat 7/ ETM+ 168/ 062 30m
2003.02.04 Landsat 7/ ETM+ 169/ 060 30m
2003.03.08 Landsat 7/ ETM+ 169/ 061 30m
2003.02.04 Landsat 7/ ETM+ 169/ 062 30m
2.2.3 Image enhancement
In order to clearly distinguish between forest and non forest areas, several kinds of
image enhancement methods were used here, such as NDVI and the Tasseled Cap
transformation. NDVI is a ratio of the red and near infrared reflectance and related with
the fraction of photosynthetically active radiation absorbed by the vegetation (Rees,
2001). The value varies from -1 to 1. Higher value presents the pixels covered by denser
green biomass (Campbell, 2002d). It presents tropical forest where values approach 1.
Tasseled Cap transformation converts the bands of original image into new bands
representing proxies of vegetation characteristics. Because of the difference of sensors in
Landsat images, there are several kinds of calculations.

Investigation of Deforestation in East Africa on Regional Scales
11
In Landsat MSS images (Campbell, 2002d):
Brightness =0.433 (Band 1) + 0.632 (Band 2) +0.586 (Band 3) + 0.264 (Band 4)
Greenness =-0.290 (Band 1) -0.562 (Band 2) + 0.600 (Band 3) + 0.491 (Band 4)
Yellowness=-0.829 (Band 1) + 0.522 (Band 2) -0.039 (Band 3) + 0.194 (Band 4)
In Landsat 5 TM images (Crist et al., 1986):
Brightness = 0.2909(Band 1) + 0.2493(Band 2) + 0.4806(Band 3) + 0.5568(Band 4) +
0.4438(Band 5) + 0.1706(Band 7) +10.3695
Greenness = -0.2728(Band 1) - 0.2174(Band 2) - 0.5508(Band 3) + 0.7220(Band 4) +
0.0733(Band 5) - 0.1648(Band 7)-0.7310
Wetness = 0.1446(Band 1) + 0.1761(Band 2) + 0.3322(Band 3) + 0.3396(Band 4) -
0.6210(Band 5) + 0.4186(Band 7)-3.3828
In Landsat ETM+ images (Huang et al., 2002):
Brightness= 0.3561(Band 1) + 0.3972(Band 2) + 0.3904(Band 3) + 0.6966(Band 4) +
0.2286(Band 5) + 0.1596(Band 7)
Greenness= -0.3344(Band 1) -0.3544(Band 2) -0.4556(Band 3) + 0.6966(Band 4) -
0.0242(Band 5) -0.2630(Band 6)
Wetness= 0.2626(Band 1) + 0.2141(Band 2) + 0.0926(Band 3) + 0.0656(Band 4) -
0.7629(Band 5) -0.5388(Band 6)
The first new band represents the index of “brightness” which shows the soil
moisture of the image. The second new band is “greenness” which presents the amount of
green vegetation. The third new band is “wetness”, which shows soil and surface
moisture in TM and ETM+ images, or “yellowness”, which presents the amount of dried
vegetation in MSS images (Campbell, 2002d, Rees, 2001). With the growing of
vegetation, the greenness index will increase. Meanwhile, the brightness would decrease
due to the increase in ground cover by vegetation.
Principal component analysis (PCA) was applied on Landsat images. PCA, similar
to Tasseled Cap transformation, transforms the original images with many bands into few
components images that are orthogonal to each other (Campbell, 2002b, Rees, 2001). In
the original image some bands would correlate with each other. With PCA, these
interrelated bands could be combined and converted into fewer less relevant components.
It condenses the information, reduces the redundancy of the original data as well as

Yi-Hua Wu
12
highlights the similarity and difference between bands. The majority of total variance will
be presented in the first few component images. Using PCA on remote sensing data can
filter out the noise of satellite images and enhance image features (Byrne et al., 1980,
Campbell, 2002b).
2.2.4 Image classification
The resulting component images were combined in a band stacking process to create
a multi-band multi-proxy vegetation mapping dataset to allow supervised classification
for the separation of forest areas and non forest areas. There are several approaches for
supervised classification. In this study, minimum distance classification was used.
Training areas were selected in forest and non forest areas. The unclassified pixels will be
assigned to the class that is spectrally closest (Campbell, 2002c). Then the total area of
forest could be calculated by the pixel numbers of forest class.
Fig. 4 Different image processing in Mau forest

Investigation of Deforestation in East Africa on Regional Scales
13
2.2.5 Accuracy assessment
Accuracy assessment is performed by comparing the classification map with the
ground truth image. However, the ground truth data is lacking in this study. Ground truth
regions of interest (ROI) were used in this study to define the correct classes. Ground
truth ROIs were randomly chosen in the forest and not forest area which were visually
identified in Landsat images. For each classification image, user and producer accuracies
as well as overall classification accuracies and kappa coefficient were calculated by
establishing a confusion matrix (Campbell, 2002a).
A confusion matrix presents the pixel dispositions of the classification map and
ground truth. Producer accuracy is calculated by dividing the numbers of the classified
pixels which are assigned to the correct class by the total pixel numbers of the correct
class. Producer accuracy shows the probability that the pixel of the correct class will be
really assigned to the correct class. User accuracy is calculated by dividing the numbers
of the classified pixels which are assigned to the correct class by the total pixel number of
the assigned class. It presents the probability that the pixels of the assigned class actually
represent the correct class.
Overall accuracy is calculated by dividing the total numbers of classified pixels
which are assigned to the correct classes by total number of pixels. The kappa coefficient
is to evaluate the difference of agreement between two maps. It is calculated by:
K= (observed- expected) / (1-expected)
“Observed” is the percentage of observed agreement and “Expected” shows the
probability of chance agreement. The value of Kappa coefficient ranged from -1 to 1.
Higher value indicates higher agreement (Campbell, 2002a, Monserud and Leemans,
1992).
2.3 Statistical analysis
SAS statistical package (v. 9.1, SAS Institute Inc., Cary, NC, USA) and SPSS
Statistics (v.17.0, SPSS Inc., Chicago, IL, USA) were used to perform statistical analyses.
Population and economic data was obtained from the World Bank and climate data was
downloaded from NOAA, USA. Deforestation is defined by the decrease of dry season
NDVI in the analysis of GIMMS and by the decrease of the forest area in the analysis of
Landsat images. Correlation between forest area from Landsat images and mean NDVI

Yi-Hua Wu
14
values of dry season from GIMMS dataset of the same year were analyzed to examine the
consistency between Landsat images and GIMMS dataset. Wilcoxon Signed Ranks Test was
used to examine the differences of related samples for non-parametric statistics. Regressions
models were developed for three countries to analyze the relationships between dry
season NDVI and possible drivers, such as GDP, population, climate factors and so on
3. Results
3.1 Landsat images classification
Supervised classification was carried out on Landsat MSS, Landsat TM and Landsat
ETM+ images. In total seventeen Landsat images were used in this study covering
Nairobi, Kenya and nearby forests as well as Mountain Kilimanjaro in Tanzania, the
highest mountain in East Africa and its surroundings. These areas were chosen because
Nairobi is the largest and the most populous city of East Africa: many forests and
mountains surrounding Nairobi, including Mau forest, and Mount Kenya, would be easily
exploited due to urbanization and over population. Mountain Kilimanjaro also faces a
similar situation now.
The forest area of each Landsat image was calculated by the sum of pixels in the
forest class. In some images large plantations, such as tea plantations, have similar NDVI
values with forests, as do dense agriculture areas and, in some cases, even urban areas
could cause misclassification. Hence, several image processing methods were used to
enhance the visual interpretation, to classify forest and non forest areas, and improve
separation between classes. Methods including the NDVI transform, Tasseled cap
transform and PCA analysis were used. Taking Mau forest (Path/ Row: 169/ 060) as an
example, in the NDVI image (Fig. 4) the large plantation area nearby Mau forest is
difficult to distinguish from forest area. In Tasseled Cap images and PCA component
images, it is easier to identify forest areas. Therefore, supervised classification was
carried out on stacked Tasseled Cap images and PCA component images.
An accuracy assessment of classification for Landsat images was performed and the
results are summarized in Table 4. The Kappa coefficient of 0.75 or greater represents a
very good reliability of the performance for classification (Jones and Vaughan, 2010,
Monserud and Leemans, 1992). A value between 0.6 and 0.8 shows a substantial
reliability (Landis and Koch, 1977). The classification maps in this study had overall

Investigation of Deforestation in East Africa on Regional Scales
15
accuracies all over 70%. All of the Kappa coefficients of classification map were greater
than 0.68 and most of them were over 0.75. Most of the classification maps had a high
producer accuracy and user accuracy for the forest class, ranging between 70% and 90%.
Instead of using original Landsat images, in this study supervised classification was
carried out on the images stacking Tasseled Cap images and PCA component images. The
accuracy test of classification for the images using original Landsat data was also
conducted to compare the performance of different images. The results showed that the
accuracies of these two kinds of images are quiet similar, and most of them are greater
than 0.75. However, the significant higher accuracies of classification using stacked
Tasseled Cap images and PCA component images were still observed by Wilcoxon
Signed Ranks Test.
The distribution of forest areas in seventeen Landsat images are presented in Fig. 5,
Fig. 6 and Fig. 7. According to these figures, an obvious decrease in forest area occurred
between the three different periods. The forest areas in each image were listed on the table
2. Because Landsat MSS images had different path and row with TM and ETM+ images,
deforestation rate in Table 3 was only presented by comparing Landsat TM and ETM+
images. Wilcoxon Signed Ranks Test was used to examine the change of forest area in
each two paired images in the same path and row between any two given periods (Table
3). The result indicated that the forest areas significantly decreased between 1980s and
2000s. It showed clearly significant deforestation during study period. The Gatamaiyo
forest which is close to Nairobi city decreased 284.99 km2 between 1980s and 2000s. In
Mount Kilimanjaro, forest areas lost about 13.39 % in this period. The highest decreasing
rate was observed in Mau forest area about 1.34 % per year during 1980s to 2000s.
The NDVI values from GIMMS data for the same area as the Landsat images and
same year were also calculated to compare with forest areas (Table 2). The results showed
the GIMMS NDVI in the dry season (July, August and September) and the forest area
identified from the Landsat data, in the same areas and same years , have a significant
positive relationship (correlation coefficient: 0.8) (Fig. 8). Therefore, in the analysis of
GIMMS data, the NDVI values in dry season could be used as a proxy of total forest area.

Yi-Hua Wu
16
Table 2. The results of classification of Landsat images
Images number Path/ Row Date Forest Area
(km2)
Dry season NDVI
of GIMMS
L318006019800217 180/ 060 1980.02.17 4533.23 -
L318006119800217 180/ 061 1980.02.17 1182.88 -
L218006219760124 180/ 062 1976.01.24 2598.26 -
L318106019781231 181/ 060 1978.12.31 11308.90 -
L218106119760212 181/ 061 1976.02.12 5141.11 -
L218106219760125 181/ 062 1976.01.25 4300.40 -
L516806119841217 168/ 061 1984.12.17 1314.81 0.20
L516806219870225 168/ 062 1987.02.25 2149.87 0.26
L516906019860128 169/ 060 1986.01.28 5223.94 0.61
L516906119860128 169/ 061 1986.01.28 4151.46 0.39
L516906219870216 169/ 062 1987.02.16 1847.13 0.24
L716806020000221 168/ 060 2000.02.21 3284.45 0.31
L716806120020210 168/ 061 2002.02.10 1029.82 0.26
L716806220000221 168/ 062 2000.02.21 1861.89 0.23
L716906020030204 169/ 060 2003.02.04 4034.53 0.58
L716906120030308 169/ 061 2003.03.08 4052.49 0.41
L716906220030204 169/ 062 2003.02.04 1652.21 0.23

Table 3. The pattern of deforestation identified by Landsat images
a Wilcoxon Signed Ranks Test was used to examine the differences of forest area between the two periods
Path/Row Landmarks Forest (km2) in
1980s
Forest (km2) in
2000s
Decreasing
area (km2)
Decreasing Rate
(% per year) P-value a
168/ 060 Mountain Kenya; Aberdare Forest - 3284.45 - - 0.043
168/ 061 Gatamaiyo Forest; Nairobi city 1314.81 1029.82 284.99 1.20
168/ 062 Mountain Kilimanjaro 2149.87 1861.89 287.97 1.03
169/ 060 Mau forest 5223.94 4034.53 1189.42 1.34
169/ 061 Shompole Conservancy 4151.46 4052.49 98.97 0.14
169/ 062 Ngorongoro Conservation Area 1847.13 1652.21 194.92 0.66
Investigatio
n of D
eforestatio
n in
East Africa o
n Regio
nal Scales
17

Yi-Hua Wu
18
Fig. 5 Forest areas during 1976 to 1980

Investigation of Deforestation in East Africa on Regional Scales
19
Fig. 6 Forest areas during in 1980s
Yi-Hua Wu
20
Fig. 7 Forest areas during in 2000s

Table 4. The accuracy of classification for Landsat images
Images number Path/ Row Producer
Accuracy (%)aUser
Accuracy (%)aOverall
Accuracy (%)a Kappa
Coefficient aOverall
Accuracy (%)bKappa
Coefficient b P-value c
L318006019800217 180/ 060 92.39 80.97 81.1517 0.7637 81.1483 0.7636 0.002
L318006119800217 180/ 061 86.20 78.67 76.1097 0.7012 76.1097 0.7012 L218006219760124 180/ 062 86.97 82.07 77.7605 0.7370 77.6048 0.7352 L318106019781231 181/ 060 78.34 81.23 84.4550 0.8133 84.4535 0.8133 L218106119760212 181/ 061 93.89 71.94 78.0276 0.7422 78.0264 0.7422 L218106219760125 181/ 062 99.59 99.19 84.6880 0.8083 84.6874 0.8083 L516806119841217 168/ 061 86.88 89.23 82.0519 0.7846 81.3516 0.7762 L516806219870225 168/ 062 96.08 73.24 76.7311 0.7339 76.1935 0.7278 L516906019860128 169/ 060 98.78 90.71 86.9843 0.8439 86.9347 0.8433 L516906119860128 169/ 061 99.45 87.24 73.4398 0.6897 73.2454 0.6874 L516906219870216 169/ 062 95.10 99.88 94.3214 0.9290 90.5831 0.8823 L716806020000221 168/ 060 96.74 94.38 84.6343 0.8097 84.6343 0.8097 L716806120020210 168/ 061 97.00 92.29 83.3074 0.7989 82.9365 0.7944 L716806220000221 168/ 062 94.88 86.42 86.3646 0.8408 86.2548 0.8395 L716906020030204 169/ 060 84.58 95.47 83.2444 0.7988 83.2225 0.7986 L716906120030308 169/ 061 99.86 93.51 81.2248 0.7749 80.9473 0.7716 L716906220030204 169/ 062 97.17 99.92 92.3835 0.9047 91.3520 0.8918
a. The images for classification were stacking PCA component images and Tasseled Cap images b. The images for classification were original Landsat images
c. Wilcoxon Signed Ranks Test was used to examine the differences of accuracy of classification using two kinds of images
21
Investigatio
n of D
eforestatio
n in
East Africa o
n Regio
nal Scales

Yi-Hua Wu
22
Fig. 8 The relationship between annual mean dry season NDVI of GIMMS and forest
areas in Landsat images
3.2 NDVI of GIMMS
Using the GIMMS dataset, the annual mean dry season NDVI of three countries,
Kenya, Tanzania, and Uganda, between 1981 and 2006 were calculated. Several related
climate, economic and demographic indicators were also collected. Tables 5 to 7
summarize the descriptive statistics of the dry season NDVI values and related indicators
of three countries during the study period. The dry season NDVI in three countries
showed significant difference between each other (p<0.01). The NDVI had significantly
higher values in Uganda (mean value: 0.56) and lowest in Kenya (mean value: 0.28).
Comparing dry season NDVI among the three periods, 1980s, 1990s and 2000s, no
significant differences were observed in any of three countries. However, the dry season
NDVI still showed slowly decreasing pattern from 1981 to 2006 in Kenya and Uganda. In
Tanzania, the dry season NDVI was more constant during the study period (Fig. 9). The
spatial and temporal pattern of annual mean dry season NDVI were also presented in
Fig.10. Based on the Fig. 10, it showed that Uganda had the most pixels with NDVI
greater than 0.6, followed by Kenya and Tanzania. The greenness was slowly decreased
in Uganda and Kenya from 1980s to 2000s. At the same time, the pixels with NDVI
values greater than 0.4 were increased in Tanzania.

Investigation of Deforestation in East Africa on Regional Scales
23
The annual mean dry season NDVI of Mau forest, Mount Kilimanjaro, Mount
Kenya and Aberdars forest were also calculated. The distribution of dry season NDVI
between 1981 and 2006 in these four forest areas is shown in Fig 11. The results were not
consistent in these four forests. The dry season NDVI values in Mau forest had a slight
decrease during study period. However, the NDVI in other three forest areas had a similar
pattern with the NDVI of Tanzania.
Fig. 9 The distribution of annual mean NDVI of dry season from 1981 to 2006 in Kenya,
Tanzania and Uganda

Fig. 10 The spatiotemporal pattern of annual mean NDVI of dry season in East Africa in 1980s, 1990s and 2000s.
Y
i-Hua W
u
24

Fig. 11 The distribution of annual mean NDVI of dry season from 1981 to 2006 in four major forest areas
Investigatio
n of D
eforestatio
n in
East Africa o
n Regio
nal Scales
25

Yi-Hua Wu
26
3.3 Relationships between deforestation and possible drivers
The dry season NDVI in this study was used as the indicator of deforestation. A
decrease of the dry season NDVI would present the loss of forest areas. In the spearman
correlation test, the results showed small, negative but not statistically significant
correlations between dry season NDVI and population, birth rate, agricultural areas as
well as agricultural population in Kenya (Table 5). Gross domestic product (GDP) growth
and GDP per capita growth were significantly and positively related to dry season NDVI
in Kenya with simple linear regression analysis (Table 8).
In Tanzania, population growth, GDP per capita, life expectancy and arable land per
person also showed slightly negative but no significant correlations with dry season
NDVI by spearman correlation analysis (Table 6). Using simple linear regression analysis,
birth rate in Tanzania had a significant negative relationship with dry season NDVI. But
Cereal production showed a significant positive correlation with dry season NDVI (Table
8).
The weak negative but non-significant relationships between dry season NDVI and
population, cereal production, GDP, agricultural areas as well as agricultural population
were also observed in Uganda by spearman correlation test (Table 7). With simple linear
regression analysis, dry season NDVI was significant related to rainfall negatively (Table
8).
Multiple regression models were used to examine the possible drivers for
deforestation. (decreasing of dry season NDVI) (Table 9). In multiple regression model
analysis, rainfall was significantly associated with dry season NDVI both in Kenya and
Uganda, yet had diverse effects on their values. Agriculture value added (% of GDP)
showed significant positive relationships with dry season NDVI in Kenya and Uganda.
GDP per capita growth (annual %) also had a significantly positive correlation with dry
season NDVI in Kenya. For Tanzania, Cereal production and Life expectancy of people
in Tanzania were significant predictors of dry season NDVI.

Table 5. Descriptive statistics for annual mean NDVI of dry season and related indicators in Kenya during study period
Kenya 1980s 1990s 2000s Correlation Coefficient to
Dry season NDVIa
Dry season NDVI 0.283±0.023 0.280±0.018 0.278±0.008 -
Total population 19,723,154±1,975,504 26,968,696±2,357,310 33,834,739±1,908,026 -0.085
Birth rate (per 1,000 people) 47±2 39±1 39±0.3 -0.135
Cereal yield (kg per hectare) 1677.77±183.89 1588.47±173.32 1599.31±136.33 -0.002
GDP per capita (current US$) 357.69±30.24 362.08±80.94 462.57±79.53 0.227
Agricultural land
(% of land area) 45.9±1.01 47.16±0.5 47.25±0.23 -0.263
Agricultural population 15,941,222±1,450,585 20,946,200±1,502,406 25,042,857±1,069,010 -0.085
Temperature (℃) 22.84±0.64 22.64±0.82 22.9±0.68 0.290
Dew point temperature (℃) 18.59±0.27 18.55±0.15 18.61±0.26 -0.128
Rainfall (mm) 1,501.72±326.58 1,563.35±584.26 1,469.66±438.66 0.167 a. Correlation is analyzed by spearman correlation test
Investigatio
n of D
eforestatio
n in
East Africa o
n Regio
nal Scales
27

Table 6. Descriptive statistics for annual mean NDVI of dry season and related indicators in Tanzania during study period
Tanzania 1980s 1990s 2000s Correlation
Coefficient to Dry season NDVIa
Dry season NDVI 0.330±0.019 0.352±0.019 0.340±0.017 - Total population 21,865,143±1,843,855 29,439,756±2,649,568 37,016,402±2,154,669 0.375 Birth rate (per 1,000 people) 45±1 43±1 42±0 -0.370 Life expectancy (years) 50.91±0.28 50.21±0.33 52.37±1.31 -0.326 Cereal production (metric tons) 3,527,870.11±637,074.84 3,959,030.6±590,146.48 5,193,234.57±1,156,208.66 0.424* GDP per capita (current US$) - 209.92±54.32 333.57±29.13 -0.110 Agriculture value added (current US$)
- 2428736345.1±561289041.93 3600610178.43±402846578.42 -0.083
Agricultural land (% of land area)
37.88±0.59 38.38±0 38.93±0.38 0.184
Agricultural population 18,576,556±1,578,374 23,636,700±1,681,121 28,050,571±1,161,972 0.375 Arable land (hectares per person)
0.39±0.02 0.31±0.03 0.25±0.01 -0.350
Temperature (℃) 23.66±0.52 23.77±0.51 23.9±0.17 0.177 Dew point temperature (℃) 17.19±0.21 16.8±0.98 17.13±0.62 0.013 Rainfall (mm) 903.47±261.49 708.96±339.52 761.85±209.65 0.117
a. Correlation is analyzed by spearman correlation test. *. Correlation is significant at the 0.05 level (2-tailed).
28
Y
i-Hua W
u

Table 7. Descriptive statistics for annual mean NDVI of dry season and related indicators in Uganda during study period
Uganda 1980s 1990s 2000s
Correlation
Coefficient to Dry
season NDVIa
Dry season NDVI 0.57±0.012 0.554±0.036 0.556±0.012 -
Total population 14,917,869±1,396,944 20,654,970±1,999,041 26,957,768±1,881,014 -0.291
Birth rate (per 1,000 people) 49±0 49±1 47±0 0.206
Cereal production (metric tons) 1,231,520.56±211,937.79 1,822,080±229,600.27 2,369,571.43±153,534.86 -0.238
GDP per capita (current US$) 252.26±101.64 231.01±52.93 273.02±43.25 -0.032
Agriculture value added
(current US$) 56.02±1.86 47.9±5.73 26.48±2.41 0.106
Agricultural land
(% of land area) 58.24±2.17 61.46±0.43 63.34±0.98 -0.291
Agricultural population 12,642,000±1,105,039 17,019,900±1,390,156 21,042,429±1,135,240 -0.291
Temperature (℃) 22.7±0.68 23.24±0.54 22.96±1.44 -0.238
Dew point temperature (℃) 16.99±1.28 17.32±0.67 16.38±1.31 -0.429*
Rainfall (mm) 986.07±523.91 1,440.45±1963.95 924.45±121.03 -0.074 a. Correlation is analyzed by spearman correlation test
*. Correlation is significant at the 0.05 level.
Investigatio
n of D
eforestatio
n in
East Africa o
n Regio
nal Scales
29

Yi-Hua Wu
30
Table 8. Univariate linear regression models for deforestation in three countries
β Coefficient SE p-value R2
Kenya
1. GDP growth (annual %) 0.003 0.001 0.026 0.191
2. GDP per capita growth (annual %) 0.004 0.001 0.021 0.203
Tanzania 1. Birth rate (per 1,000 people) -0.006 0.002 0.014 0.228
2. Cereal production (metric tons) 0.00000001 0.000000004 0.031 0.180
Uganda
1. Rainfall (mm) -0.00001 0.000003 0.006 0.331
Table 9. Multiple regression models for deforestation in three countries
β Coefficient SE p-value R2
Kenya 0.436
Intercept 0.151 0.050 0.006
GDP per capita growth (annual %) 0.006 0.001 0.001
Agriculture value added (% of GDP) 0.003 0.001 0.034
Rainfall (mm) 0.00002 0.00001 0.018
Tanzania 0.382
Intercept 0.804 0.183 0.0002
Cereal production (metric tons) 0.00000002 0.000000004 0.001
Life expectancy (years) -0.01 0.004 0.012
Uganda 0.519
Intercept 0.542 0.013373929 <.0001
Agriculture value added (% of GDP) 0.001 0.000313971 0.016
Rainfall (mm) -0.00001 0.000003 0.0007
4. Discussion
In this study, two kinds of satellite images data, Landsat images and GIMMS dataset,
were used to examine the spatiotemporal distribution of deforestation in East Africa.
These two datasets have different spatial resolution. Landsat images with higher
resolution can provide more detailed information and are helpful to further understand the
local change of forest loss. The data with coarse resolution, such as GIMMS, can acquire
data widely and is useful to examine the change at regional or global scales. Therefore,
GIMMS was used in this study to investigate the deforestation of three East African

Investigation of Deforestation in East Africa on Regional Scales
31
countries. Landsat images were acquired to analyze tropical forest depletion of several
important forests in East Africa.
For Landsat images during 1970s to 2000s, the study areas focused on the forests
near Nairobi area, the largest city in East Africa, as well as Mountain Kilimanjaro, the
important habitat and intensively settled and cultivated area in Tanzania, and its
surroundings. According to the results, obvious deforestation during study period
occurred in Mau forest, located in northwest of Nairobi, the forest in Mountain
Kilimanjaro and Gatamaiyo forest close to Nairobi city. In East Africa, the expansion of
cultivation, and population growth were the major reasons for deforestation. With the
increasing population, small farmers had to convert more forest area into arable lands
(Rudel and Roper, 1996). Comparing to the report from FAO (FAO, 2010), the
deforestation rate in Tanzania of 1.2 % per year was close to the result of this study in
Mountain Kilimanjaro between 1980s and 2000s. However, the deforestation rate in Mau
forest and Gatamaiyo forest was four times higher than the average annual deforestation
in Kenya of 0.3 %. These results indicate that the forests near overpopulated city would
face more serious deforestation in comparison of average levels.
Previous studies with aerial photos and Landsat images were conducted to examine
the land use change in Mountain Kilimanjaro (Mbonile et al., 2003, Soini, 2002). Their
results both revealed that large forest loss in Mountain Kilimanjaro was caused by the
expansion of cultivation and increasing population pressure. Baldyga et al. (2007) using
Landsat images indicated that significant forest loss in Mau forest was due to a large area
in Mau forest converted to small-scale agricultural lands. Nkako et al. (2005) also
pointed out that the main causes of deforestation in Mau forest was settlement and
logging using an aerial survey.
Gatamaiyo forest is a part of Aberdares forest, but the image covering the major part
of Aberdares forest in 1980s was not acquired in this study. Therefore, it was difficult to
examine the deforestation in Aberdares forest between 1980s and 2000s. However,
comparing with the images of Landsat MSS in 1970s, clear forest loss in Aberdares forest
was still observed in this study. The forest area was declined about 37 % between 1978
and 2002. The research of Ochego (2003) also showed significant deforestation of 30 %
in the Aberdares forest during 1987 to 2000 using Landsat images. United Nations
Environment Programme conducted an aerial survey in Aberdares forest and confirmed
that the depletion of Aberdares forest was mainly because of logging, producing charcoal,
settlements, cultivation and grazing (Lambrechts et al., 2003).

Yi-Hua Wu
32
For Mount Kenya forest, the result showed the forest loss was about 12.7 % between
1980 and 2000 by comparing the Landsat MSS image and ETM+ image. It was close to
the study of Ndegwa (2005) that indicated 10.3 % of forest decrease in Mount Kenya
from 1978 to 1987 and 7.2 % from 1987 to 2002. The results also suggested the forest
destruction was mostly due to the development of plantation, especially between 1978
and 1987. Ngigi and Tateishi (2004) used Landsat images to investigate deforestation in
similar study area in Kenya with this study (Mount Kenya forest, Mau forest, Aberdares
forest and Eburu forest). Their results showed the forest in this area decreased totally at 2
% per year from 1987 to 2000. The results of this study also revealed similar pattern in
Mau forest and Gatamaiyo forest during 1980s to 2000s.
The results of this study showed pattern of deforestation consistent with other
research which used Landsat images or aerial photos. It proves that satellite images are a
useful tool to identify forests in tropical region. However, misclassification could happen
due to clouds, and the slope and aspect of topographic relief. The pixels that covered by
clouds or mountain shadow could easily be misclassified. For example, some agriculture
or urban areas located in the mountainside of Mount Kenya, Mount Kilimanjaro and Mau
forest that covered by mountain shadow could be classified as forest and the forest area
covered by shadow could be identified as non forest. Bias could occur in six images used
in this study with cloud covering that some pixels in both forest and cloud to be classified
as cloud. Meanwhile, the similarity of forest and other wooded areas in the dry region
could make it more difficult to distinguish in the classification process (FAO, 2010).
Baldyga et al. (2007) also pointed out the limitation of Landsat images to discriminate
from similar land use types. These kinds of bias become unavoidable when using satellite
images. Image enhancement which emphasizes the difference of features would be
helpful to separate similar land use types in tropical and high relief landscapes, such as
NDVI, Tasseled Cap transformations and PCA (Baldyga et al., 2007, Ndegwa, 2005).
PCA could decrease the noise of the original images and highlight the image features.
The vegetation index derived from Tassel Cap transformation can help analysts to clearly
identify different types of vegetation. Baldyga et al. (2007) used the images stacking
original Landsat images, Tassel Cap image and NDVI image to perform image
classification with Kappa Coefficient of 0.76. Similar method was also used by Ndegwa
(2005) to conduct image classification on the images comprised Landsat images, PCA
component images, Tasseled Cap images and NDVI images with high Kappa Coefficient,
over 0.85. Therefore, in this study the images stacking Tasseled Cap images and PCA

Investigation of Deforestation in East Africa on Regional Scales
33
component images from Landsat images were used to decrease the occurrences of bias.
Most of the results presented a very good reliability of the performance for
classification with Kappa Coefficient that over 0.75 for classification (Jones and Vaughan,
2010, Monserud and Leemans, 1992). Comparing the Kappa coefficient of the
classification using original images, the results of this study showed that supervised
classification using the images comprised Tasseled Cap images and PCA component
images could have a better result than which using only original Landsat data. It also
indicated that the images comprising Landsat enhancement images, such as Tasseled Cap
images and PCA component images, would be a possible solution to reduce bias and
improve the accuracies in classification process for forests in tropical region.
The second part of this study was to use GIMMS dataset to examine the
deforestation in Kenya, Tanzania and Uganda. Annual mean NDVI of dry season was
derived to be a proxy of total forest areas. NDVI in dry season might be helpful to
represent forest area since only woody plant is still green in this period. In this study, the
forest areas in Landsat images were compared with NDVI in dry season of the same
location and year. According to the statistic analysis, annual mean NDVI of July, August
and September showed the highest correlation with the forest areas of Landsat images,
rather than the whole dry season (June to September). It showed a lag effect of vegetation
for the coming of dry season. Due to the two dry seasons in these three countries, the dry
season in winter was also analyzed. However, NDVI in second dry season (January and
February) was much less correlated with forest areas of Landsat data (R2= 0.06).
Therefore, mean dry season NDVI was derived from NDVI in July, August and
September.
A significant decrease in annual mean dry season NDVI was expected in all three
countries. However, the results only showed a non significant and slow decrease of NDVI
in Kenya and Uganda. NDVI in Tanzania were constant and slightly increased during the
study period. The similar pattern was also found in the results of Pelkey et al. (2000).
Pelkey et al. used NDVI values derived from Pathfinder AVHRR land (PAL) data from
1982 to 1994 with resolution of 8 km to map the change of vegetation cover in Tanzania.
A vegetation map collected from Landsat images was used to define the area of various
vegetation types. The result of Pelkey et al. showed the monthly NDVI over Tanzania and
in forest areas increased from 1981 to 1994, likely due to the regeneration and protection.
Other types of vegetation, such as swamp, had a significant decrease in NDVI values. In
this study, annual mean dry season NDVI were also calculated in Mau forest, Mount

Yi-Hua Wu
34
Kenya, Mount Kilimanjaro and Aberdares forest and showed similar results with Pelkey
et al. The study of Kinyanjui (2010) also found that annual NDVI of different forest
blocks of Mau forest varied smoothly during 1999 to 2009. Both studies of Pelkey et al.
and Kinyanjui indicated that NDVI is useful to examine the resilience of forest and
vegetation health.
In this study the results showed that the greenness showed no significant changes
in the three countries between 1981 and 2006. However, large loss of forest area was
indicated in Tanzania and Uganda and small scale of deforestation in Kenya (FAO,
2010).These results might indicate that the recovery ability of forest was slightly higher
in Tanzania and a bit weak in Kenya and Uganda. Kinyanjui (2010) also confirmed the
resilience of forest was slightly lower in Mau forest. But it is still needed to get further
information to figure out the real situation. The consistent findings indicated that NDVI
is more applicable to measure the greenness or density of vegetation types, rather than to
monitor the change of forest area. NDVI values are correlated with the radiation of
photosynthetically activity absorbed by the vegetation (Rees, 2001). NDVI could present
the greenness of vegetation or biomass of green plant, but would be insufficient to define
the accurate total area and range of forest area.
In statistical analysis, dry season NDVI was used as dependent variable to represent
the total forest areas. Possible drivers, such as population statistics and economic
indicators were applied to examine the relationships with deforestation. Significant
negative correlations between the dry season NDVI and economic development and
population growth were expected to be found out with statistical analysis. Unexpectedly,
the results showed GDP growth in Kenya was a positive factor both in univariate and
multiple regression models. Cereal production had a very small positive relationship with
dry season NDVI in Tanzania in both univariate and multiple regression models. The
possible driver in Uganda was rainfall, with a negative correlation. Meanwhile, the
estimates of these relationships were very small, which indicated that even if they showed
statistical significant correlations, the influence of these factors for the change of NDVI
was quite small. The contradictory results of regression model analysis in this study could
be because of the spatial resolution of GIMMS is too low to identify forest areas
accurately and the characteristic of NDVI is not applicable as a proxy for total forest area.
With this small range of NDVI values, varied from -1 to 1, it is difficult to use NDVI to
quantify the loss of forest area. The coarse resolution of GIMMS made NDVI of GIMMS
to be more unsuitable to detect the change of deforestation. Misclassification could occur

Investigation of Deforestation in East Africa on Regional Scales
35
in the mixed pixels that are both part of forest and non forest. Dent and Bai (2008)
suggested that the study using NDVI should compare with fieldwork to get more
information about ground truth and confirm the reliability and accuracy of NDVI data.
Moreover, underestimation of total forest area might be occurred when using NDVI of
dry season since some deciduous forest cloud lose their leaves or become yellowish in
the dry season. It needs more information and field studies to verify the bias could be
caused by the underestimation. Another possible reason for the ambiguous results could
be few sample number for statistic analysis, since only 25 values of annual mean NDVI
of the dry season for each countries. The correlation between possible drivers and dry
season NDVI of GIMMS could be more complex. More information about the
interactions as well as possible confounding and modifying factors are needed to be
considered.
The spatial and temporal distribution of deforestation in East Africa was
successfully identified by Landsat images in this study. But the possible drivers for
deforestation in East Africa were still unclear in this study with NDVI of GIMMI dataset.
For future studies, using high resolution satellite images and conducting a long term study
to gather more information will be more helpful for further examine the pattern of
deforestation and the possible drivers. At the same time, using Landsat images to study
the deforestation in tropical areas, classification should be performed on the images that
comprised enhancement images to improve the separability of classification.
5. Conclusion
Obvious deforestation was revealed in East Africa between 1970s and 2000s using
Landsat satellite images, especially in Mau forest, Mount Kilimanjaro and Aberdares
forest. The forests near overpopulated city faced more serious deforestation. In this study,
it is shown that using the images that comprising enhancement images transformed from
original images would be a better approach to mapping forest areas. The GIMMS NDVI
dataset is not a good proxy of total forest areas probably because of the coarse resolution
of GIMMS dataset and the characteristics of NDVI. More auxiliary information is needed
to analyze the deforestation with GIMMS NDVI. Therefore, future studies of
deforestation should use higher resolution satellite images and collect more detailed
information.

Yi-Hua Wu
36
6. References
Achard, F., Eva, H., Stibig, H.-J., Mayaux, P., Gallego, J., Richards, T. & Malingreau, J. P.
2002: Determination of deforestation rates of the world's humid tropical forests.
Science 297, 999-1002.
Baldyga, T. J., Miller, S. N., Driese, K. L. & Gichaba, C. M. 2007: Assessing land cover
change in Kenya’s Mau Forest region using remotely sensed data. African Journal of Ecology 46, 46-54.
Boahene, K. 1998: The challenge of deforestation in tropical Africa: reflections on its
principal causes, consequences and solutions. Land Degradation & Development 9, 247-258.
Byrne, G. F., Crapper, P. F. & Mayo, K. K. 1980: Monitoring land-cover change by
principal component analysis of multitemporal landsat data. Remote Sensing of Environment 10, 175-184.
Campbell, J. B. 2002a: Accuracy assessment. Introduction to remote sensing. The
Guilford Press, New York, USA, 383-403.
Campbell, J. B. 2002b: Feature extraction. Introduction to remote sensing. The Guilford
Press, New York, USA, 491-294.
Campbell, J. B. 2002c: Minimum distance classification. Introduction to remote sensing. The Guilford Press, New York, USA, 341-342.
Campbell, J. B. 2002d: Plant sciences. Introduction to remote sensing. The Guilford Press,
New York, USA, 450-481.
Crist, E. P., Laurin, R. & Cicone, R. C. 1986: Vegetation and soils information
contained in transformed Thematic Mapper data. Proceedings of IGARSS' 86 Symposium. Paris, France.
Dent, D. L. & Z.G., B. 2008: Assessment of land degradation using NASA GIMMS: a
case study in Kenya. Digital Soil Mapping with Limited Data. International Soil
Reference and Information Centre.
FAO 2001: Global Forest Resources Assessment 2000. Main Report. FAO Forestry Paper. Food and Agriculture Organization of the United Nations, Rome.
FAO 2010: Global Forest Resources Assessment 2010. Main Report. FAO Forestry Paper. Food and Agriculture Organization of the United Nations, Rome.
Gibbs, H. K., Ruesch, A. S., Achard, F., Clayton, M. K., Holmgren, P., Ramankutty, N. &
Foley, J. A. 2010: Tropical forests were the primary sources of new agricultural
land in the 1980s and 1990s. PNAS 107, 16732–16737.
Halperin, J. & Shear, T. 2005: An assessment of rainforest distribution and threats in the
west Usambara mountains, Tanzania. Geocarto International 20, 51-61.
Hansen, M. C. & DeFries, R. S. 2004: Detecting long-term global forest change using

Investigation of Deforestation in East Africa on Regional Scales
37
continuous fields of tree-cover maps from8-km Advanced Very High Resolution
Radiometer (AVHRR) data for the years 1982-99. Ecosystems 7, 695-716.
Hemp, A. 2006: Vegetation of Kilimanjaro: hidden endemics and missing bamboo.
African Journal of Ecology 44, 305-328.
Huang, C., Wylie, B., Yang, L., Homer, C. & Zylstra, G. 2002: Derivation of a tasselled
cap transformation based on Landsat 7 at-satellite reflectance. International Journal of Remote Sensing 23, 1741-1748.
Hudak, A. T. & Wessman, C. A. 2000: Deforestation in Mwanza District, Malawi, from
1981 to 1992, as determined from Landsat MSS imagery. Applied Geography 20,
155-175.
Jones, H. G. & Vaughan, R. A. 2010: Remote sensing of vegetation: principles, techniques, and applications., Oxford University Press, New York, USA, 353.
Kiage, L. M., Liu, K. B., Walker, N. D., Lam, N. & Huh, O. K. 2007: Recent
land-cover/use change associated with land degradation in the Lake Baringo
catchment, Kenya, East Africa: evidence from Landsat TM and ETM+.
International Journal of Remote Sensing 28, 4285-4309.
Kinyanjui, M. J. 2010: NDVI-based vegetation monitoring in Mau forest complex, Kenya.
African Journal of Ecology 49, 165-174.
Lambrechts, C., Woodley, B., Chruch, C. & Gachanja, M. 2003: Aerial survey of the
destruction of the Aberdare Range forests. UNEP, KWS, Rhino Ark, KFWG.
Lambrechts, C., Woodley, B., Hemp, A., Hemp, C. & Nnyiti, P. 2002: Aerial survey of the
threats to Mt. Kilimanjaro forests. UNDP/GEF Small Grants Programme, Dar es
Salaam, Tanzania.
Landis, J. R. & Koch, G. G. 1977: The measurement of observer agreement for categorical
data. Biometrics 33, 159-174.
Malinverni, E. S. & Fangi, G. 2010: Deforestation Analysis by Multi-temporal Landsat
Imagery in the Bulisa Region (Uganda). 30th EARSeL Symposium. Remote Sensing for Science, Education, and Natural and Cultural Heritage. Paris,
France.
Mayaux, P., Holmgren, P., Achard, F., Eva, H., Stibig, H.-J. & Branthomme, A. 2005:
Tropical forest cover change in the 1990s and options for future monitoring.
Philosophical Transactions of The Royal Society B: Biological Sciences 360, 373
- 384.
Mbonile, M. J., Misana, S. B. & Sokoni, C. 2003: Land use change patterns and root
causes on the southern slopes of Mount Kilimanjaro, Tanzania. LUCID Working Paper. International Livestock Research Institute, Nairobi, Kenya.
McSweeney, C., New, M. & Lizcano, G. 2008a: UNDP Climate Change Country
Profiles-Kenya. UNDP.
McSweeney, C., New, M. & Lizcano, G. 2008b: UNDP Climate Change Country

Yi-Hua Wu
38
Profiles-Tanzania. UNDP.
McSweeney, C., New, M. & Lizcano, G. 2008c: UNDP Climate Change Country
Profiles-Uganda. UNDP.
Monserud, R. A. & Leemans, R. 1992: Comparing global vegetation maps with the
Kappa statistic. Ecological Modelling 62, 275-293.
Mwavu, E. N. & Witkowski, E. T. F. 2008: Land-use and cover changes (1988–2002)
around budongo forest reserve, NW Uganda: implications for forest and
woodland sustainability. Land Degradation & Development 19, 606-622.
Ndegwa, L. W. 2005: Monitoring the Status of Mt. Kenya Forest Using Multi-Temporal
Landsat Data. Department of Geography. Miami University Oxford, Ohio, USA.
Ngigi, T. G. & Tateishi, R. 2004: Monitoring deforestation in Kenya. International Journal of Environmental Studies 61, 281 - 291.
Nkako, F. M., Lambrechts, C., Gachanja, M. & Woodley, B. 2005: Maasai Mau Forest
Status Report 2005. Ewaso Ngiro South Development Authority, Narok, Kenya.
Obua, J. & Agea, J. G. 2010: Forests and forestry in Uganda. IN Bongers, F. & Tennigkeit,
T. (Eds.) Degraded Forests in Eastern Africa: management and restoration. Earthscan, London, UK, 65-88.
Ochego, H. 2003: Application of Remote Sensing in Deforestation Monitoring: A Case
Study of the Aberdares (Kenya). 2nd FIG Regional Conference. Marrakech,
Morocco.
Pelkey, N. W., Stoner, C. J. & Caro, T. M. 2000: Vegetation in Tanzania: assessing long
term trends and effects of protection using satellite imagery. Biological Conservation 94, 297-309.
Prins, E. & Kikula, I. S. 1996: Deforestation and regrowth phenology in miombo
woodland-assessed by Landsat Multispectral Scanner System data. Forest Ecology and Management 84, 263-266.
Rees, W. G. 2001: Band transformations. Physical principles of remote sensing. Cambridge University Press, Cambridge, UK, 291-296.
Roy, P. S., Dutt, C. B. S. & Joshi, P. K. 2002: Tropical forest resource assessment and
monitoring. Tropical Ecology 43, 21-37.
Rudel, T. & Roper, J. 1996: Regional patterns and historical trends in tropical
deforestation, 1976-1990: a qualitative comparative analysis. Ambio 25, 160-166.
Rudel, T. K., Defries, R., Asner, G. P. & Laurance, W. F. 2009: Changing drivers of
deforestation and new opportunities for conservation. Conservation Biology 23,
1396–1405.
Soini, E. 2002: Changing landscapes on the southern slopes of Mt. Kilimanjaro, Tanzania:
An aerial photo interpretation between 1961 and 2000. Working Paper World
Agroforestry Centre (ICRAF)
Strömquist, L. & Backéus, I. 2009: Integrated landscape analyses of change of miombo

Investigation of Deforestation in East Africa on Regional Scales
39
woodland in Tanzania and its implication for environment and human livelihood.
Geografiska Annaler: Series A, Physical Geography 91, 31-45.
Tucker, C., Pinzon, J., M., B., Slayback, D., Pak, E., Mahoney, R., Vermote, E. & El
Saleous, N. 2005: An extended AVHRR 8-km NDVI dataset compatible with
MODIS and SPOT vegetation NDVI data. International Journal of Remote Sensing 26, 4485-4498.
UNEMA 2007: State of the environmnent report for Uganda 2006/2007. Uganda National
Environment Management Authority,, Kampala, Uganda.
William, C. M. 2003: The implications of land use change on forests and biodiversity: a
case of the "half mile strip" on Mount Kilimanjaro, Tanzania. LUCID Working Paper. International Livestock Research Institute, Nairobi, Kenya.