investigation of accelerated stress - nasa invest of... · investigation of accelerated stress...
TRANSCRIPT
rw
DPD Line Item No. SE-7 DOE/JPL-954929-83/ 10
INVESTIGATION OF ACCELERATED STRESSFACTORS AND FAIWREJDE GRADATION
MECHANISMS IN TERRESTRIALSOLAR CELLS
(NASA-CR-173757) INVESTIGATION OF N84-28222ACCELERATED STRESS FACTORS ANDFAILURE/DEGRADATION BECRAYISfiS INTERRESTRIAL SOLAR CELLS Annual Report Unclas(Clemson Univ.) 121 p RC A06/tlF A01 ;3/44 19840
FOURTH ANNUAL `KEPORT
' OCTOBER 19 8 3
J.W. Lathrop+ Department of Electrical and Computer Engineering
Clemson University, Clemson, SC 29631
F qPREPARED FOR 'p^cGC^
JET , PROPULSION LABORATORY '9^^`
October 1983
y
DRD Line Item No. SE-7
t
s
^.Y
{I
4
ii
PHOTOVOLTAIC CELL RELIABILITY RESEARCH
INVESTIGATION OF ACCELERATED STRESS FACTORSAND FAILURE/DEGRADATION MECHANISMS IN TERRESTRIAL SOLAR CELLS
Z
s.e
FOURTH ANNUAL REPORT
R
I
J.W. Lathrop
1
Department of Electrical and Computer EngineeringClemson University, Clemson, SC 29631
DOE/JPL - 954929-83/10
ENGINEERING AREA
The JPL Flat-Plate Solar Array Project is sponsored by the U.S. Departmentof Energy and is part of the Photovoltaic Energy Systems Program to
4 initiate a major effort toward the development of cost-competitive solararrays. This work was performed for the Jet Propulsion Laboratory,California Institute of Technology by agreement between NASA and DOE.
ii
q^
k.
R
a
CLEMSON PERSONNEL
Persons contributing to the work covered in this report include%
s
Dr. Jay W. Lathrop -- Principal Investigator
j Mr. Dexter C. Hawkins -- Research Associate
Ms. Clara White Davis -- Graduate Student(Schottky barrier formation)
Mr. Konstantinos Misiakos -- Graduate Student(Schottky barrier formation)
a
Mr. Foster B. White -- Graduate Student(Sulfur dioxide tests)(Encapsulated call testing)
Mr. H. Jarrett Cassell, Jr. — — Undergraduate Student
Mr. Thomas A. Bolin — — Undergraduate Student
Mr. Keith E. Summer -- Undergraduate Student
Mr. Paul Williamson -- Undergraduate Student
Mr. M. Lloyd Wright -- Undergraduate Student
^._.:..^. __'1^4TR!^1 ......^ ..^. ... .. ... .• v.-_. ...^....,... ^..^..:. n .: • ..,:f9}',^.{PAPMJ^A gR.rr^{^ `
n "^
ACKNOWLEDGEMENT
The Jet Propulsion Laboratory Technical Manager for this work was Mr.
Edward L. Royal. His assistance in acquiring test samples and in supplying
technical guidance to the program is gratefully acknowledged.
The assistance of Dr. R. G. Delumyea of the Clemson University
Chemistry Department, who made many helpful suggestions concerning
development of the sulfur dioxide test, is gratefully acknowledged.
^M
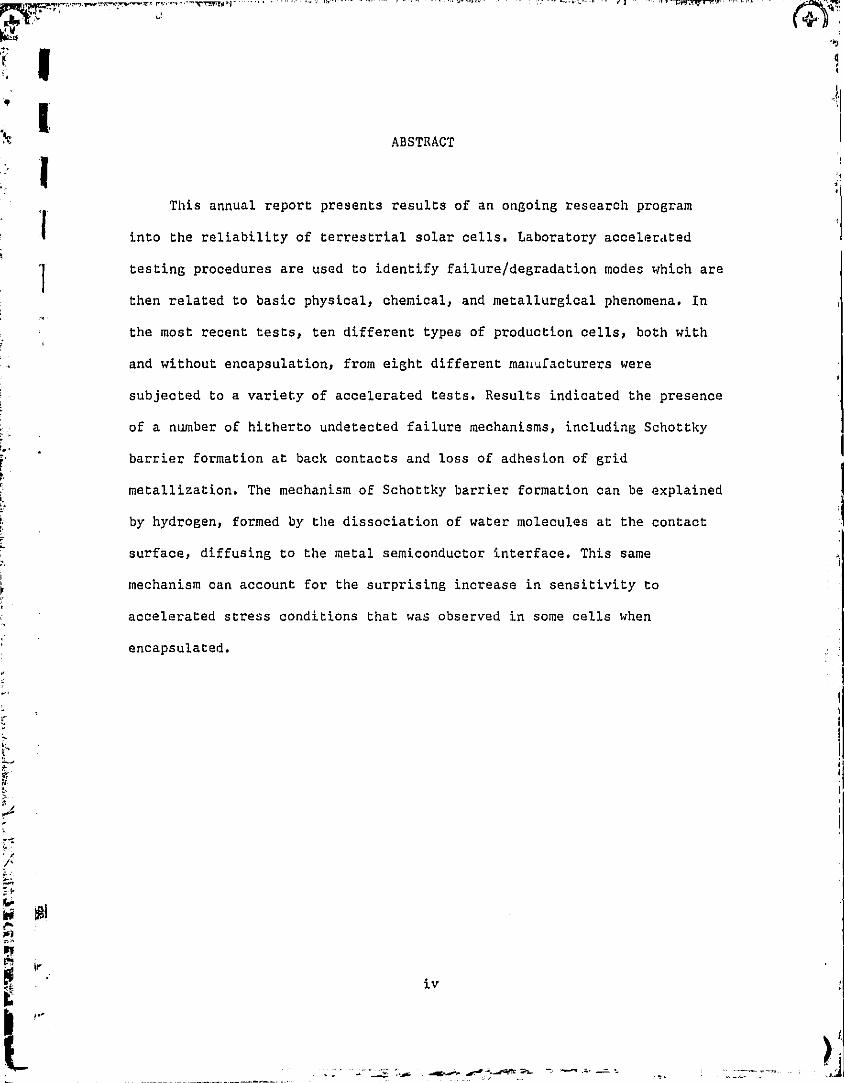
ABSTRACT
This annual report presents results of an ongoing research program
into the reliability of terrestrial solar cells. Laboratory accelerated
testing procedures are used to identify failure/degradation modes which are
then related to basic physical, chemical, and metallurgical phenomena. In
the most recent tests, ten different types of production cells, both with
and without encapsulation, from eight different manufacturers were
subjected to a variety of accelerated tests. Results indicated the presence
of a number of hitherto undetected failure mechanisms, including Schottky
barrier formation at back contacts and loss of adhesion of grid
metallization. The mechanism of Schottky barrier formation can be explained
by hydrogen, formed by the dissociation of water molecules at the contact
surface, diffusing to the metal semiconductor interface. This same
mechanism can account for the surprising increase in sensitivity to
accelerated stress conditions that was observed in some cells when
encapsulated.
iv
•Y;
d

Yf
I
4
Y5•n ^1 ... V ^1'1.T
rr
EXECUTIVE SUMMARY
This annual report is a summary of reliability research being
conducted at Clemson University relating to failure/degradation mechanisms
which can occur at the basic cell level. The research approach taken is to
7
first detect the mechanical change and/or electrical degradation, which is
charateristic of a particular cell construction, through the use of
laboratory accelerated testing procedures, and then through detailedYl
analysis to determine the basic physical, chemical, or metallurgical
phenomena involved. In this report recent test results have been tabulated
and the degradation mechanisms identified where possible for ten different
unencapsulated state-of-the-art crystalline cell types from eight different3
manufacturers. Major program accomplishments are identified in vhis
executive summary.
Schottky Barrier Contact Formation
Accelerated testing of unencapsulated cells uncovered a new degradation
mechanism, not previously identified, affecting one type of cell
construction. In this case degradation was accompanied by the formation of
a distinctly non-linearity IV characteristic, primarily after exposure to
bias-temperature testing, which greatly reduced the cell's maximum power
output. It was concluded that a rectifying Schottky barrier had formed at
the back contact. The particular cell construction where this was observed
had a lightly doped substrate (no back surface field) and relied on a high
concentration of surface states to give a low barrier height and consequent
P^
t-y V
N,
9
^{w
^ Yokj
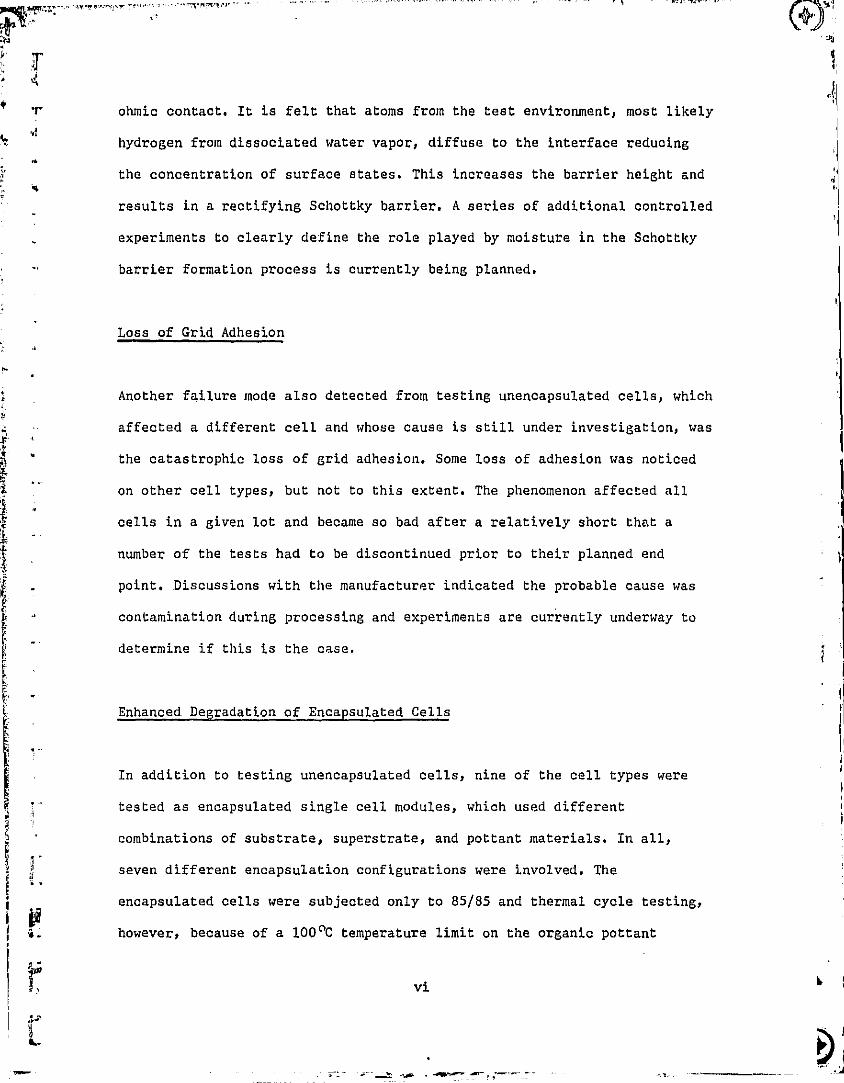
* r ohmic contact. It is felt that atoms from the test environment, most likely
1hydrogen from dissociated water vapor, diffuse to the interface reducing
'p the concentration of surface states. This increases the barrier height and d
results in a rectifying Schottky barrier. A series of additional controlled
experiments to clearly define the role played by moisture in the Schottky
barrier formation process is currently being planned.
Loss of Grid Adhesion
Another failure mode also detected from testing unencapsulated cells, which
affected a different cell and whose cause is still under investigation, was
° the catastrophic loss of grid adhesion. Some loss of adhesion was noticed
on other cell types, but not to this extent. The phenomenon affected all
cells in a given lot and became so bad after a relatively short that a
number of the tests had to be discontinued prior to their planned end
point. Discussions with the manufacturer indicated the probable cause was
contamination during processing and experiments are currently underway to
determine if this is the case.
Enhanced Degradation of Encapsulated Cells
In addition to testing unencapsulated cells, nine of the cell types were
tested as encapsulated single cell modules, which used different
combinations of substrate, superstrate, and pottant materials. In all,
seven different encapsulation configurations were involved. The
encapsulated cells were subjected only to 85/85 and thermal cycle testing,
however, because of a 100 0C temperature limit on the organic pottant
vi 4
4 !^ J
T
tP,
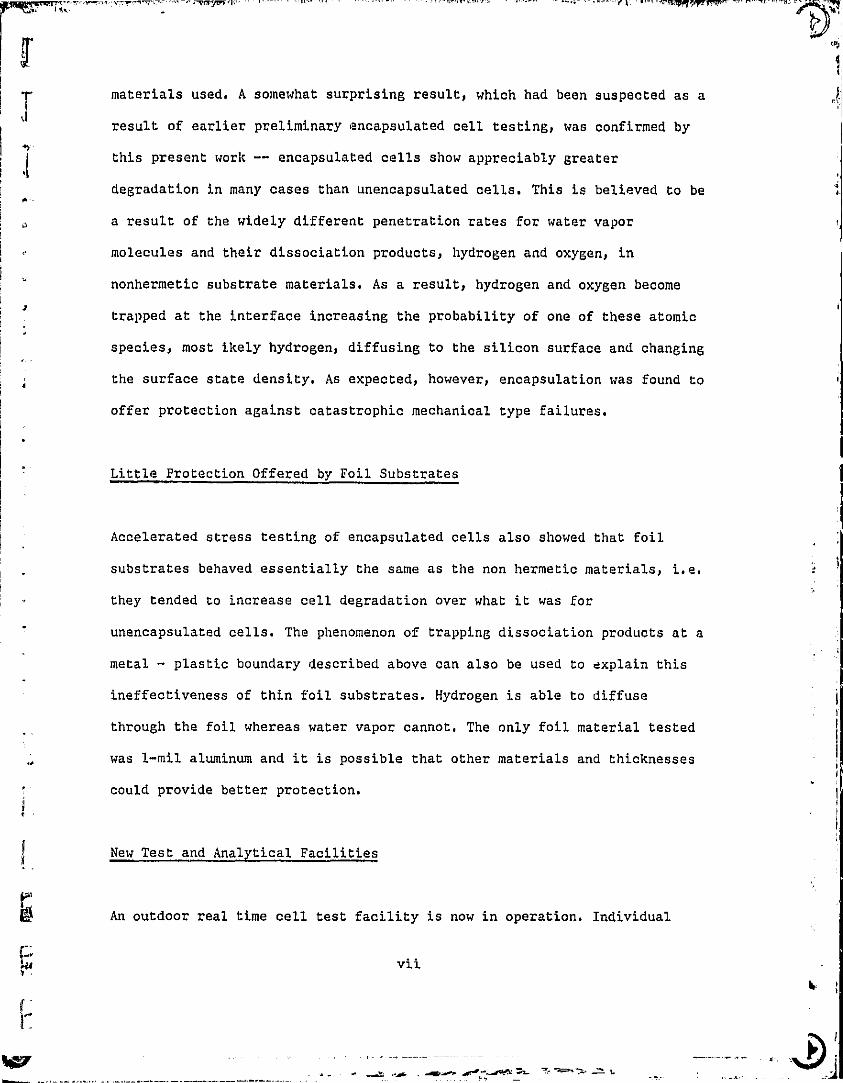
materials used. A somewhat surprising result, which had been suspected as a
result of earlier preliminary encapsulated cell testing, was confirmed by
this present work -- encapsulated cells show appreciably greater
degradation in many cases than unencapsulated cells. This is believed to bep..
a result of the widely different penetration rates for water vapor
molecules and their dissociation products, hydrogen and oxygen, in
nonhermetic substrate materials. As a result, hydrogen and oxygen become
trapped at the interface increasing the probability of one of these atomic
species, most ikely hydrogen, diffusing to the silicon surface and changing
the surface state density. As expected, however, encapsulation was found to
offer protection against catastrophic mechanical type failures.
Little Protection Offered by Foil Substrates
Accelerated stress testing of encapsulated cells also showed that foil
substrates behaved essentially the same as the non hermetic materials, i.e.
they tended to increase cell degradation over what it was for
unencapsulated cells. The phenomenon of trapping dissociation products at a
metal — plastic boundary described above can also be used to explain this
ineffectiveness of thin foil substrates. Hydrogen is able to diffuse
through the foil whereas water vapor cannot. The only foil material tested
was 1—mil aluminum and it is possible that other materials and thicknesses
could provide better protection.
New Test and Analytical Facilities
An outdoor real time cell test facility is now in operation. Individual
r•;vii
VW
► .
Q.
J`
.' ^.vr,+.?up•R-... n: ter.-.-. ^.^q; p!'Tl'__'_._... ,. R,.., ,...,'r a _....., ..., .. .. r r. .c v..m •. ,....
^A^I,,
too
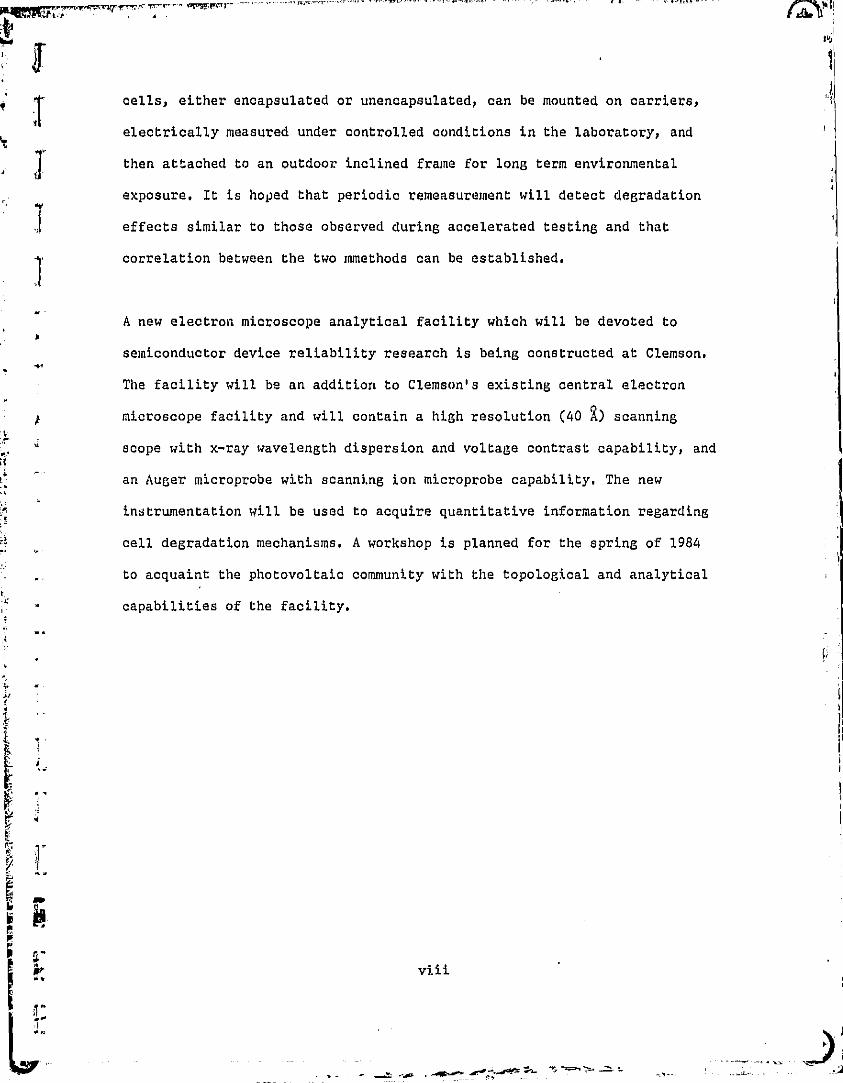
cells, either encapsulated or unencapsulated, can be mounted on carriers,
relectrically measured under controlled conditions in the laboratory, and
then attached to an outdoor inclined frame for long term environmental
exposure. It is hoped that periodic remeasurement will detect degradation
effects similar to those observed during accelerated testing and that
correlation between the two mmethods can be established.
A new electron microscope analytical facility which will be devoted to
semiconductor device reliability research is being constructed at Clemson.
The facility will be an addition to Clemson's existing central electron
} microscope facility and will contain a high resolution (40 ^) scanning
scope with x-ray wavelength dispersion and voltage contrast capability, and
an Auger microprobe with scanning ion microprobe capability. The new
Instrumentation will be used to acquire quantitative information regarding
cell degradation mechanisms. A workshop is planned for the spring of 1984i
to acquaint the photovoltaic community with the topological and analytical
capabilities of the facility.
. k.
I
r,^
viiiJe
1^^
T4I
w
TABLE OF CONTENTS
Section Page
CLEMSON PERSONNEL ....................................................ii
ACKNOWLEDGEMENT ......................................................iii
ABSTRACT .............................................................iv
EXECUTIVE SUMMARY ....................................................v
TABLEOF CONTENTS ....................................................ix
LIST OF FIGURES ......................................................x
LIST OF TABLES .......................................................xi
1.0 INTRODUCTION ....................................................1
2.0 ACCELERATED STRESS TESTING OF UNENCAPSULATED CELLS ..............92.1 Description of Cells ........................................92.2 Description of Tests .......................................162.3 Test Results ...............................................20
3.0 STRESS TESTING OF ENCAPSULATED CELLS ...........................473.1 Introduction ...............................................473.2 85/85 Test Results .........................................503.3 Thermal Cycle Test Results .................................56
4.0 DETERMINATION OF FAILURE MECHANISMS ............................594.1 Introduction .. .. ... ..................................594.2 Schottky Barrier Formation .................................604.3 Loss of Grid Adhesion.. ...............................684.4 New Clemson Research Facility ..............................69
5.0 ADDITIONAL TEST DEVELOPMENT ....................................755.1 Introduction ....... ........................... .........755.2 Outdoor Real-Time Testing ..................................755.3 Sulfur Dioxide Testing .....................................79
6.0 CONCLUSIONS ....................................................83
7.0 NEW TECHNOLOGY .................................................87
8.0 PROGRAM RESEARCH CONTRIBUTIONS .................................91
9.0 REFERENCES .....................................................95
APPENDIX A. Design of SOp Accelerated Test System
APPENDIX B. Method of Determining Metal-Semiconductor Barrier Height
APPENDIX C. Publication Abstracts
ix
J
a^^nwY"+ a.al'.^aaRim •/T +^t^ifOY^ -^,.i1•T!1'1"T.S)T11S. YSR^
ti
h
LIST OF FIGURES
Figure Page1 Photographs of Cells in the Unencapsulated Test Program ..............11
2 Photograph of Initial Plating Defect .................................17
3 Clemson Accelerated Test Schedule for Unencapsulated Cells ........... 18
4 Examples of "Moderate" Mechanical Defects ............................29
5 Photograph of Thermal Shock Induced Defect .........................43
6 Typical Characteristics of Cells Subjected to 8-T testing ............ 61
7 Simulation of Non-Linear Contact Degradation .........................62
8 IV Characteristic of a Q-Cell after 600 Hours at 150 C as Fittedby SPICE Model Incorporating a Rectifying Contact... ...... I ...... iA
9 150OX SF.M Photographs of Cell surfaces ...............................70
10 Photograph of Outdoor Real-Time Test Arrays ......................... 17
11 Photograph of Typical Cell Holder/Carrier for Real-Time Test......... 78
a
F
Ir°
i x
y
^!'.
T
14
LIST OF TABLES
Table Page
1 Unencapsulated Cell Types Classified by Primary Metallization ..... 10
2 Unencapsulated Cell 8-T Test Results (Electrical Degradation) ..... 23
3 Unencapsulated Cell 8-T Test Results (Catastrophic Mechanical) .... 27
4 Unencapsulated Cell 85/85 Test Results (Electrical Degradation) ... 31
5 Unencapsulated Cell 85/85 Test Results (Catastrophic Mechanioal)..32
6 Unencapsulated Cell PC Test Results (Electrical Degradation) ...... 33
7 Unencapsulated Cell PC Test Results (Catastrophic Mechanical) ..... 35
8 Unencapsulated Cell Thermal Cycle Test Results (ElectricalDegradation) ..................................................37
9 Unencapsulated Cell Thermal Cycle Test Results (CatastrophicMechanical) ...................................................38
10 Unencapsulated Cell Thermal Shock Results (ElectricalDegradation) ..................................................40
11 Unencapsulated Cell Thermal Shock Results (CatastrophicMechanical) ...................................................41
12 Status of Encapsulated Cell 85/85 Testing .........................49
13 Average % Decrease in Maximum Power for Encapsulated CellsSubjected to 2000 hours of 85/85 Testing ......................52
I"^F'
tLxi
J
r1.0 INTRODUCTION
iy
v ^-
1 rr„
1 L
77^'
.^ ,..`.. .•:',., r ... .. ...: .. .. .._ .._ - .. ....... ,. ...
it,,,"..^„ .1
1
i1.0 INTRODUCTION
This is the Fourth Annual Report on the Investigation of Accelerated
Stress Factors and Failure/Degradation Mechanisms in Terrestrial Solar
Cells, a photovoltaic cell reliability research program which has been
conducted by Clemson University for the Flat-Plate Solar Array (FSA) Project
of the Jet Propulsion Laboratories, The objective of the research is the
determination of fundamental physical, chemical, and metallurgical phenomena
which cause solar cells to degrade with time, The approach followed was to
design laboratory test procedures which would accelerate anticipated field
failure modes, and then to subject quantities of different types of
commercially available cells to them. Testing was performed on both
encapsulated and unencapsulated cells. The electrical and physical results
of this testing could then be analyzed in an effort to identify tho basic
phenomena underlying the degradation. Corrective action would then be
possible during manufacture to avoid the observed problem. Tht program was
initiated in December of 1977 and earlier reports (1,2,3,4) have discussed
many of the experimental and analytical methods employed, the data collected
on several types of cells, and a number of preliminary conclusions. It is
i the purpose of this report to present the results obtained on the mostk,
m' recent group of cells which have undergone testing, to describe new.r:'c
degradation mechanisms and phenomena which were found, and to discuss new
analytical methods currently under development.
110 tt
As a result of their inherent simplicity, coupled with the lack of
by constraining specifications, solar cells are very reliable structures.
e3
-RECEDING PACTS BLANK NOT FILMED,^ , ^bfY 0110NA. r, 5LA116
M pi
a'I
Verification of this degree of reliability is exceedingly difficult,
however. Obviously accelerated testing is required which will result in
measurable degradation in a reasonably short time, i.e. acceleration factors
of 100 or more are required. Furthermore, as one moves progressively further
away from the basic unencapsulated cell towards the finished photovoltaic
array it becomes more difficult to increase the applied accelerating
stresses without introducing extraneous failure modes and invalidating the
test procedures. Section 3.0 of this report covers the first meaningful and
systematic attempt to achieve accelerated degradation in encapsulated cells.
As verified by results obtained on the most recent group of cells,
unencapsulated cell testing remains the most effective technique for
producing significant degradation in sensitive cell types within a short
time. Although absolute acceleration factors have not been determined,
results are significant in their ability to differentiate between cell
types. Although different failure/degradation modes were observed, many of ?
the basic mechanisms behind these modes remain a mystery. On one particular
cell construction, however, it was possible to interpret the observed
maximum power degradation as being consistant with Schottky barrier
formation at the back contact, as described in Section 4.2.
A first step towards establishing a relationship between accelerated
test results and effects which occur in real time was begun during this
reporting period. To accomplish this both encapsulated and unencapsulated
single cells were mounted in outside racks and loaded at approximately the
maximum power point. The individual cells were mounted in such a way that
they could be removed for accurate measurement in the laboratory. It is
ti4
J^
hoped that data accumulated in this way can be used to determine actual
acceleration factors and to gain assurance that the same failure modes are
being observed in the laboratory as in the field (Schottky barrier
formation, for example).
During this round of testing many of the cell types in the test
program were donated by manufacturers. In order to encourage this type of
activity, Clemson acquainted each manufacturer, who contributed cells, with
the accelerated test results of those cells as they occurred. Computer
printouts of the electrical measurement data on appropriate cell types were
mailed directly to the manufacturer, with as many as eight mailings being
made to some manufacturers during the test period. Although some difficulty
was encountered in establishing a routine for accomplishing this, it is felt
the procedure was a success and should be continued.
5
r
gI
I
M1
qp b
I`
_I
I
1fi ^Y'Y
Y
K
t 2.0 ACCELERATED TESTING OF UNENCAPSULATED CELLS
a ^pI
^a I
7 I
d ^ri I
9x
„n
PRECEDING PAGE BLANK NOT FILMED
eErfLr
{r n
^6GE_l^ Io^IF^r^^a ^n.iJ. ur urn

2.0 ACCELERATED STRESS TESTING OF UNENCAPSULATED CELLS
2.1 Description of Cells
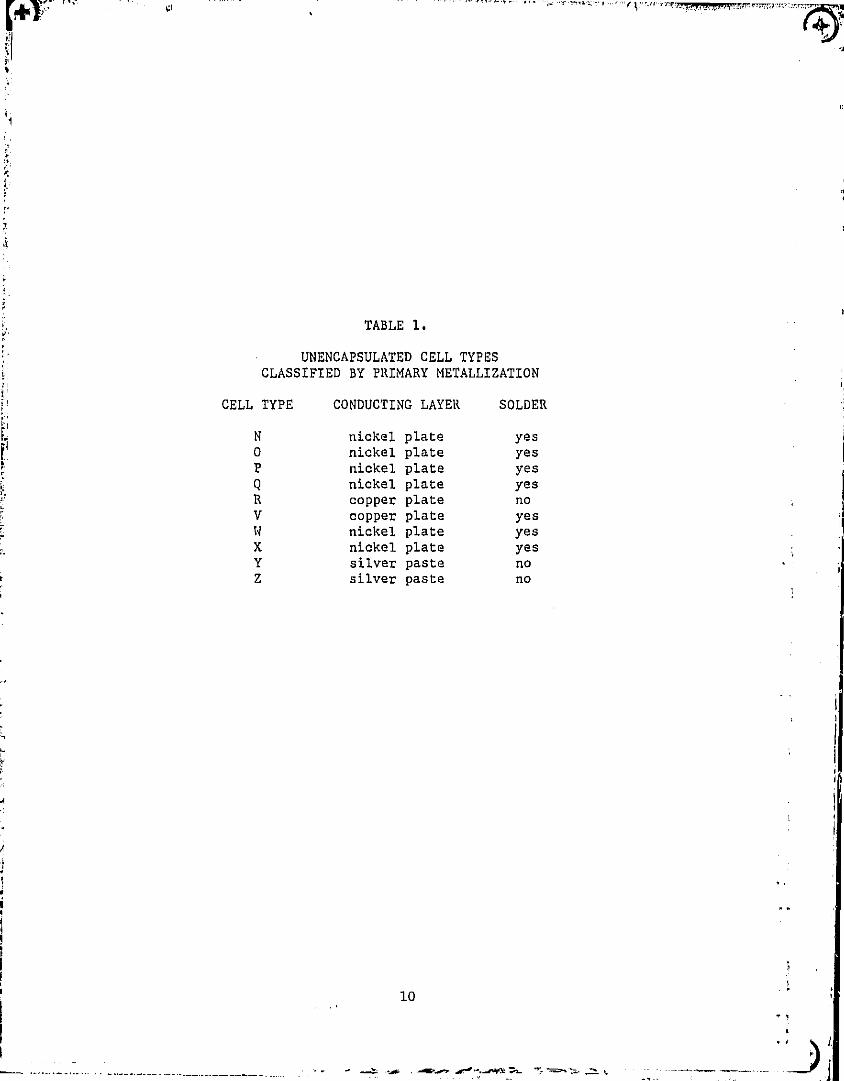
Since the program was initiated, 23 unencapsulated cell types from 12
different manufacturers have undergone some degree of stress testing. Table
1 summarizes, according to their primary metallizations, the 10 different
unencapsulated types of cells from 8 different manufacturers that were in
the latest group. Although the primary conductive metallization layer is the
same for many of the cells, the barrier/strike layers which seperate it from
the silicon may be quite different, both in composition and thickness. There
are essentially four different layered conductor systems in use today --
copper plate, nickel plate, silver frit, and evaporated silver. The latter
system is considered too expensive for present day terrestrial use and was
not included in the present test group, although Ti-Pd-Ag cells have been
tested in the past and found to be very reliable. The remaining three
metallization categories may include a solder coating to help provide the
necessary conductivity. The thick conductive layers could be easily
identified, but more often than not the thin barrier/strike layers were
unknown. Furthermore, the composition of and deposition methods for these
layers vary from one manufacturer to another malting it difficult to
interpret the test results obtained on specific cell types in terms of
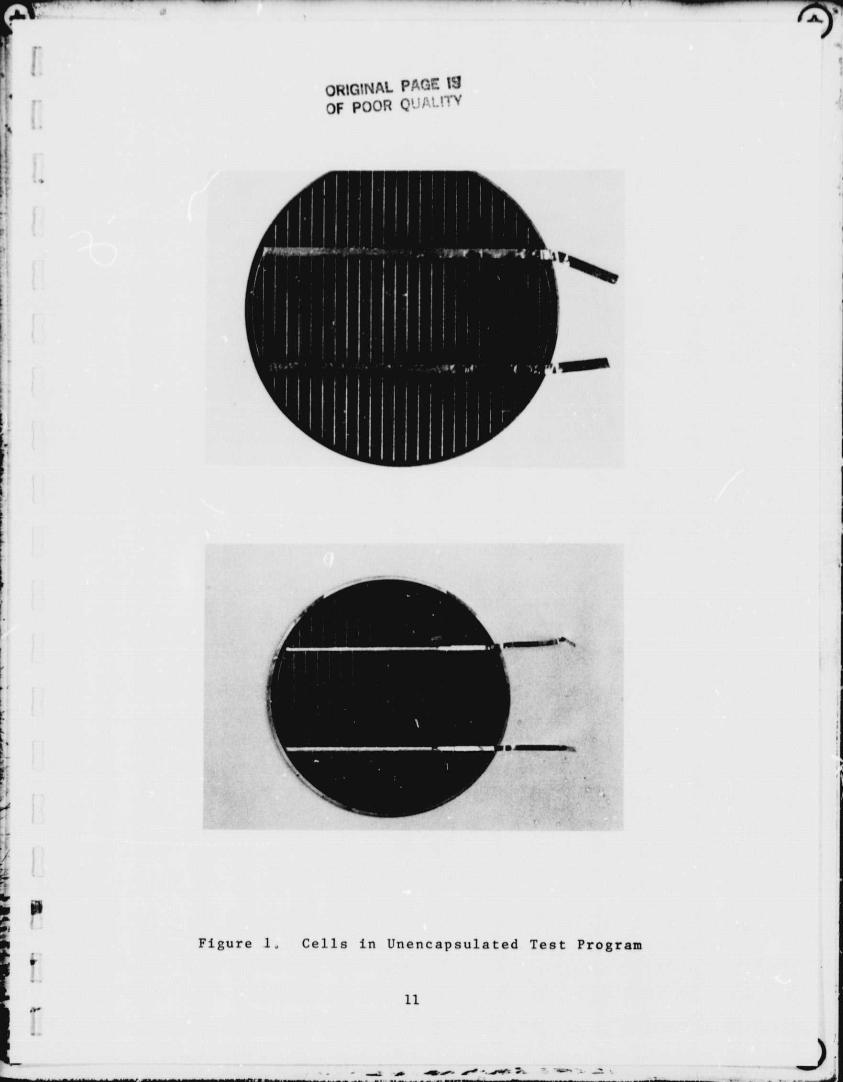
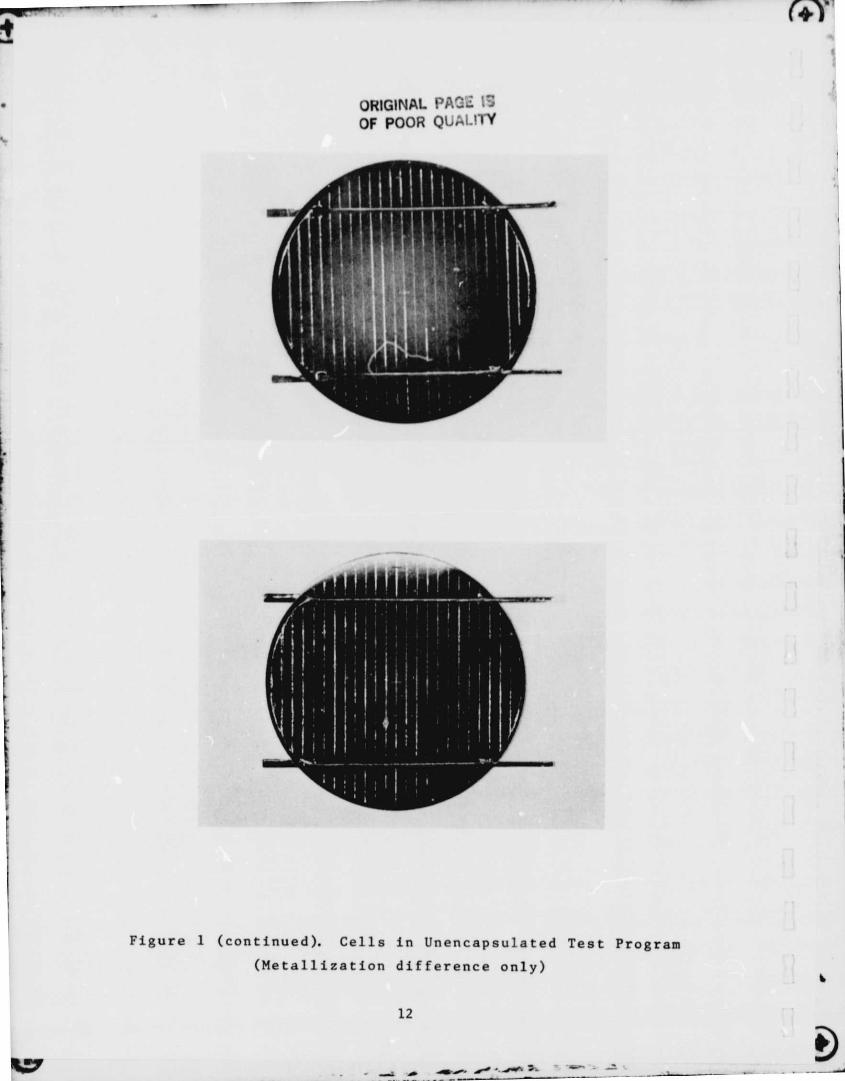
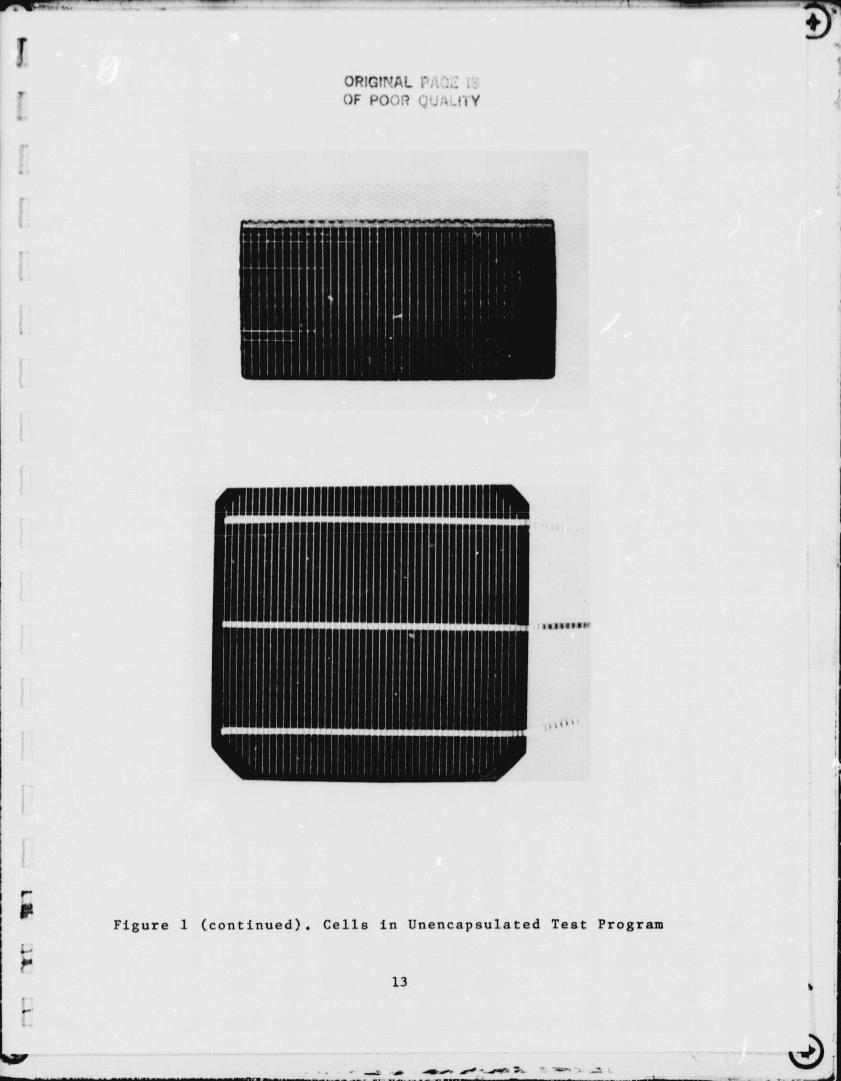
generalized metallization systems. Photographs of the ten different cell
types tested are shown in Figure 1. It can be seen that a wide variety of
cell constructions, including EFG and dendritic ribbon were involved.
Because the grid configurations of cell types are so distinctive, making it
t , 9^^IHIEHTIw)NALtX BUUIC
1 ^ PRECEDING PAGE BLANK NOT FILMED
11
1P1
1
r.4
TABLE 1.
UNENCAPSULATED CELL TYPESCLASSIFIED BY PRIMARY METALLIZATION
CELL TYPE CONDUCTING LAYER SOLDER
N nickel plate yes0 nickel plate yesP nickel plate yesQ nickel plate yesR copper plate noV copper plate yesw nickel plate yesX nickel plate yesY silver paste noZ silver paste no
i
i
10
e
j
,,....".oI",-,
ORIGINAL PAGE 19OF POUR ^!lRt.!ti'Y
Figure 1, Cells in Unencapsulated Test Program
11
0
r
ORIGINAL PA3L I
OF POOR QUALITY
Figure 1 (continued). Cells in Unencapsulated Test Program
(Metallization difference only)
12
fs
.^a
4
J
it I It feet
I kk0.
I «W13
T_74+-
ORIGINALOF POGO,? i Y
f•
r
1
e^Figure 1 (continued). Cells in Unencapsulated Test Program
Ji
URI(;NAL PfR j:: I,'
OF Pc:-)Ft QUALI-1wi
9
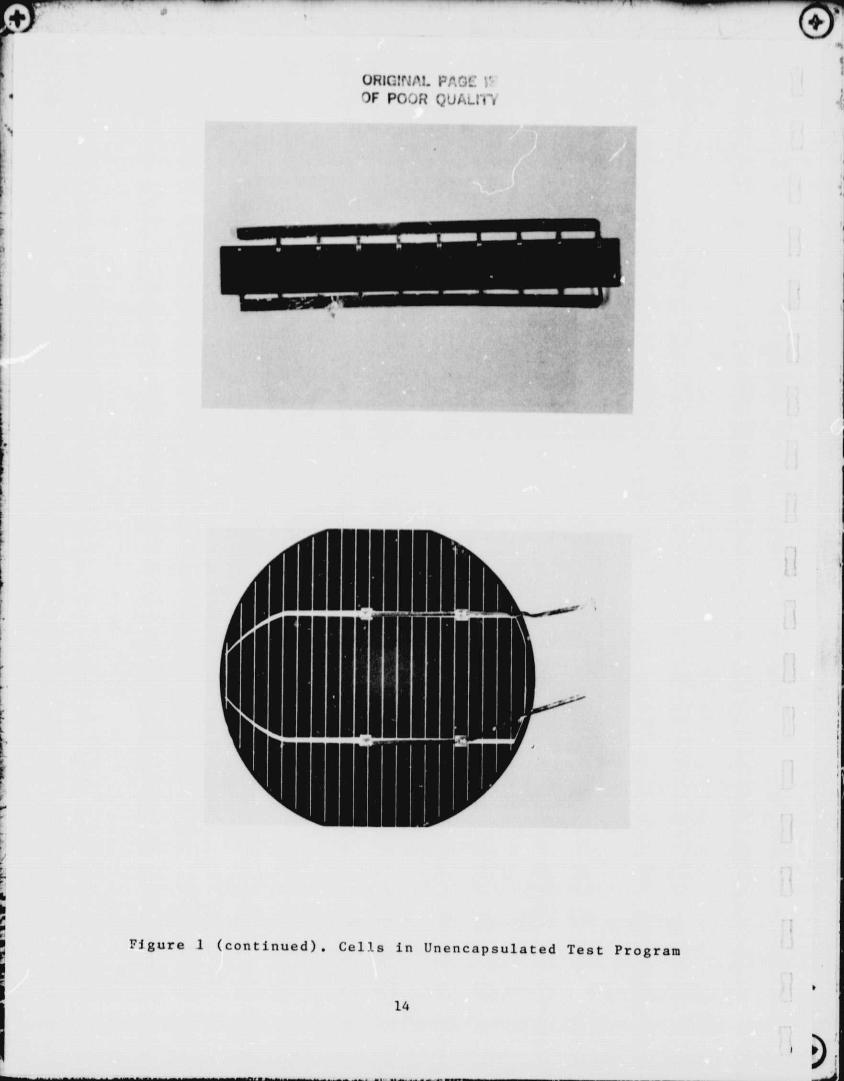
rigure 1 (continued). Cells in Unencapsulated Test Program
14

TI
T'
i
1ORIGINAL. P;,^2 VI
IOF POOR QUA•_, IY
I
•e
i Figure 1 (continued). Cells in Uciencapsul4ted Test Program
.115
w.
s' e
i
relatively easy to identify the manufacturer, these photographs have
purposely not been correlated with the identifying letters used in the
report.
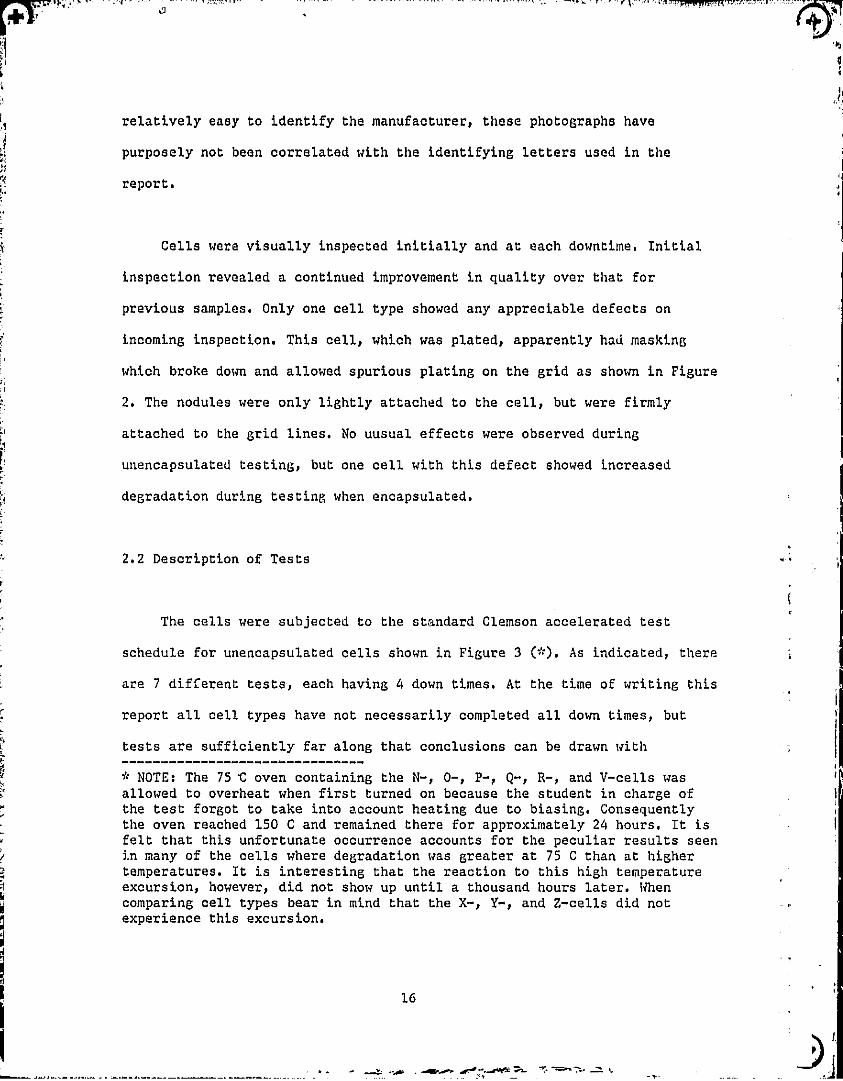
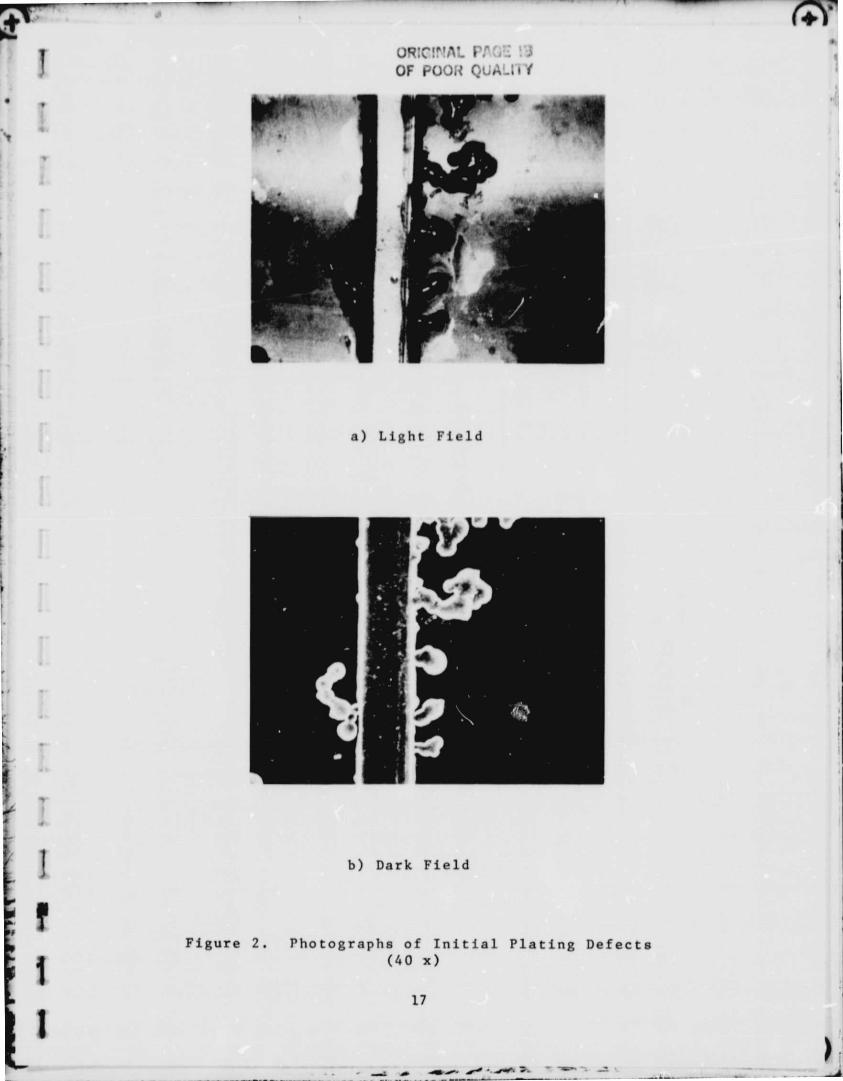
Cells were visually inspected initially and at each downtime. Initial
inspection revealed a continued improvement in quality over that for
previous samples. Only one cell type showed any appreciable defects on
incoming inspection. This cell, which was plated, apparently had masking
which broke down and allowed spurious plating on the grid as shown in Figure
2. The nodules were only lightly attached to the cell, but were firmly
attached to the grid lines. No uusual effects were observed during
unencapsulated testing, but one cell with this defect showed increased
degradation during testing when encapsulated.
2.2 Description of Tests
I
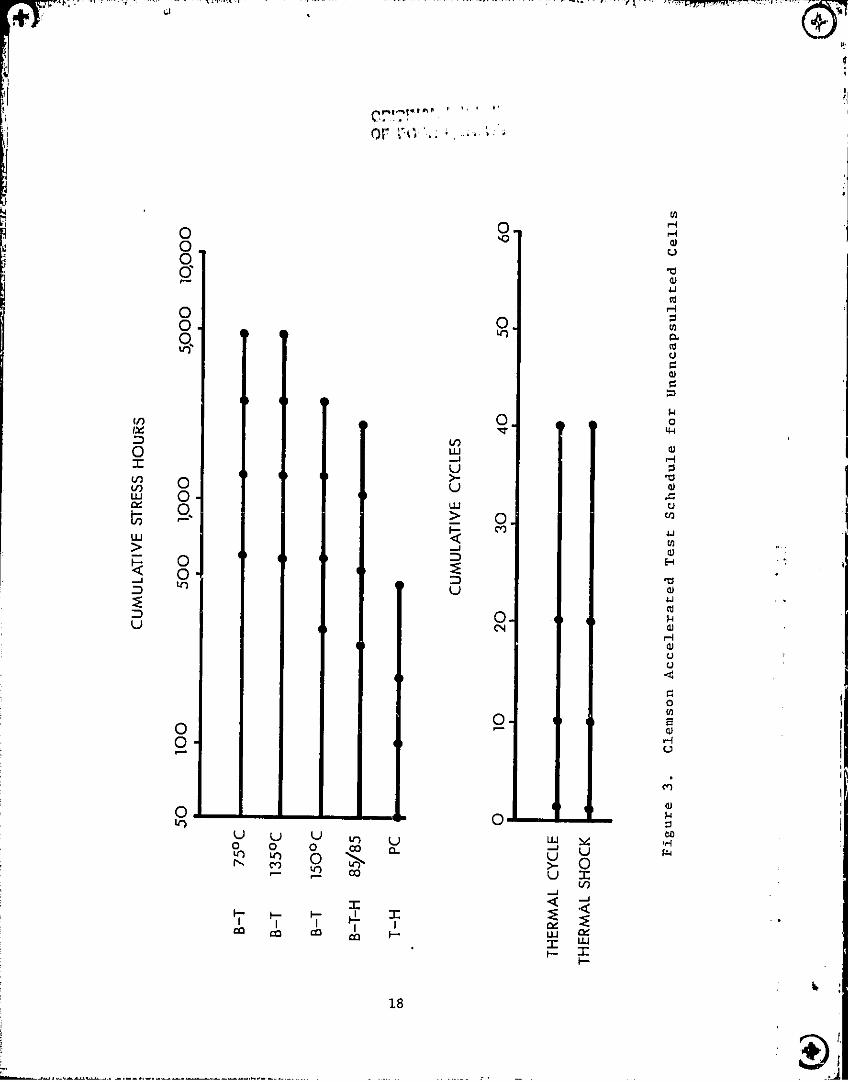
The cells were subjected to the standard Clemson accelerated test
schedule for unencapsulated cells shown in Figure 3 (*). As indicated, there
are 7 different tests, each having 4 down times. At the time of writing this
report all cell types have not necessarily completed all down times, but
tests are sufficiently far along that conclusions can be drawn with
* NOTE: The 75 ,C oven containing the N-, 0-, P-, Q-, R-, and V-cells wasallowed to overheat when first turned on because the student in charge ofthe test forgot to take into account heating due to biasing. Consequentlythe oven reached 150 C and remained there for approximately 24 hours. It isfelt that this unfortunate occurrence accounts for the peculiar results seenin many of the cells where degradation was greater at 75 C than at highertemperatures. It is interesting that the reaction to this high temperatureexcursion, however, did not show up until a thousand hours later. whencomparing cell types bear in mind that the X-, Y-, and Z-cells did notexperience this excursion.
16
1 VIT
1h .
V
(WURlC!! AL P.-:J
ob
OF POOR FY
a) Light Field
b) Dark Field
Figure 2. Photographs of Initial Plating Defects(40 x)
17
Q
C n1.1 ^1.1 n11 . • 1'
Nri
rl
CI
U
b
U7w
ri7N
arouCO1
C
H0
Lk
m
qbvxuN
wN
CDE
rovwmHvrlU1
L)u6
CON
N
r-IU
/+1
Ul
Haco.Hw
OOOOr
OOV
VT
Vnix
O
U') OV) O
Nw
a oM
to
Mu
0.v
V)wJUruw
Q
Cl)
J
D
uO04
O
OuU
u OxV)J
Q JC Q
w w
h ^
OI
Oh
U U u h u0 0LO LO
0O
00 p
LO 00
m co~m F
Al
18
1
a
T
^^ l
A
i'
l °a
i p3
1
y'
confidence. Initially, and at each down time, the cells were electrically
measured and visually inspected. Electrical measurement consisted of
acquiring the IV characteristic curve and from it determining the parameters
Pm, Isc, Vm, Im, and Voc. Although the series and shunt resistances were not
specifically measured, the shape of the characteristic curves was
qualitatively inspected for non-linearity. The IV characteristic taken at
each measurement was saved in digital form for later retrieval if desired.
The measurement system, which is capable of measuring parameters to 1%
repeatability, is described in detail elsewhere (3,5). Of the electrical
parameters, the maximum power output of the cell, Pm, is obviously the most
useful in the measurement of degradation.
Visual defects which occurred as a consequence of testing, and which
perhaps were exacerbated by handling, were detected by normal viewing
procedures without the aid of magnification. The defects so detected were
placed in one of the following four catagories:
leads
grid contact
back contact
cell fracture
Of these, the grid and back contact catagories are considered more serious
from a practical standpoint that the other two, because leads and cell
fractures are exacerbated by handling during testing and at the same time
will be protected in the field by encapsulation to a greater extent. Defects
relating to each of these areas were then characterized as:
19
l
J.low,
'âa
1
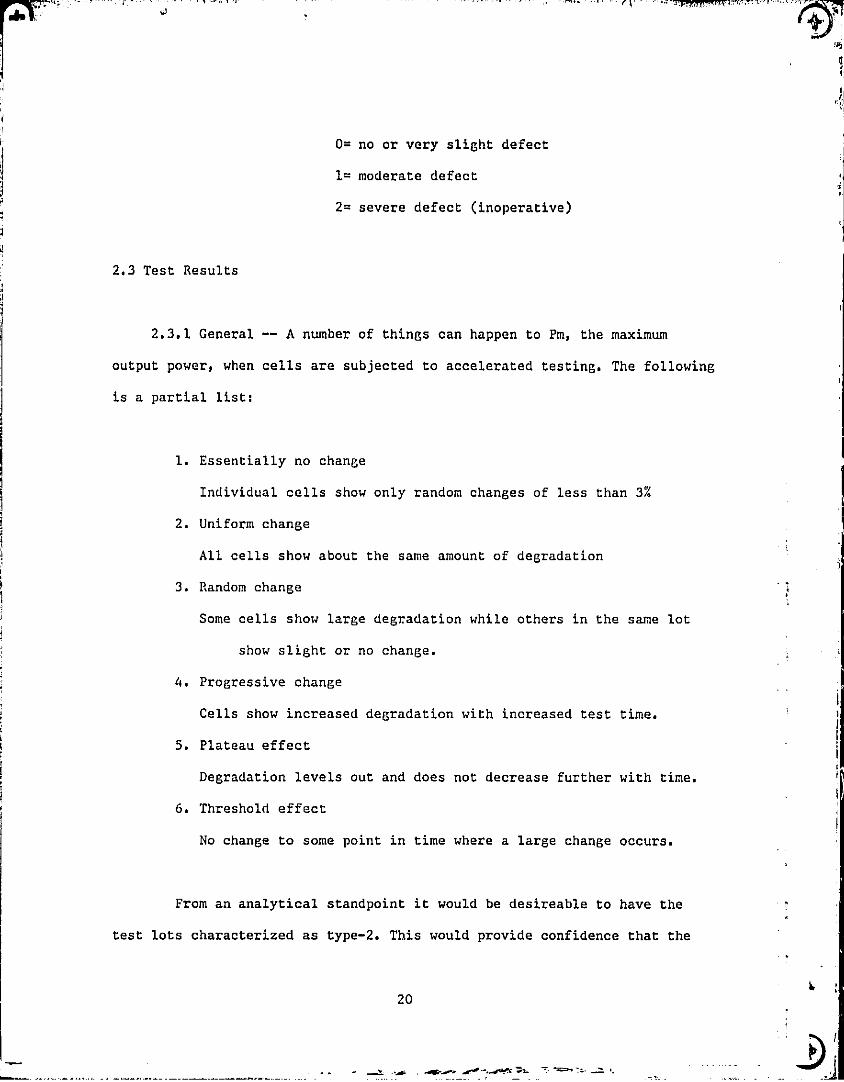
0= no or very slight defect
1= moderate defect
2= severe defect (inoperative)
2.3 Test Results
2.3.1 General -- A number of things can happen to Pm, the maximum
output power, when cells are subjected to accelerated testing. The following
is a partial list:
1. Essentially no change
Individual cells show only random changes of less than 3%
2. Uniform change
All cells show about the same amount of degradation
3. Random change
Some cells show large degradation while others in the same lot
show slight or no change.
G. Progressive change
Cells show increased degradation with increased test time.
5. Plateau effect
Degradation levels out and does not decrease further with time.
G. Threshold effect
No change to some point in time where a large change occurs.
From an analytical standpoint it would be desireable to have the
test lots characterized as type-2. This would provide confidence that the
20
y.^t
lei5.
21
.1
t
(.i5I,
i
W
test was uncovering a single well defined failure mode. Unfortunately many
test lots are type-3, making interpretation difficult. Often randomness
(type-3), the plateau effect (type-5), and the threshold effect (type-6) can
be explained by simultaneously observing catastrophic behavior, such as
leads missing, fractures, loss of metal adherence, etc. When a lead comes
off, for example, the output power will suddenly decrease, but will not
change further with time, assuming that the remaining leads remain attached.
Because the number of cells of any one type in each test was small (maximum
of 25), such random behavior does not lend itself readily to quantitative
data reduction methods, such as might yield a "one number" reliabili'cy
figure of merit. In order to be able to interpret the data, failure modes
caused by accelerated testing have been divided into two categories:
electrical degradation
catastrophic mechanical change
Electrical degradation is defined as a gradual and progressive change
(usually a decrease) in Pm with no related visual effects (type-2 behavior).
Examples of phenomenon which result in electrical degradation would be
Schottky barrier formation at a contact and lifetime reduction through metal
diffusion. Catastrophic mechanical change is defined as visually detectable
change which would be expected to result in loss of power output, and which
frequently can be characterized as "sudden". Examples would be loss of a
lead, loss of grid adherence, and cell fracturing. Visual changes which were
cosmetic, but which nevertheless might ulitmately lead to, or be related to,
power loss were noted, but were not considered to be a primary part of the
data analysis since the eventual results would show up as either Pm
22
degradation or as mechanical effects. Examples of cosmetic changes would be
metal discoloration and solder bump formation.
In this report both accelerated test electrical measurement data and
visual data are presented in a series of tables. Most cell types
simultaneously exhibit both electrical degradation and mechanical changes.
In an effort to seperate the two catagories, an effort has been made to
remove the effect of mechanical change from the degradation tables. This
explains, for example, why the table describing the 150 )C B-T test, which
nominally has 20 cells, may show a lesser total number of cells as the test
progresses. For the most part only the data relating to cells which
experienced catastrophic change was removed from the table summaries -- the
cells themselves continued to undergo testing. An exception to the procedure
of removing the data for mechanically damaged cells involved thermal cycle
and thermal shock testing, which would be expected to introduce only
catastrophic t ype changes because of the short test times involved. In these
cases no attempt was made to remove data since only a single failure mode
catagory was expected.
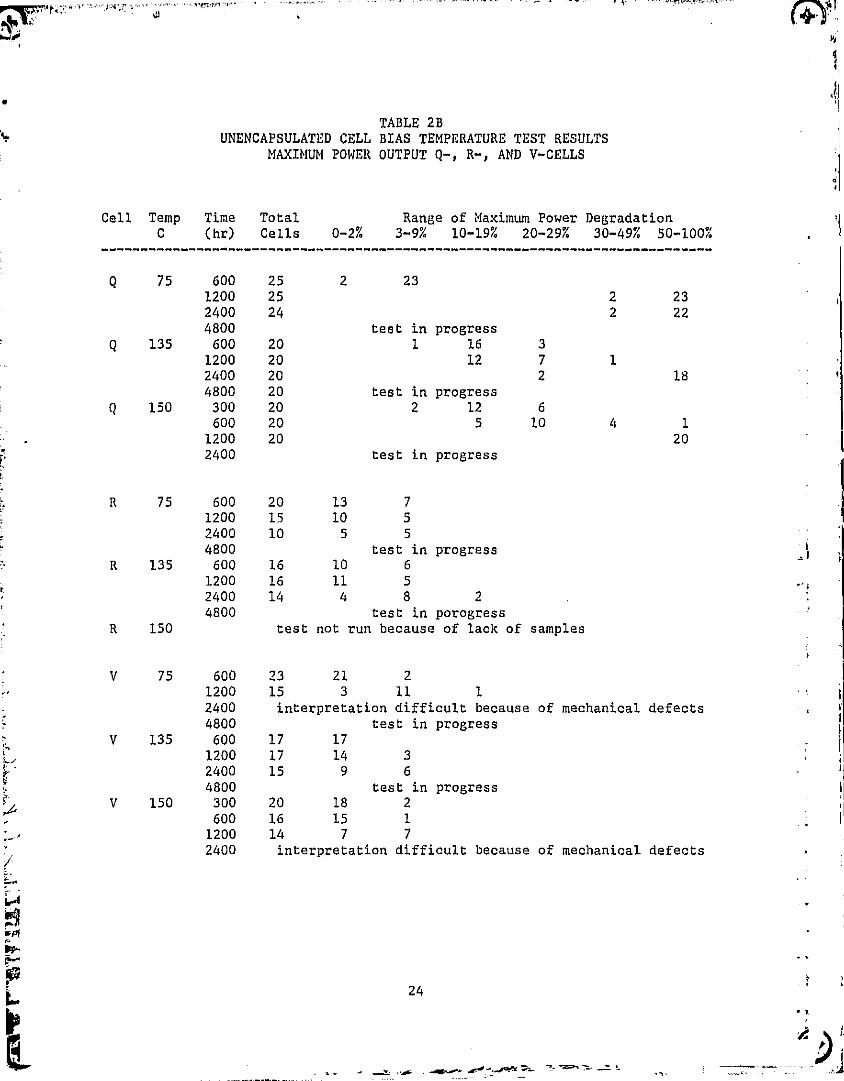
2.3.2 Bias-Temperature Testing -- The electrical degradation results of
bias-temperature testing are given in Table 2. The reader is urged to
examine this table closely and note the regular progression of degradation
with time and temperature for most cells and to note also the differences
which exist between cell types. One cell type, the Q-cell, showed severe
electrical degradation which was interpreted as being due to Schottky
barrier formation at the back contact. This is discussed in detail in
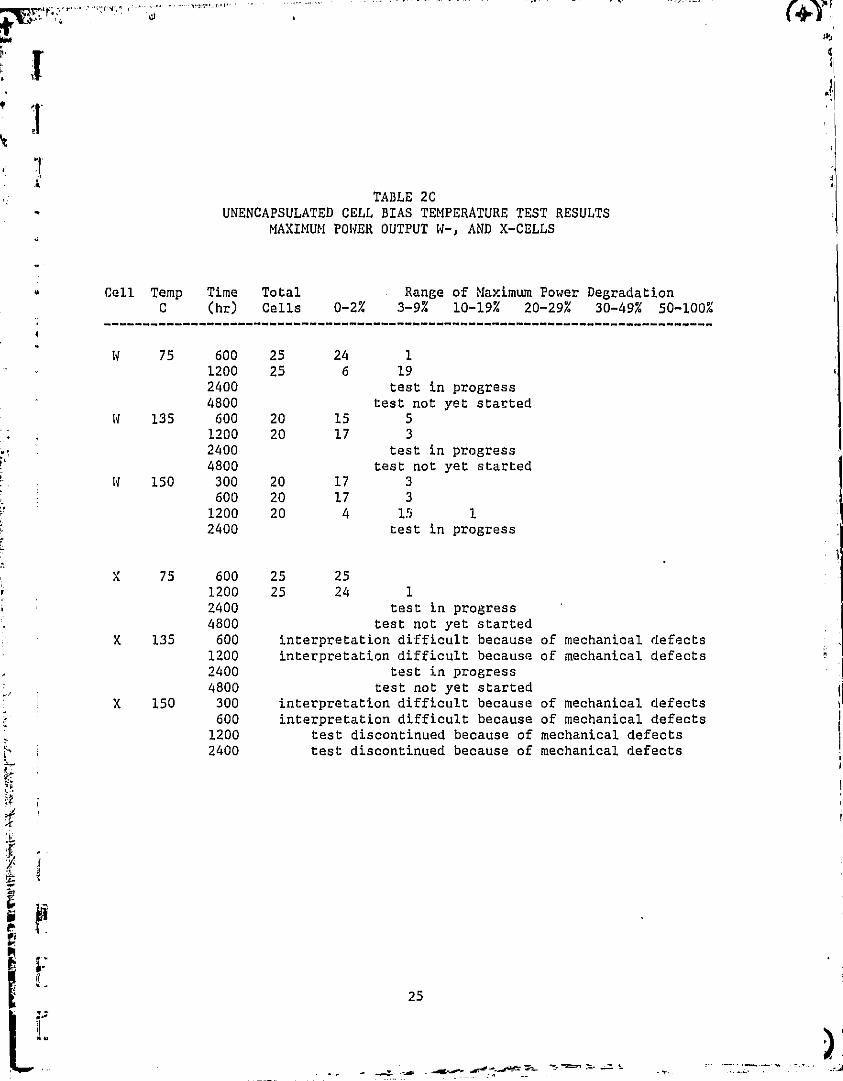
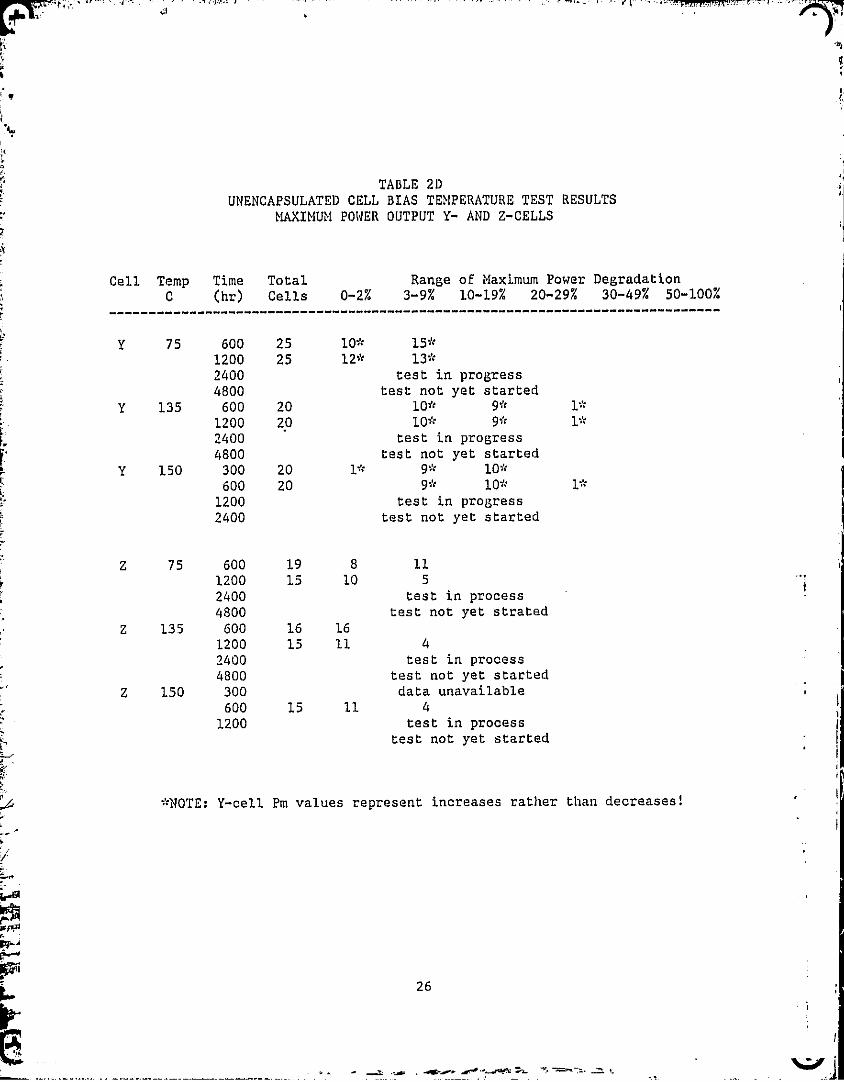
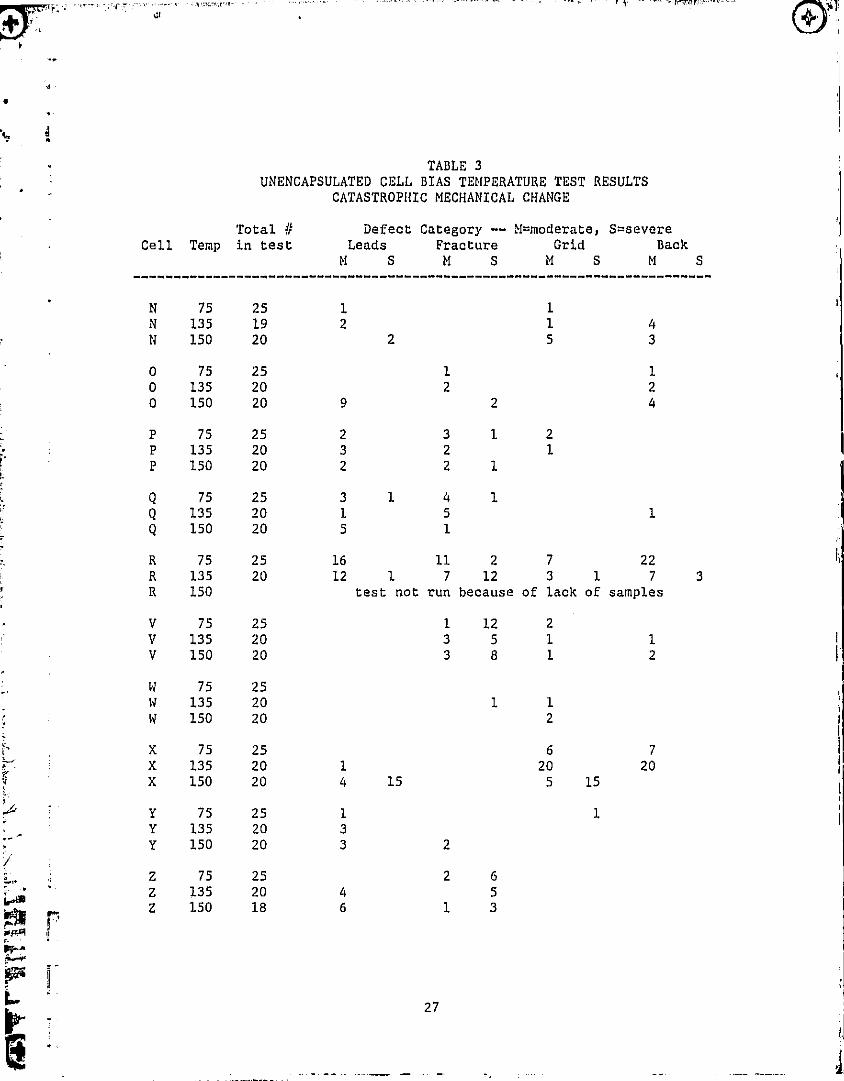
Section 4.2. Catastrophic mechanical changes are shown in Table 3. Two cell
types, the X- and Z-cells showed severe mechanical problems during B-T
k

P 75 600 25 171200 24 152400 24 19
P 135 600 20 151200 20 182400 20 17
P 150 300 20 20600 20 20
1200 202400 19 7
8
8
15523
data erratic
10 2
TABLE 2A4 ^ UNENCAPSULATED CELL BIAS TEMPERATURE TEST RESULTS
MAXIMUM POWER OUTPUT N-, 0-, AND P-CELLS
a
Cell Temp Time Total Range of Maximum Power DegradationC (hr) Cells 0-27 3-97 10-197 20-297 30-497 50-100%
11 75 600 25 23 21200 25 3 8 4 102400 25 4 7 4 9 14800 test in progress
N 135 600 20 19 11200 20 19 12400 19 14 54800 test in progress
N 150 300 19 15 4600 18 11 7
1200 15 5 8 22400 14 3 6 4 2
0 75 600 25 19 61200 24 9 10 3 22400 24 9 10 2 34800 test in progress
0 135 600 20 14 61200 20 9 10 12400 20 6 12 24800 test in progress
0 150 300 20 14 6600 20 9 11
1200 19 3 10 5 12400 17 1 1 12 3
^i
23
i
TABLE 2BUNENCAPSULATED CELL BIAS TEMPERATURE TEST RESULTS
MAXIMUM POWER OUTPUT Q-, R-, AND V-CELLS
ai
Cell Temp Time Total Range of Maximum Power DegradationC (hr) Cells 0-2%
-----------------------------------------------------------------------------
3-9% 10-19% 20-29% 30-49% 50-10004'
Q 75 600 25 2 231200 25 2 232400 24 2 224800 test in progress
Q 135 600 20 1 16 31200 20 12 7 12400 20 2 184800 20 test in progress
Q 150 300 20 2 12 6600 20 5 10 4 1
1200 20 20 I2400 test in progress
lR 75 600 20 13 7
1200 15 10 52400 10 5 54800 test in progress
R 135 600 16 10 61200 16 11 52400 14 4 8 24800 test in porogress
R 150 test not run because of lack of samples
V 75 600 23 21 21200 15 3 11 1 I2400 interpretation difficult because of mechanical defects4800 test in progress
V 135 600 17 17 i1200 17 14 32400 15 9 64800 test in progress I
V 150 300 20 18 2600 16 15 1 I1200 14 7 72400 interpretation difficult because of mechanical defects
6 ,24
j +1.
'I
^r'I
^R,^^'^prrY ^ ^
r
e^
TABLE 2C• UNENCAPSULATED CELL BIAS TEMPERATURE TEST RESULTS
MAXIMUM POWER OUTPUT W-, AND X-CELLS
L Cell Temp Time Total Range of Maximum Power DegradationC (hr) Cells 0-2/ 3-9/ 10-19/ 20-29/ 30-49% 50-100/
-----------------------------------------------------------------------------
W 75 600 25 24 1
1200 25 6 19
2400 test in progress4800 test not yet started
W 135 600 20 15 S
1200 20 17 3
2400 test in progress4800 test not yet started
W ISO 300 20 17 3
600 20 17 3
1200 20 4 15i 12400 test in progress
X 75 600 25 25
1200 25 24 1
2400 test in progress4800 test not yet started
X 135 600 interpretation difficult because of mechanical defects1200 interpretation difficult because of mechanical defects2400 test in progress4800 test not yet started
X 150 300 interpretation difficult because of mechanical defects600 interpretation difficult because of mechanical defects
1200 test discontinued because of mechanical defects2400 test discontinued because of mechanical defects
25
n
E,
4 1
`Zoe !
. "-% . _ r._'.- 11 _ _
c+
Y
4 ^
i'
TABLE 2DUNENCAPSULATED CELL BIAS TEMPERATURE TEST RESULTS
MAXIMUM P014ER OUTPUT Y- AND Z-CELLS
Cell Temp Time Total Range of Maximum Power DegradationC (hr)
---------------------------------------------Cells 0-2% 3-9% 10-19% 20-29% 30-49% 50-100%
--------------------------------
Y 75 600 25 10* 15*1200 25 12* 13*2400 test in progress4800 test not yet started
Y 135 600 20 10* 9* L,1200 20 10* 9* 1+'l2400 test in progress4800 test not yet started
Y 150 300 20 1* 9* 10*
600 20 9* 10* 1*1200 test in progress2400 test not yet started
Z 75 600 19 8 111200 15 10 52400 test in process4800 test not yet strated
Z 135 600 16 161200 15 11 42400 test in process4800 test not yet started
Z 150 300 data unavailable600 15 11 4
1200 test in processtest not yet started
v
:j
r^u
DY'
*NOTE: Y-cell Pm values represent increases rather than decreases!
26
Hl
^Y'
w•
TABLE 3UNENCAPSULATED CELL BIAS TEMPERATURE TEST RESULTS
CATASTROPHIC MECHANICAL CHANGE
Total Defect Category -- M=moderate, S=severeCell Temp in test Leads Fracture Grid Back
-------`------------------------`------------------------------°°-----M S M S M S M S
N 75 25 1 1N 135 19 2 1 4N 150 20 2 5 3
0 75 25 1 10 135 20 2 20 150 20 9 2 4
P 75 25 2 3 1 2P 135 20 3 2 1P 150 20 2 2 1
Q 75 25 3 1 4 1Q 135 20 1 5 1Q 150 20 5 1
R 75 25 16 11 2 7 22R 135 20 12 1 7 12 3 1 7 3R 150 test not run because of lack of samples
= v 75 25 1 12 2v 135 20 3 5 1 1v 150 20 3 8 1 2
W 75 25_ W 135 20 1 1
W 150 20 2
' X 75 25 6 7X 135 20 1 20 20X 150 20 4 15 5 15
Y 75 25 1 1Y 135 20 3Y 150 20 3 2
2 75 25 2 6Z 135 20 4 5
Ln .- Z 150 18 6 1 3
27
J
k
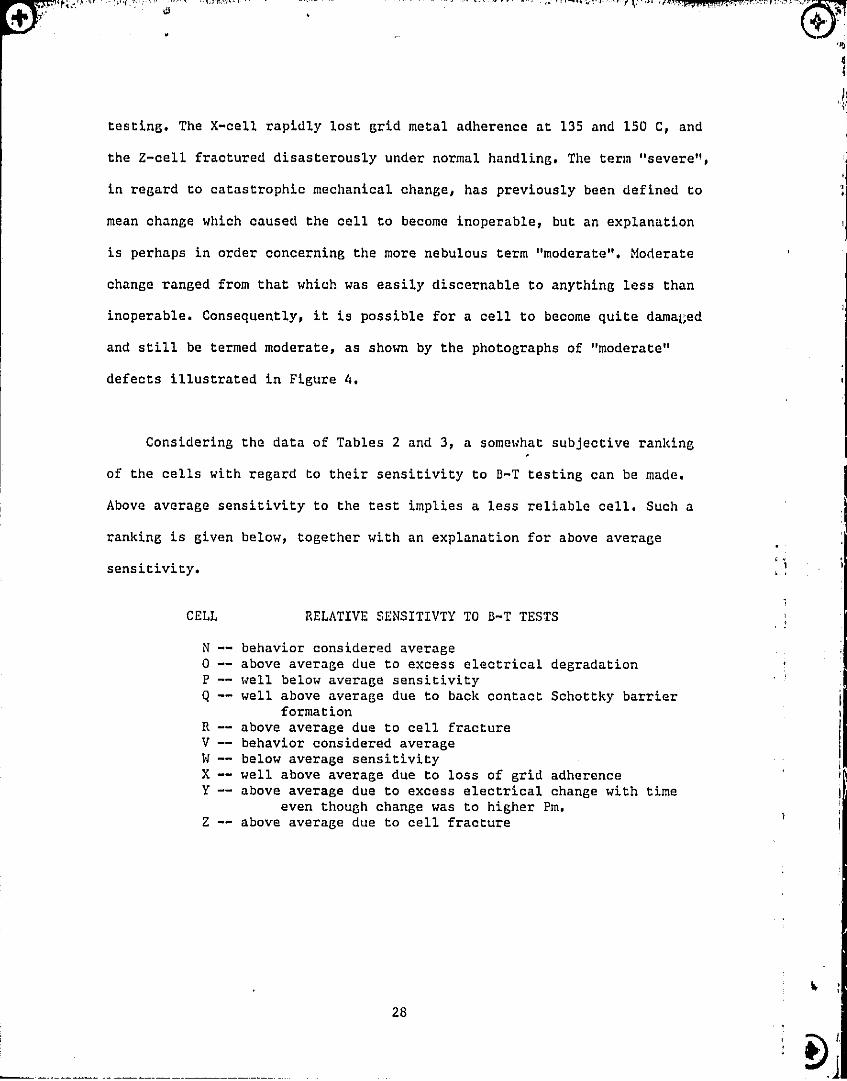
testing. The X-cell rapidly lost grid metal adherence at 135 and 150 C, and
the Z-cell fractured disasterously under normal handling. The term "severe",
in regard to catastrophic mechanical change, has previously been defined to
mean change which caused the cell to become inoperable, but an explanation
is perhaps in order concerning the more nebulous term "moderate". Moderate
change ranged from that which was easily discernable to anything less than
inoperable. Consequently, it is possible for a cell to become quite damaged
and still be termed moderate, as shown by the photographs of "moderate"
defects illustrated in Figure 4.
Considering the data of Tables 2 and 3, a somewhat subjective ranking
of the cells with regard to their sensitivity to D-T testing can be made.
Above average sensitivity to the test implies a less reliable cell. Such a
ranking is given below, together with an explanation for above average
sensitivity.
CELL RELATIVE SENSITIVTY TO B-T TESTS
N -- behavior considered average0 -- above average due to excess electrical degradationP -- well below average sensitivityQ -- well above average due to back contact Schottky barrier
formationR -- above average due to cell fractureV -- behavior considered averageW -- below average sensitivityX -- well above average due to loss of grid adherenceY -- above average due to excess electrical change with time
even though change was to higher Pm.Z -- above average due to cell fracture
28

URIGINAL V . AOF POOR QUALITY
I
ft
Figure 4. Examples of "Moderate" Mechanical Defects
29
16
O ^^•w----- - . -
If
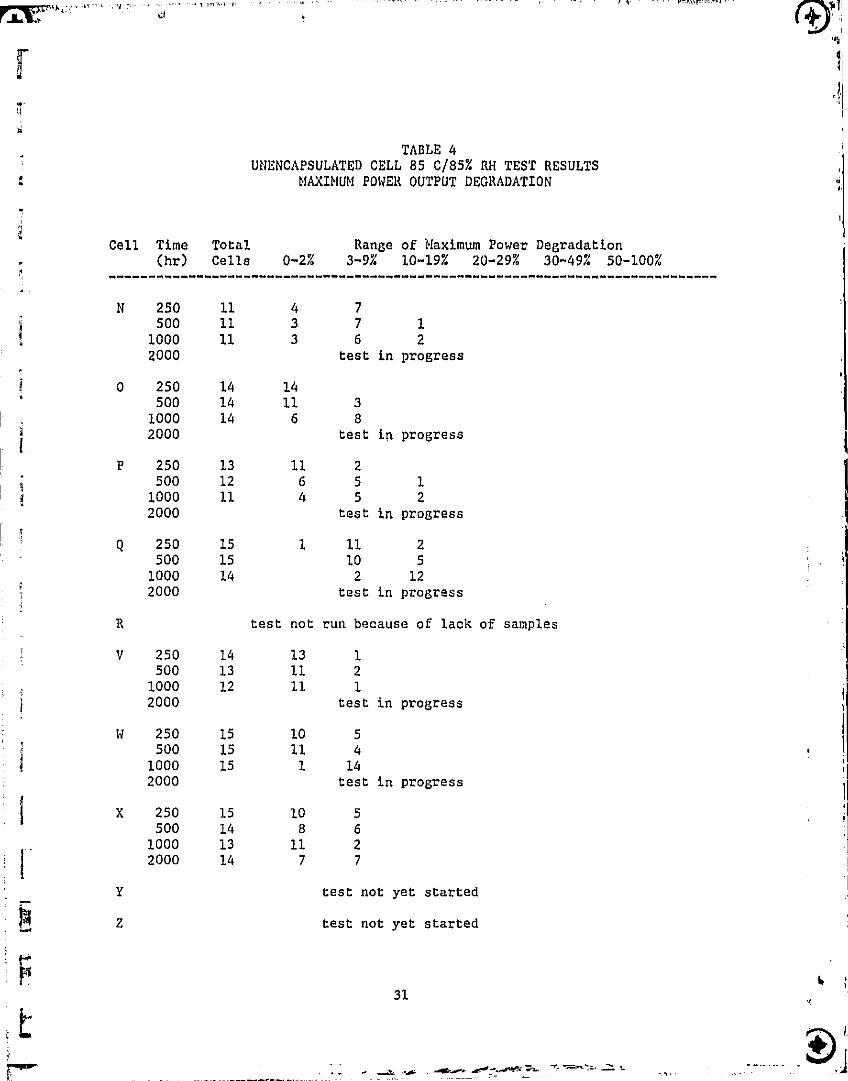
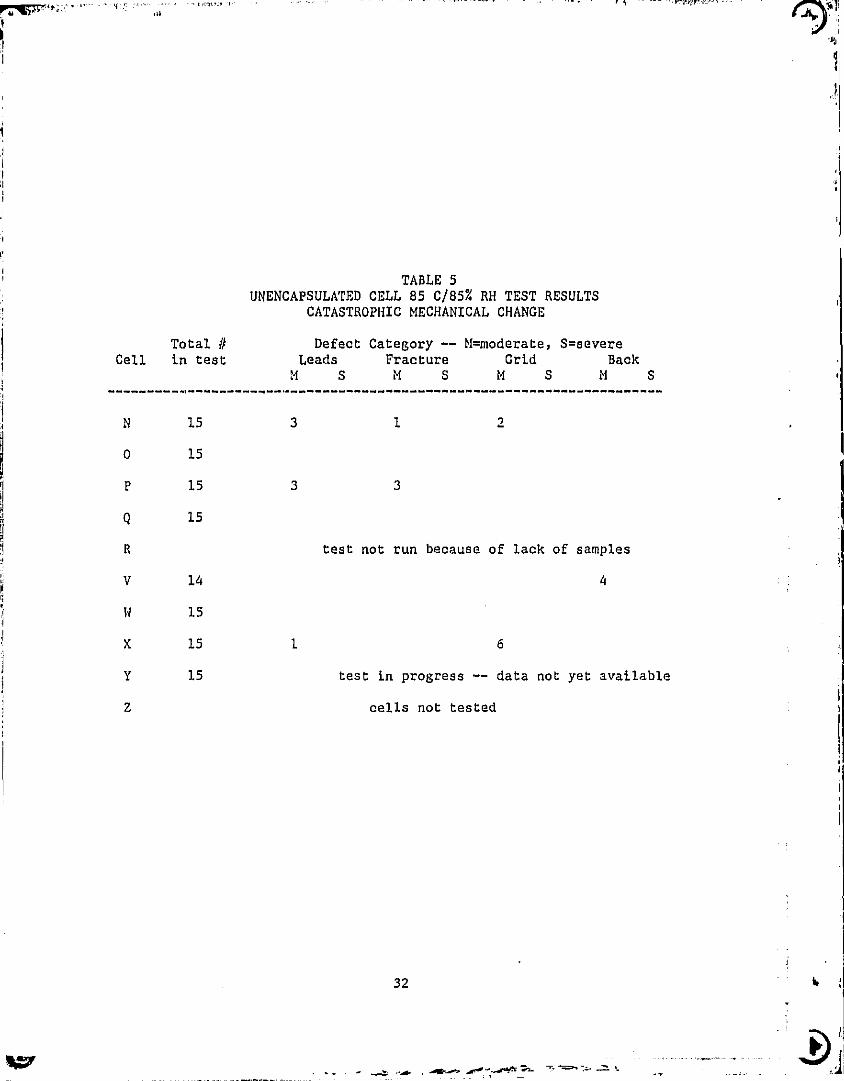
2.3.3 Dias-Temperature-Humidity (85 C/85% Rfl) Testing -- Electrical
degradation results for 85/85 testing are given in Table 4, and the
catastrophic mechanical change results in Table 5. It is obvious that the
85/85 test in not nearly as severe a test as the B-T test. With the
exception of the Q-cell the cells show little electrical degradation. This
fact will be important to the discussion in Section 3 concerning the
accelerated testing of encapsulated cells. Similarly, few mechanical effects
were observed, but the X-cells which had severe grid adherence problems on
B-T testing also had grid adherence problems in the 85/85 test. An overall
ranking of cells in this test is not given because of the small changes that
were observed.
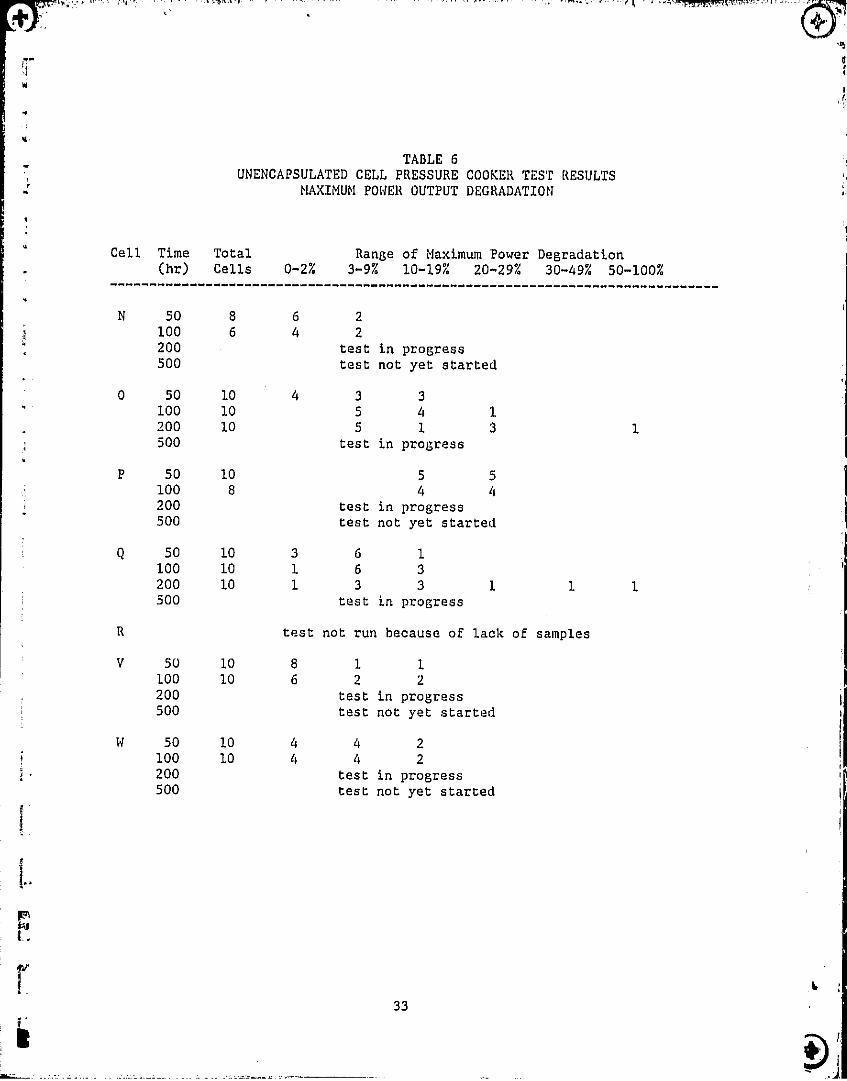
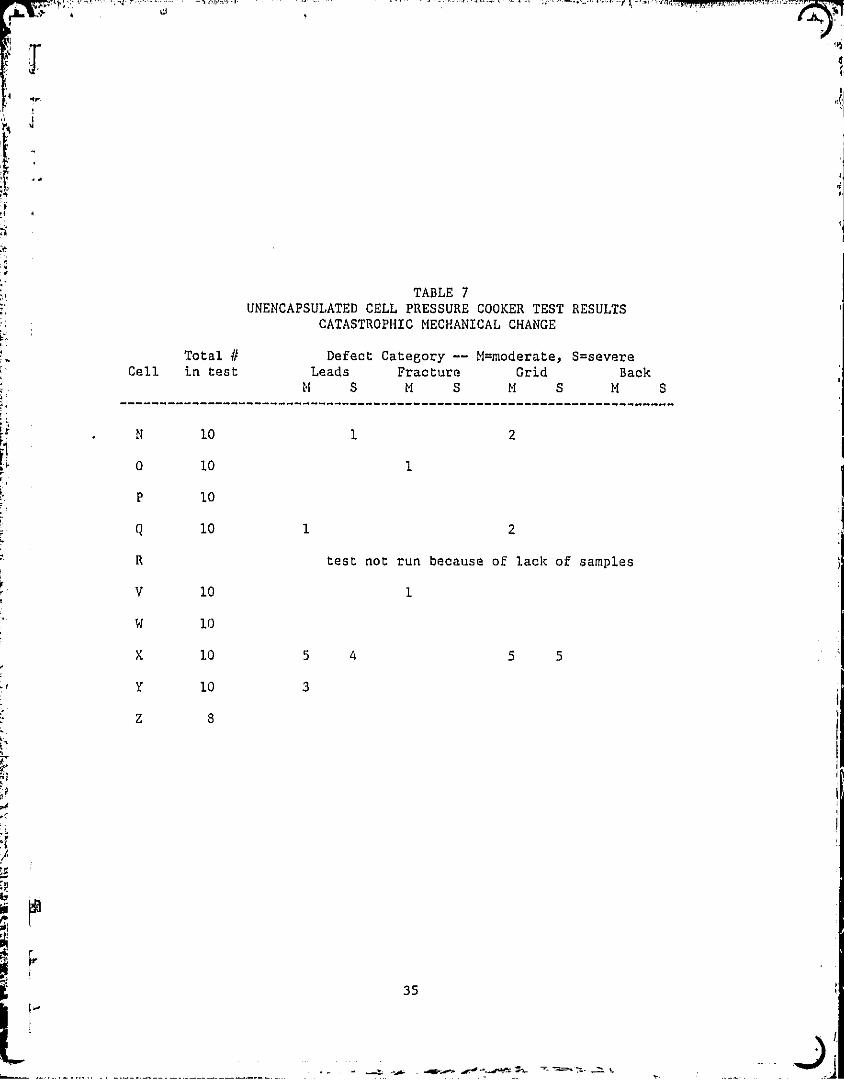
2.3.4 Pressure Cooker (121 C/15 psig steam) Testing -- Electrical
degradation results for pressure cooker testing are given in Table 6, and I;I
catastrophic change results in Table 7. It can be seen that the severity of
the pressure cooker test is comparable to that of the B-T test. A regular
progression of degradation with test time can be observed in a number of
cases. The mechanical problems (loss of grid adhesion) associated with the
X-cell were so severe that it was impossible to get any indication of
non-mechanical related degradation. A particularly interesting effect was
shown by the Y-cell which showed an astonishing improvement with testing.
After 100 hours of testing all 10 of the Y-cells showed between 36 and 46:
improvement in Pm, with the average being 42% ! An improvement had been
observed during B-T testing, but not of this magnitude. No explanation is
offered at the present time for the phenomenon, which had the effect of
bringing cells having substandard performance more nearly in line with those
30
roJ
6
L)
r^l
TABLE 4UNENCAPSULATED CELL 85 C/85% RH TEST RESULTS
MAXIMUM POWER OUTPUT DEGRADATION
Cell Time Total Range of Maximum Power Degradation(hr) Cells
---------------------------------------------0-2% 3-9% 10-19% 20-29% 30-49% 50-100%
---------------------------_-_o.N 250 11 4 7
500 11 3 7 11000 11 3 6 22000 test in progress
0 250 14 14500 14 11 31000 14 6 82000 test in progress
P 250 13 11 2500 12 6 5 11000 11 4 5 22000 test in progress
Q 250 15 1 11 2500 15 10 51000 14 2 122000 test in progress
R test not run because of lack of samples
V 250 14 13 1500 13 11 21000 12 11 12000 test in progress
W 250 15 10 5500 15 11 4
1000 15 1 142000 test in progress
X 250 15 10 5500 14 8 6
1000 13 11 22000 14 7 7
Y test not yet started
Z test not yet started
31
Y JI 941
b
TABLE 5UNENCAPSULATED CELL 85 C/85% RH TEST RESULTS
CATASTROPHIC MECHANICAL CHANGE
Total # Defect Category -- M=moderate, S=severeCell in test Leads Fracture Grid Back
14 S M S M S M S----------------------°------------------------------°---------------
N 15 3 1 2
0 15
P 15 3 3
Q 15
R test not run because of lack of samples
V 14 4
{J 15
X 15 1 6
Y 15 test in progress -- data not yet available
2 cells not tested
32 ;I
R
V 50 10
100 10200500
W 50 10100 10200500
kaA.
V
w
w
TABLE 6UNENCAPSULATED CELL PRESSURE COOKER TEST RESULTS
w
MAXIMUM POWER OUTPUT DEGRADATION
Cell Time Total Range of Maximum Power Degradation(hr) Cells 0-2% 3-9% 10-19 20-29% 30-49% 50-100%
N 50 8 6 2100 6 4 2200 test in progress500 test not yet started
0 50 10 4 3 3100 10 5 4 1200 10 5 1 3 1500 test in progress
P 50 10 5 5100 8 4 4200 test in progress500 test not yet started
Q 50 10 3 6 1100 10 1 6 3200 10 1 3 3 1 1 1500 test in progress
test not run because of lack of samples
8 1 16 2 2
test in progresstest not yet started
4 4 24 4 2
test in progresstest not yet started
33t
1
h5
Y
S
TABLE 6 (continued)UNENCAPSULATED CELL PRESSURE COOKER TEST RESULTS
MAXIMUM POWER OUTPUT DEGRADATION
Cell Time Total Range of Maximum Power Degradation(hr)
----°------------------------------------------------------------------
Cells 0-20 3-90 10-190 20-290 30-49% 50-1000
X 50 interpretation difficult because of mechanical defects100 interpretation difficult because of mechanical defects200 interpretation difficult because ofinechanical defects500 test terminated because of mechanical defects
Y 50 10 2* 8*100 10 10*200 10 2* 8*500 test in progress
Z 50 8 8100 8 8200 test in progress500 test not yet started
*NOTE: Y-cell Pm values represent increases rather than decreases!
34
I;
^dI
1
fr
T1+r
U
TABLE 7UNENCAPSULATED CELL PRESSURE COOKER TEST RESULTS
CATASTROPHIC MECHANICAL CHANGE
Defect Category -- M=moderate, S=severeLeads Fracture Grid Back
H S M S M S M S
1
2
1
1 2
test not run because of lack of samples
1
5 4
5 5
3
Total #Cell in test
"1 10
0 10
P 10
4 10
R
v 10
w 10
x 10
Y 10
Z 8
9a
t^i
35
rl
All
9
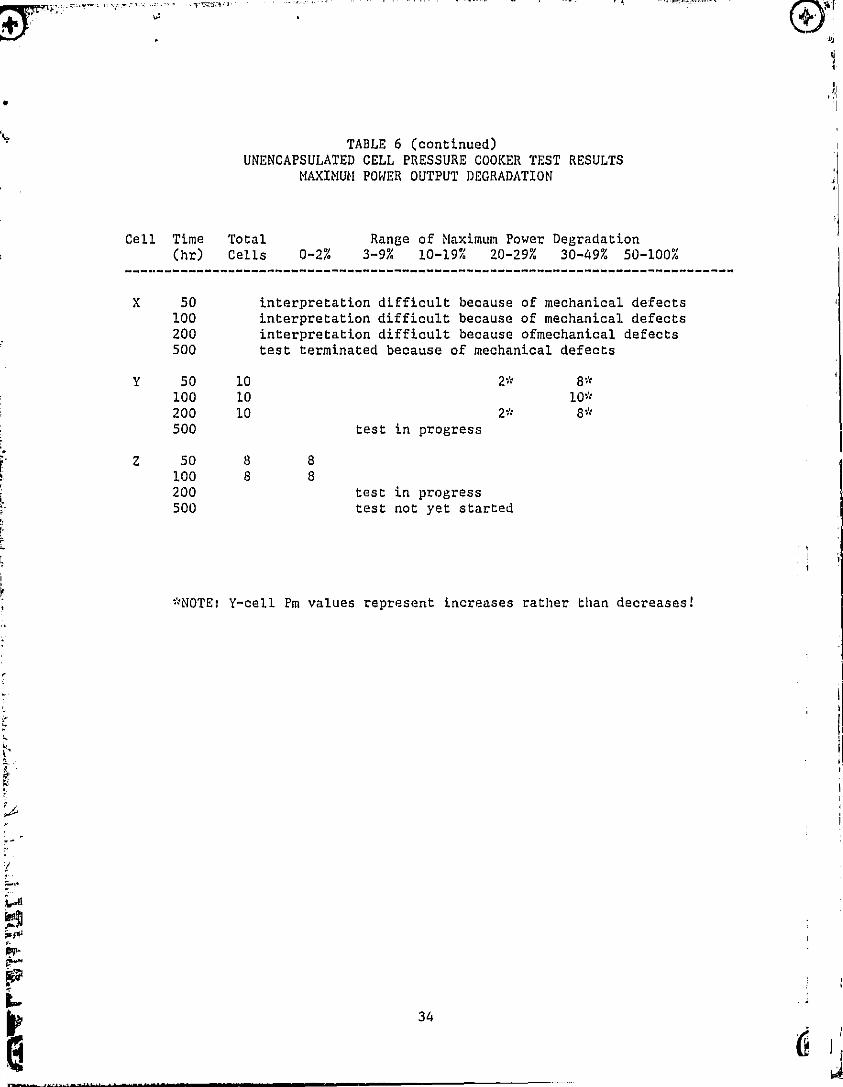
+•Iof other cell types. The Y-cell metallization was printed silver and it is
felt that some portion of the metallization fabrication cycle had not been
properly optimized by the manufacturer as the effect is not generic to this
type of construction. In keeping with standard reliability practice,
however, any change -- even an improvement -- is viewed with suspicion, and
consequently this cell was rated down because of this behavior.
A subjective ranking of cells regarding their sensitivity to pressure
cooker testing results in:
CELL RELATIVE SENSITIVTY TO PRESSURE COOKER TESTS
N -- below average sensitivity0 -- above average due to excess electrical degradationP -- above average due to excess electrical degradationQ -- above average due to excess electrical degradationR -- no tests planned due to lack of samplesV -- average sensitivitytJ -- average sensitivityX -- well above average due to mechanical problemst loss of grid
adherence and loss of leadsY -- well above average due to excess electrical change with
time even though change was to higher Pm.2 -- below average sensitivity (preliminary)
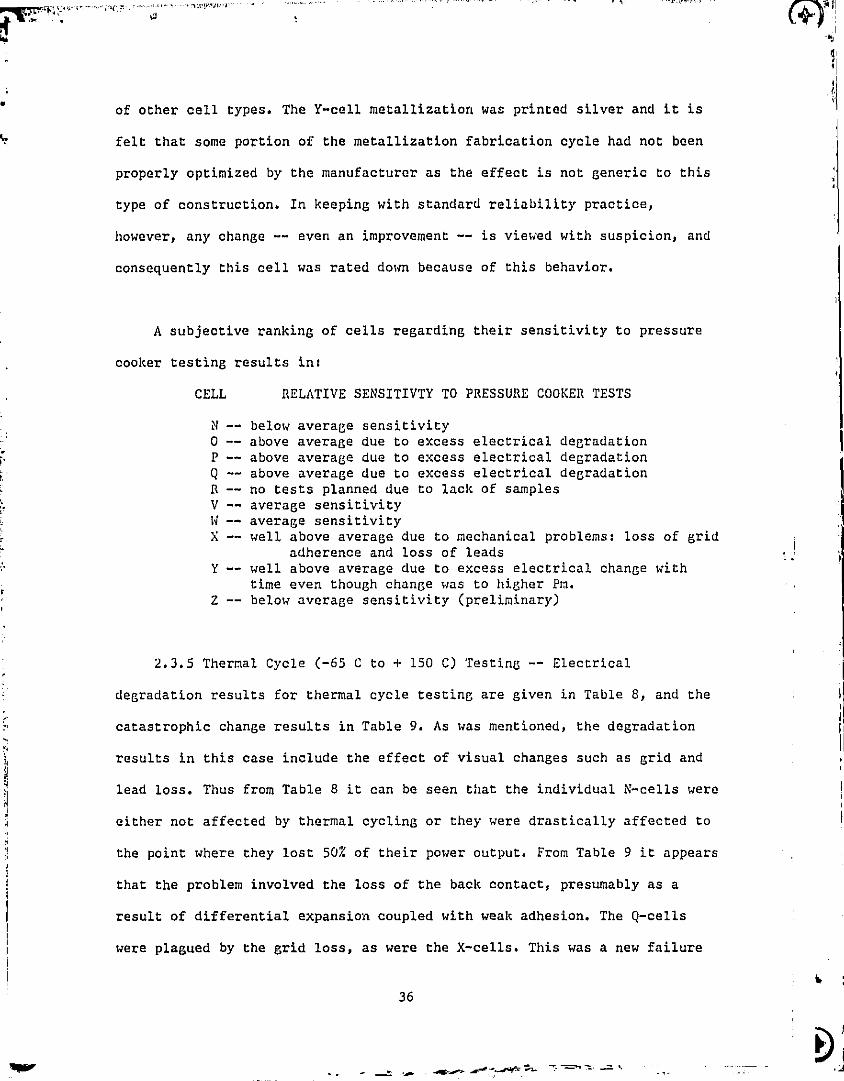
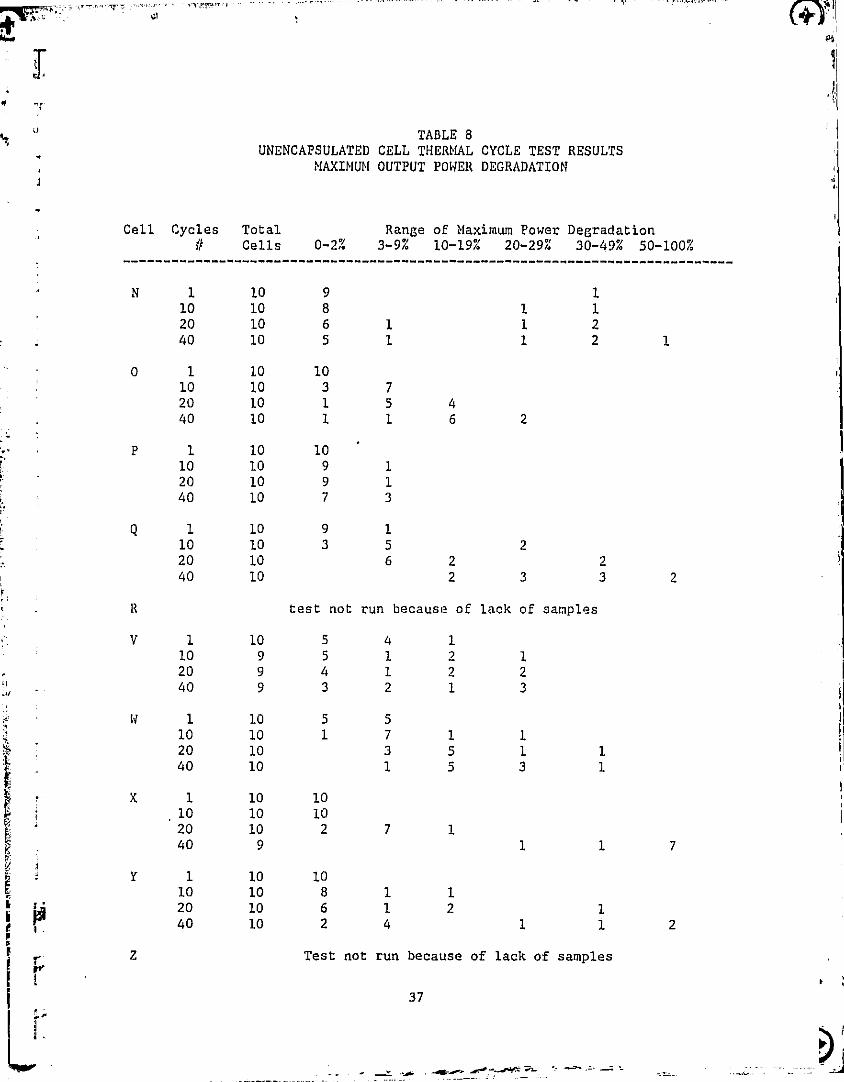
2.3.5 Thermal Cycle (-65 C to + 150 C) Testing -- Electrical
degradation results for thermal cycle testing are given in Table 8, and the
catastrophic change results in Table 9. As was mentioned, the degradation
results in this case include the effect of visual changes such as grid and
lead loss. Thus from Table 8 it can be seen that the individual N-cells were
either not affected by thermal cycling or they were drastically affected to
the point where they lost 50% of their power output. From Table 9 it appears
that the problem involved the loss of the back contact, presumably as a
result of differential expansion coupled with weak adhesion. The Q-cells
were plagued by the grid loss, as were the X-cells. This was a new failure
36
w " TABLE 8UNENCAPSULATED CELL THERMAL CYCLE TEST RESULTS
MAXIMUM OUTPUT POWER DEGRADATION1 ;,
Cell Cycles Total Range of Maxim= Power Degradation# Cells 0-0/
-----------------------------------------------------------------------------3-9% 10-19% 20-29% 30-49% 50-100%
N 1 10 9 110 10 8 1 120 10 6 1 1 240 10 5 1 1 2 1
0 1 10 1010 10 3 720 10 1 5 440 10 1 1 6 2
P 1 10 1010 10 9 120 10 9 140 10 7 3
Q 1 10 9 110 10 3 5 220 10 6 2 240 10 2 3 3 2ik
R test not run because of lack of sanples
V 1 10 5 4 110 9 5 1 2 120 9 4 1 2 240 9 3 2 1 3
N 1 10 5 5{ 10 10 1 7 1 1
20 10 3 5 1 140 10 1 5 3 1
X 1 10 1010 10 1020 10 2 7 140 9 1 1 7
Y 1 10 1010 10 8 1 1
ie 20 10 6 1 2 1N'
i a40 10 2 4 1 1 2
rZ Test not run because of lack of samples
I 37

Total #Cell in test
--------
N
------
10
0 10
P 10
4 10
R
v 10
N 10
x 10
Y 10
Z
38
za.
11
sp
PPC..
t1
TABLE 9UNENCAPSULATED CELL THERMAL CYCLE TEST RESULTS
CATASTROPHIC MECHANICAL CHANGE
Defect Category -- M=moderate $ S=severeLeads Fracture Grid Back
M S M S M S M S
-----------------------------------------------------
6
7
1 1 1 1
8 3 8 1
test not run because of lack of samples
3 1
5
2 1 1 10 7
7 2
test not run because of lack of samples
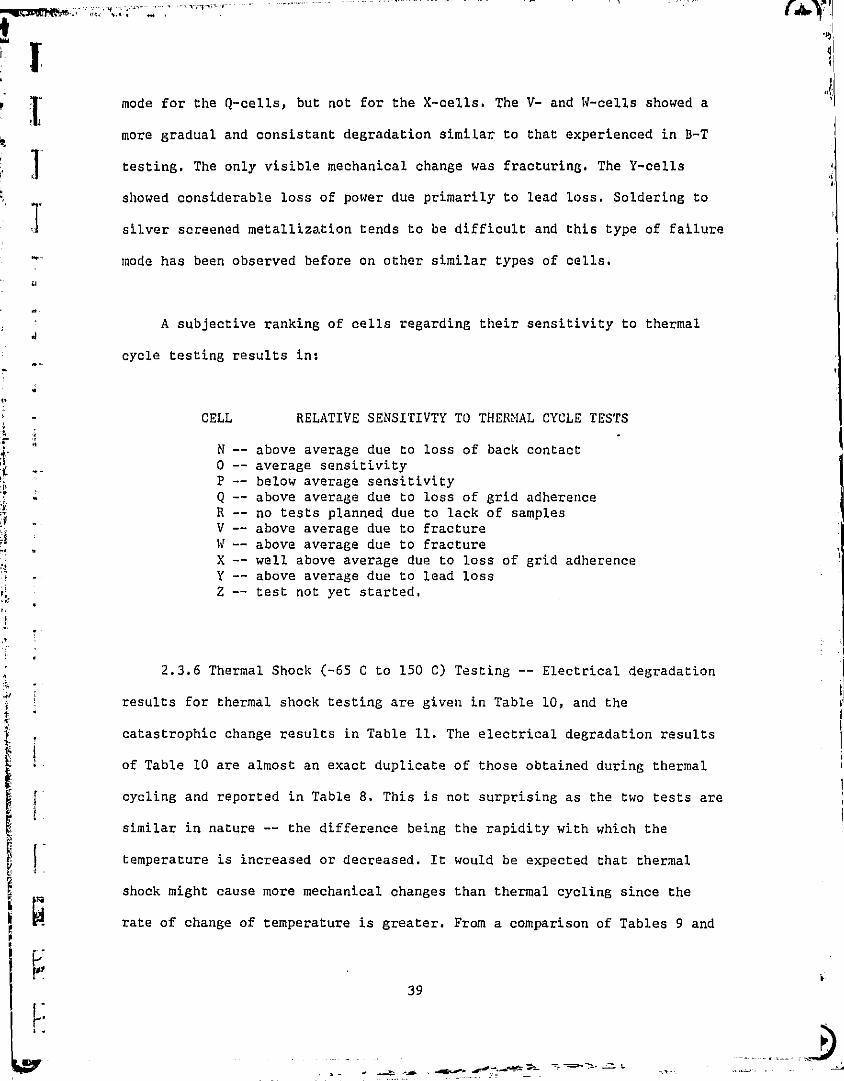
mode for thenl,
lQ-cells, but not for the X-cells. The V- and W-cells showed a
more gradual and consistant degradation similar to that experienced in B-Tt
testing. The only visible mechanical change was fracturing. The Y-cells
showed considerable loss of power due primarily to lead loss. Soldering to
silver screened metallization tends to be difficult and this type of failure
mode has been observed before on other similar types of cells.
Q
A subjective ranking of cells regarding their sensitivity to thermal
cycle testing results in:
CELL RELATIVE SENSITIVTY TO THERMAL CYCLE TESTS
N -- above average due to loss of back contact0 -- average sensitivityP -- below average sensitivity
- Q -- above average due to loss of grid adherenceR -- no tests planned due to lack of samplesV -- above average due to fractureW -- above average due to fractureX -- well above average due to loss of grid adherenceY -- above average due to lead lossZ -- test not yet started.
2.3.6 Thermal Shock (-65 C to 150 C) Testing -- Electrical degradation
results for thermal shock testing are given in Table 10, and the
catastrophic change results in Table 11. The electrical degradation results
of Table 10 are almost an exact duplicate of those obtained during thermal
9 cycling and reported in Table 8. This is not surprising as the two tests are1
similar in nature -- the difference being the rapidity with which the
temperature is increased or decreased. It would be expected that thermal
t^
shock might cause more mechanical changes than thermal cycling since the
F' rate of change of temperature is greater. From a comparison of Tables 9 and
39
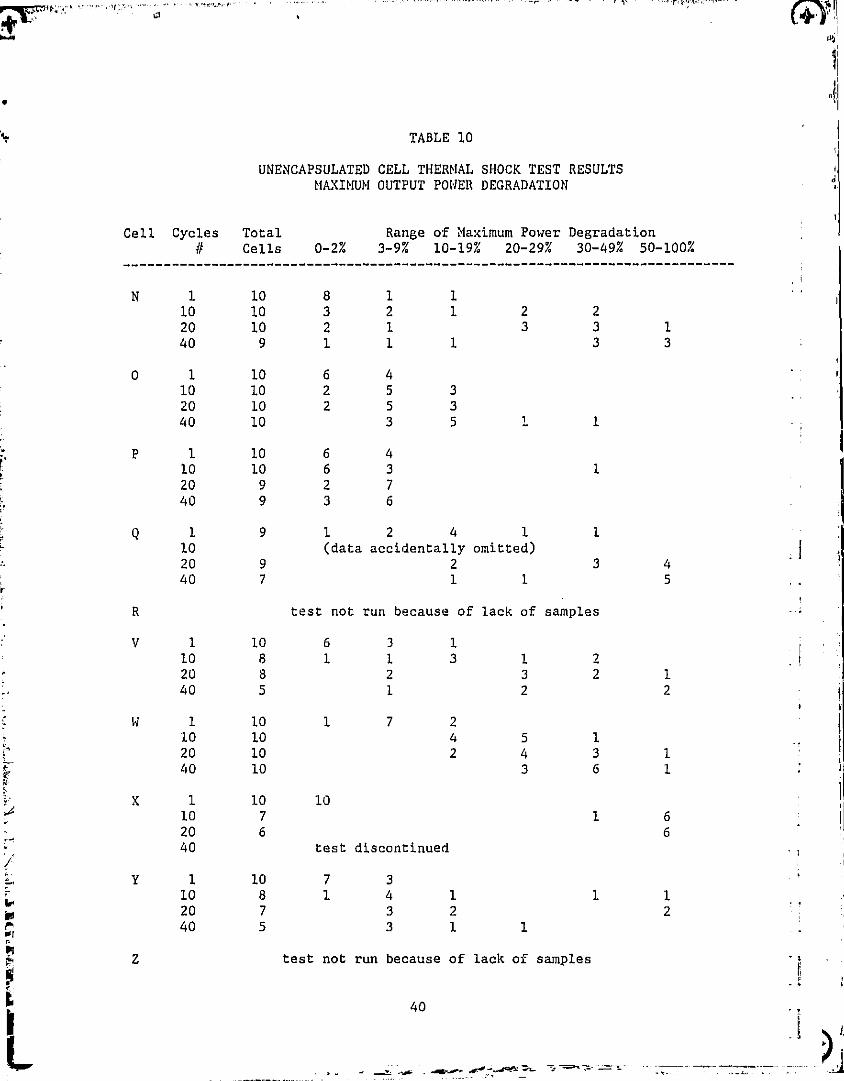
TABLE 10
UNENCAPSULATED CELL THERMAL SHOCK TEST RESULTSMAXIMUM OUTPUT POWER DEGRADATION
Cell Cycles Total Range of Maximum Power Degradation# Cells 0-2%
-----------------------------------------------------------------------------
3-9% 10-19% 20-29% 30-49% 50-100%
N 1 10 8 1 110 10 3 2 1 2 220 10 2 1 3 3 140 9 1 1 1 3 3
0 1 10 6 410 10 2 5 320 10 2 5 340 10 3 5 1 1
P 1 10 6 410 10 6 3 120 9 2 740 9 3 6
Q 1 9 1 2 4 1 110 (data accidentally omitted)20 9 2 3 440 7 1 1 5
R test not run because of lack of samples
V 1 10 6 3 110 8 1 1 3 1 220 8 2 3 2 140 5 1 2 2
W 1 10 1 7 2
10
10 4 5 1
20
10 2 4 3
1
40
10 3 6
1
X
1
10 10
10
7 1
6
20
6
6
40
test discontinued
Y
1
10 7 3
10
8 1 4 1 1
1
20
7 3 2
2
40
5 3 1 1
Z
test not run because of lack of samples
40
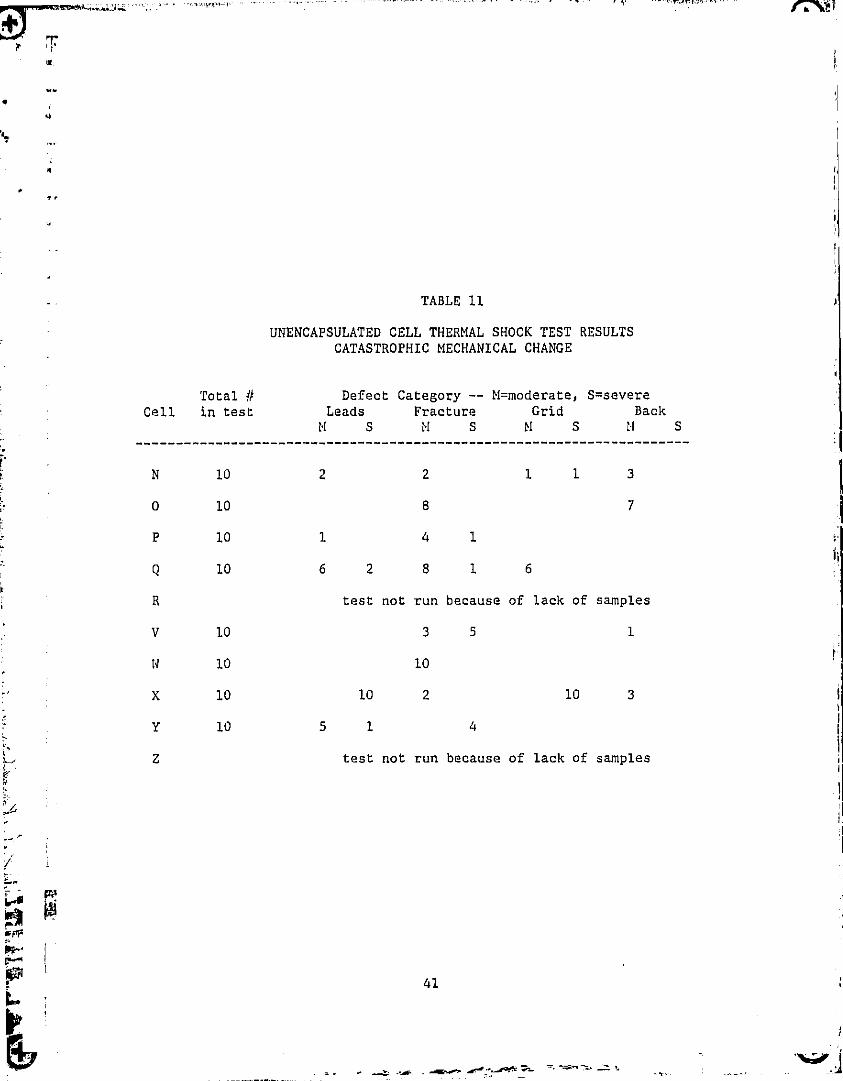
TABLE 11
UNENCAPSULATED CELL THERMAL SHOCK TEST RESULTSCATASTROPHIC MECHANICAL CHANGE
Total # Defect Category -- M=moderate, S=severeCell in test Leads Fracture Grid Back
M S---------------------------------------------------------------------
M S M S M S
N 10 2 2 1 1 3
0 10 8 7
P 10 1 4 1
Q 10 6 2 8 1 6
R test not run because of lack of samples
v 10 3 5 1
W 10 10
X 10 10 2 10 3
Y 10 5 1 4
Z test not run because of lack of samples
41
J

W
a
11 this appears to be the case.
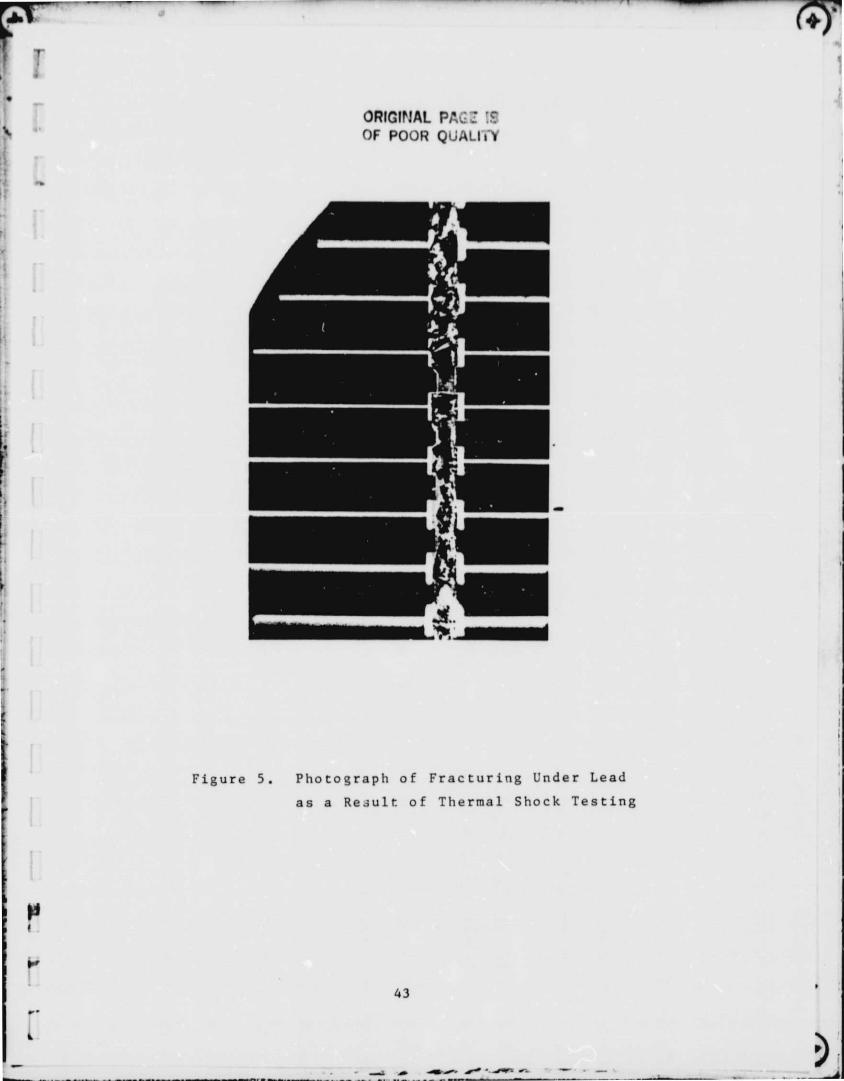
All cell types fracture to some degree during thermal shock testing.
The W-, Y-, and V-cells appear to be particularly susceptible. The X-cell
has a severe problem with grid loss, a phenomenon that was also noticed in
other tests (refer to Section 4.3). In addition, thermal shock resulted in
severe lead loss for the X-cell. This particular cell had an extended lead
contact, i.e. the lead made contact with the cell completely across the
slice rather than only at one point near the edge. When lead loss occurred
the silicon fractured under the metal lead so that it came loose with
silicon still attached. An example of this type of failure is shown in
Figure 5. The combination of these two failure modes was so severe that the
test had to be discontinued after 20 cycles.
The W-cell showed very consistant and progressive electrical
degradation. The routine inspections, while they showed some fracturing, did
not seem to indicate any visual effect capable of producing such a
consistant behavior and further study is warrented. The W-cell had also
shown this same consistant and progressive behavior as a result of thermal
cycle testing.
The liquid transfer thermal shock test is so drastic a test it is a
wonder that all cells do not self destruct. One type, the P-cell was only
relatively minimally affected by the test. Only one cell in the test lot
showed appreciable degradation and it was due to a severe fracture. The
P-cell also behaved the best during thermal cycle testing.
42
a.,I
r2^^
^1
kL
/ 9.
^tr^
i
43
1Y7I`
ORIGINAL PAGZ ;SOF POUR QUALITY
Figure 5. Photograph of Fracturing Under Lead
as a Result of Thermal Shock Testing
i
V?

e
4 A subjective ranking of cells regarding their sensitivity to thermal
` I
S
shock testing results in:
CELL RELATIVE SENSITIVITY TO THERMAL CYCLE TESTS
N -- above average due to back contact problems0 -- average sensitivityP -- well below averageQ -- obove average due to fracturingR -- no tests planned due to lack of samplesV -- above average due to fracturingW -- well above average due to electrical degradationX -- well above average due to lead loss and grid failureY -- above average due to lead lossZ -- no tests planned due to lack of samples
b
M
44
t \f.
S
3.0 STRESS TESTING OF ENCAPSULATED CELLS
45
6
^IJ.I
3.0 STRESS TESTING OF ENCAPSULATED CELLS
3.1 Introduction
As indicated in Section 2, accelerated stress testing of
unencapsulated cells is able to delineate certain failttre mechanisms which
may affect cell life in field operation, such as Schottky barrier contact
formation (non-linear IV characteristic) and loss of contact adherence.
Cells in use, however, are not bare, but are encapsulated in modules and it
is not evident what effect encapsulation will have on the failure modes
observed during unencapsulated testing. Ideally it would be desireable to
subject encapsulated cells to the same type of accelerated testing as
unencapsulated cells. Previous work has shown, however, that because of the
organic pottant materials involved, extraneous failure modes are introduced
when temperatures higher than 100 C are used. The use of temperature as an
effective acceleration factor is therefor severly limited once the cell has
been encapsulated. However, it was felt that since encapsulation could bei
expected to primarily influence the rate of corrosion, either reducing it
by limiting moisture penetration or increasing it by trapping moisture and
chemical byproducts on the surface, that the 85 / 85 test would perhaps
provide useful accelerated test information. Thermal cycling would be
another potentially valuable accelerating test, provided the upper
temperature did not exceed 100 C.
In order to see the effect of these two tests on cells which were
encapsulated and to compare them with the unencapsulated test results,
47 Llf t^TeNTraHAIiY 9LAllt
PRECEDING PAGE BLANK NOT FILMED11
Al
J
Clemson contracted with Springborn Laboratories of Enfield, CT to fabricate
a number of single cell modules, hereafter called coupons, using different
cell types and different encapsulation configurations. The reader can gain
an appreciation for the size and shape of the coupons by referring to
Figure 10 which shows a number of different types assembled in an outdoor
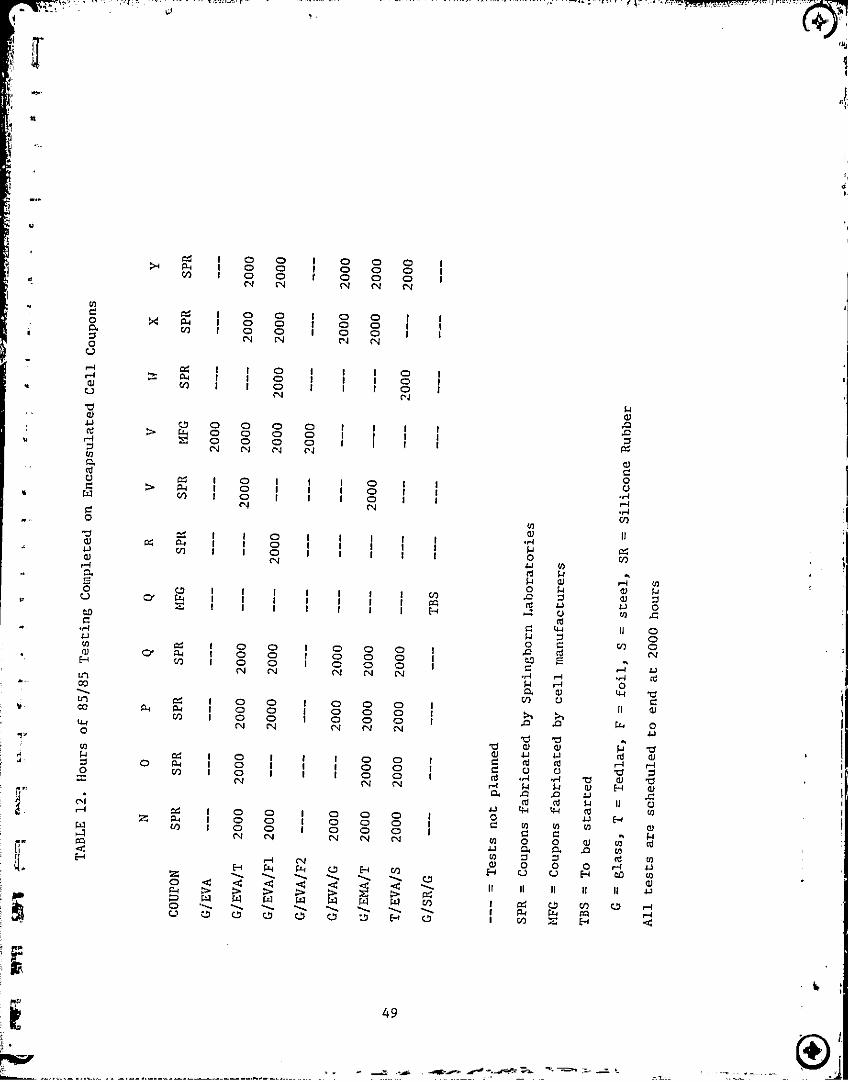
array. In addition to the Springborn samples, several manufacturers also
supplied coupons of their cells. The result was the matrix of samples shown
in Table 12. In this table each row refers to a different encapsulation
configuration and each column to a different cell type and whether it was
encapsulated by Springborn or by the cell manufacturer. Note that the
manufacturer of the V-cell supplied coupons which included no substrate
(G/EVA) and two different• types of foil substrates (G/EVA/F1 and G/EVA/F2).
(The designation Fl and F2 is only used to differentiate between these two
types of coupons and does not imply that the F1 configuration is similar to
those fabricated by Springborn Labs for the other cell types.) It can be
seen that with the exception of the glass/silicone rubber/glass
encapsulated Q-cells, which have yet to be started, all cells have
completed the full 2000 hour test.
Testing of the encapsulated cells was more difficult and less
"reliable" than testing unencapsulated cells for a number of reasons. For
one thing, the coupons were physically bigger than the cells so that fewer
were able to fit in a test chamber. Assembly of the coupons utilized
non-standard, laboratory-like processes, involving components having widelyi
differing thermal masses, with the result that curing cycles were not
necessarily optimized. In fact the organic pottant material in several
cells "ran" even though the stress temperature during test did not exceed
48
r
r _
?r P4 I O O I O O Oy 1N N
f O O iNN
yC
ao DC i a 0o i o° oc en 1 0 o I o o I IN N CJ00
N
a o° °ov N 1U
1 O I I I O 1N CJ
W
W 0 I 1Cd a O O 111
I
7 o o O a 1 II
N N N N I IyC.N
P4 1 0 1 I I O I Irg V) 1 0 I 1 1 O 1 1C NO
'y ^'w
x a1 I O I I I I 1
aNr1
aC-U d W I 1 1 j
1 1 N
I 1
I 1to .. I I I I FC
U
a 1 O O O Iti O' Y 1 On 1 O O 1 O a 00 1N N N N Ncot
Ln a 1 O O I O O O
0I
co i °o C) i as 00110 N N N N N
0I OO
O W 1V7 I 1 I O OS O I I O O 1NN N
C4 5 I o O I O O O Ill 1 O 1 O o O 1Wa
to O1N N N N N
F"F"
rPa
Nw 0 H v7
a ca w w w w w w h`o' C7 :7 H C7
I ,.
NC1aar^
UCOU
r-J
hyv II..l
o aV)L y
0 N yaA 7 y
b u , 0O
a U ym
II OwA Od NCo
,
.r1 r-I :C
06
0
O
44 TIco U zn v
A A w oub b
NC U
U r Nb 7
CdHr-1 N N H NG A a G
E^ W
wN II U
N yO HC y y y Nul 00
C p y N1J yy O 7C1 O O O -
ce1
4JH U U H 00 yu u n u u
i w wco
I V) H d
i
49
1.
,..I "m^.^..:.-
h q-r
li
A'M
85 C. In this case pottant material dripped from the coupons leaving the
1
'V
cells directly exposed to the test ambient. These coupons were withdrawn
from testing and samples sent to Springborn Laboratories where examination
revealed incomplete curing of the polymer. Unfortunately there is no way to
visually detect such improperly cured encapsulation prior to stress
testing. It is therefore entirely possible that modules having similarly
improperly cured encapsulation could be unknowingly deployed in the field
unless adequate process controls are used. Loss of pottant does not
automatically mean electrical degradation, however.
The expense of fabrication, coupled with limited test chamber size,
restricted the number of coupons in a test to five or less. Hence it was
difficult to obtain results which were statistically meaningful. Accurate
electrical measurement was also more difficult than with unencapsulated
cells. Temperature measurement and control was complicated and less
accurate since the cell itself was inaccessible. Kelvin probe connections I
could only be made to the external leads, whereas with unencapsulated cells
connections could be made directly to the back metallization. The leads
were also fragile in relation to the large mass of the coupon and, despite
careful handling, a number of cell leads broke due to repeated bending. Of
course lead breakage under these circumstances was not considered a failure
mode, but only an artifact of the measurement technique.
3.2 85/85 Test Results
As was discussed in Section 2.3.3, the 85/85 test is a relatively mild
test and only small changes were observed when it was applied to
50

[T
i
u
4su.
0+77J
unencapsulated cells. Nevertheless, rather substantial amounts of
degradation were observed when encapsulated coupons of these same cell
types were tested. This rather anomalous result, which had been alluded to
earlier in the 1981 Summary Report (4) as a result of preliminary testing
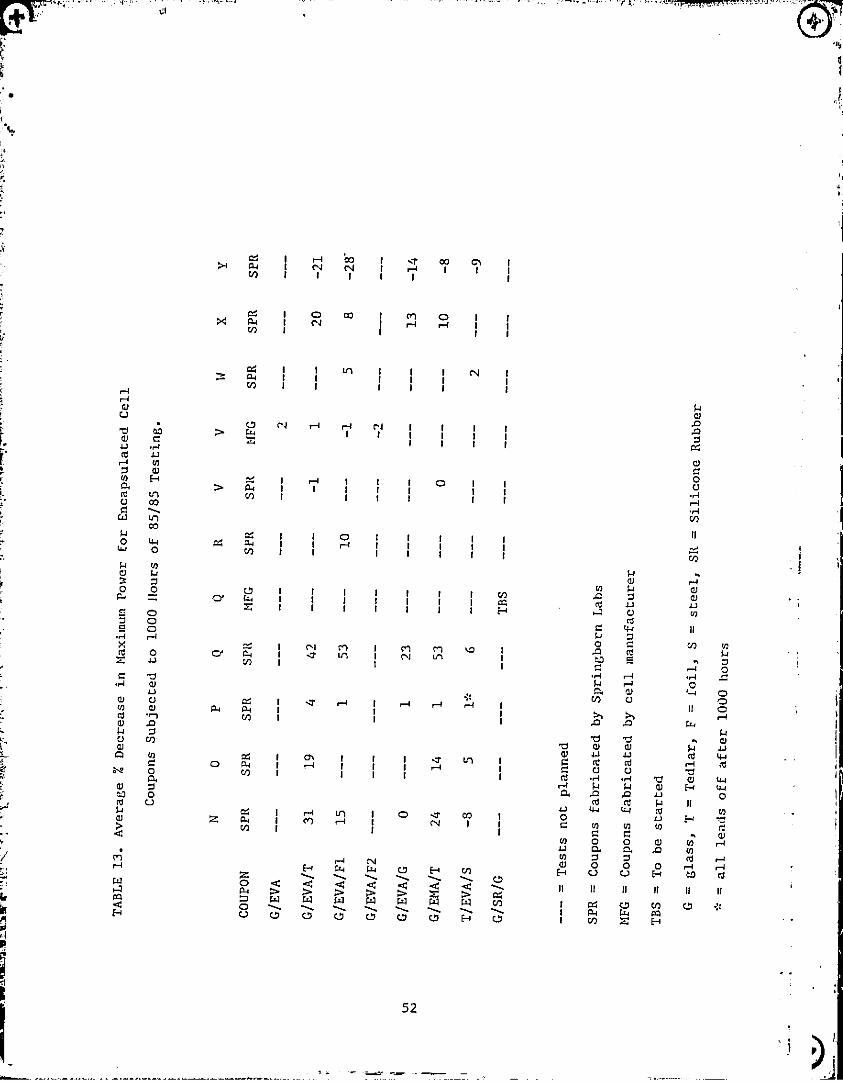
performed on encapsulated cells, has now been confirmed. Table 13 presents
the test results in the form of the average percent decrease in maximum
power output observed for each of the different encapsulation
configurations after 2000 hours total test time. Even recognizing that only
a few coupons of each type were involved, a number of effects can be
detected. The data of Table 13 will now be discussed on a cell-by-cell
basis with conclusions regarding the different encapsulation systems
specifically pointed out.
ne
The P- and V-cells showed essentially no degradation for any type of
encapsulation. The V-cells had shown little effect when stressed in
unencapsulated form, whereas the P-cells had shown somewhat more, with 2
out of 11 cells in the 10 to 19 degradation range after 1000 hours (See
Table 4.). Nevertheless, these two cell types were judged to be very stable
in unencapsulated form and remained so when encapsulated. While data for
the encapsulated W-cells is not as comprehensive as that for the P- and
i
V-cells, it does not appear that this cell type exhibits any significant
r amount of degradation when encapsulated either.
Thus it would appear that a cell which shows little changewhen stressed in unencapsulated form will be stable when
I
encapsulated, no matter what the encapsulation system.
iz
The Q-cells, on the other hand, showed large degradation for all types
of encapsulation except T/EVA/S. This cell when tested in unencapsulated
51
t
HO1
aa
C
ro
0U
•rl
r-I
NII
vJ
1-+
y N C~Ja 7 vti
JJ yU yro
II7O
My yt
toO^.^ r-J .rl
N r-I y0
J7 U
A Ar-I
W
b O W H Uv u r, ro w
C UCd ccU Hj
rd a
4 AF 0
P u
W 4 IIuy yO0
u H ,^C
CyC
0u 0 a yy 7 7 ro r
U Ur-IH
II II II
H to ro
a w
II II II
wI [n ^ H
ck
I
EI ^ 4
5 ^
i
rarlUU
b ^U CL .rlro „
y^ va `"U 00CW co
WN
4 O
rNJ V30
0r O
Oc OxXIt Oa. r,
.rCi y
w U
y OrJU aN 7U (ntllq
Co\° O
OJ 0U Ow U
d
N
Waw
F
>+ w 1 N N 1 r4h 1 1 I I I 1
X aO co I Cl) O I 1
1 i rJ r I I
I 1
W I I Ln j I C'4 1In I 1 I I I 1
>r-4
N r- I rl N 1 I I I
I 1 I I 1 I1 1 1 I
> Pa 1 rl I I IO I I
h I 1 1 1 I I
M4 1 rO-I I 1 I I I
I I 1 I 1
o' w"x
1 1 1 1 I I 1 H
Co w I vl iLn1 N rl I
V)I N v
1 I
C I .7 r-I 1 r-I r-I Iry-J 1w w 1 1N 1 I 1
1 I I I d ^ IO
Nr- 1 I I I .-1
I I 1 1
z N
i m r-I I O N ^j 1
1 1
H W LNz+ C7 H rn
a W W W W > W W
U C7 Ch U' ^ C5 C7 H C7
52
\ 1.^ /1
i
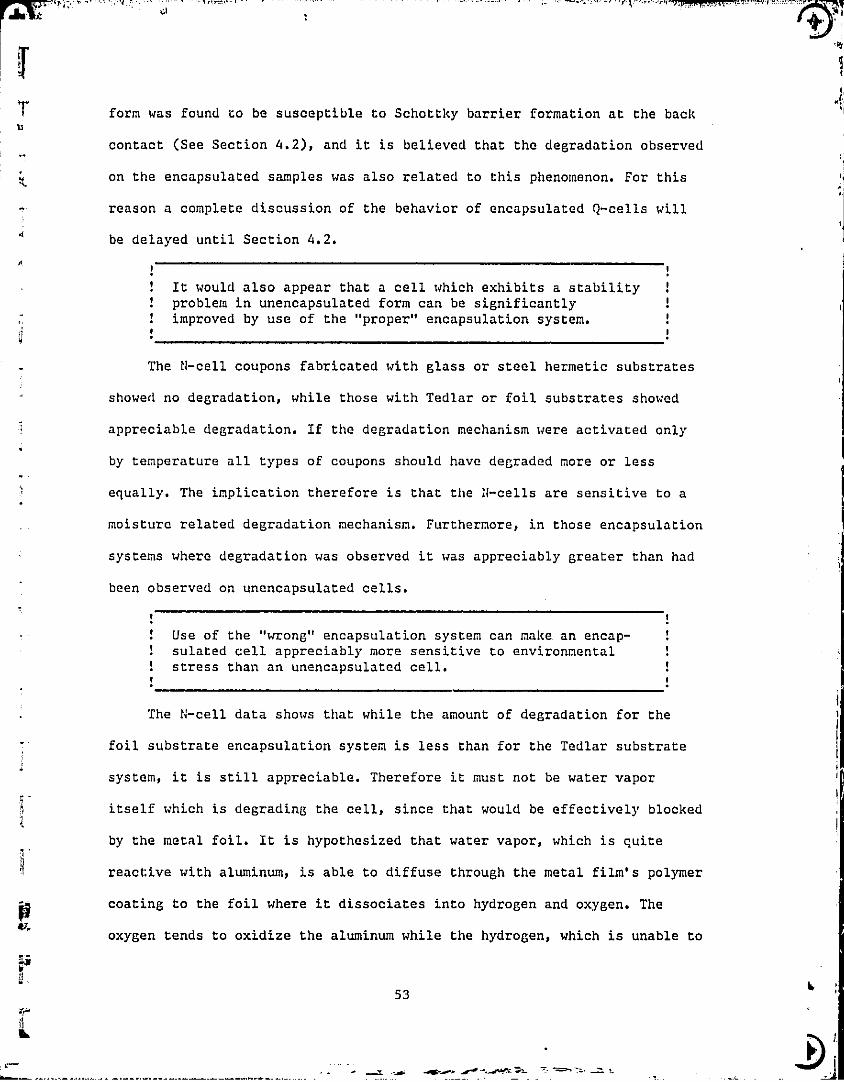
form was found to be susceptible to Schottky barrier formation at the backu
contact (See Section 4.2), and it is believed that the degradation observed
on the encapsulated samples was also related to this phenomenon. For this
reason a complete discussion of the behavior of encapsulated Q-cells will
be delayed until Section 4.2.
!
!It would also appear that a cell which exhibits a stabilityproblem in unencapsulated form can be significantlyimproved by use of the "proper" encapsulation system.
The 11-cell coupons fabricated with glass or steel hermetic substrates
showed no degradation, while those with Tedlar or foil substrates showed
appreciable degradation. If the degradation mechanism were activated only
by temperature all types of coupons should have degraded more or less
equally. The implication therefore is that the N-cells are sensitive to a
moisture related degradation mechanism. Furthermore, in those encapsulation
systems where degradation was observed it was appreciably greater than had
been observed on unencapsulated cells.
!Use of the "wrong" encapsulation system can make an encap-sulated cell appreciably more sensitive to environmental
! stress than an unencapsulated cell. !
The N-cell data shows that while the amount of degradation for the
foil substrate encapsulation system is less than for the Tedlar substrate
system, it is still appreciable. Therefore it must not be water vapor
itself which is degrading the cell, since that would be effectively blocked
by the metal foil. It is hypothesized that water vapor, which is quite
reactive with aluminum, is able to diffuse through the metal film's polymer
coating to the foil where it dissociates into hydrogen and oxygen. The
oxygen tends to oxidize the aluminum while the hydrogen, which is unable to
atl
53rr "
fj
i .'i rte. /♦ /^'. 2 ^^^
u^

w •^,
`^ 9
escape easily through the polymer film, becomes trapped and increases in
concentration at the metal surface. This raises the probability of hydrogen
diffusing through the 1-mil thick foil and eventually reaching the metal
contact-silicon interface. It is further hypothesized that the presence of
hydrogen alters the surface state density at the interface, as will be
described in Section 4.2, and results in degradation of the cell. While
this exact sequence of events has yet to be proven there is good
circumstantial evidence for its occurrence. The point to be made from the
data tabulated in Table 13 is that a 1 mil thickness of aluminum, coated
with a polymer, ac,arently does not present much of a diffusion barrier to
atomic hydrogen. In additie:,, aluminum is quite a reactive material. It
would be interestin to see if uncoated aluminum foil and foils of other
materials, gold for example, might behave differently as would be predicted
by the model.
! !! Metal foil, as presently formulated, does not provide an !! effective barrier against moisture related degradation. !
The only cell type, other than the Q, to show any significant amount
of degradation when encapsulated in the T/EVA/S configuration was the
0-cell. !,'hile the amount of degradation was only about one-third that of
the other two configurations, the effect was nevertheless felt to be real
since all five coupons in the test showed about the same amount of
degradation. Degradation did not appear until after 1000 hours, however,
and it is surmised that the mechanism in this case was not moisture
activated. As seen from Table 2, the 0-cell was susceptible to
bias-temperature testing and it is felt that the degradation observed
during 85/85 testing was more a result of the 85 C temperature rather than
of the 85% relative humidity. In addition to Pm degradation this
54
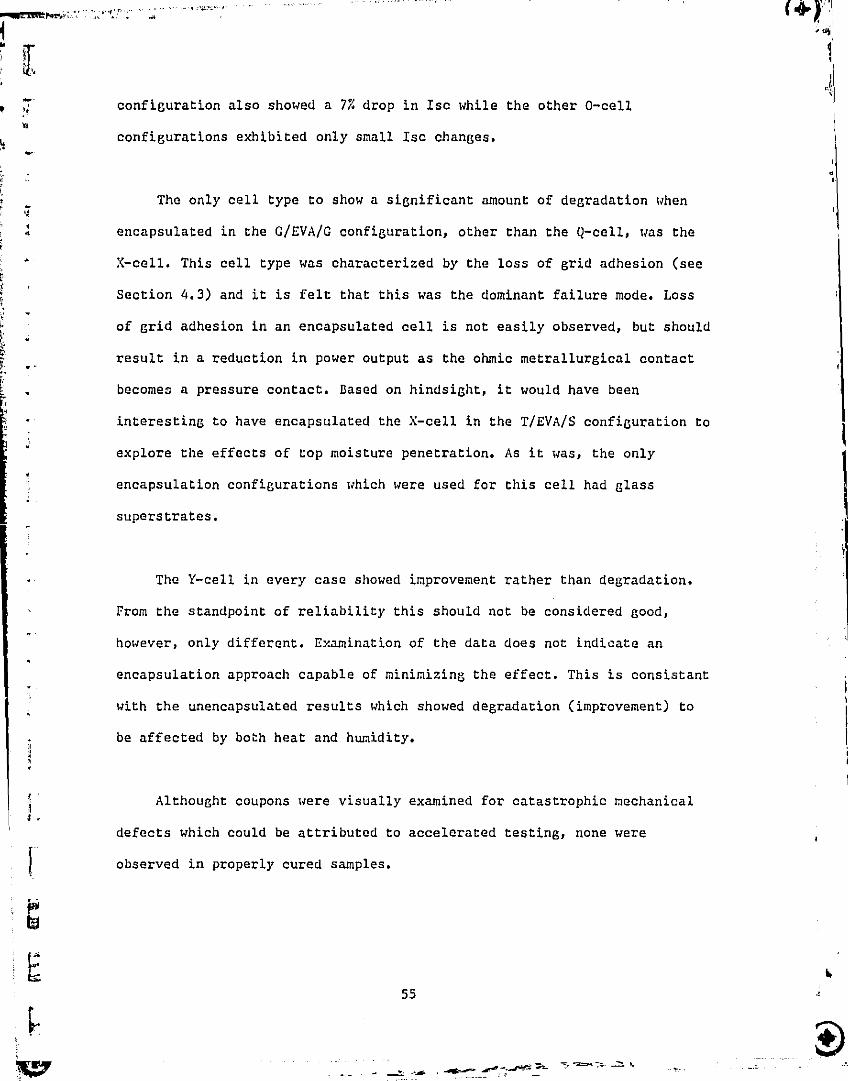
Iconfiguration also showed a 7% drop in Ise while the other 0-cell
configurations exhibited only small Ise changes.
The only cell type to show a significant amount of degradation when
encapsulated in the G/LVA/G configuration, other than the Q-cell, was the
X-cell. This cell type was characterized by the loss of grid adhesion (see
Section 4.3) and it is felt that this was the dominant failure mode. Loss
of grid adhesion in an encapsulated cell is not easily observed, but should
result in a reduction in power output as the ohmic metrallurgical contact
becomes a pressure contact. Based on hindsight, it would have been
interesting to have encapsulated the X-cell in the T/GVA/S configuration to
explore the effects of top moisture penetration. As it was, the only
encapsulation configurations which were used for this cell had glass
superstrates.
The Y-cell in every case showed improvement rather than degradation.
From the standpoint of reliability this should not be considered good,
however, only different. Examination of the data does not indicate an
encapsulation approach capable of minimizing the effect. This is consistant
with the unencapsulated results which showed degradation (improvement) to
be affected by both heat and humidity.
Althought coupons were visually examined for catastrophic mechanical
defects which could be attributed to accelerated testing, none were
observed in properly cured samples.
n
55 s
Oiltit
^r.
3.3 Thermal Cycle Test Results
Only five samples each of four different types of V -cell coupons,
G/EVA, G/EVA/T, G/EVA/F1, and G/EVA/F2, plus one sample of a G/SR/G Q-cell
coupon were subjected to thermal cycle testing because of a lack of
availability of other types of samples. Very little change was noticed after
testing, either electrically or physically, which reinforces the conviction
that encapsulation is required to provide mechanical protection. Fracturing
had been observed when unencapsulated V-cells where thermal cycled, but not
when the coupons were thermal cycled. The Q-cell was sensitive to several
Forms of mechanical change in unencapsulated form, but no effect was
observed when the coupon was tested. The only electrical degradation
detected after 40 cycles was 10 % on one G / EVA/F coupon and 22'; on one
G/EVA/G coupon, with none of the others showing any measurable change. Both
cells showed progressive degradation after 10 cycles, however. No visual
change was observed which could accout for this degradation. The IV
characteristics of the two degraded cells indicated the presence of a large
shunt resistance. Further work will be required to determine its source.
56
- .1

4wil
„I
4.0 DETERMINATION OF FAILURE MECHANISMS

;kw uyn- lei
y,
a
4.0 DETERMINATION OF FAILURE MECHANISMS
4.1 Introduction
As discussed in Sections 2 and 3, accelerated stress testing of both
encapsulated and unencapsulated cells resulted in reduced power output. A
major goal of the Clemson program is not only to know the magnitude of this
degradation and the conditions under which it occurs, but to also discover
the underlying physical, chemical, and metallurgical reasons as well.
Learning these reasons can be as complicated and involved as tracking down
a murder suspect. It calls for following hunches as well as the painstaking
use of very sophistocated analytical equipment. In this section we discuss
two failure modes that were observed on specific cell types during this
round of testing -- Schottky barrier contact formation and loss of grid
adhesion. In the case of Schottky barrier contact formation it is felt that
the circumstantial evidence that has been accumulated clearly points to the
mechanism involved. In the case of the loss of grid adhesion the hunt for
the mechanism is still in progress. It is clear from these two examples
that determination of degradation mechanisms calls for the latest in
microanalytical instrumentation. Clemson is in the process of establishing
a reliability research facility containing such equipment and a brief
description of the capabilities that will be available is given in this
section.
^r,^. C^ ^T ^'C. c :1C P ?:A NK NOT F:':N!"
59
IRTENTIONALLY BLANK
r
M .vj
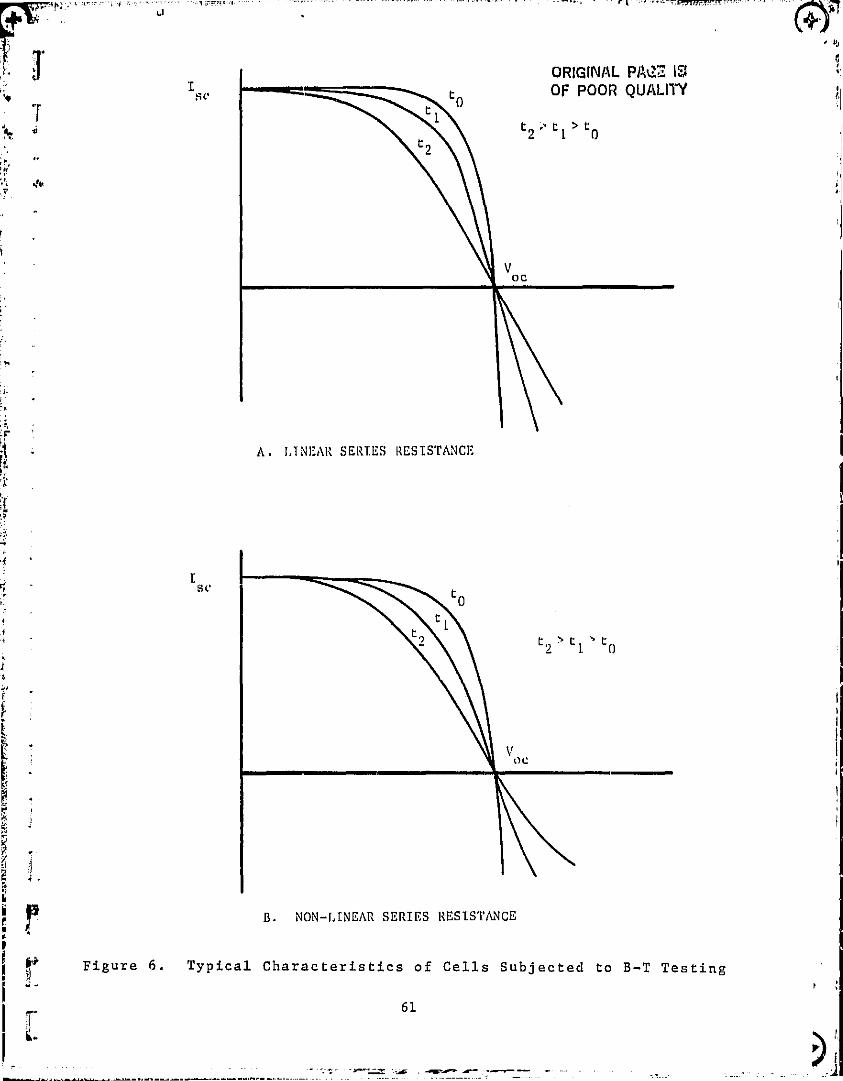
4.2 Schottky Barrier Formation
Most unencapsulated cell types which degraded when subjected to B-T
testing did so as a result of an increase in series resistance. This
increase caused a decrease in the linear slope of the V-I characteristic in
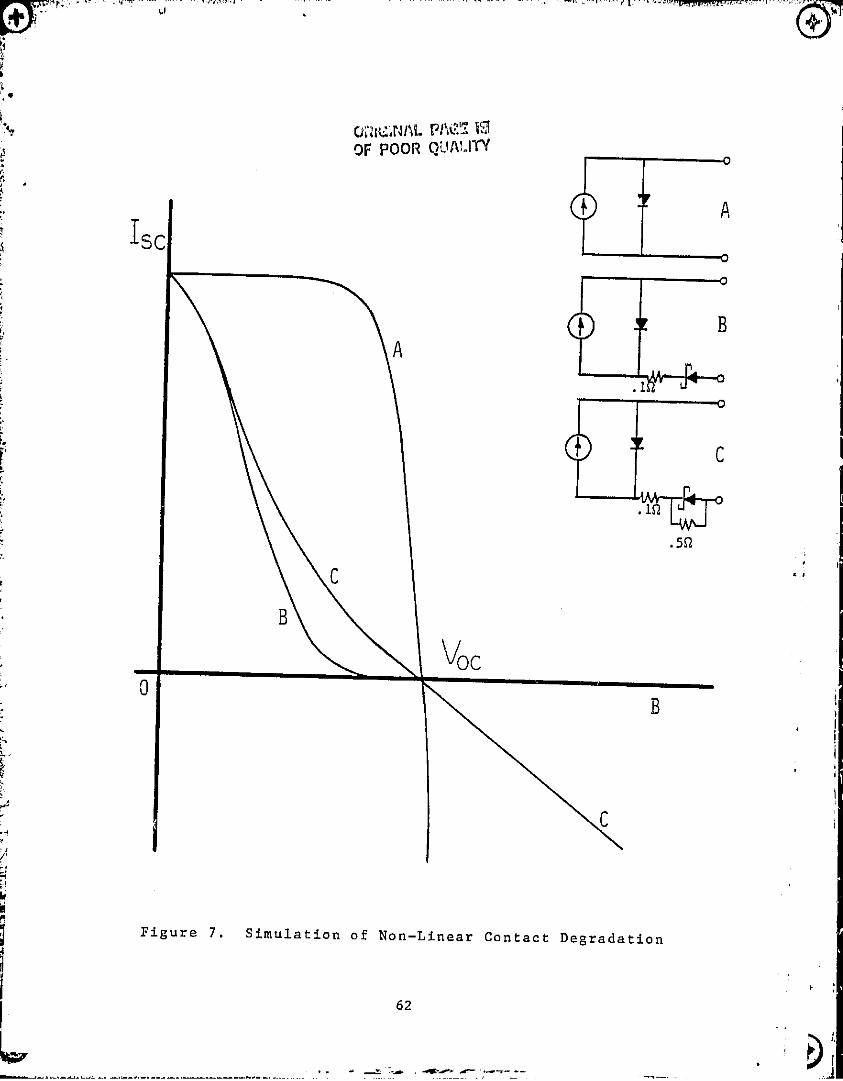
the vicinity of Voc, as shown in Figure 6a. One cell type, the Q-cell,
however, developed a distinct non-linearity as shown in Figure 6b. The
non-linearity was most pronounced in the far-forward region of the
characteristic (V>Voc) and could easily be missed if only the power
quadrant were observed. Construction of this particular cell involved a
chemical displacement gold film to provide a good plating surface, followed
by electroless nickel plating, followed by a solder dip to provide the
thick conductive layer. The silicon material was p+ on n. The non-linear
shape of the characteristic that was observed after stress testing implied
the formation of a rectifying contact, and because the back contact was
lightly doped, this would be the most likely location. To simulate this, a
discrete Schottky barrier diode was connected to the back of an unstressed
cell, with the result shown in Figure 7. Curve A is the unstressed cell
characteristic. Curve B is with the Schottky barrier diode connected
(connections added about 0.1 ohm series resistance), and because it is
unrealistic to expect the back contact to have the right-angle shape of a
commercial diode, Curve C is shown in which the diode was shunted by a
half-ohm resistor rusulting in a less ideal rectification characteristic.
In the power quadrant it can be seen that the effect of the forward diode
drop is to push the IV characteristic to lower voltages with a consequent
reduction in power output. In the far-forward region only diode leakage
_—. _....... .. ,. ..n ^LZM
fIS
Isr
B. NON-LINEAR. SERIES RESISTANCE
w
A. LINEAR SERIES RESISTANCE
Figure 6. Typical Characteristics of Cells Subjected to B-T Testing
61
,0„ aT
tAl
i"L.
4
Y
i.
N.
OF POOR QUAI-ITY
Figure 7. Simulation of Non-Linear Contact Degradation
62
yYW
I
M •f.
'f
current flows, or in the case of the shunted diode, current throught the
...... . ..............
w
w
b^
resistor shunt. It can be seen that , the shape of Curve C is indeed of the
same general non-linear shape as that observed oa a stressed Q-cell.
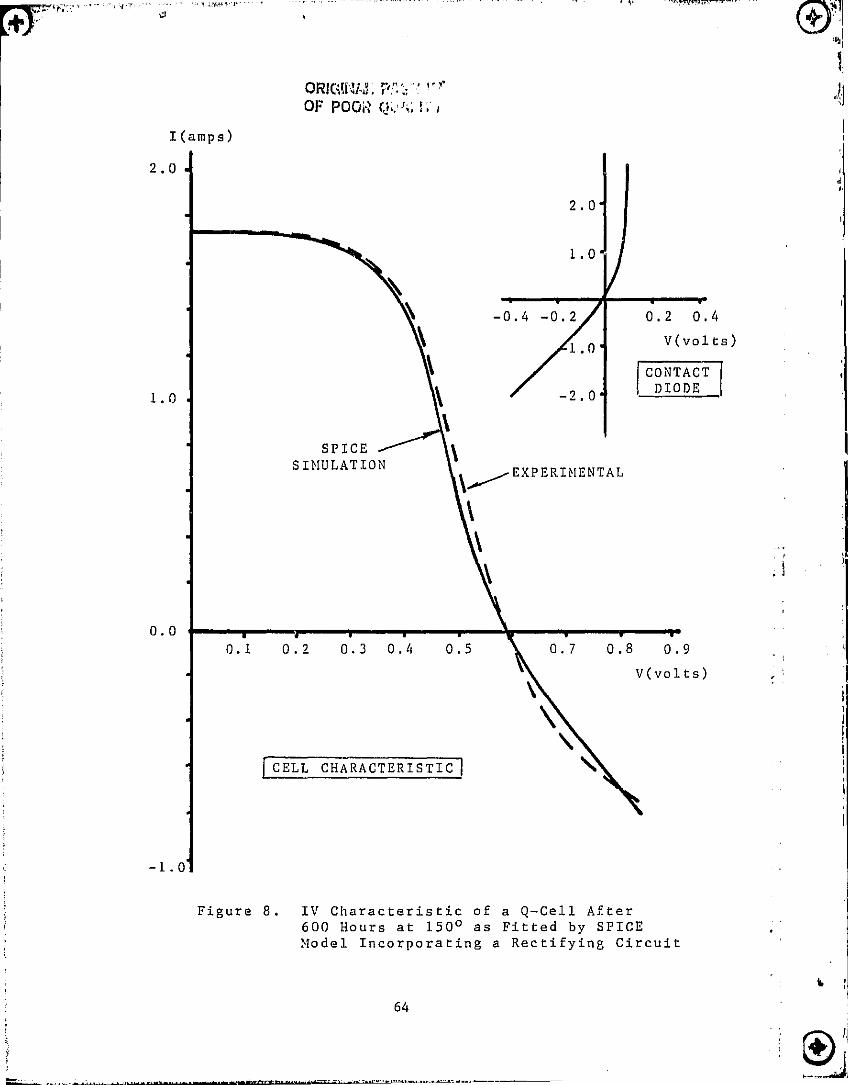
To explore this further the characteristic of a stressed Q-cell was
fitted using a computer program, SPICE, and the equivalent circuit of
Figure 7 Curve B (without the 0.1 ohm resistor). The result is shown in
Figure 8. As had been anticipated, the contact diode characteristic that
was required to fit this curve was far from ideal, but enabled a good fit
to be obtained.
Most ohmic contacts to solar cells conduct by virtue of quantum
mechanical tunnelling. Such tunnelling occurs when the semiconductor is
heavily doped, as would be the case with a back surface field. Heavy
degenerate doping results in a thin poter..tial barrier that electrons are
able to penetrate quantum mechanically. In the case of the Q-cell, however,
the base material is not heavily doped and ohniticity of the contact is
achieved by obtaining a low, rather than a thin barrier. It is well known
that the rectifying properties of a metal-semiconductor contact are
determined largely by the surface states which exist at the interface. The
Q-cell achieves its low potential barrier via a damaged surface formed by
sandblasting, which serves to provide large quantities of surface states.
These surface states, combined with those which would occur naturally at
the interface, result in a low, easily surmountable barrier.
The difficulty with this type of contact is that stress conditions
occurring in the field (or during laboratory accelerated testing) can
,; rA'r
63
1,I
;I1
d
u
I(amps)
2.0 j
OF POOR
-0.4 -0.2 0.2 0.4V(volts)
1.0
,EXPERIMENTAL
0.00.7 0.8 0.9
V(volts)
-1.0
Figure 8. IV Characteristic of a Q-Cell After600 Hours at 150 1 as Fitted by SPICE:Model Incorporating a Rectifying Circuit
64
.:1YY ^
E'
1 , 1^
result in a change in the number of surface states. Hence a contact whichi
was originally ohmic may become rectifying, as occurred with the Q-cell. To
explain this a theory is proposed based on the fact tha°. ,.Irface states are
a result of dangling silicon bonds, i.e. silicon valence electrons at the
surface that are not shared with electrons from other atoms. At a
crystalline surface silicon normally interfaces to the ever present layer
of oxide. Experimenters have found that non-stoichiometry occurs in surface
d oxide films within a few Angstoms of the silicon oxide/silicon interface
(6) giving rise to surface states which control the potential barrier
height. Furthermore it has been demonstrated that it is possible to control
the Schottky barrier height over a wide range by using shallow, highly
doped ion implanted layers to achieve a desired degree of bond saturation
(7). It should be possible, therefore, for elements in atomic form such as
oxygen or hydrogen to diffuse to the interface and to also saturate the
dangling silicon bonds, decreasing the number of interface states., raising
the barrier height and forming a rectifying contact. It is unlikely that
oxygen is the diffusing species, however, since its diffusion coefficient
in metals is so small -- of the order of IUE(-23) cm2/sec at 100 C (8). The
diffusion coefficient of hydrogen, on the other hand, is J or 10 orders of
magnitude greater (9, 1U, 11). Atomic hydrogen and oxygen can be formed by
the dissociation of water vapor molecules at the metal surface. The
penetration of hydrogen through metals under high humidity conditions has
been reported in the literature (12, 13, 14, 15) and has been found to be
strongly dependent on the surface conditions of the metal. Schottky barrier9
contact formation should take place on lightly doped silicon whenever
moisture is present to supply the hydrogen and when the temperature is
elevated to increase diffusion to the interface. Indeed non-linear
65
characteristics were observed on the Q-cell under these conditions. A
method of determining the metal to semiconductor barrier height has been
developed and is described in Appendix A. Measurements made using this
method on typical degraded cells which exhibit non-linearity give a barrier
height of 0.55 ev, whereas unstessed cells having ohmic contacts will have
a barrier height of approximately 0.3 ev. An experiment which needs to be
run and which is currently being planned is to specifically exclude water
vapor from the cell environment during B-T testing in order to confirm the
role of water vapor.
! !11hile further work is expected to shed additional light on !the exact mechanisms involved in Schottky barrier formation, !it is nevertheless evident that the use of a lightly doped !
! substrate can lead to back contact rectification, and should !be avoided. A thin highly doped layer under the back contact !
! has the added advantage of providing a back contact field !! and thus improving the cell's efficiency. !!
When either encapsulated or unencapsulated Q-cells were exposed to
85/85 testing, Schottky barrier formation, as evidenced by the formation of
a non-linear characteristic, did not occur within the normal 2000 hour time
span. Degradation involved an increase in series resistance, but
non-linearity in the far forward portion of the characteristic was not
discernable. It is hypothesized that the mechanism described above was
still valid, but that the test time was too short at this low temperature.
The appearance of non-linearity would be expected to occur only after an
appreciable increase in the linear series resistance. Non-linearity was not
observed in B-T testing at 75 C even after 4300 hours, but was observed in
B-T testing at both 150 and 135 C and in pressure cooker testing after 400
hours at 15 psig and 121 C. As the stress temperature is lowered the time
to non-lnearity gets progressively longer. In order to confirm this, 85/85
Qi^I
.?I
66
it

.i
n°w' QF,
67
41
41testing of the Q-cells is being extended.
Even though non-linearity has not yet been observed during the 85/85
testing of encapsulated Q-cells the degradation which occurred and which is
summarized in Table 13 may still be interpreted in terms of the mechanism
assumed to lead to non-linearity. Based on. the hypothesis that the effect
is due to diffusion of hydrogen to the metal/silicon interface, one would
expect an encapsulation which hermetically protected the back surface to
avoid this degradation mode. Certainly a steel substrate would be expected
to give such protection, and did according to the data of Table 13, but
what about the glass and foil substrates, which should also offer back
contact protection, but apparently didn't? Regarding glass as a substrate
material, a closer examination of the data summarized in Table 13 reveals
that only three C/EVA/G coupons were started into test and that two of
these lost both leads after only 250 hours. The remaining cell showed no
degradation until 1000 hours when 19"/, was observed. Thus the value of 232
degradation shown in Table 13 represents data from only one sample coupon
and is still only half the maximum observed for other types of
encapsulations for this cell type. Consequently it is felt that the glass
substrate probably protected the back surface initially, but that edge
diffusion, particularly along the leads, which were sandwiched between two
nonconforming surfaces, eventually occurred.
The discussion with regard to the Y-cell in Section 3.2 presented a
hypothesis as to why the degradation of encapsulated cells with
non-hermetic substrates was greater than for unencapsulated cells and why
foil substrate material would not protect against hydrogen diffusing to the

yl
t1 a
• metal/semiconductor interface. The amount of hydrogen reaching the't
interface will depend on the diffusion coefficient of atonic hydrogen in
the metal and on the equilibrium surface concentration of atomic hydrogen.
If the permeation coefficient of water vapor in the substrate is much
greater than for hydrogen, water vapor will diffuse to the metal surface
and through dissociation produce hydrogen which will be trapped at the
surface. Thus it is possible for the concentration of atomic hydrogen at
the metal surface to be greater when the surface is "protected" by a
polymeric substrate than when unprotected. The measured permeation
coefficient of hydrogen in polyvinyl fluoride is the order of MO
molecules per second per cm per atmosphere (16), whereas for water vapor
the value is 3.SG13 (17). Thus the permeation coefficient of water vapor in
this typical polymer film is 500 times greater than for hydrogen. If atonic
hydrogen is able to diffuse to the silicon-silicon dioxide interface, the
dangling silicon bonds existing there will become saturated, increasing the
surface potential and giving rise to the rectifying Schottky barrier
contact. As can be seen from Table 13, degradation in the Q-cell due to
Schottky barrier formation is greater for non-hernetic substrates than for
unencapsulated cells and is greater for foil substrates than for most of
the non-hermetic encapsulation systems.
4.3 Loss of Grid Adhesion
Another clearly identifiable failure mode, pertaining only to the
X-cell, which was brought out by the unencapsulated tests was loss of grid
adhesion. In an effort to investigate this failure mode further, samples
were examined by electron microscopy. It was found that the surface
L
fil
69
.A6 V., i
gll
topology of the X-cell was different from that of many other cells, as can
be seen from the 150OX photographs of Figure 9. Figure 9A shows the silicon
surface topology after removal of the overlying solder, while Figure 9B
shows the mirror image topology of the removed solder. It can be seen that
the silicon surface consists of nodules on a gently rolling background. The
usually observed structure of silicon after removal of solder, shown in
Figure 9C, is much more jagged and irregular without any sign of nodules.
When energy dispersive x-ray (EDX) analysis was performed the expected tin
and lead from the solder, and nickel from the interface film were found. In
addition an appreciable amount of phosphorus, presumably from the nickel
plating bath, was present. It is not known at this point, however, if
either the surface topology or the presence of phosporus have any relation
to the observed loss of grid adhesion. Discussions were held with the
manufacturer, who felt the problem involved some unknown contaminant.
Additional tests are now being jointly conducted with the manufacturer.
4.4 New Clemson Reliability Research Facility
Clemson University is in the process of establishing a new research
facility which will be devoted to fundamental semiconductor device
reliability studies. Devices to be studied will range from discrete
structures like solar cells to the latest VLSI circuits. The solar cell
reliability program will be a major beneficiary of the facility, whose
centerpiece is to be the latest in state-of-the-art analytical electron
microscopes. This microscope, which is expected to be in operation by the
first of the year, is to be installed in a newly constructed room adjacent
to Clemson's presently existing Central Electron Microscope Laboratory. In
;I

r
ORIGINAL PACE i°'1F POOR Q!JM IV
f 4
a) Silicon Surface with Solder Removed (X-cell)
b) Surface of Removed Solder (X-cell)
Figure 9. 1500X SEM P hotographs of Cell Surfaces
70
1'
JRIGINAL PAGE 32.OF POOR QUALITY
C) Silicon Surface with Solder Removed (not X-cell)
Figure 9. (Continued)
71
addition to normal high resolution, high depth of focus topological display
capability, it will also have the analytical capabilities of a scanning
Auger microprobe (SAM) with ion etching for generating depth profiles, an
energy dispersive x-ray analyzer (EDX), a secondary ion mass spectrometer
(SIN), an electron back scattering analyzer, and all the computerized
instrumentation associated with these components. The microscope is
expected to be of tremendous help in determining the failure mechanisms
responsible for the degradation observed during accelerated testing. In
order to acquaint the photovoltaic community with its capabilities a
workshop is planned in April 1984, which will include hands-on experience
with the instrumentation.
y
i
ti
t
72
I- J-
I
5.0 ADDITIONAL TEST DEVELOPMENT
I 4.'I
I5.0 ADDITIONAL TEST DEVELOPMENT
5.1 Introduction
A major goal of the program is the development of accelerated tests
T
which can differentiate between different cell constructions in their
ability to withstand environmental stress. It has been seen that the 85/85
test is a rather weak test which requires long times before effects are
observed. In an effort to develop a similar test with a greater
accelerating factor experiments are underway involving variations which
include 95 C/85% RN and 85 C/950 RN. The 95/85 test has been started, but
it is still too early to draw specific conclusions. After the second
downtime, encapsulated V-cells, a cell type which had shown good stability
under 85/85 testing, also shows good stability on 95/85 testing. Two
additional reliability test techniques are also in the early stages of
development -- outdoor real time testing and sulfur dioxide testing. Both
of these techniques are being developed in an effort to more closely relate
accelerated laboratory testing to real world conditions.
5.2 Outdoor Real-Time Testing
Whereas the testing procedures described in Sections 2 and 3 are
impressive in their ability to delineate different failure nodes, they
offer little information relative to predicing actual operating life. In
order to correlate field behavior with accelerated laboratory testing it isa
first necessary to establish that the same failure modes are being observed
75
P.RECEDTNC PACE BLANK NOT FILMED
ik
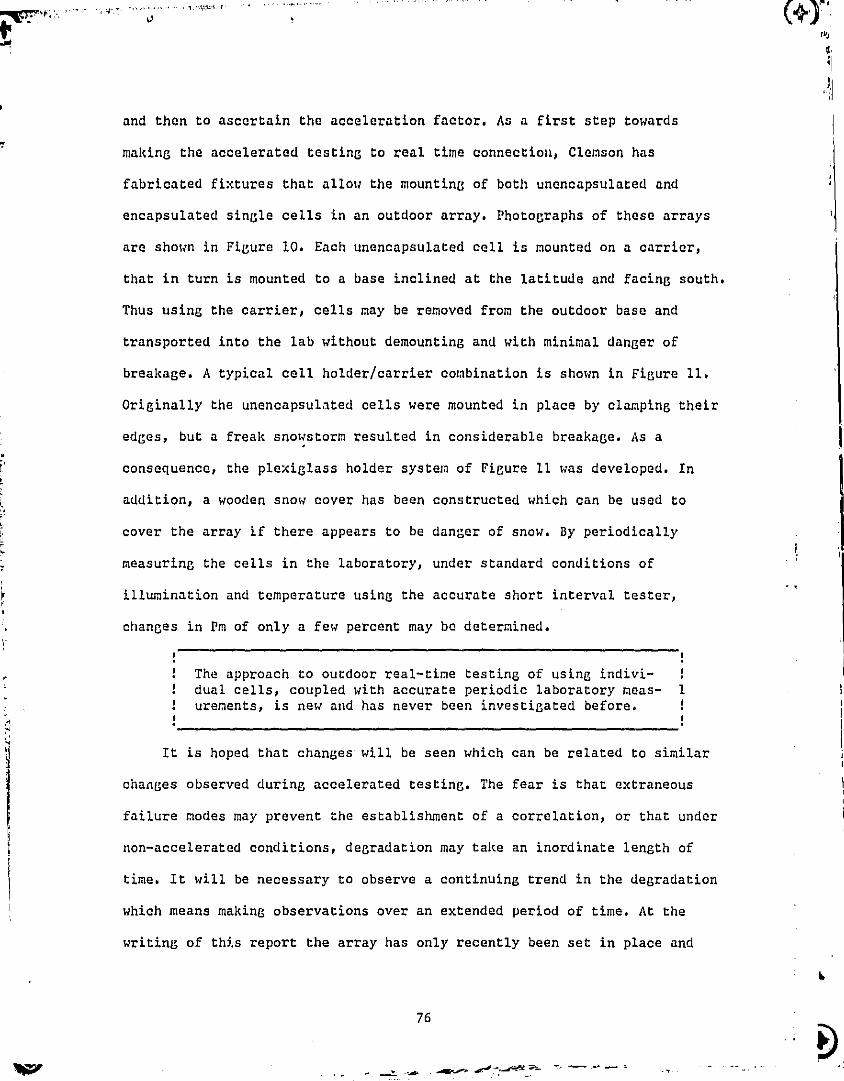
and then to ascertain the acceleration factor. As a first step towards
making the accelerated testing to real time connection, Clemson has
fabricated fixtures that allow the mounting of both unencapsulated and
encapsulated single cells in an outdoor array. Photographs of these arrays
are shown in Figure 10. Each unencapsulated cell is mounted on a carrier,
that in turn is mounted to a base inclined at the latitude and facing south.
Thus using the carrier, cells may be removed from the outdoor base and
transported into the lab without demounting and with minimal danger of
breakage. A typical cell holder/carrier combination is shown in Figure 11.
Originally the unencapsulated cells were mounted in place by clamping their
edges, but a freak snowstorm resulted in considerable breakage. As a
consequence, the plexiglass holder system of Figure 11 was developed. In
addition, a wooden snow cover has been constructed which can be used to
cover the array if there appears to be danger of snow. By periodically
measuring the cells in the laboratory, under standard conditions of
illumination and temperature using the accurate short interval tester,
changes in Pm of only a few percent may be determined.
!
!The approach to outdoor real-tine testing of using indivi-dual cells, coupled with accurate periodic laboratory neas- 1urenents, is new and has never been investigated before.
It is hoped that changes will be seen which can be related to similar
changes observed during accelerated testing. The fear is that extraneous
failure modes may prevent the establishment of a correlation, or that under
non-accelerated conditions, degradation may take an inordinate length of
time. It will be necessary to observe a continuing trend in the degradation
which means making observations over an extended period of time. At the
writing of this report the array has only recently been set in place and
76
A'
IfI
I
r;r.^
b.ip IwrM
C^
iORIGINAL PAGE iSOF POOR QUALITY
i
^.. x '7!'7' '*ai ^^^•^ .^ ^
X^
,r
t`
Figure 10. Photograph of Outdoor Real-Time Test Arrays
77
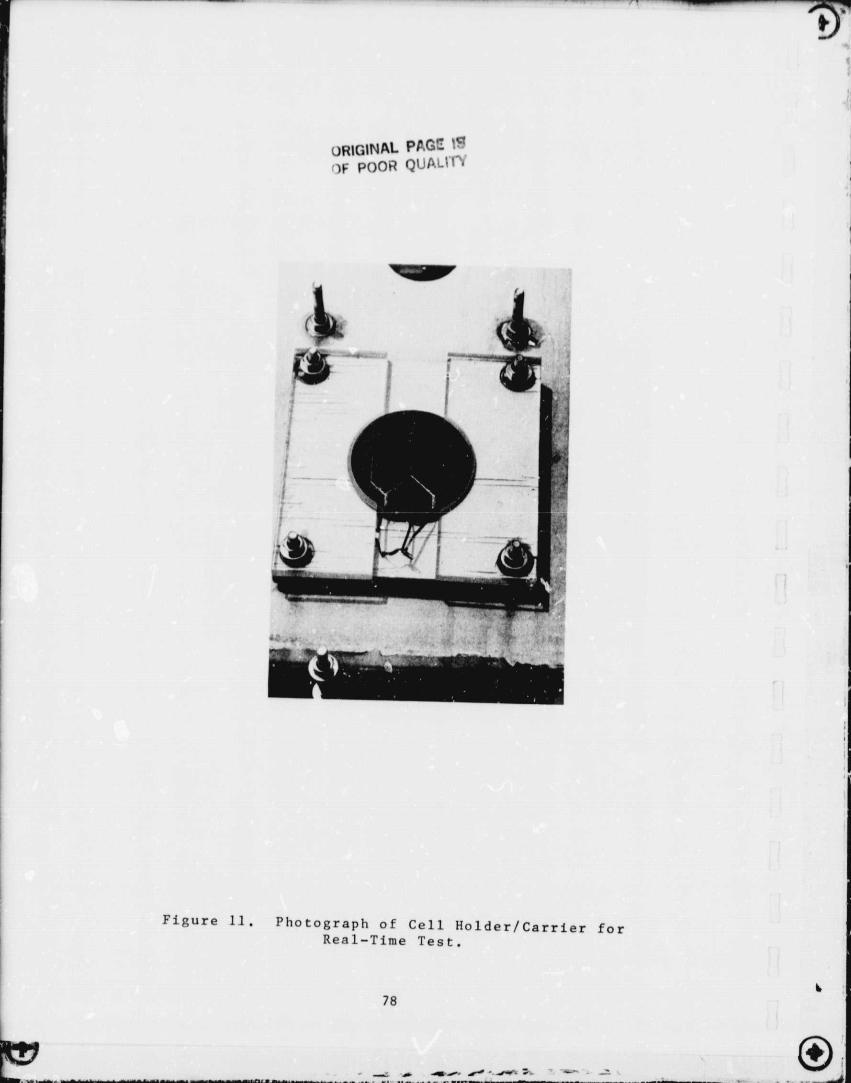
l^P"
ORIGINAL PAGE ISOF po)OR QUALITY
Figure 11. Photograph of Cell Holder/Carrier forReal-Time Test.
78k
(i)
S
'rU '^..
data is not yet available.
Cells are mounted so there is a flow of air across both faces. Cell
temperature should thus be reasonably close to ambient. The exact value
will be checked with thermocouple readings. A portable instrument has been
designed and fabricated to measure the cells under actual solar
illumination. This instrument measures selected points on the IV
characteristic in much the same way as the short interval tester. It is
digital and calculates Pm from the data points taken. A comparison of
measurements taken in the laboratory and under solar illumination should
provide interesting information regarding the presently used GLII lamp
simulation method. The cells are loaded individually with a Schottky
barrier diode which was determined to more nearly match the cell to its
maximum power point than a resistor -- the object being to dissipate the
maximum amount of power in the cell. Later, other modifications can be
made, such as applying high voltages as nay exist in a module between cells
at the begi.ning and end of a series string.
5.2 Sulfur Dioxide Testing
An environmental pollutant which has become of concern recently is
sulfur dioxide. Produced primarily by fossil fuel fired power plants,
sulfur dioxide combines with the moisture in air in a complex, and as yet
not thoroughly understood manner, to produce sulfurous and sulfuric acids
which fall to earth as the well publicized acid rain. It is of interest to
know whether trace pollutants, such as sulfur dioxide, have an influence on
the life of solar cells. Some experimental work on exposing component
79
k
`F
{r. ..... ^ _ .^ .: ,.. .. .. ^ i ^' .w"1 .. 1 ... .. ;. ..._ .. .. ...... ..e ^... ^ • _'I , { v"e I? +^.}v^f "'.Ifl .. I e.
metallization systems to S0, contaminated atmospheres has been reported in
the literature. Feinstein and Sbar (18) identified electrolytic and
galvanic corrosion failure modes and also observed the deposition of
sulfurous and sulfuric salts. To investigate methods for examining the
influence of S0, on solar cell performance, Clemson explored methods of
establishing and maintaining a humid accelerating test atmosphere
containing added amounts of sulfur dioxide up to 500 ppm. It was decided
that the base atmosphere should be 85'C and 85% Rll to allow easy comparison
with previously acquired data. Initially, unencapsulated cells were to be
exposed to this ambient and, if correlatable changes were observed, testing
would proceed to encapsulated cells. A design study of different methods
for producing a steady state 85/85 ambient with trace amounts of S0 2 was
performed and is described in Appendix B. The problem proved to be more
difficult than anticipated and none of the approaches stud!,:. seems
appropriate to solar cell testing. It is possible that a closed container l
test could be designed which used the presence of a measured amount of '3
contaminant. Such a test could be used to differentiate between cell types
in their ability to withstand degradation, but would not be relatable
directly to field conditions..
,A
10n>m
,.
`R
80I
I r
oryl
PRECEDING PAGE BLANK NOT FILMED33
RAW, 4^ INTENTIONALLY %AHK
J^
.,J
W
h'
<1
6.0 CONCLUSIONS
a
Conclusions can be drawn in a number of specific areas as a result of
the work reported in the proceeding sections.
Accelerated Testing Procedures -- The Clemson accelerated test schedule
continues to be able to differentiate between cell types in their ability to
withstand stress. It is clear that present state of the art cells vary
widely in this ability. For routine purposes such as quality control, the
testing of unencapsulated cells is more cost effective and time conserving
than testing encapsulated cells because because of the ease with thich they
may be obtained and because they are able to experience higher temperatures
during testing. A research study of encapsulated cell stress sensitivity,
such as reported in this document, can make significant contributions to
understanding degradation mechanisms, however.
Metallization Systems -- Two previously unreported failure mechanisms
relating to metallization systems were uncovered during the course of
testing. One, which caused continuous degradation of the maximum power
output, is the result of the formation of a rectifying Schottky barrier
contact at the back surface of the cell. It is hypothesized that the
normally ohmic contact becomes rectifying as a result of hydrogen from the
dissociation of water vapor diffusing to the metal-semiconductor interface.
Although the non-linearity associated with the formation of a rectifying
contact was only observed with one type of cell construction, it is possible
that the mechanism accounts for the series resistance related degradation
4r} T
,I 1observed in a number of other cell types. Schottky barrier contact formation
could be one manifestation of a more general mechanism which involving
changes in the metal - semiconductor barrier height. Another newly
discovered failure mode involves the catastrophic loss of contact adhesion.
Although the reason for this loss of adhesion is not known, contamination is
suspected. Electron microscope photographs reveal a different surface
topology for this cell.
Encapsulation Systems -- Encapsulation of any kind protects cells
against mechanical problems, such as loss of grid adhesion, which show up
during unencapsulated testing. On the other hand, degradation of the back
contact, which is most susceptible to moisture related barrier height
changes, will be minimized if a hermetic substrate such as steel or glass is
used. If a non-hermetic substrate, such as Tedlar, is used degradation is
actually increased over that experienced by unencapsulated cells due to its
ability to trap hydrogen at the contact - substrtate interface. Furthermore,
thi.a organic coated aluminum film was found to behave essentially as if it
were a non-hermetic material for this same reason.
84
1
1
-9.
7.0 NEW TECHNOLOGY
IS
Ii
f.
85
Al
V.
7.0 NEW TECHNOLOGY
No items of new technology were uncovered during this reporting period.
f
sY
1
'RECP:DiN(7= PACE BEAtdi{ NOT FILMED
87 I16LM1W4U BLANK
J^
r4X.
8.0 PROGRAM RESEARCH CONTRIBUTIONS
PRECEDING PAGE BLANK NOT FILMED
89
W^L-WEUTIDNALLY BLANK
...........
aI 8.0 PROGRAM RESEARCH CONTRIBUTIONS
r
TY.i J
` _ +L
Yr
9'.
Since the previous Annual Report was issued the project has made a
number of documented contributions to the photovoltaic community. These are
summarized in this section with abstract material reproduced in Appendix C.
Publications and Presentations:
J
1. Davis, C.W. and Lathrop, J.W., "Electrical Degradation of SolarCells due to Formation of a Schottky Barrier Contact," Proc. IEEERegion 3 Conference (SOUTHEASTCON), Destin, FL, April 1982.
2. Lathrop, J.W., Hawkins, D.C., Prince, J.L., and Walker, H.A.,"Accelerated Stress Testing of Terrestrial Solar Cells," IEEETransactions on Reliability, Vol. R-31, No.3, p.258, August 1982.
3. Lathrop, J.W., Davis, C.{J., and Royal, E., "An Accelerated StressTesting Program for Determining the Reliability Sensitivity ofSilicon Solar Cells to Encapsulation and Metallization Systems,"Proc. 16th IEEE Photovoltaic Specialists Conf., San Diego, CA,October 1982.
4. Lathrop, J.W. and Hawkins, D.C., "Degradation of Silicon SolarCells," Flat-Plate Solar Array Project Research Forum on QuantifyingDegradation, Williamsburg, VA, December 1982.
5. Lathrop, J.W., "Accelerated Degradation of Silicon MetallizationSystems," Flat-Plate Solar Array Project Research Forum onPhotovoltaic Metallization Systems, Callaway Gardens, Fine Mountain,GA, March 1983.
6. White, F.B. and Lathrop, J.W., "Accelerated Reliability Testingof Encapsulated Solar Cells," Proc. IEEE Region 3 Conference(SOUTHEASTCON), p.453, Orlando, FL, April 1983.
Theses:
1. Davis, C.W., "Electrical Degradation of Nickel/Gold and NickelMetallized Solar Cells Induced by Accelerated Stress," MSElectrical Engineering Thesis, Clemson University, December 1982.
?RECEDING PACE BLANK NOT FILMED
yl MG£ ZV 1ATE-M-IONAI.IY BLANK
3y
^l
2. White, P.B., "Design of an Accelerated Environmental Test forSolar Cells under Conditions of 85 C, 85% RH, and SO ," MS
Electrical Engineering Thesis, Clemson University, December 1983.
Data Exchange:
Computer printouts of electrical measurement data on cells under
test was senL co each manufacturer who contributed cells to the
program. The manufacturers received information on only their cells,
along with interpretive comments, after each down time. The most
useful of the printouts was the maximum power output summary listing
the performance of each cell in each test. An example of this form
is included in Appendix C.
Other:
1. NASA Tech Brief -- The short interval solar cell tester was
described in the Spring 1983 edition of NASA Tech Briefs. A copy of
the brief is included in Appendix C.
2. Soleras Short Course -- Clara W. Davis, Graduate Student working
on the program, was one of 12 US students selected to participate in
ti., 1983 two week summer short course sponsored by the Soleras
Program. The US students, together with an equal number of Saudi
Arabian students, toured solar installations in the Denver, San
Francisco, and Los Angeles areas.
s
92
93
vn, x... K^" ^ v
9.0 REFERENCES
^ (r
J
9.0 REFERENCES
1. Investigation of Reliability Attributes and Accelerated Stress Facto':son Terrestrial Solar Cells, DOE/JPL-954929, 1st Annual Report, May 1979.
2. op. cit., 2nd Annual Report, April 1980.
3. op. cit., 3rd Annual Report, January 1981.
c4. op. cit., 1981 Summary Report, June 1.982.
5. Saylor, C.R., Lathrop, J.W., and Christ, J.F., "Short Interval Testingof Solar Cells," Proc. 15th IEEE Photovoltaic Specialists Con£rence,p.534, Orlando, FL, May 1981.
6. Harrington, W.L. et al, "Low-energy Ion Scattering Spectrometry (Iss)of the S102/Si Interface," Applied Physics Letters, vol. 27, p.644
(1975)
7. Shannon, J.M., "Control of Schottky Barrier. Height Using Highly Dopedf' Surface Layers," Solid State Electronics; vol. 19, p.537 (1976)
A 8. Zholobov, S.P., and Malev, M.D., "Diffusion of Oxygen in Metal DuringElectron Bombardment of a Surface," Zh. Tekh. Fiz., vol. 41, p.627
(1971)
9. Eurinyer, G., "Uber den Zeitlichen Verlaut der Gasabgabe ErhitzterDrahte im Vakuum," Z. Physik, vol. 96, p. 37 (1935)
10. Scherrer, S., Lozes, G., and Deviot, B., "Quenching of Nickel inHydrogen Atmospheres," C.R. Acad. Sci. B, vol. 38, p. 1436 (1967)
11. Fischer, W., "Kinetics of Hydrogen Permeation through Nickel,"Z. Naturfoschg. A, vol. 22, p. 1581 (1967)
12. Cochran, C.N., "The Permeability of Aluminum to Hydrogen," J.Electrochem.
Soc., vol. 108, p.317 (1961)
13. Zhukhovitskii, A.A., Gellman, B.G., and Andreev, L.A., "HydrogenAbsorption by Solid Aluminum in Water Vapor," Doklady Akademii NaukSSSR, vol. 202, p. 1363 (1972)
14. Belyakov, Y.I., Zvezdin, Y.I., and Kurdyumov, A.A., "Penetration ofHydrogen Through Metals which are Oxidized in Steam," Zhurnal PrikladnoiKhimii, vol. 48, p. 981 (1975)
15. Belyakov, Y.I., et al, "Penetration of Hydrogen Through Metals Oxidizedin Water Vapor," Zhurnal Prikladnoi Khimii, vol. 49, p.2195 (1976)
PREGrDING PAGE BLANK NOT FILMRD
95 Wq. I1 aIVIONMUY 9LON
1 T./
^yn
16. 2iegel, K.A., Frensdorff, H.K., and Blair, A.E., "Measurement ofHydrogen
Isotope Transport in Poly-(Vinyl Fluoride) Films by the Permeation-RateMethod," Journal of Polymer Science: Part A-2, vol. 7, p.809 (1969)
17. Kellerher, P.G. and Boyle, D.J., "Gaging Moisture Vopor Permeability ofPlastic Molding Compounds," Modern Plastics, Nov. 1979.
18. Feinstein, L.G. and Sbar, N.L., "Performance of New Copper-BasedMetallization Systems in an 85 C, 78% RH, SO Contaminated Environment,"IEEE Trans. Comp., Hybrids, and Mfg. Tech., vol. CHMT-2, p.159, (1979)
96
I
1p
APPENDS\ A
METHOD OF DETERMINING METAL-SEMICONDUCTOR BARRIER I{BIGHT
f
C-.2

t^
^J>
km
y.'I^ ^.. ' ,.•^I „.a.^.^'i\L.^
,
,
The saturation current, Is, of a Schottky barrier diode is given by Sze
(Ref. 1):
IS = SAT" exp q( Pn )1a
where S = metal contact area
A = effective Richardson constant
PBn = barrier height
k = Boltzmann's constant
T = absolute temperature
q = electron charge.
Thus the barrier height may be calculated from the saturation current using
Equation (1). More accurately, it may be determined from the slope of a plot
of ln(Is) vs 1/T.
It of interest to be able to determine the barrier height of a degraded
solar cell having a Schottky barrier back contact. The approximate equivalent
circuit of such a cell is shown in Figure B1. In this case the Schottky
barrier is not directly accessible and it is necessary to deduce the
saturation current from the solar cell characteristic. A typical VI
characteristic of a degraded cell has 5 distinct regions, as shown in Figure
B2. In Region I D2, the contact Schottky barrier diode, is fully forward
biased while D1, the cell junction diode, is forward biased, but conducting
very little (below cutin). The major factor affecting the slope in Region 1 is
the shunt resistance. Since this part of the curve is usually nearly
horizontal this resistance is large and its effect may be neglected. The
(1)
tAl
t^, i
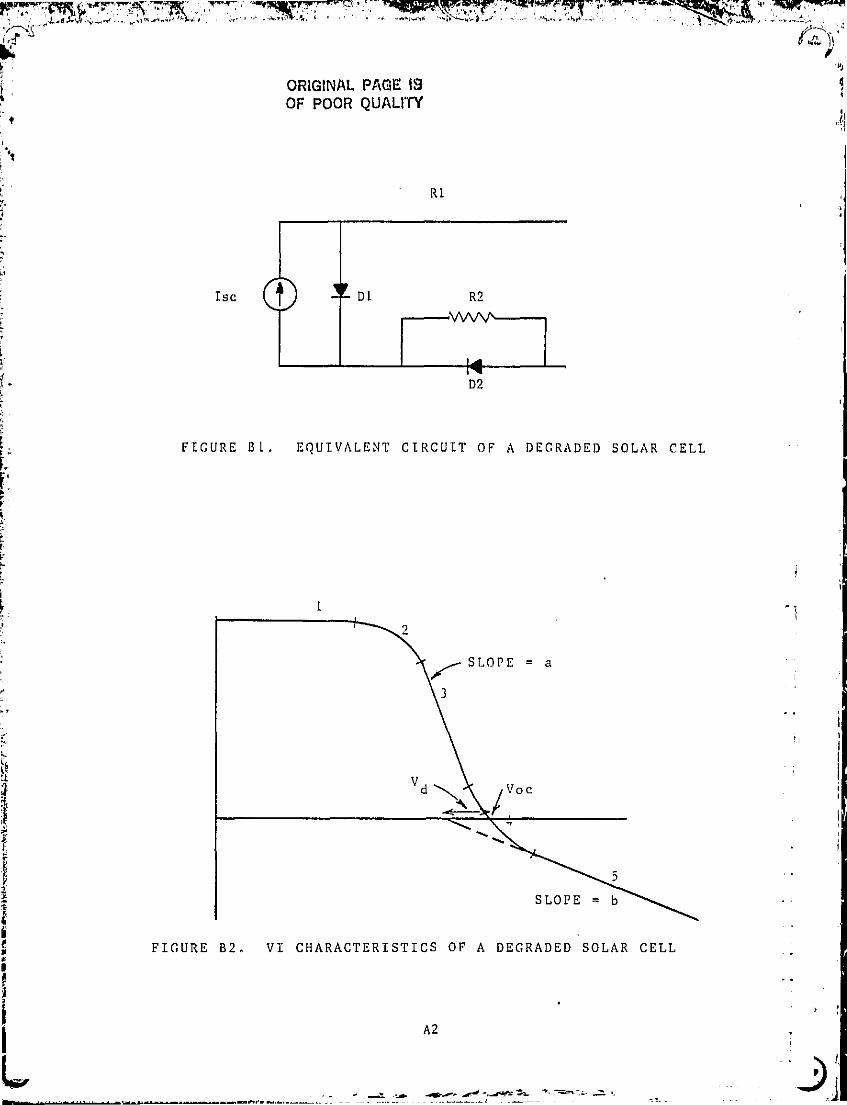
u^
i.i
ORIGINAL PAGE 19OF POOR QUALITY
Isc
1
R1
D2
FIGURE BL. EQUIVALENT CIRCUIT OF A DEGRADED SOLAR CELL
FIGURE B2. VI CHARACTERISTICS OF A DEGRADED SOLAR CELL
A2
1 !
r
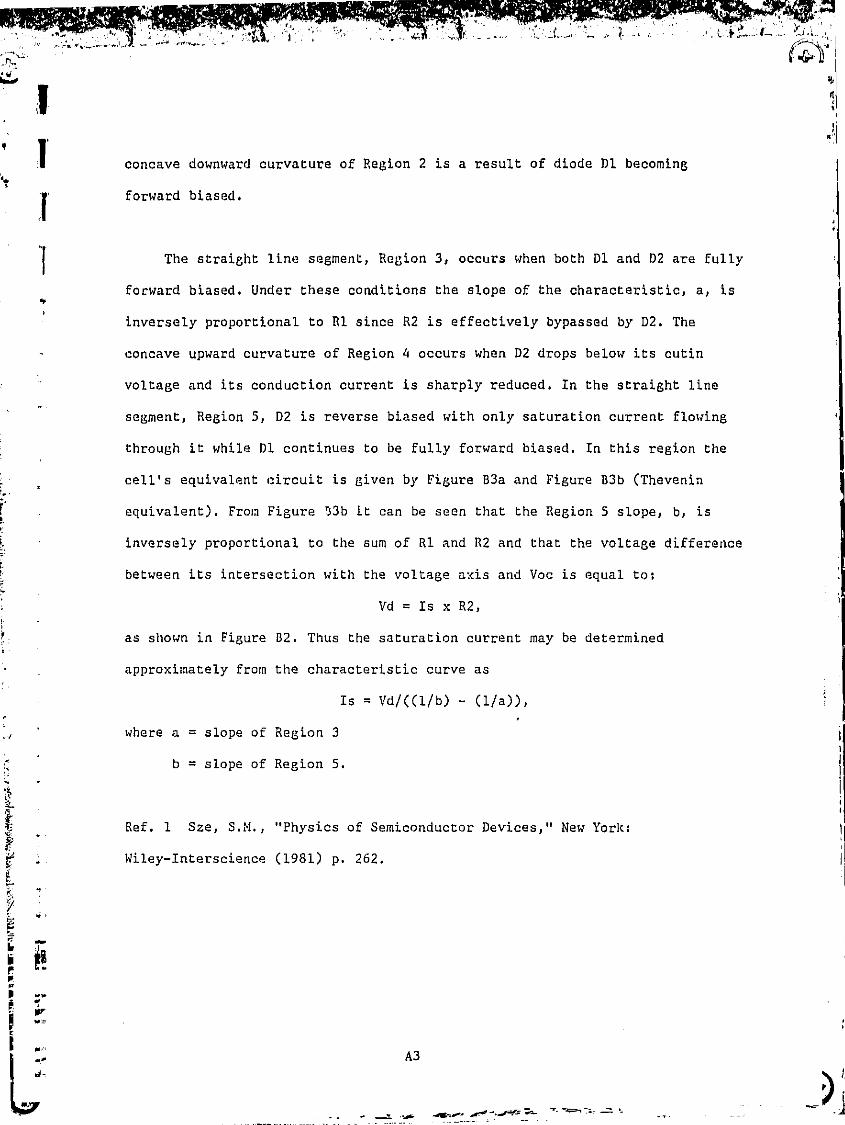
(f^
Y Y
N,
A
,I
pI)
A3
Lz-
concave downward curvature of Region 2 is a result of diode D1 becoming
forward biased.
The straight line segment, Region 3, occurs when both D1 and D2 are fully
forward biased. Under these conditions the slope of the characteristic, a, is
inversely proportional to R1 since R2 is effectively bypassed by D2. The
concave upward curvature of Region 4 occurs when D2 drops below its cutin
voltage and its conduction current is sharply reduced. In the straight line
segment, Region 5, D2 is reverse biased with only saturation current flowing
through it while D1 continues to be fully forward biased. In this region the
cell's equivalent circuit is given by Figure B3a and Figure B3b (Thevenin
equivalent). From Figure 733b it can be seen that the Region 5 slope, b, is
inversely proportional to the sum of R1 and R2 and that the voltage difference
between its intersection with the voltage axis and Voc is equal to:
Vd = Is x R2,
as shown in Figure B2. Thus the saturation current may be determined
approximately from the characteristic curve as
Is = Vd/((l/ b) - (1/a)),
where a = slope of Region 3
b = slope of Region 5.
Ref. 1 Sze, S.M., "Physics of Semiconductor Devices," New York:
Wiley-Interscience (1981) p. 262.
,J-
S^
\ ♦
J
w
C:
r
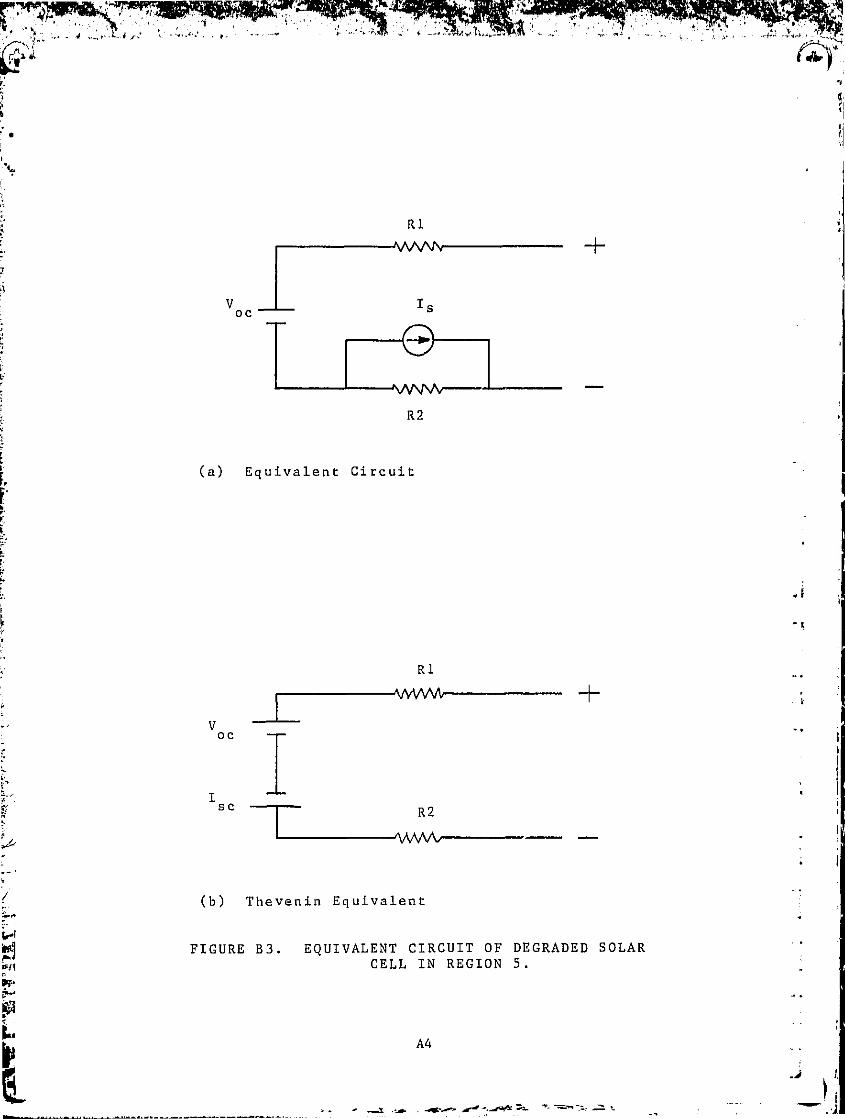
Z
r
.6
'S
1
-^ J
i.
e0
R1
V oc e_Is
VWNNR2
(a) Equivalent Circuit
R1
Voc
Isc
R2
(b) Thevenin Equivalent
FIGURE B3. EQUIVALENT CIRCUIT OF DEGRADED SOLARCELL IN REGION 5.
A4
r;76(^
40L.
yi emsr...... _ :^... ,.. ,I
i
APPENDIX 8
DESIGN CONSIDERATIONS FOR A CONSTANT FLOWS02 ACCELERATED TEST SYSTEM
i3
e.
3pw.
r^-
6
V
' f 1 i.. -. a ..... a .T "
r,.-. _ T.. - "T"'77-., . e-7 G. ^ ^
n 7'' ti^ dab
rAppendix B.
Design Considerations for a Constant Flow S02 Accelerated Test System
Five methods were considered as ways of producing an 85/85 atmosphere
contaminated with SO? for stressing cells. These methods, shown in Figures
B1 through B5, were considered in regard to effectiveness, ease of control,
2 and concentration range. (Refer to Figure B6 for the list of symbols.) The
first design (Figure B1) incorporated a premixed 500 ppm S02 source. Since
this design did not dilute the premixed source with air, environmental
control was simple. However, in order to obtain 85% RH the SO? would have to
bubble through water. This was not practical since the water would absorb
the S02.
The second design (Figure B2) also used a premixed source, but one
which had a concentration of 1000 ppm, the highest concentration readily
commercially available. This allowed the source gas to be diluted with
humidified air at the test temperature, thus avoiding the problem of S0.^
adsorption in the humidifier. Concentration control was obtained through the
use of flow meters making control simple and accurate. Unfortunately the
• maximum concentration possible with this system was 150 ppm, but it should
be considered a candidate if lesser concentrations are desired.
The third design (Figure B3) was an attempt to avoid this concentration
limitation by reducing the flow of the diluting air stream and at the same
time raising its humidity. Control now depended on the temperature of
/
B1
d-.
V
B2
saturation and in maintaing the saturated gas flow at this temperature to
the point of mixing. The advantage of flow meter contol of concentration was
lost, however, and this approach was not considered practical.
The fourth design (Figure B4) used a pure SO, source, which was liquid
at room temperature and 34 psig. If conventional flow meters were used for
control, the amount of SOp was too large resulting in a minimum chamber
concentration on 2000 ppm. This approach should be considered if a
controllable flow meter and valve combination can be found which will
regulate to 1 mlpm.
The fifth design configuration (Figure B5) also used a pure S0 9 source,
but a capillary tube was introduced in the SO 2. line to reduce the flow rate.
Unfortunately flow through a capillary cannot be monitored as through a flow
meter, but when used in connection with a micro metering valve it can be
calibrated. This approach was deemed the most feasible of the five constant
flow methods for conducting initial investigations and experimental
construction was initiated. Results were inconclusive, however, because no
satisfactory method of monitoring the S0 2 concentration could be found to
insure that the cells were actually being subjected to the desired ambient.
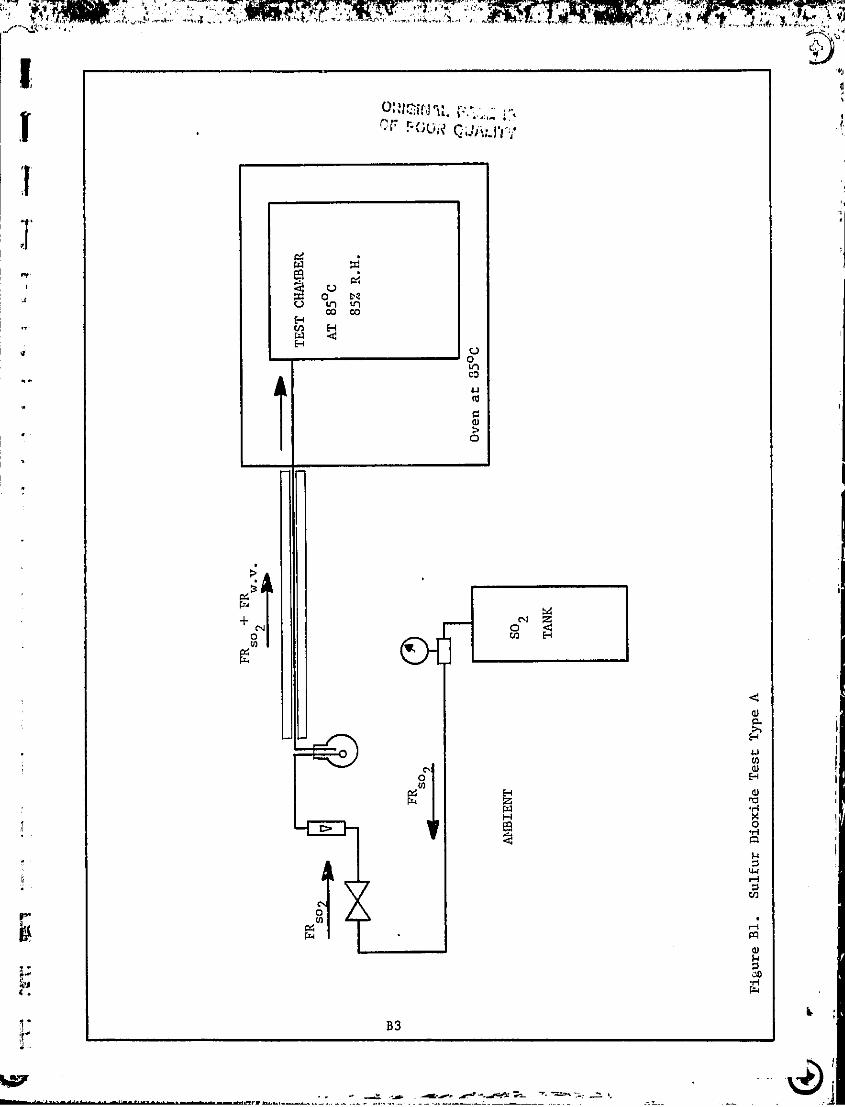
l^J^
ViiJ.^.'•p^{{^^rl i. V'^^:^.a.
w x
oU Ln Ln
co co
N Hca CN U
O
co
uro
CvyO
+ N O CO V] N
F
Cm
HtJN
N
WN
0.p
H Nb
WH
b0Ofa
7WH7N
INON
W fA
NH7oD
u
B3
3
in
I
i
Ra"
M
ji
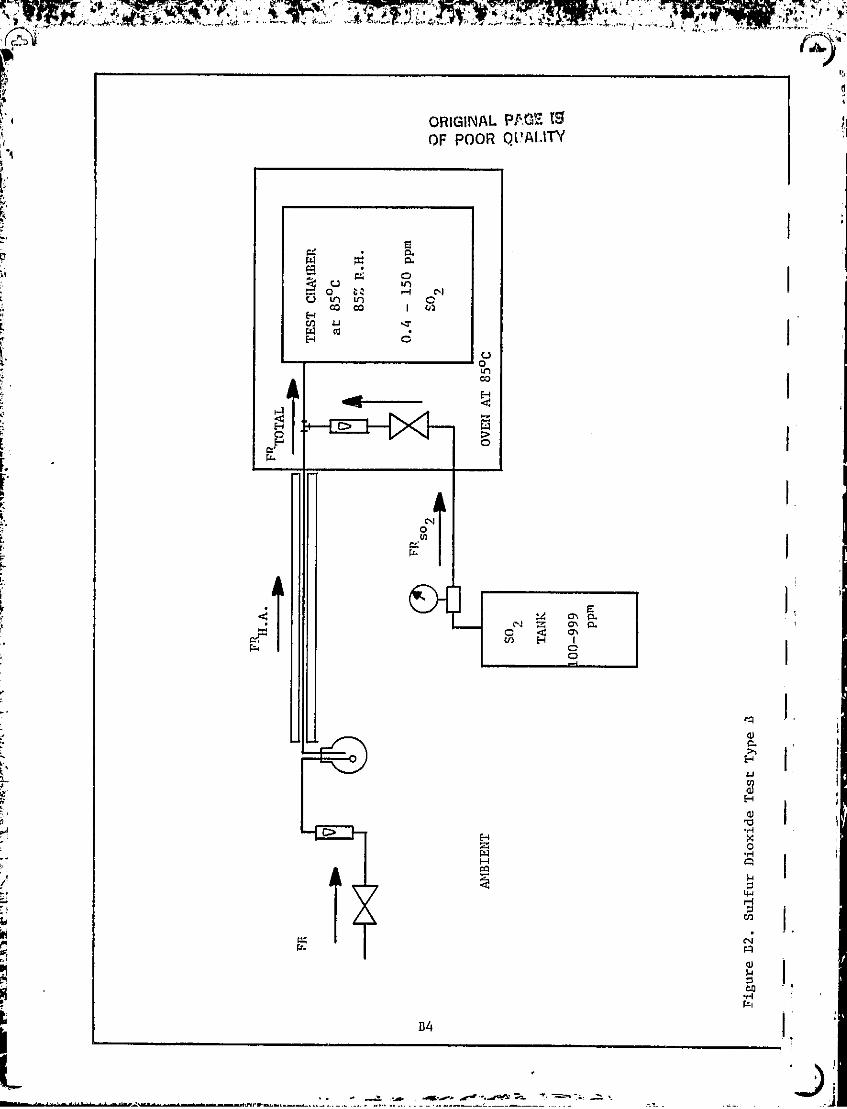
tit VAIL., T 77 Tfvw-V7,,- T
ORIGINAL PPME 19OF POOR QUALITY
B4
14
C4W
a4
:3 1to - !
Ri
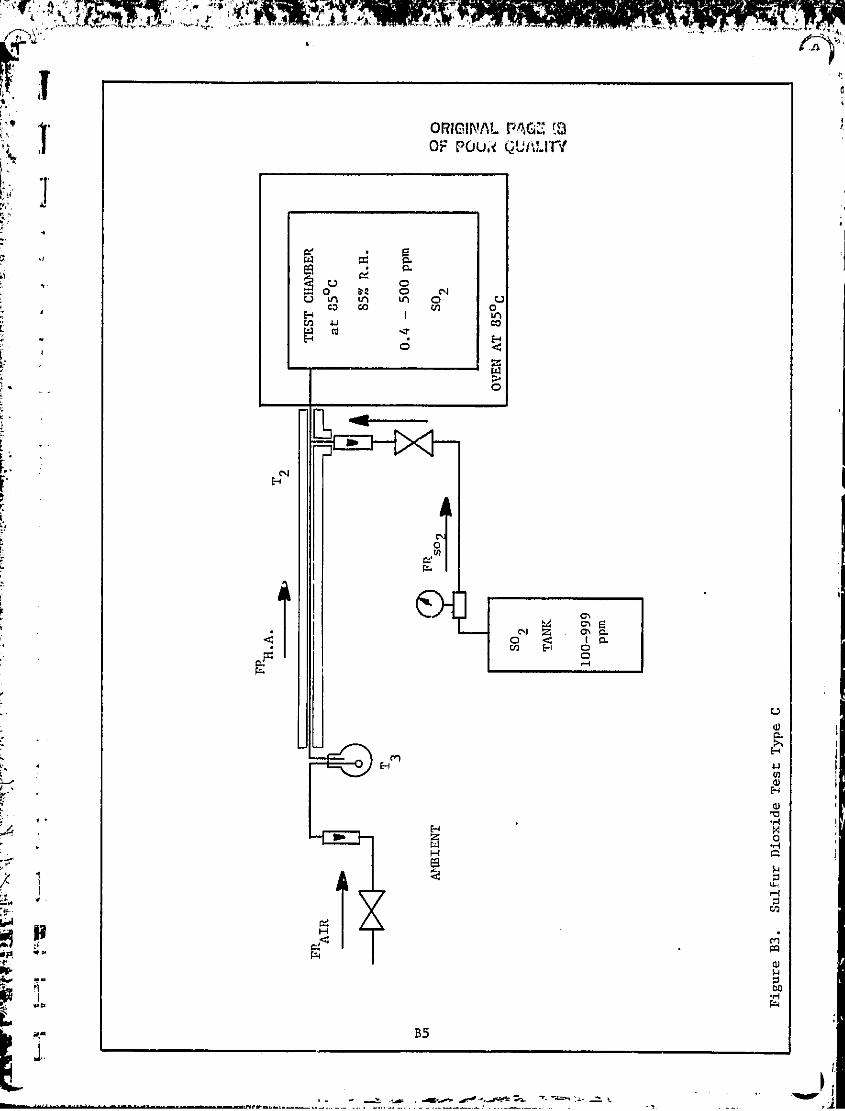
n
^e .1 'lrf'
i^
•' i1
T J
G ,
e
E
t'
aa
1
ti-
t.
6511, ^r
^o
L^A
ORIGINAL RAG QOF POW QUALiV
w x aU^ C
U OLn Ln to O , UCJ co
H IV7 O
puG (U .7
H C d
O
EI
0ce
R.
aCL c\ E
UOGTH
H^ uNG1Hv
t
H L;
OLL.:
I"I
.7.
G9
UlH00
B5
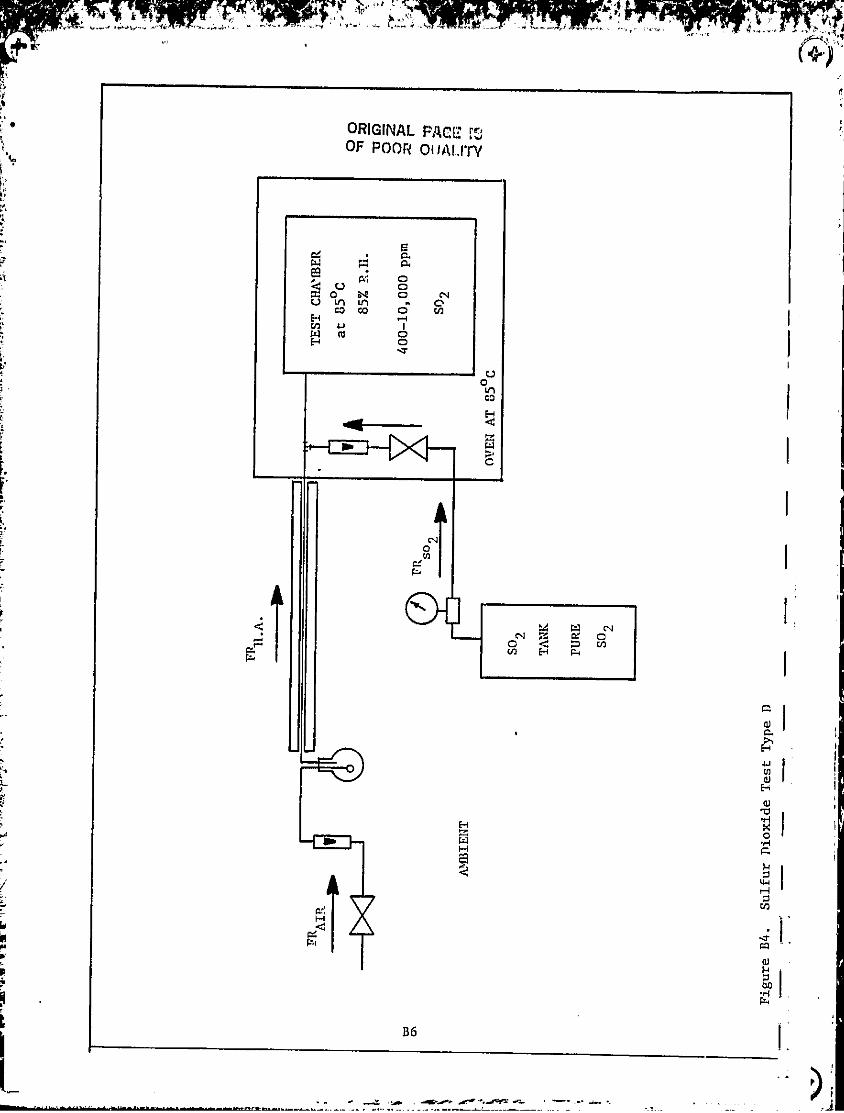
aCl IC.
U)-a) IEl
0
14
cu$4:3
ORIGINAL PACs, r,,OF POOR OWALITY
I
B6 I.
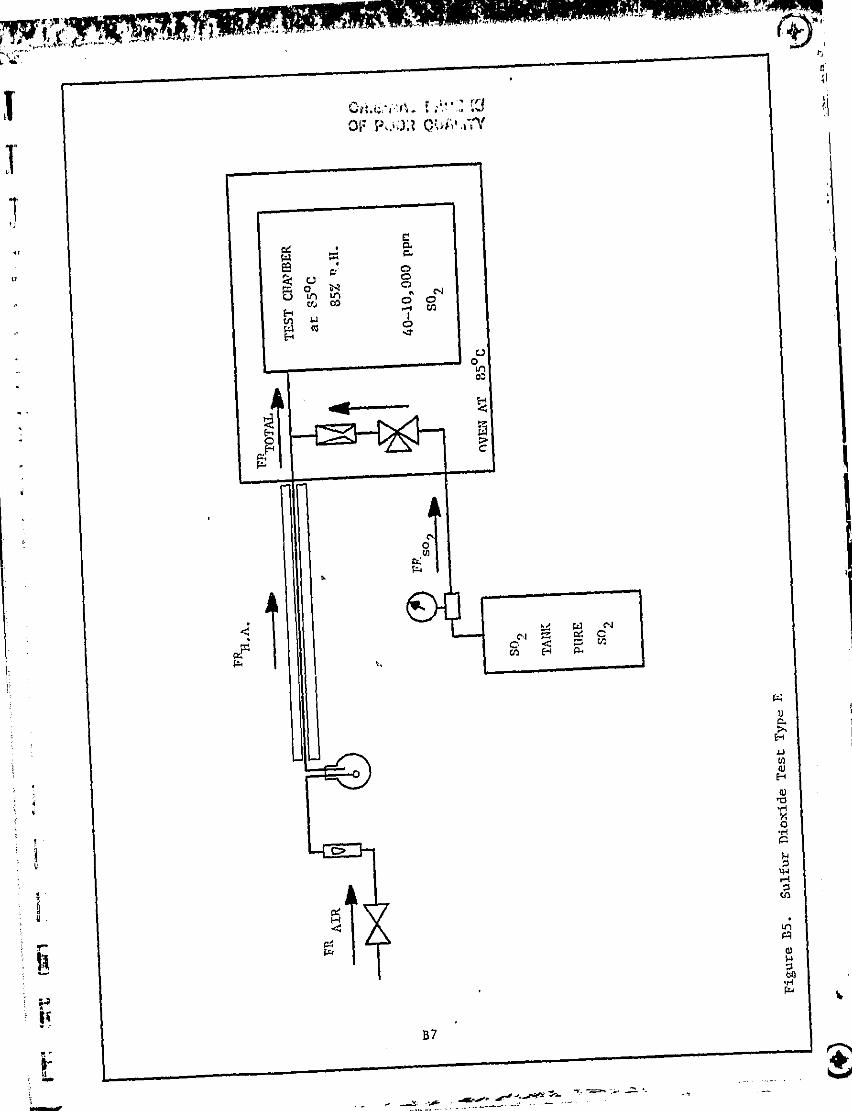
ov po"m
B7
r4
O
rl
Ga
of
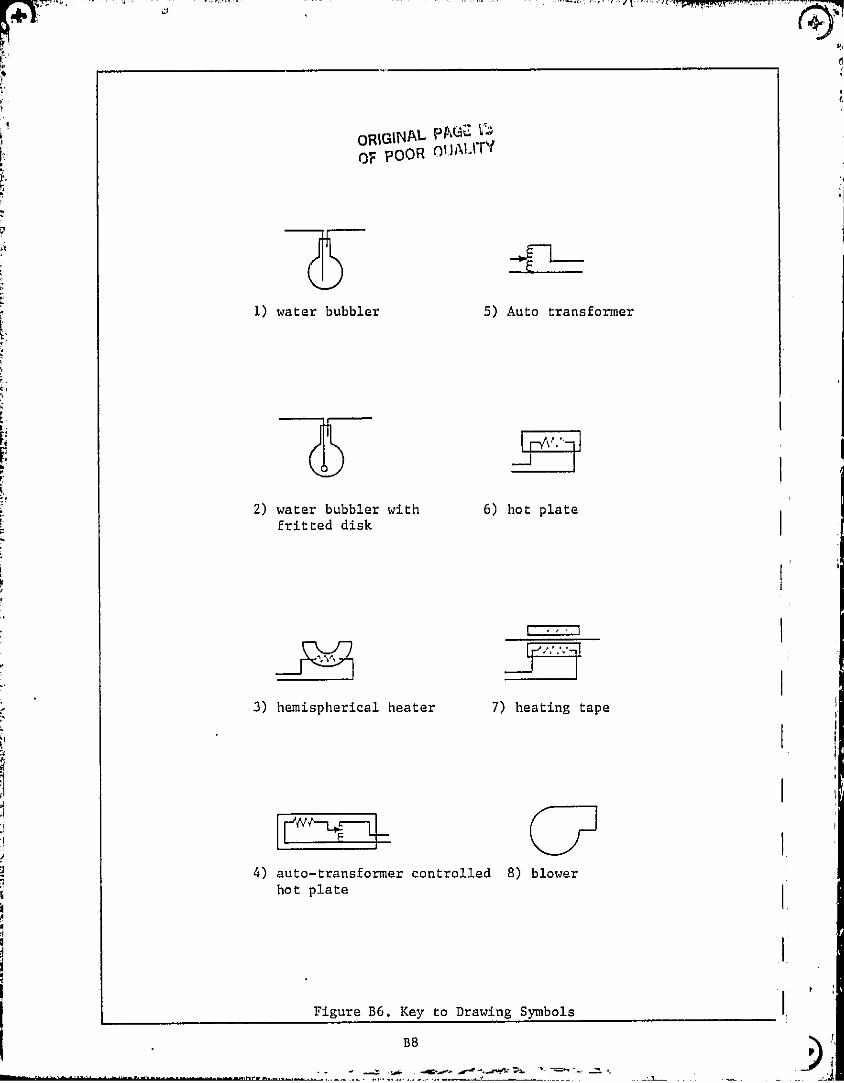
sVI I
ORIGINAL n^ 17OF pOOR
1) water bubbler 5) Auto transformer
r_ J2) water bubbler with 6) hot plate
fritted disk
D
3) hemispherical heater 7) heating tape
rJ C4) auto-transformer controlled 8) blower
hot plate
Figure B6, Key to Drawing Symbols 1. ,
^J i
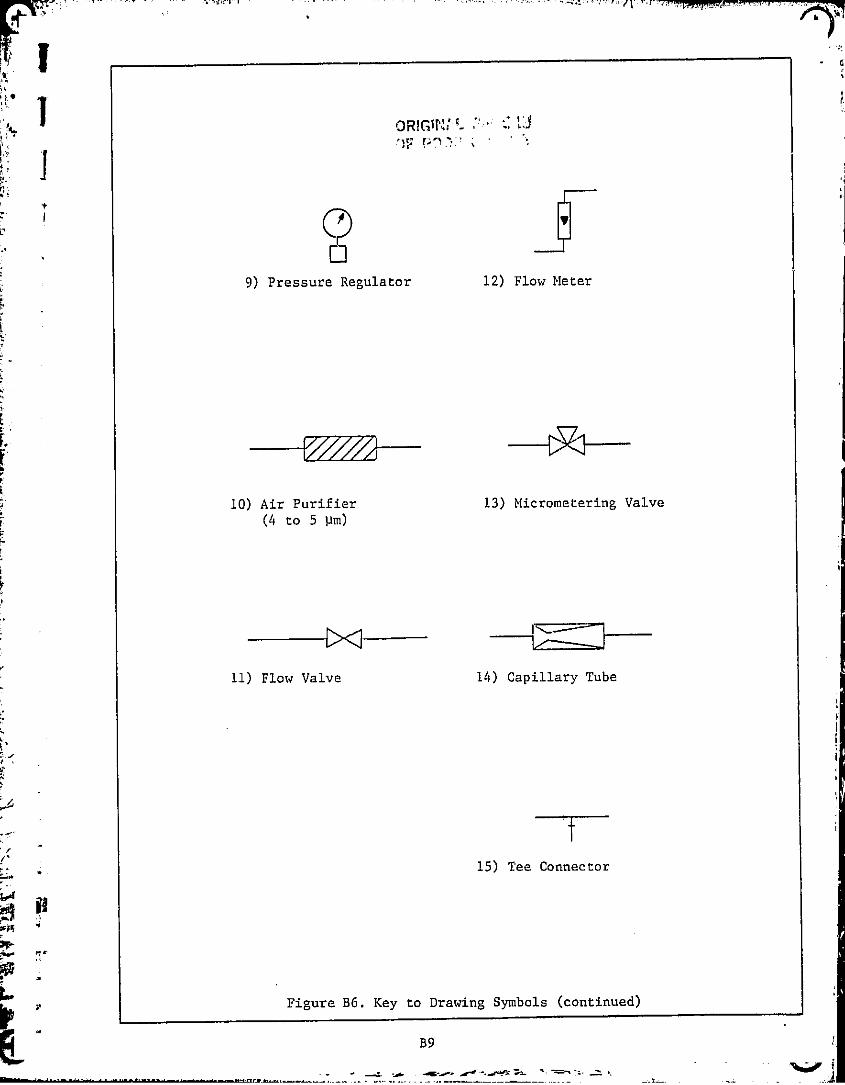
t
i.
to.ORIGIN,"_
r'r
F
29) Pressure Regulator
—F12) Flow Meter
10) Air Purifier
13) Micrometering Valve
0 to 5 Jim)
11) Flow Valve
14) Capillary Tube
r.z
M ,
Figure B6. Key to Drawing Symbols (continued)
B9

APPENDIX C
PUBLICATION ABSTRACTS
I
:'y 1 Proc. IEEE Region 3 Conference, p.411 (1982)i
y.M
Electrical Degradation of Solar Cells due to Formation ofw a Schottky Barrier Contact
C.W. Davis
aJ.W. Lathrop
Department of Electrical and Computer EngineeringClemson University, Clemson, SC 29631
ABSTRACT
A decrease in the maximum power output of silicon solar cells subjectedto bias-temperature stress testing has been observed. An explanation for thisdegradation is offered which involves the formation of a potential barrier atthe metal-silicon interface of the back contact. The samples used werefour-inch diameter silicon solar cells with Au/Ni/Solder contacts. Thesesamples were heated in air to temperatures of 165 C for as long as 9000 hours.Changes in the electrical properties with respect to time and temperature wererecorded. Increases in series resistance and nonlinearity of the far-forwardcharacteristic of the cells indicated the presence of a potential barrier. Acomputer model was developed which included a diode in series with the solarcell. Decreasing the reverse saturation current of the series diode resultedin a more nonlinear far-forward response of the system.
a^ d
n
- Cl
V'
AQ
0
Yb
IEEE Trans, on Reliability, Vol. R-31, p.258 (1982)
iY
' Accelerated Stress Testing of Terrestrial Solar Cells
J.W. Lathrop, D.C. Hawkins, J.L. Prince, and H.A. Walker
Department of Electrical and Computer EngineeringClemson University, Clemson, SC 29631
ABSTRACT
The development of an accelerated test schedule for terrestrial solarr1
cells is described. This schedule, based on anticipated failure modes deduced {{{from a consideration of IC failure mechanisms, involves bias-temperature
• testing, humidity testing (inclding both 85/85 and pressure cooker stress),Fand thermal-cycle thermal-shock testing. Results are described for 12
different unencapsulated cell types. Both gradual electrical degradation andsudden mechanical change were observed. These effects can be used todiscriminate between cell types and technologies relative to their reliabilityattributes. Consideration is given to identifying laboratory failure modeswhich might lead to severe degradation in the field through second quadrant 7operation. Test results indicate that the ability of most cell types to {withstand accelerated stress testing depends more on the manufacturer's
Y design, processing, and workmanship than on the particular metallizationsystem. Preliminary tests comparing accelerated test results on encapsulatedand unencapsulated cells are described.
_r
C2 ^^ `
HJ
II
Proc. 16th Photovoltaic Specialists Conference, p. 1262 (1982)
1
An Accelerated Stress Testing Program for Determiningthe Reliability Sensitivity of Silicon Solar Cells
to Encapsulation and Metallization Systems
J.W. Lathrop, C. W. DavisDepartment of Electrical and Computer Engineering
Clemson University, Clemson, SC 29631
and
E. RoyalJet Propulsion Laboratory
Pasadena, CA 91109
ABSTRACT
The use of accelerated testing methods in a program to determine thereliability attributes of terrestrial silicon solar cells is discussed.Different failure modes are to be expected when cells with and withoutencapsulation are subjected to accelerated testing and seperate test schedulesfor each are described. Unencapsulated test cells having slight variations inmetallization are use to illustrate how accelerated testing can highlightdifferent diffusion related failure mechanisms. The usefulness of acceleratedtesting when applied to encapsulated cells is illustrated by results showingthat moisture related degradation may be many times worse with some forms ofencapsulation than with no encapsulation at all.
nH:.e
i' C3
Flat-Plate Solar Array Project Research Forum on Quantifying DegradationWilliamsburg, VA December 1982
Degradation of Silicon Solar Cells
J. W. Lathrop and D.C. Hawkins
Department of Electrical and Computer EngineeringClemson University, Clemson, SC 29631
ABSTRACT
Results of the Clesmon accelerated test program are reviewed. Examples ofthe way in which accelerated testing can be used to differentiate betweendifferent cell constructions are given for both encapsulated andunencapsulated cells. A modest real time test program which has been begun inan attempt to correlate field degradation with accelerated test degradation isdescribed. In this program individual cells, both encapsulated andunencapsulated, are stressed outside, but periodically demounted andaccurately measured in the laboratory. Development of non-linear VIcharacteristics in some cells during accelerated testing is discussed. Testingis described in which degradation occurs more rapidly when cells areencapsulated than when they are unencapsulated.
. SII
V
6N1
q
k ^^C4
I
Plat-Plate Solar Array Project Research Forum on Metallization SystemsCalaway Gardens, Pine Mountain GA, March 1982
Accelerated Degradation of Silicon Metallization Systems
J. W. Lathrop
Department of Electrical and Computer EngineeringClemson University, Clemson, SC 29631
ABSTRACT
The different metallization systems that have been investigated in theClemson accelerated test program are reviewed. It is shown that allmetallizations fall in one of four classifications: vacuum depositied silver,electroplated copper, screen printed silver frit, or solder coated nickel. Thenumber and function the layers in each system is described. A particular cellconstruction which exhibited non-linear behavior after accelerated testing isexamined in detail. Metal to semiconductor contact theory is reviewed and itis concluded that this non-linear behavior is a result of a change in thenumber of interface states. These interface states are the result of danglingsilicon bonds -- electrons which are not shared between silicon atoms at thesurface and oxygen atoms in the silicon oxide surface film. A decrease in thenumber of states, as might occur through the diffusion of atoms capable ofsharing electrons to the interface, will cause an increase in the potentialbarrier at the interface and give rise to a poorly rectifying contact -- aSchottky barrier contact. The formation of this contact appears to be more afunction of the semiconductor doping than of the particular metallizationsystem used.
P
C5
aa
Qi
'
r
^.I
Proc. IEEE Region 3 Conference (SOUTHEASTCON) p.453 (1983)
Accelerated Reliability Testing of Encapsulated Solar Cells
F.B. White and J.W. Lathrop
Department of Electrical and Computer EngineeringClemson University, Clemson, SC 29631
ABSTRACT •
Various types of encapsulated systems with electrically biased solarcells were subjected to an environment of 85 C and 85% relative humidity. Theencapsulation systems have been categorized into three groups: bare cells,hermetic substrates, and non-hermetic substrates. The non-hermetic substratesdegraded the worst while the hermetic substrates degraded the least.
C6
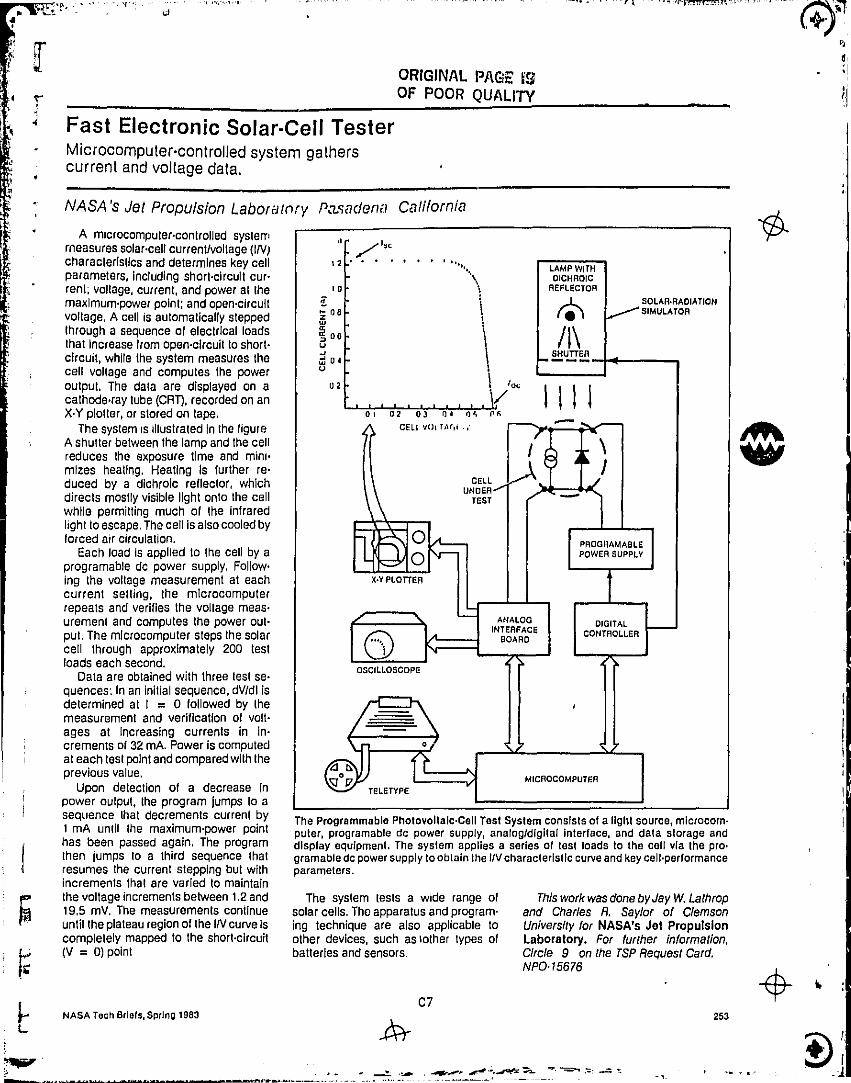
p
The Programmable Photovoltalc•Cell Test System consists of a light source, microcom.puler, programable do power supply, analog/digital Interface, and data storage anddisplay equipment. The system applies a series of lest loads to the cell via the pro•gramable do power supply to obtain the I/V characteristic curve and key cell-performanceparameters.
ORIGINAL PAG- t'SOF POOR QUALITY
Fast Electronic Solar-Cell TesterMicrocomputer-controlled system gatherscurrent and voltage data.
Tr-
NASA's Jet Propulsion Laboratory Pasadena California
f`
A microcomputer-controlled systemmeasures solar-cell current/voltage (IN)characteristics and determines key cellparameters, including short•circult cur•renl; voltage, current, and power at themaximum-power point; and open•circultvoltage, A cell is automatically steppedthrough a sequence of electrical loadsthat Increase Irom open-circuit to short•circuit, while the system measures thecell voltage and computes the poweroutput. The data are displayed on acathode-ray tube (CRT), recorded on anX•Y plotter, or stored on tape.
The system is illustrated In the figureA shutter between the lamp and the cellreduces the exposure time and mini.mlzes heating. Heating is further re-duced by a dichroic reflector, whichdirects mostly visible light onto the cellwhile permitting much of the infraredlight to escape. The cell is also cooled byforced air circulation.
Each load is applied to the cell by aprogramable do power supply, Follow•ing the voltage measurement at eachcurrent selling, the microcomputerrepeats and verifies the voltage meas•urement and computes the power out-put, The microcomputer steps the solarcell through approximately 200 testloads each second.
Data are obtained with three lest se.quences. In an initial sequence, dVldl isdetermined at I = 0 followed by themeasurement and verification of volt-ages at Increasing currents in In-crements of 32 mA. Power Is computedat each test point and comparedwilh theprevious value.
Upon detection of a decrease inpower output, the program lumps to asequence that decrements current by1 mA until the maximum-power pointhas been passed again. The programthen jumps to a third sequence thatresumes the current stepping but withincrements that are varied to maintainthe voltage increments between 1.2 and19.5 mV. The measurements continueuntil the plateau region of the I/V curve Iscompletely mapped to the short-circuit(V = 0) point
The system tests a wide range ofsolar cells. The apparatus and program-ing technique are also applicable toother devices, such as tother types ofbatteries and sensors.
C7
This work was done by Jay W. Lathropand Charles R. Saylor of ClemsonUniversity for NASA's Jet PropulsionLaboratory. For further information,Circle 9 on the TSP Request Card.NPO• 15676
NASA Tech Briefs, Spring 1983
253(_
D
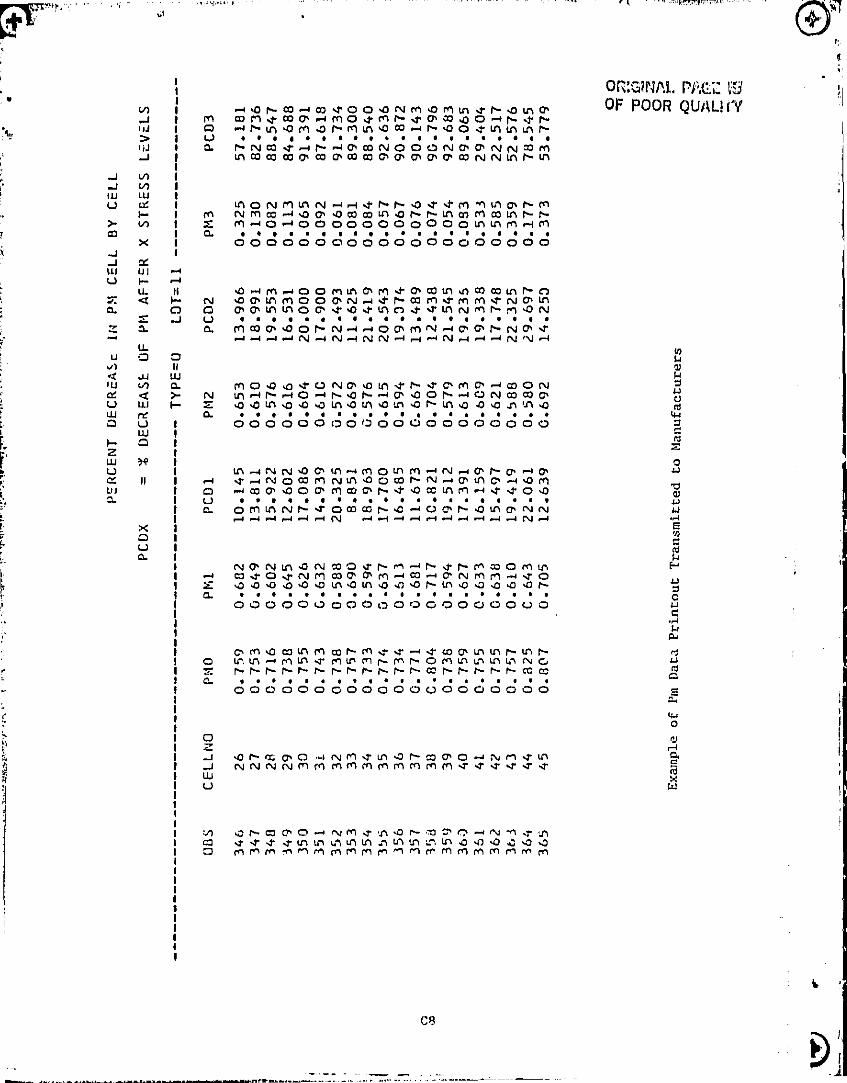
JJILumJJ111u
7a
uvt4^uCuwO
zZwuCu,
V)
4J^IJJNNwCV)
XuI
ulLLLLQ
0.
LL0
luN4wKL)w0
I
H.-t
nJ
0wa
F-
1
X0uQ.
_ . .,. ., ._. .. .. _„. ... •l_... ,.jam_„^._.. _.
ORI.GWr.t. PP,c ” X31OF POOR QUAL?IV^10 n O.-t m ro O,0 N m Q mm 'r t- in 0,
m mm Ln imMLn V0'rLntnLnr-o .^rinwmormin^om•-^r^000-lnu^vtnL.) . . • . . . . • . .
0. NNm a^r ..d 0. mNOOON O, O, NNmmUt Omm 0 , m O, m m C% a, T 0, 0, m N N mnm
4 O N M m N -•.irn n 10 rr m Mm 0, nmm O, Ommm onn mmmmmnn^ m.-+o.+00000OOOOOOInInM.-ima 0 0 0 0 0 0 0 0 0 0 0 0 0 0 0 0 0 0 0 0
10 -m . 0 O Mm O, M r O, mm 0 m mm f"0N ,O O+m mOO O, N. d. mmrm maN O,mO O, O, m NO C, r ,or in O r a In N M n m ,ON
0. m m 0, 10 O 4N-1 .r O ; m N ,-1 C^ fi h N C^ r.-+--i ^^N N Nn-INNS.-I ^N.-1 .^ ^N N.-1
M0 .0,0 a U NO„0 m r r- 'r C, MM m0NN m.-1 f--.-40 - n , a N^ O, ,O O h,-t ON O m C,
410 m 1010 a 010ut,a 0 10n m 10 a,o n tn.a0. . • • • . • . . . . • . . • . .
0 0 0 0 0 0 0 0 ,7 O O U 0 0 0 0 0 0 0 0
m N N ,O C1 m-+m O m m - N - 0 r- C, ^P.^ r.-iNOmmNm OOm n N-0, m C , -„OMo mm o0a, mma, n4 ommm aao au . .C Om m Nn r Omm n Gm r,C -• m C` NN
NO, Nm,ON mo rn m,-,n rr- MOOmm-+ mrOrNmwo , 0, M..,M. o- N mm -z 10 4 10 10410 m4 m ,0.a ,0 I^m,0 z.O z,O n
000r^o^ 000c^oocoouoouo
C1 ff110 mm m mnmr r -a rw cl mmmmr-O m.m -+Mm r Mm M(.. m.n Gm 6 un mm N
nrnnnnnnnnrmm^nnnnmma • .
O O O O O O G 0 0 0 0 0 U O O U 0 0 0 0
O.ZJ ,O n m 0, O .-, N M r m 10 n m 0, 0- N 1fmJ N N N N m f f t m m m m m m m m r r r r r rwu
n anm o• o- r'n an,-1 TC N r 'mO r r r rmm mm m.'1 m to ,010'0 z a J0 Mmm -r,mm MMMMMMmMMmM m,'., M
CA
1It
D