investigating the potential of deficit irrigation ... · potential of deficit irrigation strategies...
TRANSCRIPT

Investigating the potential of deficit irrigation strategies to
improve the efficiency of water use in irrigated temperate
pastures Phase II
Final report to DairyTas
August 2009
Richard Rawnsley, Danny Donaghy and Mark Freeman
Tasmanian Institute of Agricultural Research

Table of contents
Executive summary ............................................................................................................. 1
Pasture performance ....................................................................................................... 2
Water use efficiency ........................................................................................................ 3
Nitrogen efficiency .......................................................................................................... 5
Herbage quality .............................................................................................................. 8
Modelling outcomes ........................................................................................................ 8
Simulation results .......................................................................................................... 12
Communication of results ................................................................................................. 17
Other activities .................................................................................................................. 17
Conclusion ........................................................................................................................ 18
Project team ...................................................................................................................... 18
References ......................................................................................................................... 19
Appendix 1. - Abstract taken from Ms Janice Perry honours thesis. ................................ 20

1
Executive summary
This document is a final report to DairyTas for the project titled ‘Investigating the
potential of deficit irrigation strategies to improve the efficiency of water use in irrigated
temperate pastures Phase II’.
The research in this project was successfully completed according to the project schedule
outlined in the DairyTas small grant proposal. The principle aims of the project were to:
Monitor pasture performance and water use efficiency from different deficit
irrigation strategies.
To quantify the effects of differing nitrogen application rates under deficit
irrigation strategies.
To quantify the effects of deficit irrigation on herbage quality for the pasture
samples collected in phase 1 of the project.
To model the results of the study and extend outcomes to differing soil types and
regions by running model simulations for different dairy regions over a number of
years.
To communicate results of the study through presentations of the findings at field
days and in the Pasture PLU$ newsletter.
This project encompassed a 2.0 ha experimental site located at Elliott research and
demonstration station. The trial design was a randomized split plot design with four
replications. There were five irrigation treatments (main plot) by three nitrogen
treatments (subplot treatments). A rainfall deficit (potential evapotranspiration minus
rainfall) of 20 mm was used to schedule irrigation at which point 20, 16, 12, 8 or 0 mm of
irrigation water was applied, referred to as irrigation treatments 100, 80, 60, 40 and 0%,
respectively. The nitrogen treatments were 0, 1.5 and 3.0 kg N/ha.day which was applied
within 1 week after each grazing event. The experimental site was grazed by 60 Holstein
Friesian heifers each time the 100% irrigation treatment regrew between 2.5 and 3.0
leaves/tiller. A calibrated rising plate meter was used to estimate the pre- and post-
grazing pasture biomass for each plot. The difference between the pre- and post-grazing

2
pasture biomass estimates was used to calculate the amount of pasture utilised at each
grazing event. The marginal irrigation water use index (MIWUI) was calculated as
marginal production due to irrigation/irrigation water applied, while the nitrogen response
rate for each nitrogen treatment was calculated as the marginal production due to
nitrogen/nitrogen applied.
Pasture performance
There were a total of seven grazing events between October 2008 and April 2009. The
first irrigation occurred on 20th
October 2008 and there were total of 18 irrigation events.
This equated to 360, 288, 216 and 144mm of irrigation being applied to 100, 80, 60, and
40% irrigation treatments, respectively. The total rainfall for the experimental period was
456mm. The cumulative pasture consumption for each irrigation treatment by nitrogen
application is given in figure 1. There was a significant (P < 0.05) irrigation by nitrogen
interaction on the cumulative pasture consumption.
Figure 1. The cumulative pasture consumption for each watering by nitrogen
treatment between October and April. Means with differing subscripts above columns
indicate a significant difference at P = 0.05.
3
The highest pasture consumption was 13.6t DM/ha and this was achieved by the 100%
irrigation treatment with 1.5kg N/ha being applied. This was not significantly (P > 0.05)
different to the 100%, 80% or 60% irrigation treatment when 3.0 kg N/ha.day was
applied. The cumulative pasture consumption from the rain-fed treatment when some
nitrogen was applied was not significantly (P > 0.05) different to the 40, 60 or 80%
irrigation treatments when no nitrogen was applied. This highlights the reality that
irrigation influences the response of other inputs. To achieve maximum responses from
irrigation other management factors, like nitrogen usage and grazing management, have a
significant influence of the irrigation response observed.
Water use efficiency
There was no significant (P > 0.05) irrigation treatment effect on the marginal irrigation
water use index (MIWUI), defined as the marginal production due to irrigation divided
by the irrigation applied. There was also no significant (P > 0.05) nitrogen by irrigation
treatment interaction on the MIWUI. The mean MIWUI across all treatments was 13.7kg
DM/mm. The mean MIWUI for each irrigation treatment under the three differing
nitrogen rates and averaged across all three nitrogen rates is given in Figure 2.

4
Figure 2. The mean marginal irrigation water use index (kg DM/mm) for each
watering by nitrogen treatment between October and April. Standard error of mean
shown as error bars.
There was a significant nitrogen effect on the MIWUI. The mean MIWUI across the
irrigation treatments when zero nitrogen was applied was 9.0 kg DM/mm. This was
significantly lower than that achieved when 1.5 or 3.0 kg N/ha was applied, which were
not significantly (P > 0.05) different to each other.
5
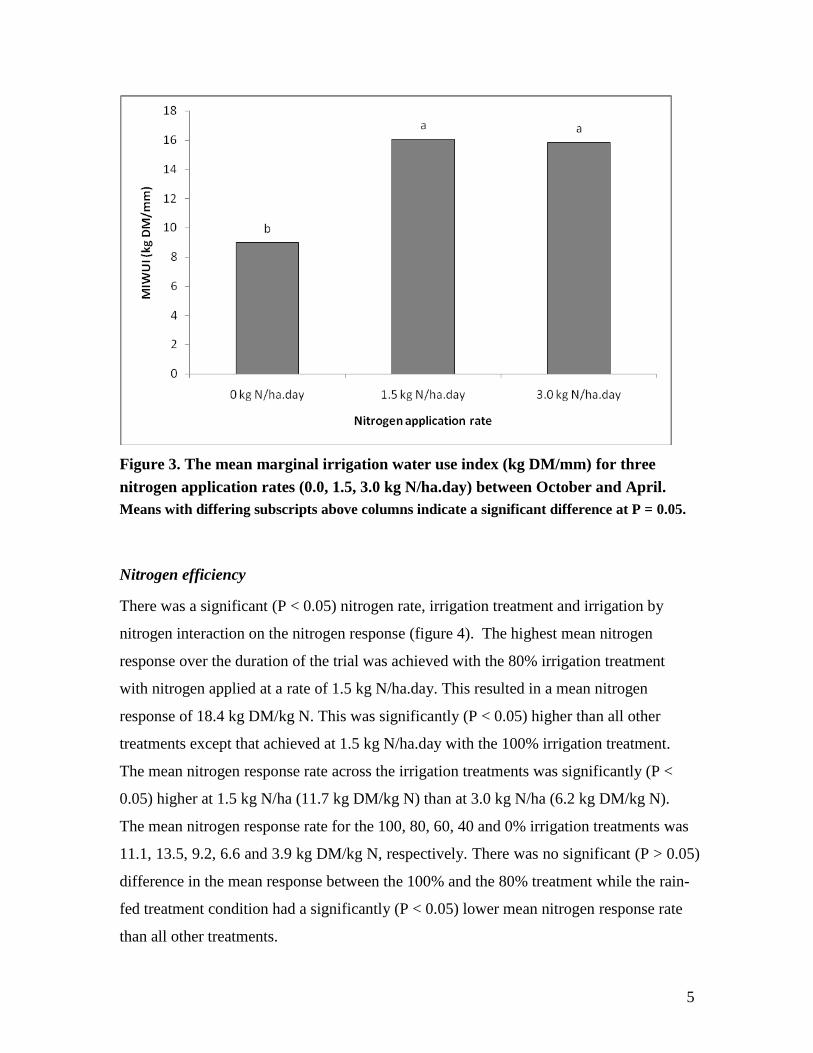
Figure 3. The mean marginal irrigation water use index (kg DM/mm) for three
nitrogen application rates (0.0, 1.5, 3.0 kg N/ha.day) between October and April.
Means with differing subscripts above columns indicate a significant difference at P = 0.05.
Nitrogen efficiency
There was a significant (P < 0.05) nitrogen rate, irrigation treatment and irrigation by
nitrogen interaction on the nitrogen response (figure 4). The highest mean nitrogen
response over the duration of the trial was achieved with the 80% irrigation treatment
with nitrogen applied at a rate of 1.5 kg N/ha.day. This resulted in a mean nitrogen
response of 18.4 kg DM/kg N. This was significantly (P < 0.05) higher than all other
treatments except that achieved at 1.5 kg N/ha.day with the 100% irrigation treatment.
The mean nitrogen response rate across the irrigation treatments was significantly (P <
0.05) higher at 1.5 kg N/ha (11.7 kg DM/kg N) than at 3.0 kg N/ha (6.2 kg DM/kg N).
The mean nitrogen response rate for the 100, 80, 60, 40 and 0% irrigation treatments was
11.1, 13.5, 9.2, 6.6 and 3.9 kg DM/kg N, respectively. There was no significant (P > 0.05)
difference in the mean response between the 100% and the 80% treatment while the rain-
fed treatment condition had a significantly (P < 0.05) lower mean nitrogen response rate
than all other treatments.

6
Figure 4. The mean nitrogen response rate (kg DM/kg N) for each watering by
nitrogen treatment between October and April.. Means with differing subscripts above
columns indicate a significant difference at P = 0.05.
Although there was no significant (P < 0.05) difference in the nitrogen response rate
between the 80% and 100% treatment, the mean nitrogen response for both nitrogen rates
were both strongly explained by a third order polynomial. This highlights the interaction
between water applied and nitrogen application rate on nitrogen response.

7
Figure 4. A third order polynomial fitted to the mean nitrogen response rate (kg
DM/kg N) for each irrigation treatment with nitrogen applied at rate of 1.5 kg
N/ha.day (■) and 3.0 kg N/ha.day (♦).
Nitrogen response rates were significantly (P < 0.05) higher when applied at a rate of 1.5
kg N/ha.day then when applied at a rate of 3.0 kg N/ha.day. As irrigation treatment
increased between 40% and 80% the nitrogen response rate increased. At an irrigation
rate of 100% nitrogen response rate declined as explained by the third order polynomial
given in Figure 4. This was most likely in response to high a level of through drainage
associated with the 100% treatment in comparison to the other treatment. This highlights
the importance of accurate irrigations scheduling and also having a high (>90%)
distribution uniformity of the irrigation delivery system. Where irrigation delivery
systems have low distribution uniformity or irrigation scheduling is poor resulting in
irrigation applications exceeding water requirements, through drainage will increase.
Although over watering has the potential to reduce pasture production in response to
anaerobic conditions, the N response rates shown in Figure 4 indicate that where over
watering occurs N response rates will decline. Nitrate is a very mobile ion in the soil. As

8
water passes the root zone, as a result of overwatering, nitrate leaching will also increase
resulting in a lower level of nitrate available to support plant production.
Herbage quality
The experimental site provided a medium for the research and demonstration of a number
of other activities. This included Ms. Janice Perry undertaking a School of Agricultural
Science Honours study entitled ‘Investigating the effect of deficit irrigation on perennial
ryegrass (Lolium Perenne) morphology and herbage quality’. A copy of Janice abstract is
given in appendix 1. A full copy of her thesis can be accessed from the School of
Agricultural Science.
Modelling outcomes
DairyMod, a mechanistic biophysical model developed for the Australian dairy industry
(Johnson et al. 2008), was validated using the experimental data and was then used to
extrapolate the results across years and 5 dairy regions of Tasmania. The model uses
daily weather information and comprises soil water, soil nutrient, pasture growth and
animal production modules. The model is sufficiently versatile to simulate the range of
environments represented by the pastoral regions of Australia (Johnson et al. 2008).
Validation of the model by Cullen et al. (2008) has shown strong agreement between
modelled and actual data across a number of pastoral systems in Australia and New
Zealand.
Modelled data were validated against the experimental data using a range of model
evaluation statistics, based on the work of Tedeschi (2006). These statistics were
calculated separately for pasture utilised across all irrigation treatments. The statistics
calculated were: mean bias, the difference between measured and simulated mean; r2,
coefficient of determination; mean prediction error, a measure of general model
efficiency expressed as % of mean (Bibby and Toutenburg 1977); model efficiency, the
proportion of variation explained by the modelled value with a value of 1 indicating a
perfect fit; variance ratio, the amount of variance in the measured and modelled data-sets

9
with a value of 1 indicating the same amount of variance; bias correction factor, which
indicates bias from the y=x line with a value of 1 indicating no bias; and the concordance
correlation coefficient, which is a simultaneous measure of accuracy and precision with
an ideal fit indicated by a value of 1. Further details of these statistics are available in
Tedeschi (2006).
There was strong agreement between observed versus modelled pasture consumption data
(Figure 5).
Figure 5. Actual and modelled pasture consumption (t DM/ha) for each irrigation
treatment 100% (■), 80%(♦), 60%(▲), 40%(□) and 0%(◊) for each grazing.
Summary statistics between the observed data and the modelled data indicated that 93%
of the variation can be accounted for by the model with a bias correction factor of 0.99,
indicating little bias between the 1:1 relationship (Table 1).

10
Table 1. Summary statistics indicating model performance of DairyMod for pasture
consumption in each irrigation treatment and grazing event.
Summary statistic
Measured mean 1.21
Simulated mean 1.29
Mean bias -0.08
r2 0.93
Mean prediction error 18.5%
Modeling efficiency 0.88
Variance ratio 0.87
Bias correction factor 0.99
Concordance correlation coefficient 0.95
Following validation of the model using data from the experimental site, simulations for
5 dairy regions in Tasmania (Table 2) were run for a 40 year period (1968-2007). Site
specific climatic data and soil physical properties were used (Table 1). Daily climate data
for each site were obtained from the Bureau of Meteorology SILO database (Jeffery et al.
2001).

11
Table 2. Site details (latitude, longitude, soil type, plant available water, readily available water, mean annual rainfall, mean
annual potential evapotranspiration, and mean monthly rainfall over the irrigation season (October to April)) for 5
Tasmanian dairy regions.
Site Latitude/
Longitude Soil type
a
Plant
available
waterb
(mm/cm)
Readily
available
waterb
(mm/cm)
Mean
annual
rainfallc
(mm/yr)
Mean annual
potential
evapotranspirationc
(mm/yr)
Mean monthly rainfall (mm)c
Oct Nov Dec Jan Feb Mar April
Elliott 41.1
oS
145.8’E
Red
Ferrosol 1.4 0.7 1191 794 106 77 76 50 55 57 92
Scottsdale 41.2
oS
147.5’E
Brown
Dermosol 1.5
0.7
1001 854 87 69 68 61 40 51 81
Smithton 40.8
oS
145.1’E
Hemic
Organosols 2.0 0.9 1106 788 100 82 71 50 50 57 92
Deloraine 41.5
oS
146.6’E
Brown
Kurosols 0.9 0.4 951 862 94 64 64 51 46 50 73
Bushy
Park
42.7 oS
146.9’E
Black
Vertosol 1.9 0.4 576 901 58 53 51 41 35 39 47
aIsbell (1996)
bCotching et al. (2002a, 2002b, 2002c, 2008 pers comm.)
cBureau of Meteorology - http://www.bom.gov.au

12
Simulation for each of the five sites where undertaken using DairyMod with the
following parameters:
Pasture was cut to a residual of 1.5 t DM/ha and defoliation occurred at the 3.0 leaf stage
of regrowth. Three differing N management scenarios were simulated to examine the
interactions between deficit irrigation approaches and N applications on pasture
production, water use efficiency, N leached and total water lost to through drainage and
runoff. The three differing N management scenarios were:
No N applied, from here on referred to as the zero N treatment
30 kg N/ha applied immediately following each defoliation, from here on referred
to as the rotationally applied N treatment
N applied at a rate of 30kg N/ha when the soil N status fell below 10ppm, from
here on referred to as the N non-limiting treatment
Five irrigation treatments were simulated and consistent of applying 20 (I100%), 16
(I80%), 12 (I60%), 8 (I40%), and 0 mm (I0%) of irrigation water at a rainfall deficit of
20 mm. The rainfall deficit was calculated as the difference in potential
evapotranspiration minus rainfall.
Simulation results
For each region there was a significant (P < 0.05) irrigation by N interaction on the mean
yearly pasture production, MIWUI, and total N leached (Tables 3 to 5). The mean yearly
pasture production in each region was highest with I100% with N applied to be non-
limiting. In all regions, except Deloraine, this was not significantly (P > 0.05) higher than
I80% with N applied to be non-limiting. In each region the lowest mean yearly pasture
production occurred with I0% with zero N applied. This was significantly (P < 0.05)
lower than for all other treatments.
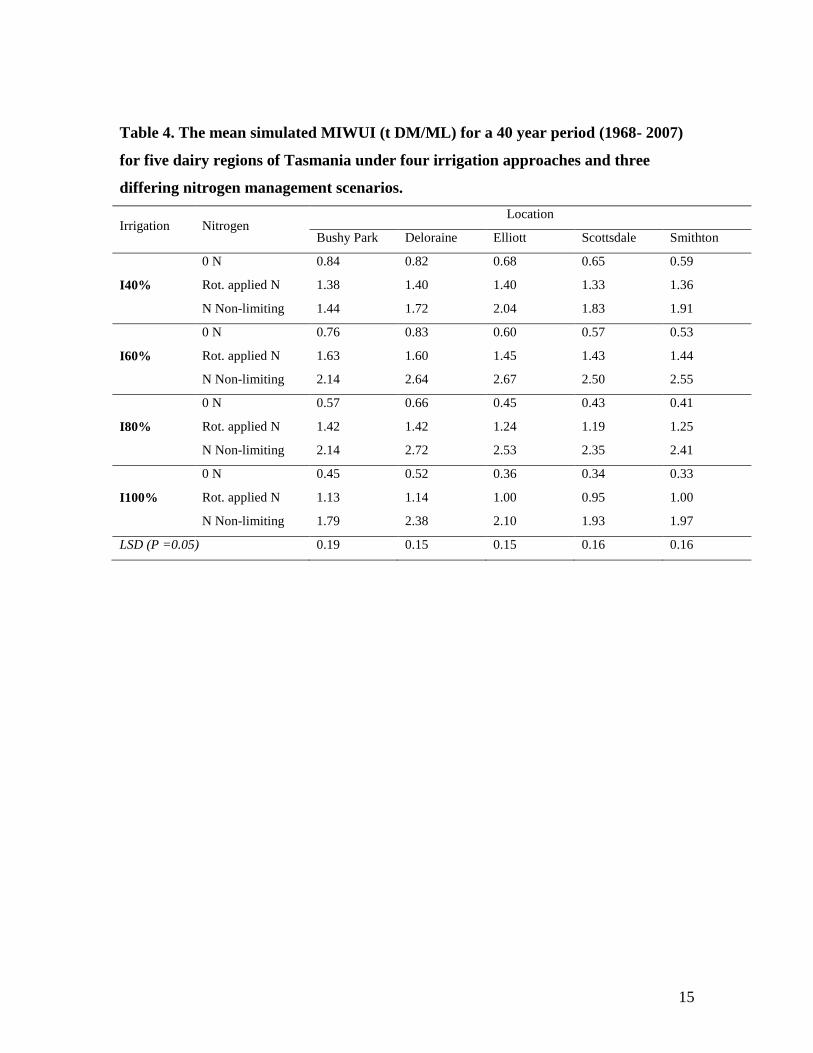
The mean yearly MIWUI for each region exceeded 2t DM/ML when N was applied to be
non-limiting with the I60% or I80% treatment. When N was applied to be non-limiting
there was no significant (P > 0.05) difference in the mean MIWUI between the I60% and
I80% treatment in each region. The mean MIWUI for I60% and I80% when N was
applied to be non-limiting was significantly (P < 0.05) higher than the corresponding

13
mean MIWUI for I40% and I100% in each region. In each region, I100% with zero N
resulted in the lowest mean MIWUI. This was significantly (P < 0.05) lower than for all
other treatments. When zero N was applied, I40% resulted in the highest MIWUI in each
region. This was significantly (P < 0.05) higher than I80% and I100% treatment, but not
significantly (P > 0.05) different to the I60% treatment.
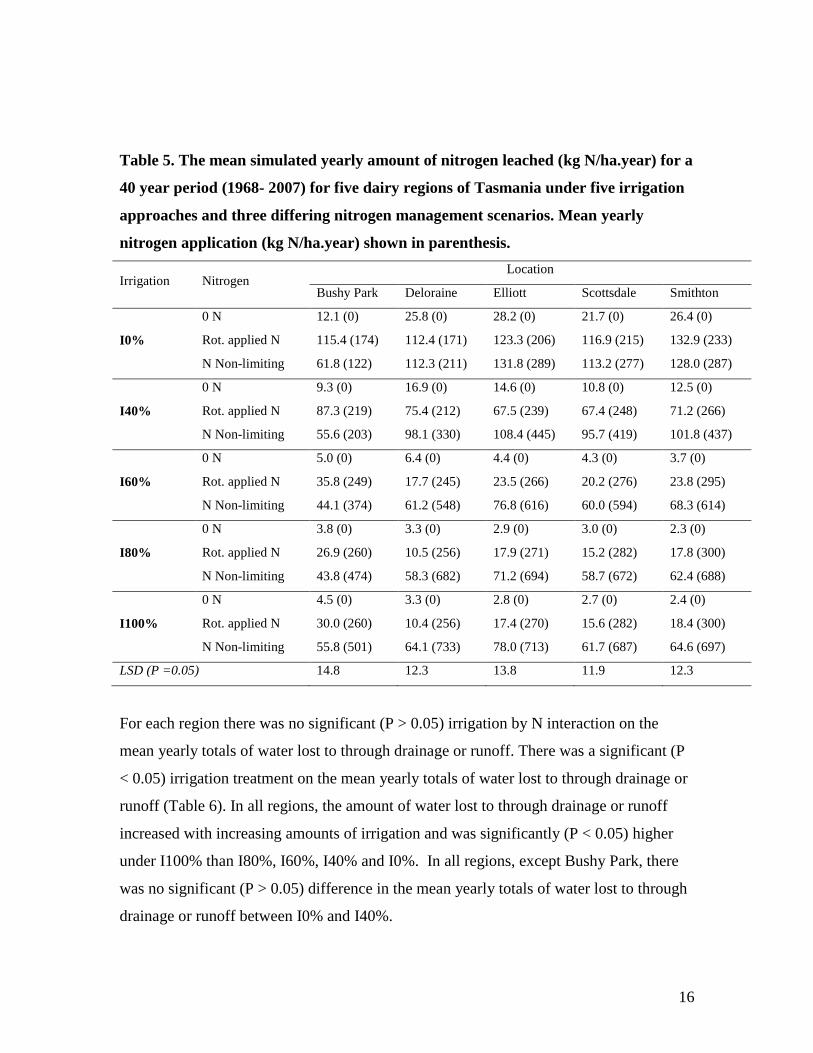
For all regions the highest amount of N leaching occurred under I0%, when either N was
applied rotationally or to be non-limiting. For I40%, I60%, I80% and I100% the mean
yearly total of N leached increased with increasing yearly totals of N applied, in each
region. For all regions except Bushy Park, significantly (P < 0.05) more N leaching
occurred under the I40% than the I100% when N was applied to be non-limiting.

14
Table 3. The mean simulated yearly pasture production (t DM/ha.year) for a 40 year
period (1968- 2007) for five dairy regions of Tasmania under five irrigation
approaches and three differing nitrogen management scenarios.
Irrigation Nitrogen Location
Bushy Park Deloraine Elliott Scottsdale Smithton
I0%
0 N 4.58 4.33 5.44 5.75 6.33
Rot. applied N 5.75 5.88 7.53 7.99 8.52
N Non-limiting 5.77 6.48 8.51 8.86 9.22
I40%
0 N 6.31 6.15 6.80 7.10 7.48
Rot. applied N 8.56 8.95 10.29 10.74 11.15
N Non-limiting 8.69 10.20 12.48 12.60 12.87
I60%
0 N 6.96 7.13 7.28 7.59 7.94
Rot. applied N 10.80 11.29 11.89 12.44 12.78
N Non-limiting 12.33 15.19 16.40 16.59 16.64
I80%
0 N 7.02 7.33 7.30 7.61 8.00
Rot. applied N 11.66 12.29 12.54 12.99 13.47
N Non-limiting 14.57 18.56 18.54 18.58 18.64
I100%
0 N 6.98 7.29 7.28 7.58 7.99
Rot. applied N 11.63 12.35 12.55 12.96 13.46
N Non-limiting 14.97 19.75 18.92 18.88 18.87
LSD (P =0.05) 0.57 0.53 0.53 0.55 0.50
15
Table 4. The mean simulated MIWUI (t DM/ML) for a 40 year period (1968- 2007)
for five dairy regions of Tasmania under four irrigation approaches and three
differing nitrogen management scenarios.
Irrigation Nitrogen Location
Bushy Park Deloraine Elliott Scottsdale Smithton
I40%
0 N 0.84 0.82 0.68 0.65 0.59
Rot. applied N 1.38 1.40 1.40 1.33 1.36
N Non-limiting 1.44 1.72 2.04 1.83 1.91
I60%
0 N 0.76 0.83 0.60 0.57 0.53
Rot. applied N 1.63 1.60 1.45 1.43 1.44
N Non-limiting 2.14 2.64 2.67 2.50 2.55
I80%
0 N 0.57 0.66 0.45 0.43 0.41
Rot. applied N 1.42 1.42 1.24 1.19 1.25
N Non-limiting 2.14 2.72 2.53 2.35 2.41
I100%
0 N 0.45 0.52 0.36 0.34 0.33
Rot. applied N 1.13 1.14 1.00 0.95 1.00
N Non-limiting 1.79 2.38 2.10 1.93 1.97
LSD (P =0.05) 0.19 0.15 0.15 0.16 0.16
16
Table 5. The mean simulated yearly amount of nitrogen leached (kg N/ha.year) for a
40 year period (1968- 2007) for five dairy regions of Tasmania under five irrigation
approaches and three differing nitrogen management scenarios. Mean yearly
nitrogen application (kg N/ha.year) shown in parenthesis.
Irrigation Nitrogen Location
Bushy Park Deloraine Elliott Scottsdale Smithton
I0%
0 N 12.1 (0) 25.8 (0) 28.2 (0) 21.7 (0) 26.4 (0)
Rot. applied N 115.4 (174) 112.4 (171) 123.3 (206) 116.9 (215) 132.9 (233)
N Non-limiting 61.8 (122) 112.3 (211) 131.8 (289) 113.2 (277) 128.0 (287)
I40%
0 N 9.3 (0) 16.9 (0) 14.6 (0) 10.8 (0) 12.5 (0)
Rot. applied N 87.3 (219) 75.4 (212) 67.5 (239) 67.4 (248) 71.2 (266)
N Non-limiting 55.6 (203) 98.1 (330) 108.4 (445) 95.7 (419) 101.8 (437)
I60%
0 N 5.0 (0) 6.4 (0) 4.4 (0) 4.3 (0) 3.7 (0)
Rot. applied N 35.8 (249) 17.7 (245) 23.5 (266) 20.2 (276) 23.8 (295)
N Non-limiting 44.1 (374) 61.2 (548) 76.8 (616) 60.0 (594) 68.3 (614)
I80%
0 N 3.8 (0) 3.3 (0) 2.9 (0) 3.0 (0) 2.3 (0)
Rot. applied N 26.9 (260) 10.5 (256) 17.9 (271) 15.2 (282) 17.8 (300)
N Non-limiting 43.8 (474) 58.3 (682) 71.2 (694) 58.7 (672) 62.4 (688)
I100%
0 N 4.5 (0) 3.3 (0) 2.8 (0) 2.7 (0) 2.4 (0)
Rot. applied N 30.0 (260) 10.4 (256) 17.4 (270) 15.6 (282) 18.4 (300)
N Non-limiting 55.8 (501) 64.1 (733) 78.0 (713) 61.7 (687) 64.6 (697)
LSD (P =0.05) 14.8 12.3 13.8 11.9 12.3
For each region there was no significant (P > 0.05) irrigation by N interaction on the
mean yearly totals of water lost to through drainage or runoff. There was a significant (P
< 0.05) irrigation treatment on the mean yearly totals of water lost to through drainage or
runoff (Table 6). In all regions, the amount of water lost to through drainage or runoff
increased with increasing amounts of irrigation and was significantly (P < 0.05) higher
under I100% than I80%, I60%, I40% and I0%. In all regions, except Bushy Park, there
was no significant (P > 0.05) difference in the mean yearly totals of water lost to through
drainage or runoff between I0% and I40%.

17
Table 6. The mean simulated yearly amount of water (mm/year) lost to through
drainage and runoff for a 40 year period (1968- 2007) for five dairy regions of
Tasmania under five irrigation approaches. Mean yearly irrigation amount
(mm/year) shown in parenthesis.
Irrigation Location
Bushy Park Deloraine Elliott Scottsdale Smithton
I0% 133 (0) 421 (0) 590 (0) 431 (0) 439 (0)
I40% 158 (209) 445 (224) 619 (198) 462 (208) 470 (196)
I60% 184 (313) 465 (336) 651 (297) 494 (312) 504 (295)
I80% 246 (418) 518 (448) 718 (396) 564 (416) 573 (393)
I100% 346 (522) 617 (560) 814 (495) 665 (520) 669 (491)
LSD (P =0.05) 20 46 54 40 42
The modelling undertaken in this study provides an indication of the water and N
requirements for maximising pasture productivity in five differing dairy regions of
Tasmania and has shown that a deficit irrigation approach could potentially increase farm
productivity under limited water resource conditions.
Communication of results
Results of the study are communicated by contributions to Tassie Dairy News and a field
day is planned for September 2009 to coincide with the start of the irrigation season. In
addition, the results of the deficit irrigation work undertaken in 2007/08 and 2008/09
were presented as part of national irrigation workshop in Melbourne in May 2009. The
results will also be presented as part the professional development events for agricultural
consultants and field officers coordinated by NRM North, in conjunction with the
Tasmanian Institute for Agricultural Research in August 2009.
Other activities
In addition to Ms Janice Perry undertaking a School of Agricultural Science Honours
study, the CSIRO Information and Communication Technologies centre demonstrated
and tested the use of their soil moisture sensor network and HydroTas demonstrated the
use of their Adjenti units.

18
Conclusion
The observed experimental data and simulated results from the current study suggest that
the obtainable marginal water use index is much higher than the current industry standard
of 1 t DM/ML. This study has therefore shown that the opportunity exists for irrigated
pasture systems to better manage an increasingly scarce resource while still maintaining
economically feasible yields.
Project team
The project supervisor and principal investigator was Richard Rawnsley. Mark Freeman
and Danny Donaghy were also investigators on the project. Technical support was
provided by Peter Chamberlain and Karen Christie. Lesley Irvine assisted in coordinating
grazing for the experimental site. .
19
References
Bibby J, Toutenburg H (1977) ‘Prediction and improved estimation in linear models.’
(Wiley: Berlin)
Cotching WE, Cooper J, Sparrow LA, McCorkell BE, Rowley W (2002a) Effects of
agricultural management on dermosols in northern Tasmania. Australian Journal of Soil
Research 40, 65-79.
Cotching WE, Cooper J, Sparrow LA, McCorkell BE, Rowley W, Hawkins K (2002b)
Effects of agricultural management on vertosols in Tasmania. Australian Journal of Soil
Research 40, 1267-1286.
Cotching WE, Hawkins K, Sparrow LA, McCorkell BE, Rowley W (2002c) Crop yields
and soil properties on eroded slopes of red ferrosols in north-west Tasmania. Australian
Journal of Soil Research 40, 625-642.
Isbell RF (1996) ‘Australian soil and land survey handbook: the Australian soil
classification.’ (CSIRO Publishing: Collingwood, Victoria)
Jeffrey SJ, Carter JO, Moodie KM, Beswick AR (2001) Using spatial interpolation to
construct a comprehensive archive of Australian climate data. Environmental Modelling
and Software 16, 309-330.
Johnson I R, Chapman DF, Snow VO, Eckard RJ, Parsons AJ, Lambert MG, Cullen BR
(2008) DairyMod and EcoMod: Biophysical pastoral simulation models for Australia and
New Zealand. Australia Journal of Experimental Agriculture 48, 621-631.
Tedeschi LO (2006) Assessment of the adequacy of mathematical models. Agricultural
Systems 89, 225-247.
20
Appendix 1. - Abstract taken from Ms Janice Perry honours thesis.
Pasture as the dominant feed source is crucial to maintaining a low cost of production for
the Australian dairy industry. Perennial ryegrass (Lolium perenne L.) is the most popular
fodder species used in temperate pasture systems because it is easy to grow and has a
high nutritive value. However, growth rates, pasture quality and persistence are reduced
in summer due to high temperatures and water stress. Irrigation has been used to
overcome this with approximately 70% of Tasmania dairy farms having some irrigation.
Water availability has been decreasing in recent years due to drought, and high water
demands have also increased the price of water. The increase of pasture water use
efficiency is an important issue facing Australian dairy farmers. Deficit irrigation is one
option farmers can used to increase water use efficiency of pasture. Farmers with limited
water resources are faced with the decision of whether to fully irrigate a small area of
pasture or to deficit irrigate a larger area of pasture. Research has already been conducted
showing the effects of deficit irrigation on pasture yield and that the water use efficiency
is improved with deficit irrigation; however there is little information about the effect of
deficit irrigation on pasture quality and morphology. These are import factors that
influence pasture persistence, dry matter (DM) production, stocking rates and milk
quality.
The aim of this study was to determine the effect of deficit irrigation on perennial
ryegrass pasture quality traits including crude protein (CP), neutral detergent fibre (NDF),
percentage DM, DM digestibility (DDM) and metabolisable energy (ME) content. A
further aim was to ascertain whether deficit irrigation affects morphology traits such as
leaf elongation rates, specific leaf area, root DM distribution, plant number, tiller density
and production of daughter tillers.
A field study at Elliott research station using the perennial ryegrass cultivar Impact was
conducted under commercial grazing and irrigation management. Five irrigation
21
treatments, 100, 80, 60, 40 and 0% were replicated four times in a random block design.
Irrigation was applied when evapotranspiration equalled 20mm. This was calculated
using a Class A pan, as well as rainfall and a crop factor. Pasture herbage samples were
collected monthly from November to March and herbage quality results calculated via
near infrared spectrophotometry. Morphology measurements were taken over the same
sample period.
The major finding of this study was that in the deficit and fully irrigated pastures, CP,
NDF, DDM and ME were not significantly different (P>0.05) throughout the sample
season. However under water stress, dryland CP was significantly (P<0.05) lower and
NDF levels increased. Consequently, the increase in NDF levels reduced dryland ME and
DDM. Dryland DM% followed a similar pattern of no significant difference at 100, 80
and 60% irrigated treatments, however in times of water stress the 40% irrigation
treatment was significantly higher (P<0.05) than the other irrigated treatments but also
significantly lower (P<0.05) than dryland.
There was no significant difference (P>0.05) in root DM distribution between the
treatments in January. However, in April the 100% irrigation treatment had significantly
less (P<0.05) root DM in the bottom 6-30 cm of a 30 cm deep soil sample and
significantly more (P<0.01) root DM in the top 0-5 cm. Analysed at (P<0.01), the dryland
treatment contained significantly less roots in 0-5 cm and significantly more roots in the
6-30 cm soil sample. There was also less total root DM over all treatments in the April
sample compared to the January sample.
Specific leaf weight declined from December to February over all treatments, however
the severity of the decrease was sharper under water deficit. At the January sample, both
the dryland and the 40% irrigation treatment recorded specific leaf weight that was
significantly lower than the other treatments. This pattern also occurred in February,
however it was not significant (P>0.05).

22
Tiller elongation rate (mm/day) was measured in January and February. There was a
reduction in elongation rate with a reduction in water, with the greatest reduction
recorded for 60, 40 and 0% irrigation treatments.
Tiller density (number of tillers/m2) in the irrigation treatments was lower in the
December and February samples compared to March. Tiller density in the dryland and
the 40% treatment was significantly lower (P<0.05) in February. The number of daughter
tillers over all treatments was significantly lower (P<0.05) in February and March
compared to December. In February, a greater number of daughter tillers were produced
with higher applications of irrigation. Plant numbers were also reduced from January to
February over all treatments. However in March there was an increase in plant numbers
in the dryland and 60% treatments.
It was concluded that deficit irrigation up to 60% under optimal grazing will have no
effect on pasture quality; however there will be a reduction in production most likely due
to changes in morphology. Therefore farmers with limited water resources are better to
deficit irrigate a larger amount of area than fully irrigate a smaller area because although
pasture yield will be reduced, over a larger area, total pasture production is greater.
Replication of this experiment would increase the significance of the findings.
Replication under different seasonal temperatures, rainfall patterns and common
irrigation methods would make the findings more usable for a wider range of farmers.
Repeating this experiment over a series of seasons would also show the long term effects
of deficit irrigation. Also conducting the experiment on other pasture species would be
beneficial to the industry.