irrigation potential lake victoria, tanzanianileis.nilebasin.org/system/files/assessment of...
TRANSCRIPT

Irrigation Potential Lake Victoria, Tanzania
Mara Valley, Bugwema, Isanga, Manonga, Ngono

Irrigation Potential Lake Victoria, Tanzania Mara Valley, Bugwema, Isanga, Manonga, Ngono
October 2008
Client Nile Basin Initiative
Authors Peter Droogers
Wim Bastiaanssen
WaterWatchGeneraal Foulkesweg 28A
6703 BS Wageningen
The Netherlands
+31 (0)317 423401
www.waterwatch.nl
Acknowledgement The consultants involved in this project wishes to acknowledge the assistance received from various people during their activities. In the Netherlands we received support from dr. Walter Immerzeel (FutureWater) and MSc Sander Zwart (WaterWatch) in the remote sensing and GIS analysis. Within NBI special appreciation should be made to dr. Tadele Gebreselassie (Regional Project Manager, EWUAP; Nairobi), Eng. Emmanuel Olet (Program Officer, NELSAP; Kigali) and Mr. Vincent Kabalisa (Lead Specialist for Water Harvesting and Community Managed Irrigation, EWUAP; Nairobi) to support and initiate the project. Finally, a special thanks to the staff who supported the consultants during their trip in the region: Eng. Amandus Lwena (National Coordinator EWUAP; Dar es Salaam), Mr. Joseph Terer (Project Manager Mara River Basin Project; Musoma), and Mr. Sai Jumambina (Zonal Irrigation Office; Musoma). October 2008 dr. Peter Droogers dr. Wim Bastiaanssen
2

Executive Summary Within the context of the Nile Basin Initiative (NBI), the Nile Equatorial Lakes Subsidiary Action Program (NELSAP) and the EWUAP (Efficient Water Use for Agricultural Production) are promoting irrigation development in Tanzania. A study was undertaken to evaluate and rank five potential irrigation schemes in the Tanzania part of the Lake Victoria Basin. Schemes included in the analysis are Bugwema, Manonga, Isanga, Nkona and Mara Valley. The methodology followed in this study to assess the irrigation potential of the five schemes is based on the assimilation approach to ensure the use of all available data, information, publications, local knowledge and expert judgment together. The study focused on the following five thematic areas: (i) land suitability, (ii) water resources assessment, (iii) water requirements, (iv) environmental considerations, and (v) institutional aspects. The following valuation scoring from -2 (negative) to +2 (positive) was obtained after analyzing all available information, data, models, local and expert knowledge: Mara Bugwema Isanga Manonga Ngono Food production +2 -2 +1 -2 +2 Environment -2 +2 +1 +0 +1 Vulnerable people +0 -2 +2 +2 +1 Institutional support +2 +2 +2 +0 +1 Economic viability +2 -1 +1 -1 +1
The result of this valuation of the five proposed schemes is not the same as the final ranking. Decision makers’ preferences should be included as well to obtain the final ranking. In this study we used to so-called ScoreCard methodology for this. A typical example for one assumed decision makers’ preference leads to the following ranking: Decision Preferences Final Ranking 1 Food production 1 Mara (22) 2 Economic viability 2 Isanga (20) 3 Institutional support 2 Ngono (20) 4 Vulnerable people 4 Bugwema (-10) 5 Environment 4 Manonga (-10)
Based on testing other decision makers’ preferences it was concluded that three schemes are high in ranking: Mara Valley, Ngono and Isanga. However, only based on the actual decision makers’ preferences final ranking can be determined.
3
ABBREVIATIONS ASDP Agricultural Sector Development Programme ASDS Agricultural Sector Development Strategy BWB Basin Water Board CA-WMA Comprehensive Assessment of Water Management in Agriculture DADPs District Agricultural Development Plans DFID Department For International Development DITS Director of Irrigation and Technical Services ET Evapotranspiration EWUAP Efficient Water Use for Agricultural Production FAO Food and Agriculture Organization of the United Nations GIS Geographical Information System GoT Government of Tanzania IWRM Integrated Water Resources Management MAFC Ministry of Agriculture, Food Security and Cooperatives MASL Meters Above Sea Level MCM Million Cubic Meters MDGs Millennium Development Goals NBI Nile Basin Initiative NELCOM Nile Equatorial Lakes Council of Ministers NELSAP Nile Equatorial Lakes Subsidiary Action Program NELTAC Nile Equatorial Lakes Technical Advisory Committee NIDP National Irrigation Development Plan NIMP National Irrigation Master Plan NPES National Poverty Eradication Strategy NSGRP National Strategy for Growth and Reduction of Poverty PRSP Poverty Reduction Strategy Paper RBMSIIP River Basin Management and Smallholder Irrigation Improvement Project SEBAL Surface Energy Balance Algorithm for Land UNDP United Nations Development Programme USAID United States Agency for International Development WB World Bank WUA Water Users’ Association ZIU Zonal Irrigation Unit
4

Contents
Executive Summary 3
ABBREVIATIONS 4
Contents 5
1 Introduction 9
2 Irrigation in Tanzania 11 2.1 Introduction 11 2.2 National Economic and Social policy Framework 13 2.3 National and Agricultural Sector Development Policies 15
2.3.1 Tanzania Development Vision 2025 15 2.3.2 Agricultural and Water Policies 16
2.4 Agricultural Sector Development Strategy and Programme 17 2.4.1 Agricultural Sector Development Strategy (ASDS) 17 2.4.2 Agricultural Sector Development Programme (ASDP) 17
2.5 Irrigation Development 17
3 Methodology 19
4 Overview of the Proposed Irrigation schemes 21
5 Analysis 23 5.1 Mara Valley 23
5.1.1 Overall description 23 5.1.2 Land suitability 24 5.1.3 Water resources assessment 27 5.1.4 Assessment of water requirements 28 5.1.5 Environmental considerations 30 5.1.6 Institutional and legal framework 31 5.1.7 Main findings 31
5.2 Bugwema 32 5.2.1 Overall description 32 5.2.2 Land suitability 32 5.2.3 Water resources assessment 33 5.2.4 Assessment of water requirements 35 5.2.5 Environmental considerations 36 5.2.6 Institutional and legal framework 36 5.2.7 Main findings 36
5.3 Isanga 37 5.3.1 Overall description 37 5.3.2 Land suitability 38 5.3.3 Water resources assessment 39 5.3.4 Assessment of water requirements 41 5.3.5 Environmental considerations 41
5

5.3.6 Institutional and legal framework 42 5.3.7 Main findings 42
5.4 Manonga 42 5.4.1 Overall description 42 5.4.2 Land suitability 43 5.4.3 Water resources assessment 44 5.4.4 Assessment of water requirements 46 5.4.5 Environmental considerations 47 5.4.6 Institutional and legal framework 47 5.4.7 Main findings 47
5.5 Ngono 48 5.5.1 Overall description 48 5.5.2 Land suitability 49 5.5.3 Water resources assessment 50 5.5.4 Assessment of water requirements 51 5.5.5 Environmental considerations 52 5.5.6 Institutional and legal framework 52 5.5.7 Main findings 53
6 Ranking 55
7 References 57
Appendix 1: Calculation methods 58
Tables
Table 1. Key features of the proposed irrigation schemes.......................................................... 21 Table 2. Irrigation requirements for Mara Valley for average (1993-2002) and dry (2000) conditions. ................................................................................................................................... 30 Table 3. Irrigation requirements for Bugwema for average (1993-2002) and dry (2000) conditions. ................................................................................................................................... 36 Table 4. Irrigation requirements for Isanga for average (1993-2002) and dry (2000) conditions...................................................................................................................................................... 41 Table 5. Irrigation requirements for Manonga Valley for average (1993-2002) and dry (2000) conditions. ................................................................................................................................... 46 Table 6. Irrigation requirements for Ngono for average (1993-2002) and dry (2000) conditions...................................................................................................................................................... 52 Table 7. ScoreCard ranking based on technical analysis and valuation. ................................... 55 Table 8. ScoreCard ranking based on the technical valuation and three examples of decision makers’ preferences. Numbers in brackets indicate total score. ................................................ 56
6

Figures
Figure 1. Global water scarcity map (source: Comprehensive Assessment of Water Management in Agriculture). ....................................................................................................... 11 Figure 2. Trends in food prices and irrigation expansion (source: Comprehensive Assessment of Water Management in Agriculture).............................................................................................. 12 Figure 3. Population Density by Region 2002 (source: Tanzania 2002 census). ....................... 12 Figure 4. Population Density Lake Victoria Basin (source: NASA Earths Observatory)............ 13 Figure 5. Location of the five proposed irrigation schemes as shown in Google Maps.............. 21 Figure 6. Trip made from Musoma to Mara Valley proposed scheme on July 15, 2008. ........... 23 Figure 7. Elevations in and around Mara Valley. ........................................................................ 25 Figure 8. Soil classification according to the FAO soils map of the world (FAO, 1988).............. 25 Figure 9. Organic matter, expressed in total carbon, for the top soil. ......................................... 26 Figure 10. Soil water holding capacity for the top soil................................................................. 26 Figure 11. Drainage conditions of soils. ...................................................................................... 27 Figure 12. Biomass production based on SEBAL Remote Sensing for Mara Valley.................. 27 Figure 13. Annual and average monthly precipitation for Mara Valley (source: Mitchell et al., 2004). .......................................................................................................................................... 28 Figure 14. Actual and potential evapotranspiration for Mara Valley based on SEBAL remote sensing. ....................................................................................................................................... 29 Figure 15. Crop water requirements for average conditions (top, 1993-2002) and a dry year (bottom, 2000). ............................................................................................................................ 30 Figure 16. Elevations in and around Bugwema. ......................................................................... 33 Figure 17. Biomass production based on SEBAL Remote Sensing for Bugwema..................... 33 Figure 18. Annual and average monthly precipitation for Bugwema. ......................................... 34 Figure 19. Historic levels Lake Victoria (source NASA). ............................................................. 34 Figure 20. Lake levels Lake Victoria based on satellite observations (source USDA-FAS). ...... 35 Figure 21. Actual and potential evapotranspiration for Bugwema based on SEBAL remote sensing. ....................................................................................................................................... 35 Figure 22. Detailed map of the proposed irrigation scheme Isanga (Landsat False Color Composite). ................................................................................................................................. 37 Figure 23. Elevations in and around Isanga................................................................................ 38 Figure 24. Biomass production based on SEBAL Remote Sensing for Isanga. ......................... 39 Figure 25. Annual and average monthly precipitation for Isanga................................................ 40 Figure 26. Watershed delineation for Isanga. ............................................................................. 40 Figure 27. Actual and potential evapotranspiration for Isanga based on SEBAL remote sensing...................................................................................................................................................... 41 Figure 28. Detailed map of the proposed irrigation scheme Manonga (Landsat False Color Composite). ................................................................................................................................. 43 Figure 29. Elevations in and around Manonga. .......................................................................... 44 Figure 30. Biomass production based on SEBAL Remote Sensing for Manonga...................... 44 Figure 31. Annual and average monthly precipitation for Manonga. .......................................... 45 Figure 32. Watershed delineation for Manonga. ......................................................................... 46 Figure 33. Actual and potential evapotranspiration for Manonga based on SEBAL remote sensing. ....................................................................................................................................... 47 Figure 34. Detailed map of the proposed irrigation scheme Ngono (Landsat False Color Composite). ................................................................................................................................. 48 Figure 35. Elevations in and around Ngono................................................................................ 49 Figure 36. Biomass production based on SEBAL Remote Sensing for Ngono. ......................... 49
7
Figure 37. Annual and average monthly precipitation for Ngono................................................ 50 Figure 38. DEM watershed delineation for Ngono. ..................................................................... 51 Figure 39. Actual and potential evapotranspiration for Ngono based on SEBAL remote sensing...................................................................................................................................................... 52
8
1 Introduction The Nile Equatorial Lakes Subsidiary Action Program (NELSAP) through its sub basin programs implements pre-investment programs in the areas of power trade and development and natural resources management. The NELSAP in partnership with the countries carries out selected preparatory initiatives which have transboundary implications and helps the countries to mobilise resources for the investment phase for project development. The pre-investment processes include planning, data collection, surveys and feasibility studies. Pre-investment programs comprise specific studies of the various users of the water resources, formulation of options for water resources development taking in to account various intervening factors and users, identification of specific water resources developments integrating options, preliminary design of each project, cost benefit evaluation, preliminary Environmental Impact Assessment, comparative studies based on technical, socio-economical and environmental criteria, selection of priority projects and comparison with other sectoral possibilities. Within the pre-investment framework, the Efficient Water Use for Agriculture Production Project (EWUAP) in concert with the NELSAP will promote irrigation development as a contribution towards agricultural development in Tanzania. A basin irrigation program is proposed through five projects viz. Bugwema, Manonga, Isanga, Manonga and Mara Valley located within the Lake Victoria basin in Tanzania. EWUAP (Efficient Water Use for Agricultural Production), also known as the Agriculture Project, is one of the seven thematic projects of the Shared Vision Program of the Nile Basin Initiative (NBI). The overall objective of the EWUAP project is to establish a forum to assist stakeholders at regional, national and community levels to address issues related to the efficient use of water for agricultural production in the Nile Basin. The key change being fostered under the Agriculture Project is the promotion of approaches and technologies to use agricultural water more efficiently through technological innovation and policy, legislation and institutional reforms. The beneficiaries of the project include the professionals in the field of agricultural water, the policy makers and professional institutions, research centers, NGOs, and private organizations. The overall objectives of the Tanzania Lake Victoria basin irrigation project are to ensure household food security, improve farmers’ income and alleviate poverty through increase in agricultural production and productivity resulting from accessibility to irrigation water. Irrigation is a means for intensified agriculture and increased production. The program lies within Tanzania’s Vision 2025 which identifies three priority goals; ensuring basic food security, improving income levels and increasing export earnings. Agriculture is a priority sector for achieving these goals. The Agricultural Sector Development Strategy, as well as Agricultural Sector Development Programme recognize that agriculture and food security as among critical areas for poverty reduction. This is due to the fact that agriculture is the main economic activity that supports 80% of the rural poor communities. With a rapid rate of population increase and high pressure on arable land, increased food production is one of the main concerns and priorities of the government of Tanzania. Improved irrigation technology and better management have been suggested as mechanisms for increased production. One of the constraints identified is the reliance on rain fed agriculture as well as low mechanization. The irrigation schemes will therefore increase production. The Agricultural Project intends to augment agricultural extension and advisory services and make irrigation technology dissemination a local initiative for further development of the agricultural sector. The project is expected to increase the conservation and protection of natural resources
9
as many farmers will participate in the irrigation farming and conservation activities the integrated water resources management. The NELSAP together with the Directorate of Irrigation in Tanzania has developed Concept Notes for development of the basin irrigation project, comprising five schemes. Within the NELSAP, planning for water use is carried out on the basis of river basins or sub basins. On the other hand, land use is usually computed or planned according to political boundaries. This report describes a study aiming at determining the irrigation potential of the proposed schemes, considering the physical resources of 'soil' and 'water', combined with the irrigation water requirements as determined by the cropping patterns and climate. This will inform the subsequent preparation process and resource mobilization for the preparation phase. This assignment was financed through the Nile Basin Initiatives by EWUAP. Supervision has been carried out by both EWUAP and NELSAP. This report describes an expert opinion1 to aid the preparation of the five irrigation schemes of Bugwema, Manonga, Isanga, Nkona and Mara Valley, in the Tanzania part of the Lake Victoria Basin hereinafter referred to as the projects. This assignment was carried out with the participation of the Nile Equatorial Lakes Subsidiary Action program (NELSAP) as well as the Directorate of Irrigation in the Ministry of Water and Irrigation-Tanzania.
1 Experts included: dr. Peter Droogers and prof. dr. Wim Bastiaanssen
10

2 Irrigation in Tanzania
2.1 Introduction
One of the main questions mankind is confronted with is: “Is there enough water to produce food for a growing population over the next 50 years—or will we “run out” of water?” An extensive analysis, undertaken by the so called Comprehensive Assessment of Water Management in Agriculture (CA-WMA), comes with an “yes, but” answer: It is possible to produce the food—but it is probable that today’s food production and environmental trends, if continued, will lead to crises in many parts of the world. Only if we act to improve water use in agriculture will we meet the acute freshwater challenges facing humankind over the coming 50 years. It is in this spirit that the Nile Basin Initiative is working and for this specific study it will be explored whether irrigation in Tanzania, and more specifically around Lake Victoria, can support a more productive use of water resources. On global scale water scarcity is growing and Tanzania is one out of many countries confronted with water scarcity. Based on the analysis of the CA-WMA water scarcity in Tanzania can be classified as an area with “economic water scarcity” (Figure 1), which means that sufficient investments might overcome water scarcity. On a global scale food prices have been fallen over the last 40 years, while at the same time the area under irrigation have been almost doubled over the same period Figure 2. Tanzania is by far not using its estimated irrigation potential of over 2 million hectares area as only 184.000 ha is under irrigation according FAO’s AquaStat. Note that according The National Irrigation Master Plan (NIMP) the irrigation potential in Tanzania is 29.4 million hectares out of which 2.3 million hectares are high potential, 4.8 million hectares are medium potential and 22.3 million hectares are low potential. Currently only about 264,388 ha are under irrigation that is about 2% of the cultivated area according to NIMP.
Figure 1. Global water scarcity map (source: Comprehensive Assessment of Water Management in Agriculture).
11

Figure 2. Trends in food prices and irrigation expansion (source: Comprehensive Assessment of Water Management in Agriculture).
Figure 3. Population Density by Region 2002 (source: Tanzania 2002 census). Tanzania is one of the nine Nile Basin Initiative countries. Although the Nile Basin portion forms only about 9 percent of the national area, it is more significant in terms of the country’s water resources as it represents one of the more humid areas. Tanzania Agriculture is guided by Vision 2025 which identifies three priority goals; ensuring basic food security, improving income levels and increasing export earnings. The Vision goes on to recognize that agriculture as a priority sector for achieving these goals. Agricultural
12

Sector Development Strategy, as well as Agricultural Sector Development Programme recognizes that agriculture and food security as among critical areas for poverty reduction. This is due to the fact that agriculture is the main economic activity that supports 80% of the rural poor communities.
Figure 4. Population Density Lake Victoria Basin (source: NASA Earths Observatory).
2.2 National Economic and Social policy Framework1
Poverty reduction has over the past decade become an explicit objective in the Government of Tanzania (GoT) policy, perhaps most prominently exemplified by the poverty reduction strategy paper from October 2000. Increasingly, economic and social policies and support are judged against their impact on poverty reduction. The move towards developing a comprehensive policy framework for poverty reduction started in the mid 1990s and the National Poverty Eradication Strategy (NPES), of 1997, sets out a strategy for halving absolute poverty in 2010 and its complete eradication by 2025. The strategy identifies six key areas where improvements are necessary if the poverty reduction objectives are to be realized. First, economic growth will have to accelerate to at least 8% annually in order to make a serious dent in the incidence of poverty. Second, Tanzania must achieve universal primary education and increase functional literacy to 90%. Each ward should have at least one secondary school. Third, water and sanitary facilities will have to be improved so that 90% of the population has access to water within 400 meters and 50% has access to sanitation. Fourth, the status of health and nutrition must be improved; in particular malnutrition among children under 5 and access to health centers should be made easier. Fifth, the strategy also identifies the reduction of the rate of unemployment to below 10% as a main goal. Finally, the 1 Most of this section is based on the Concept Notes as prepared by the Irrigation and Technical Service Division of the Min. of Agriculture, Food Security and Cooperatives.
13

infrastructure should be improved in particular in rural areas where more and better all weather roads are needed. The government’s commitment to the NPES goals was reiterated in the Tanzania Development Vision 2025 issued in 1998. By 2025, it is envisaged that Tanzania will have graduated from its current classification of at least developed country to a middle income country, in which abject poverty is eradicated. In addition to the NPES priority areas, the Vision 2025 also emphasizes the importance of promoting good governance and the rule of law, and improving the competitiveness of the private sector. The emphasis on good governance, transparency and accountability was further enhanced with the adoption of the National Anti-corruption Strategy and Action Plan for Tanzania prepared in 1999 by the President’s Office. A two-pronged strategy is applied to reduce corruption in government business. First, institutional reforms deemed necessary in order to align pecuniary and non-pecuniary incentives for civil servants with those of a responsive and honest public sector capable of delivering quality services and goods to the citizens. Second, the strategy focuses on raising public awareness by e.g. involving the civil society in monitoring activities, the Economic and Social Research Foundation publish an Annual Report on the State Corruption in Tanzania. In year 2000, partly as an attempt to increase the accountability, transparency and predictability of external development assistance, the government launched the Tanzania Assistance Strategy (TAS). The TAS is firmly rooted in the vision 2025 and seeks to provide a framework for managing the relationship between Tanzania and its external development partners. The TAS initiative has its origin in a situation that developed in the mid 1990s when donor government relations became increasingly strained. It was subsequently agreed to reorient the relationship in ways that were more conducive to ensuring local ownership of the development process so that government priorities become decisive in aid allocation. Moreover the TAS also aims to reduce transaction costs of aid delivery by avoiding parallel donor-specific aid delivery mechanism (such as project management units), instead encouraging the adoption of sector wide approaches and direct budget support. The process of formulating and finalizing the Poverty Reduction Strategy Paper (PRSP) is generally recognized as an important step forward in mainstreaming poverty reduction into the core of public policy. The PRSP has thus become the main framework for discussion of government policies and progress with respect to poverty reduction. Moreover, it has reinforced the objectives of TAS to streamline donor support behind a single approach with the potential of reducing transaction costs. The PRSP incorporates and builds on the above-mentioned strategies, most notably the National Poverty Reduction Strategy and the Vision 2025. The process by which the PRSP was developed was far more inclusive and broad based particularly than seen previously, with comprehensive consultations with civil society organizations, rural poor, local authorities and external development partners. In addition, the PRSP itself has been translated into easily understandable Swahili (extensive using cartoons and illustrations), which has helped ensure widespread circulation in all districts. While PRSP addresses the macro level factors important to reduction of poverty, it has been criticized for failing to adequately appreciate the macro level factors that cause poverty and to outline interventions that facilitate households to escape from poverty. According to the criticism, the strategy does not break down and analyze who are the poor and the different
14
underlying factors that create poverty of these various groups. For example, factors of importance to the individual rural household include local government taxation and expenditure management, customary land allocation, and non-farm employment. Furthermore, PRSP is criticized for not addressing gender as a general cross cutting issue in poverty reduction, rather the discussion of gender issues is isolated to some specific sectors. Against the criticism, it may argue that the Rural Development Strategy (RDS), an important element of the PRS process, does attempt to address some of these factors. The final PRSP was produced in October 2000, and one year later the government presented its first Annual PRSP Progress Report. The International Monetary Fund (IMF) and the World Bank subsequently made a joint assessment of the implementation and recommended that Tanzania be granted debt service relief under the HIPC initiative. In November 2001, Tanzania was granted debt relief worth approximately US$ 3 billion in nominal value. The positive assessment leading to debt relief was based on several observations on the PRSP process and its implementation, including:
• The government has adhered to macroeconomic policies outlined in the PRSP sustaining macro-economic stability, maintaining a manageable and modest deficit, and containing inflation at below 10%. And this despite adverse international economic conditions, most notably declining commodity prices
• Tanzania has made progress on implementing structural and institutional reforms most notably in areas of government and financial management. A Medium Term Expenditure Framework has been introduced as a planning tool and on the revenue side, efforts are under way to strengthen and streamline tax collection, broadening the tax base, harmonizing and reducing the number of excise taxes and starting the operation of a unifies tax appeal system.
• Basic education, primary health care, and rural roads have all received increased budgetary allocations, partly as a result of the interim debt relief granted and funds made available from the Poverty Reduction Budget Support Fund. The increased availability of the funds has enabled the government to abolish primary school fees and initiate an expansion of basic health services. Also, the government has now started the rehabilitation and upgrading of more than 11,000 kilometers of roads in the 12 poorest regions.
The PRSP is thus the latest of a number of strategies, and though it is receiving substantial support among development partners and local stakeholders, its long term impact on poverty reduction still remains to be seen. Commitment to implementation of the strategy will be needed, from the top to the lower levels of government, where the institutional capacity is still limited.
2.3 National and Agricultural Sector Development Policies
2.3.1 Tanzania Development Vision 2025
The Tanzania Development Vision prepared in 2000, lays out the long-term development goals and perspectives. The Vision envisages that the people will be living by 2025 in a substantially developed society with a high quality of livelihood, having reached the level of a middle-income country where abject poverty will have disappeared. The economy will have been transformed from a low productivity agricultural economy to a semi-industrialized one led by modernized and
15

highly productive agricultural as well as industrial and service activities in the rural and urban areas. Consistent with this vision, Tanzania in 2025 should be a nation imbued with the five main attributes: high quality livelihood; peace, stability and unity, good governance, well educated and learning society, and competitive economy capable of producing sustainable growth and shared benefits. Food self-sufficiency and food security are articulated as the top goal of the first attribute, high quality livelihood. The development Vision puts a macro-economic growth target at 8% per annum or more, providing a macro-economic stability manifested by a low inflation economy and basic macro-economic balances.
2.3.2 Agricultural and Water Policies
Various macro-economic structural transformations and social changes have taken place since mid 1980s and this has necessitated revision of the 1983 Agricultural Policy. The new Agriculture and Livestock Policy of 1997 was thus produced to accommodate such economic changes and the roles of the government and private sector were defined. A substantial portion of functions relating to production, agro-processing and marketing of agricultural produce were entrusted to the Private Sector while the Government remained with Policy formulation, Guidelines and Regulatory functions. The Agriculture and Livestock Policy 1997 has been the core development guideline for the sector until the Agricultural Sector Development Strategy was finalized in 2001. The Policy underscores irrigation development as a key to stabilizing agricultural production. Among others, the Policy highlights development of smallholder irrigation systems based on water harvesting technology. However the policy remains silent on promotion of use of different energy sources for irrigation development. The National Irrigation Development Plan (NIDP) was formulated and adopted by the government in 1994 with the objective of contributing towards attaining food security and economic growth at all levels. The plan envisaged to implement 147 irrigation schemes and alleviation of many constraints affecting irrigation sub sector by the year 2014. However since the adoption of the NIDP, there has been a number of new government policies formulated, which had a direct effect on irrigation development. This situation created a need to revise the NIDP. As a result of that, the government under the technical and financial assistance of Government of Japan through Japan International Cooperation Agency (JICA) prepared the National Irrigation Master Plan (NIMP) in 2002 that has development objectives in line with the prevailing policies, strategies and programmes of the government, specifically Agricultural Sector Development Strategy and Agricultural Sector Development Programme. The National Water Policy produced in July 2002 recognizes the importance of water resources towards implementation of the National Poverty Reduction Strategy. The policy cites water resource as an important input for crop production and attainment of food security as well as maintenance of sound environment and riparian bio-diversity. It further stresses the need for efficient use of water resources in food crop production especially bearing in mind the diminishing nature of the resource and its increasing demand as a result of population growth. With respect to water resources allocation priorities, it is clear in the policy that drinking water has been given the highest priority among other uses. However, one thing to consider here is that, food is part of the domestic requirements. Since food is one of the greatest needs of
16

people and animals, water for irrigation, which provides food to the community, must therefore be given high priority. In the light of the above cited policies and taking into account the diminishing nature of water resources, it is imperative that the resources should be used more efficiently by encouraging use of appropriate water saving technologies like drip irrigation in crop production. Furthermore, encouragement of use of other sources of water such as lakes, ground water as well as maximizing the use of water harvesting and storage structures will ease the problem.
2.4 Agricultural Sector Development Strategy and Programme
2.4.1 Agricultural Sector Development Strategy (ASDS)
The primary objective of the ASDS was to create an enabling and cooperative environment for improving the productivity and profitability of the agricultural sector as the basis for improved farm incomes and reducing rural poverty in the medium and long-term. Various innovative and practical actions are included in the ASDS as part of its strategy. Among them is a focus that agricultural productivity and profitability are accorded high priority. Other actions include: the promotion of private sector/public sector and processor/contract grower partnerships, and the participatory implementation of the strategy through District Agricultural Development Plans (DADPs). The ASDS is intended to assist the attainment of the objectives envisaged in the Poverty Strategy Reduction Paper (PRSP). It proposes a realistic target for the overall agricultural sector to grow by 5% per year on an average over the 3-year period 2005/07.
2.4.2 Agricultural Sector Development Programme (ASDP)
After completion of the Agricultural Sector Development Strategy (ASDS), the lead ministries in the agricultural sector, namely, the Ministry of Agriculture and Food Security, Ministry of Cooperatives and Marketing and Ministry of Water and Livestock Development, decided to prepare the Agricultural Sector Development Programme (ASDP). The ASDP is a five-year rolling programme, and will be revised and updated annually, and has documented twenty-two sub-programmes for implementation. Of these, the sub-programme entitled irrigation and water management is taken up under the theme of Public and Private Roles in Improving Supporting Services, to reduce climatic risk of crop failure due to droughts and allow better crop intensities to ensure sustainable crop production and productivity. The preparation of the National Irrigation Master Plan (NIMP) is positioned as one of four priority interventions in this sub-programme.
2.5 Irrigation Development
Traditional irrigation has been practiced in the country for many years particularly in Kilimanjaro and Mbeya regions. Modern irrigation was first introduced in the country in the 1930s (NIDP, 1994) by the Tanganyika Planting Company (TPC) near Moshi town for sugar cane plantations.
17

After independence, the Government of Tanzania continued to develop irrigation projects through river diversion (river run-off schemes), as a means of stabilizing agricultural production and attaining self-food sufficiency. Some modern and traditional irrigation schemes were developed and improved during the post independence era. These comprised of schemes for smallholder farmers, parastatal owned estates for paddy and sugar cane production and privately owned plantations for tea and coffee production.
The National Irrigation Master Plan (NIMP) study was carried out from year 2000 to year 2002 under the technical and financial assistance from the Government of Japan, through Japan International Cooperation Agency (JICA). The Plan reveals that the irrigation potential in Tanzania is 29.4 million hectares out of which 2.3 million hectares are high potential, 4.8 million hectares are medium potential and 22.3 million hectares are low potential. Currently only about 264,388 ha are under irrigation that is about 2% of the cultivated area.
18
3 Methodology The methodology followed in this study to assess the irrigation potential of the five schemes is based on a so-called assimilation approach. Such an approach is becoming more and more common in hydrological data techniques and is used here to ensure the use of all available data, information, publications, local knowledge and expert judgment together. This assimilation approach was also required for this study since for some schemes more information was already available and for other schemes remote sensing and global dataset were required to be used. In this chapter a general bulleted overview of the applied methodology is provided, while in the chapters for the five schemes details and references are given.
• General background o Collecting existing information
During the field visit existing documents and data were handed over to the consultant, and evaluated on the usefulness and reliability of the information.
o Evaluating existing information Based on the existing information only information that was reliable and from a more recent date were used.
• Land suitability assessment
o Collecting existing information During the visit existing documents and data were collected and assessed on usefulness and reliability.
o Evaluating existing information Accurate information on land suitability was limited. Therefore global data sets such as SOTER, FAO soil maps and satellite information were used.
• Water resources assessment
o Building simplified rainfall-runoff model A simplified rainfall-runoff analysis was used for the schemes where this was required.
o Collecting required data Data that can be obtained from the public domain were used:
DEM land cover, land use climate data soils
o Estimating water resources Runoff was generated on a monthly base for the relevant schemes. For other schemes analysis based on lakes, reservoirs and/or groundwater were performed.
• Irrigation water requirements
o Collecting data During the visit to Tanzania existing documents and data were handed over to the consultant, who has evaluated the usefulness and reliability of the information.
o Applying CropWat
19
FAO’s CropWat approach was used for the relevant crops in the irrigation systems.
o Estimate crop water requirements Based on the developed CropWat model and associated data crop water requirements for the five schemes and the dominant crops were calculated. Emphasis was placed on crop water requirements, crop water consumption and crop water productivity, to ensure a better planning of the scarce water resource.
• Environmental considerations
o Collecting existing information Available documents were collected during the mission of the consultant to Tanzania.
o Evaluating existing information An extensive Environmental Impact Assessment (EIA) was beyond the scope of this consultancy. However, a structured simplified assessment on the most relevant environmental component was made.
• Socio-institutional aspects
o Collecting existing information Available documents were collected during the mission of the consultant to Tanzania.
o Evaluating existing information Most relevant information was collected from the Poverty Reduction Strategy Papers (PRSP) and the Millennium Development Goals . A full Poverty and Social Impact Analysis (PSIA) as set forward by the World Bank was beyond the scope of this project.
20
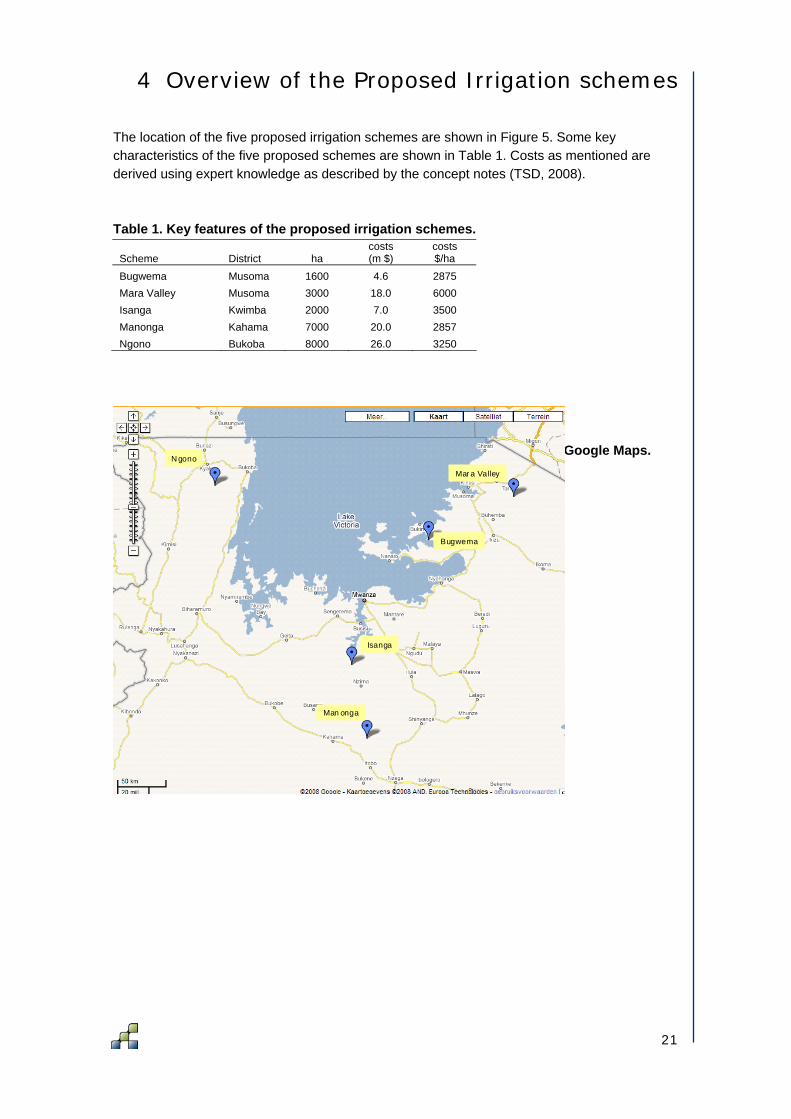
4 Overview of the Proposed Irrigation schemes The location of the five proposed irrigation schemes are shown in Figure 5. Some key characteristics of the five proposed schemes are shown in Table 1. Costs as mentioned are derived using expert knowledge as described by the concept notes (TSD, 2008). Table 1. Key features of the proposed irrigation schemes.
Scheme District ha costs (m $)
costs $/ha
Bugwema Musoma 1600 4.6 2875 Mara Valley Musoma 3000 18.0 6000 Isanga Kwimba 2000 7.0 3500 Manonga Kahama 7000 20.0 2857 Ngono Bukoba 8000 26.0 3250
Figure 5. Location of the five proposed irrigation schemes as shown in Google Maps.
N gono
Mar a Valley
Bugwema
Isanga
Man onga
21

22
5 Analysis
5.1 Mara Valley
5.1.1 Overall description
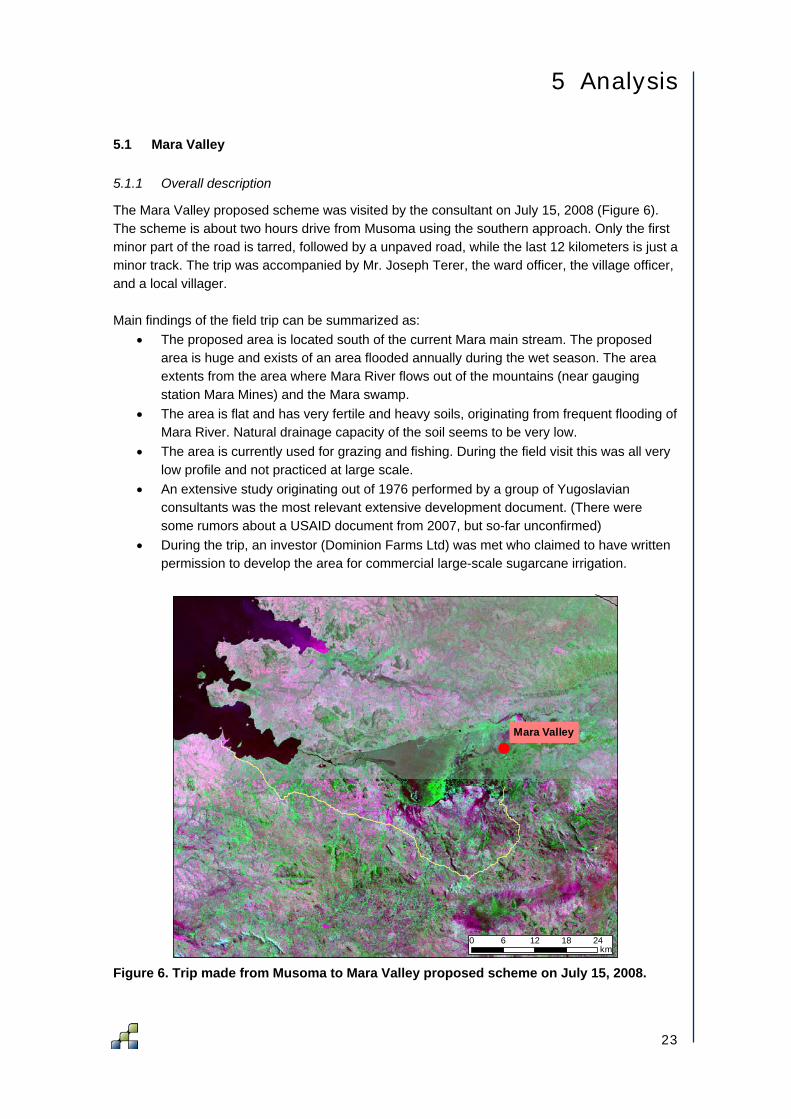
The Mara Valley proposed scheme was visited by the consultant on July 15, 2008 (Figure 6). The scheme is about two hours drive from Musoma using the southern approach. Only the first minor part of the road is tarred, followed by a unpaved road, while the last 12 kilometers is just a minor track. The trip was accompanied by Mr. Joseph Terer, the ward officer, the village officer, and a local villager. Main findings of the field trip can be summarized as:
• The proposed area is located south of the current Mara main stream. The proposed area is huge and exists of an area flooded annually during the wet season. The area extents from the area where Mara River flows out of the mountains (near gauging station Mara Mines) and the Mara swamp.
• The area is flat and has very fertile and heavy soils, originating from frequent flooding of Mara River. Natural drainage capacity of the soil seems to be very low.
• The area is currently used for grazing and fishing. During the field visit this was all very low profile and not practiced at large scale.
• An extensive study originating out of 1976 performed by a group of Yugoslavian consultants was the most relevant extensive development document. (There were some rumors about a USAID document from 2007, but so-far unconfirmed)
• During the trip, an investor (Dominion Farms Ltd) was met who claimed to have written permission to develop the area for commercial large-scale sugarcane irrigation.
Figure 6. Trip made from Musoma to Mara Valley proposed scheme on July 15, 2008.
!
Mara Valley
0 6 12 18 24km
23

Based on the field visit and discussions with various experts and local inhabitants the following preliminary conclusions can be drawn:
• The area might be suitable for further development. Water seems to be abundant available and the construction of a reservoir upstream seems to be a feasible option.
• Drainage is a serious issue for the area. It was therefore concluded that the area is mainly suitable for paddy rice cultivation.
• Accessibility is something that has to be dealt with. This can be achieved by extending the unpaved road to the proposed area. Alternatively, the northern access road can be used, although this requires a bridge to cross Mara River.
5.1.2 Land suitability
The Mara Valley is located in a very flat area with average elevations of 1150 meters above sea level (MASL) (Figure 7). The area has a very gently slope with 1170 MASL in the eastern part and 1150 MASL at the western part where the wetland starts. Distance from east to west is about 50 km so average slope is 0.0004 m m-1 (=0.04%). Soil maps and derived soil properties are shown in Figure 8 to Figure 9. Soils in the Mara Valley are defined as Fluvisoils according to the FAO classification (FAO, 1998). The formal definition for Fluvisoils are “Other soils developed from recent alluvial deposits, having no diagnostic horizons other than (unless buried by 50 cm or more new material) an ochric or an umbric A horizon, an H horizon, or a sulfuric horizon” (UNSESCO, 1974). Relatively high organic carbon contents are found in the area at a level 32 g per kg soil, corresponding to an organic matter content of 6.4% (Figure 9). Soil water holding capacity can be considered as moderate and lies between 100 and 150 mm (Figure 10). Soils are classified as moderately well drained (Figure 11), but given the low elevation compared to the surroundings, drainage might be a serious problem. Moreover, the area is located in the flood plain of the Mara river, making these drainage problems even more severe. An innovative procedure was also followed to assess the actual productivity of the lands using SEBAL products that are based on satellite observations. MODIS images for the year 2007 were obtained on an 8-days base. Figure 12 shows that the total annual biomass production for the area is over 40 ton per hectare and that productivity is equally distributed over the year. Water shortage, defined as the difference between the potential and the actual evapotranspiration, indicates also a fairly constant shortage over the year at relative low value of about 0.25 mm d-1. This indicates again that the productivity of the area is high as a result of low water shortage.
24
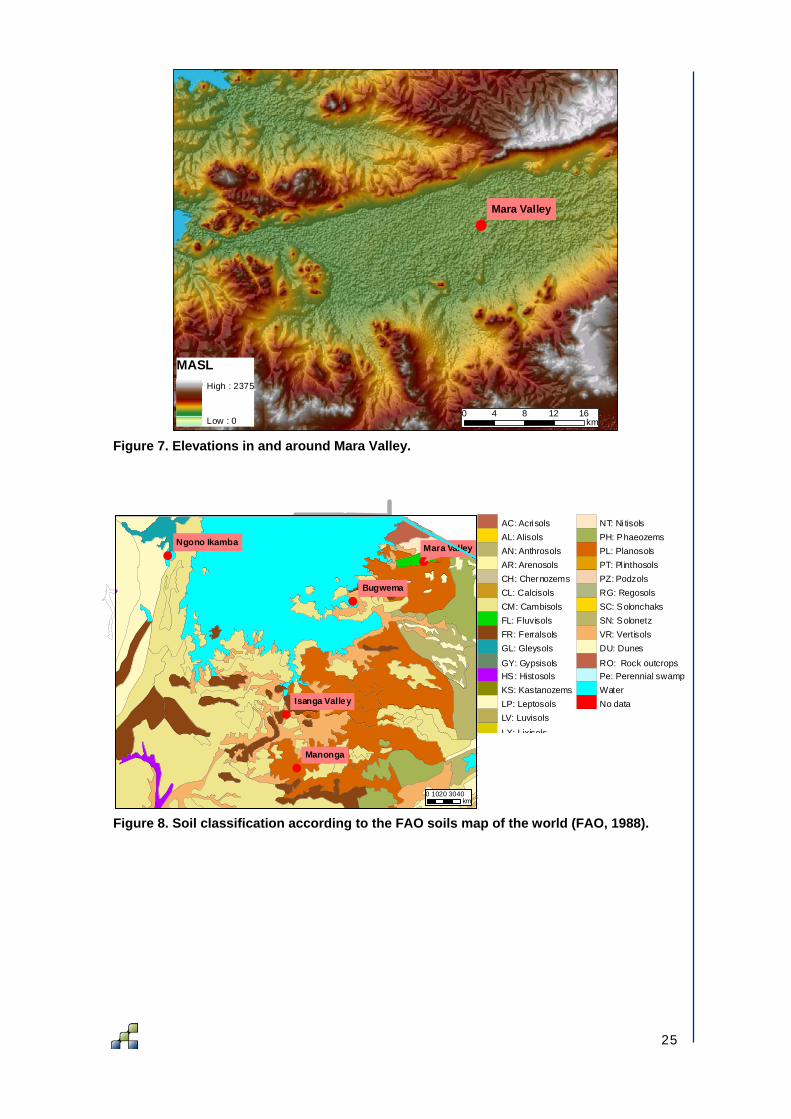
Figure 7. Elevations in and around Mara Valley.
!
!
!
!!
Manonga
Bugwema
Mara ValleyNgono Ikamba
Isanga Valley
0 1020 3040km
AC: AcrisolsAL: AlisolsAN: AnthrosolsAR: ArenosolsCH: ChernozemsCL: CalcisolsCM: CambisolsFL: FluvisolsFR: FerralsolsGL: Gleysols
GY: GypsisolsHS: HistosolsKS: KastanozemsLP: LeptosolsLV: Luvisols
LX: Lixisols
NT: Ni tisolsPH: PhaeozemsPL: PlanosolsPT: Pl inthosolsPZ: PodzolsRG: RegosolsSC: SolonchaksSN: SolonetzVR: VertisolsDU: Dunes
RO: Rock outcropsPe: Perennial swampWaterNo data
Figure 8. Soil classification according to the FAO soils map of the world (FAO, 1988).
!
Mara Valley
0 4 8 12 16km
MASLHigh : 2375
Low : 0
25

Figure 9. Organic matter, expressed in total carbon, for the top soil.
Figure 10. Soil water holding capacity for the top soil.
!
!
!
!!
Ngono Ikamba Mara Valley
Bugwema
Isanga Valley
Manonga
0 10203040km
0 - 5 (g /kg)
5 - 15
15 - 25
25 - 80
80 - 350
!
!
!
!!
Ngono IkambaMara Valley
Bugwema
Isanga Valley
Manonga
0 10203040km
1 - 5 (cm)
5 - 10
10 - 15
15 - 20
20 - 40
26
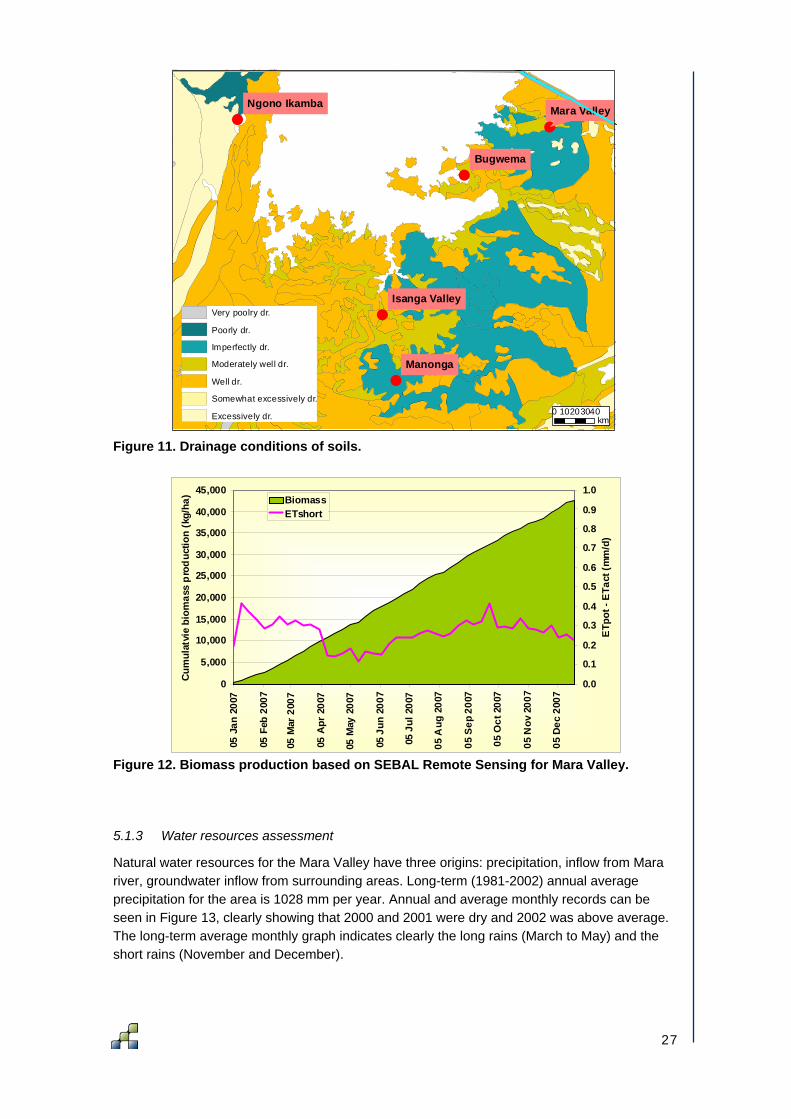
Figure 11. Drainage conditions of soils.
0
5,000
10,000
15,000
20,000
25,000
30,000
35,000
40,000
45,000
05 J
an 2
007
05 F
eb 2
007
05 M
ar 2
007
05 A
pr 2
007
05 M
ay 2
007
05 J
un 2
007
05 J
ul 2
007
05 A
ug 2
007
05 S
ep 2
007
05 O
ct 2
007
05 N
ov 2
007
05 D
ec 2
007
Cum
ulat
vie
biom
ass
pro
duc
tion
(kg/
ha)
0.0
0.1
0.2
0.3
0.4
0.5
0.6
0.7
0.8
0.9
1.0
ETp
ot -
ETa
ct (
mm
/d)
BiomassETshort
Figure 12. Biomass production based on SEBAL Remote Sensing for Mara Valley.
5.1.3 Water resources assessment
Natural water resources for the Mara Valley have three origins: precipitation, inflow from Mara river, groundwater inflow from surrounding areas. Long-term (1981-2002) annual average precipitation for the area is 1028 mm per year. Annual and average monthly records can be seen in Figure 13, clearly showing that 2000 and 2001 were dry and 2002 was above average. The long-term average monthly graph indicates clearly the long rains (March to May) and the short rains (November and December).
!
!
!
!!
Ngono Ikamba Mara Valley
Bugwema
Isanga Valley
Manonga
0 10203040km
Very poolry dr.
Poorly dr.
Imperfectly dr.
Moderately well dr.
Well dr.
Somewhat excessively dr.
Excessively dr.
27

Detailed discharge measurements from Mara River were not available. Nearest station located to the proposed irrigation area is Mara Mines, but discharge records were not available and it was mentioned that the gauging station did not function properly over the last years. However, it was reported that long-term average annual flows are 37.5 m3 s-1 (COWI, 2002). During the field trip it was noticed that water is apparently abundant available in the area. Groundwater can be considered as the third source of water for the proposed Mara Valley site. Given the location of the Mara Valley, groundwater can be considered as abundant. In summary it can be concluded that water resources for irrigation will be no limitation for the site. During the two rainy seasons sufficient rainfall is available and during the dryer periods inflow from upstream and groundwater will guarantee a reliable source.
0
200
400
600
800
1000
1200
1400
1600
1981
1982
1983
1984
1985
1986
1987
1988
1989
1990
1991
1992
1993
1994
1995
1996
1997
1998
1999
2000
2001
2002
Prec
ipita
tion
(mm
/ yr
)
0
20
40
60
80
100
120
140
160
180
200
Jan Feb Mar Apr May Jun Jul Aug Sep Oct Nov Dec
Prec
ipita
tion
(mm
/ m
onth
)
Figure 13. Annual and average monthly precipitation for Mara Valley (source: Mitchell et al., 2004).
5.1.4 Assessment of water requirements
Two different tools were used to assess the water requirements. First of all, actual water requirements for the current situation were based on the SEBAL remote sensing procedure. For the year 2007 potential and actual evapotranspiration were estimated, providing a first estimate of the water requirements of the area. It should be emphasized that these results are based on the current land cover and it’s obvious that water requirements if the area would be brought under irrigation are different.
28
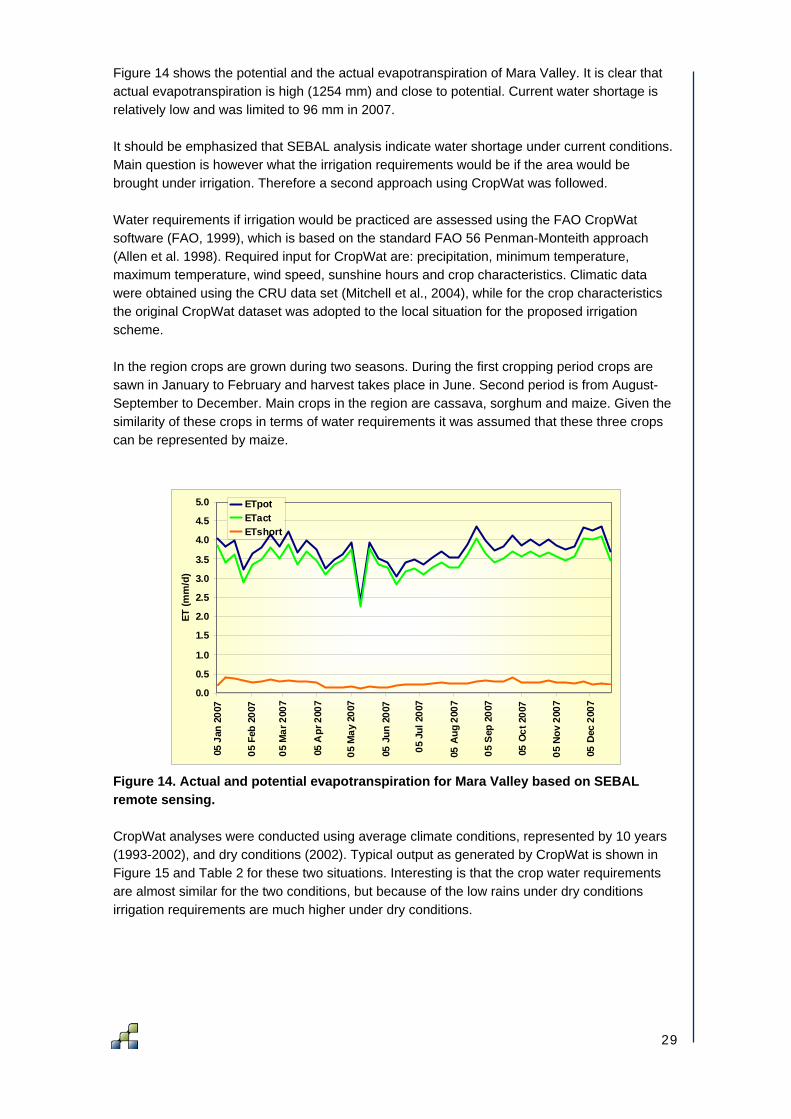
Figure 14 shows the potential and the actual evapotranspiration of Mara Valley. It is clear that actual evapotranspiration is high (1254 mm) and close to potential. Current water shortage is relatively low and was limited to 96 mm in 2007. It should be emphasized that SEBAL analysis indicate water shortage under current conditions. Main question is however what the irrigation requirements would be if the area would be brought under irrigation. Therefore a second approach using CropWat was followed. Water requirements if irrigation would be practiced are assessed using the FAO CropWat software (FAO, 1999), which is based on the standard FAO 56 Penman-Monteith approach (Allen et al. 1998). Required input for CropWat are: precipitation, minimum temperature, maximum temperature, wind speed, sunshine hours and crop characteristics. Climatic data were obtained using the CRU data set (Mitchell et al., 2004), while for the crop characteristics the original CropWat dataset was adopted to the local situation for the proposed irrigation scheme. In the region crops are grown during two seasons. During the first cropping period crops are sawn in January to February and harvest takes place in June. Second period is from August-September to December. Main crops in the region are cassava, sorghum and maize. Given the similarity of these crops in terms of water requirements it was assumed that these three crops can be represented by maize.
0.0
0.5
1.0
1.5
2.0
2.5
3.0
3.5
4.0
4.5
5.0
05 J
an 2
007
05 F
eb 2
007
05 M
ar 2
007
05 A
pr 2
007
05 M
ay 2
007
05 J
un 2
007
05 J
ul 2
007
05 A
ug 2
007
05 S
ep 2
007
05 O
ct 2
007
05 N
ov 2
007
05 D
ec 2
007
ET (m
m/d
)
ETpotETactETshort
Figure 14. Actual and potential evapotranspiration for Mara Valley based on SEBAL remote sensing. CropWat analyses were conducted using average climate conditions, represented by 10 years (1993-2002), and dry conditions (2002). Typical output as generated by CropWat is shown in Figure 15 and Table 2 for these two situations. Interesting is that the crop water requirements are almost similar for the two conditions, but because of the low rains under dry conditions irrigation requirements are much higher under dry conditions.
29
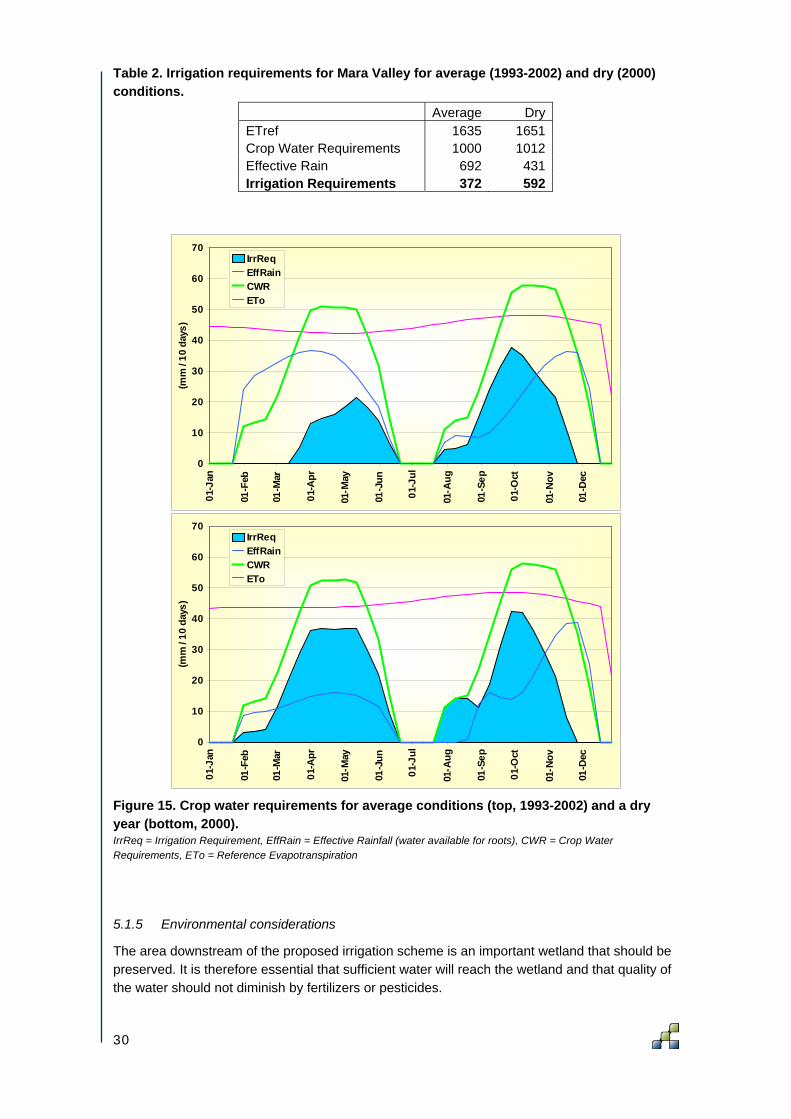
Table 2. Irrigation requirements for Mara Valley for average (1993-2002) and dry (2000) conditions.
Average DryETref 1635 1651Crop Water Requirements 1000 1012Effective Rain 692 431Irrigation Requirements 372 592
0
10
20
30
40
50
60
70
01-J
an
01-F
eb
01-M
ar
01-A
pr
01-M
ay
01-J
un
01-J
ul
01-A
ug
01-S
ep
01-O
ct
01-N
ov
01-D
ec
(mm
/ 10
day
s)
IrrReqEffRainCWRETo
0
10
20
30
40
50
60
70
01-J
an
01-F
eb
01-M
ar
01-A
pr
01-M
ay
01-J
un
01-J
ul
01-A
ug
01-S
ep
01-O
ct
01-N
ov
01-D
ec
(mm
/ 10
day
s)
IrrReqEffRainCWRETo
Figure 15. Crop water requirements for average conditions (top, 1993-2002) and a dry year (bottom, 2000). IrrReq = Irrigation Requirement, EffRain = Effective Rainfall (water available for roots), CWR = Crop Water Requirements, ETo = Reference Evapotranspiration
5.1.5 Environmental considerations
The area downstream of the proposed irrigation scheme is an important wetland that should be preserved. It is therefore essential that sufficient water will reach the wetland and that quality of the water should not diminish by fertilizers or pesticides.
30
The proposed scheme itself is currently an important area for animals in general and especially for fishes and birds to forage. Further investigations are required to what extent these animals would be affected if the area would be converted to an irrigation area.
5.1.6 Institutional and legal framework
The overall institutional and legal framework of Tanzania has been discussed in an earlier chapter. For the Mara Valley proposed scheme the institutional and legal context is very positive, given the special attention the area receives from various sources. First of all, the region is close to the Serengeti and the Masai Mara national parks. Secondly, Mara Basin is one of the 12 projects1 under the NBI-NELSAP (Nile Equatorial Lakes Subsidiary Action program's) investment program.
5.1.7 Main findings
Based on existing documents, information obtained during the field visit, data gathering and various analyses as described before, a quantitative valuation system has been set up. The system considers five key decision topics each scoring from -2 (negative) to +2 (positive). Note that these scores should be considered as relative values compared to the other proposed schemes. These scores are subsequently used in the last chapter to support the ranking process using the so-called ScoreCard method. For Mara Valley the following valuation can be concluded:
• Food production: 2 o The area is very productive and water resources are abundant.
• Environment: -2 o There are concerns that the current environmental value of the proposed
scheme might be lost. Also the downstream wetland might be negatively influenced by an irrigation system.
• Vulnerable people: 0 o The area is specific suitable for sugarcane since drainage is a threat to the
area. Since sugarcane is a commercial crop, impact on the most vulnerable people might be therefore relatively. On the other hand is water abundant available, without expensive operational costs.
• Institutional support: 2 o Mara valley gets enormous institutional support to develop further.
• Economic viability: 2 o Water is plenty available so no need for expensive development. Area is very
productive.
1 Official project name: “Development of a Framework for Cooperative Management of the Water Resources of the Mara River Basin”.
31
5.2 Bugwema
5.2.1 Overall description
Bugwema proposed scheme is located just west of the village of Bugwema in the Musoma district within the Mara region. The size of the proposed scheme is about 1600 ha and can be considered as a renewable of an earlier started activity in 1974-1976. A field trip was undertaken on July 16, 2008 by the consultant and Mr. Sai Jumambina from the Min. of Water and Irrigation, Zonal Irrigation Unit, Musoma Office. During the field visit the following points were noticed:
• In 1972 construction works started for a 2000 ha irrigation scheme, using water from Lake Victoria. A total of 6 pumping stations, operating in series, were planned. In 1974 the construction stopped as new economic analysis revealed that the system was not viable. The system was than hand over to the Production Unit of the Militaries. The system is still under their control and guarded continuously by a group of soldiers.
• The main canal is still in good shape for about the first 1 to 2 km. The first pump house was completed and two pumps are still in place, but properly in too poor shape to reuse. One secondary canal is completed and was tested in 1976. This canal is still in reasonable shape.
5.2.2 Land suitability
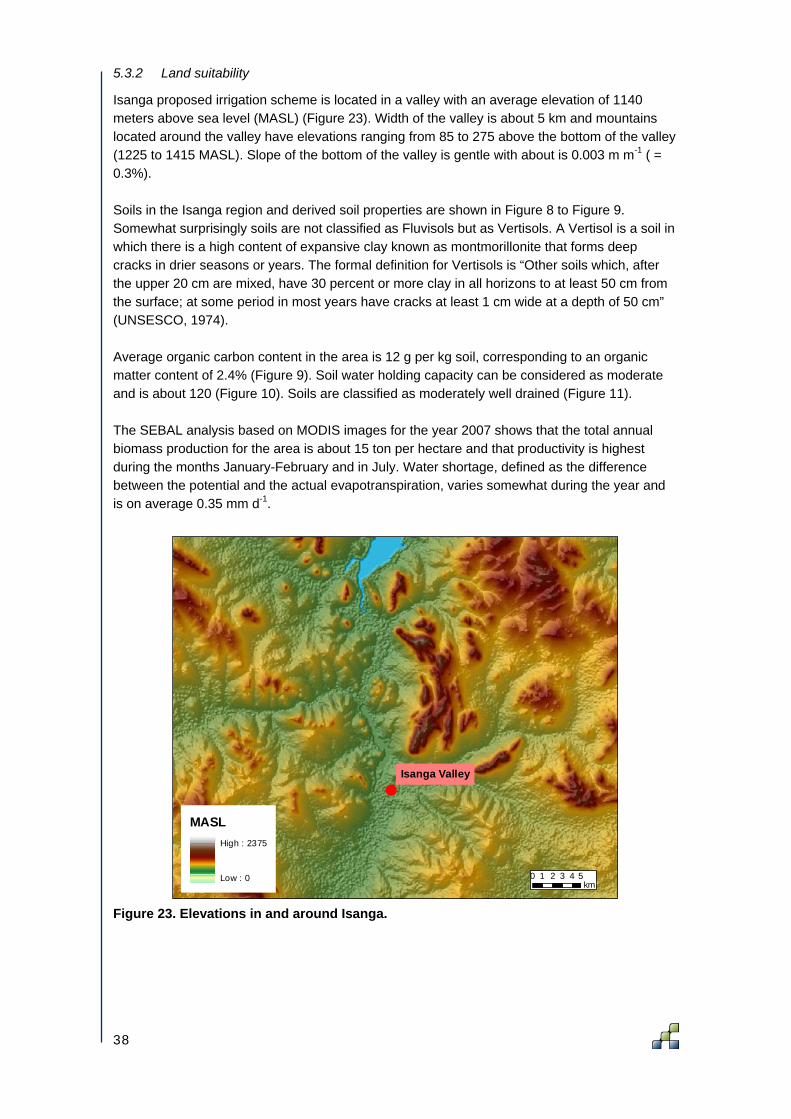
The proposed Bugwema irrigation scheme is located in a relatively flat area with elevations between 1140 and 1150 meters above sea level (MASL) (Figure 16). Water from Lake Victoria (level at about 1134 MASL) was in the original plan scheduled to be pumped through a main canal to an initial level of about 1145 MASL followed by a gradual pumping to a final level of 1155 MASL using five pumping stations. Length of the main canal is about 5 km so average slope is 0.002 m m-1 ( = 0.2%). From this main canal gravity irrigation could be performed to the fields located about 2 to 5 meters below the main canal. Soil maps and derived soil properties are shown in Figure 8 to Figure 9. Soils in the Bugwema area are defined as Vertisols (eutri-pellic Vertisols). A Vertisol is a soil in which there is a high content of expansive clay known as montmorillonite that forms deep cracks in drier seasons or years. The formal definition for Vertisols is “Other soils which, after the upper 20 cm are mixed, have 30 percent or more clay in all horizons to at least 50 cm from the surface; at some period in most years have cracks at least 1 cm wide at a depth of 50 cm” (UNSESCO, 1974). Average organic carbon content in the area is 12 g per kg soil, corresponding to an organic matter content of 2.4% (Figure 9). Soil water holding capacity can be considered as moderate and is about 120 (Figure 10). Soils are classified as moderately well drained (Figure 11). Actual productivity of the lands using SEBAL over the year 2007 were obtained on an 8-days base. Figure 12 shows that the total annual biomass production for the area is less than 20 ton per hectare and that productivity is highest during the months January to May with levels up to 80-100 kg ha-1 d-1. Water shortage, defined as the difference between the potential and the actual evapotranspiration, indicates also a fairly constant shortage over the year at relative low value of about 0.5 mm d-1.
32
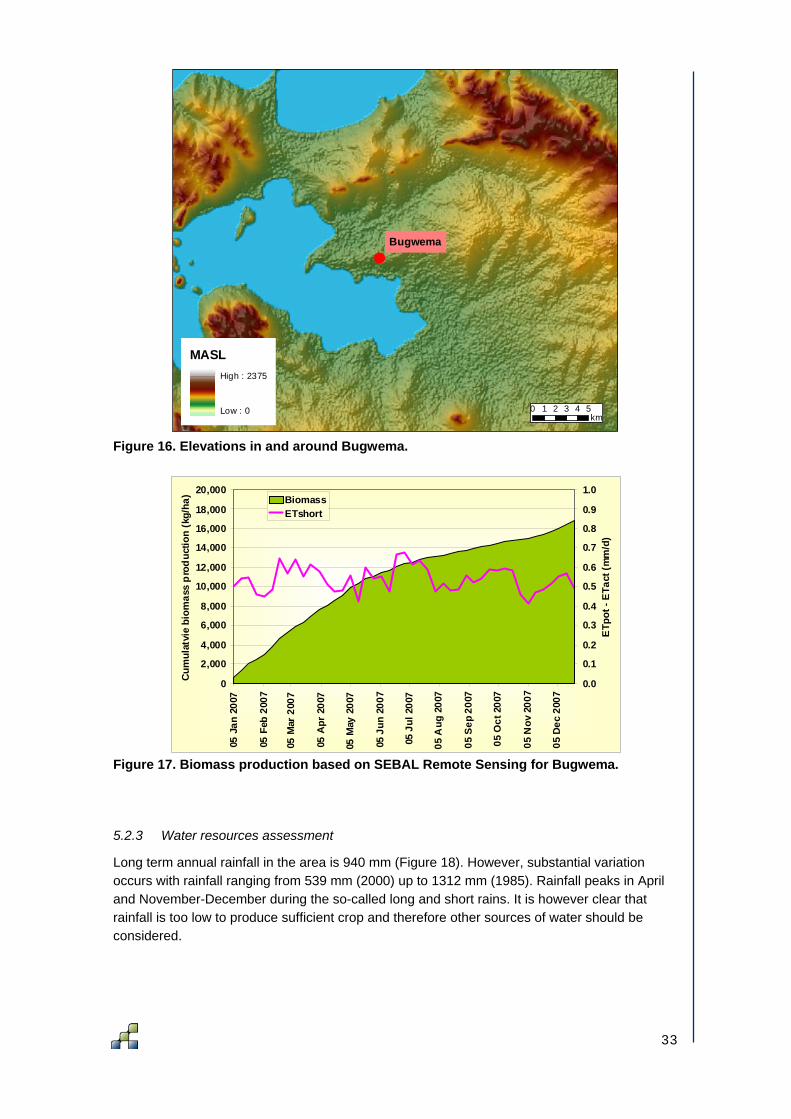
Figure 16. Elevations in and around Bugwema.
0
2,000
4,000
6,000
8,000
10,000
12,000
14,000
16,000
18,000
20,000
05 J
an 2
007
05 F
eb 2
007
05 M
ar 2
007
05 A
pr 2
007
05 M
ay 2
007
05 J
un 2
007
05 J
ul 2
007
05 A
ug 2
007
05 S
ep 2
007
05 O
ct 2
007
05 N
ov 2
007
05 D
ec 2
007
Cum
ulat
vie
biom
ass
pro
duc
tion
(kg/
ha)
0.0
0.1
0.2
0.3
0.4
0.5
0.6
0.7
0.8
0.9
1.0
ETp
ot -
ETa
ct (
mm
/d)
BiomassETshort
Figure 17. Biomass production based on SEBAL Remote Sensing for Bugwema.
5.2.3 Water resources assessment
Long term annual rainfall in the area is 940 mm (Figure 18). However, substantial variation occurs with rainfall ranging from 539 mm (2000) up to 1312 mm (1985). Rainfall peaks in April and November-December during the so-called long and short rains. It is however clear that rainfall is too low to produce sufficient crop and therefore other sources of water should be considered.
!
Bugwema
0 1 2 3 4 5km
MASLHigh : 2375
Low : 0
33

Given the location of the Bugwema proposed scheme the most obvious source of water would be Lake Victoria. There is however a growing concern that lake levels have been falling rapidly during the last few years (Figure 19). However, most recent information obtained from the USDA-FAS (United States Department of Agriculture – Foreign Agricultural Service) indicates that lake levels are on the rise again (Figure 20). Given the small amount of water that would be extracted for the proposed scheme compared to total water in Lake Victoria environmental concerns will be very low in this respect. In summary the water resource for the Bugwema scheme would be virtually unlimited. The only concern is that water has to be pumped about 10 m above lake level, which will enhance costs of irrigation substantially.
0
250
500
750
1000
1250
1500
1981
1982
1983
1984
1985
1986
1987
1988
1989
1990
1991
1992
1993
1994
1995
1996
1997
1998
1999
2000
2001
2002
Prec
ipita
tion
(mm
/ yr
)
0
25
50
75
100
125
150
175
200
Jan Feb Mar Apr May Jun Jul Aug Sep Oct Nov Dec
Prec
ipita
tion
(mm
/ m
onth
)
Figure 18. Annual and average monthly precipitation for Bugwema.
Figure 19. Historic levels Lake Victoria (source NASA).
34

Figure 20. Lake levels Lake Victoria based on satellite observations (source USDA-FAS).
0.0
0.5
1.0
1.5
2.0
2.5
3.0
3.5
4.0
4.5
5.0
05 J
an 2
007
05 F
eb 2
007
05 M
ar 2
007
05 A
pr 2
007
05 M
ay 2
007
05 J
un 2
007
05 J
ul 2
007
05 A
ug 2
007
05 S
ep 2
007
05 O
ct 2
007
05 N
ov 2
007
05 D
ec 2
007
ET (m
m/d
)
ETpotETactETshort
Figure 21. Actual and potential evapotranspiration for Bugwema based on SEBAL remote sensing.
5.2.4 Assessment of water requirements
Current water requirements for Bugwema, based on the SEBAL analysis as explained in previous sections, are shown in Figure 21. Potential evapotranspiration in the area is low because of the low vegetation density. Even this low demand could not be fulfilled and actual evapotranspiration is even lower. Total water shortage under the current conditions is almost 200 mm for the year 2007. Analysis using the FAO CropWat approach as explained in the previous section were undertaken for average and dry conditions. Table 3 reveals that under average conditions about 400 mm annual is required to irrigate two crops completely. Under dry conditions this would go up to about 600 mm. Considering that the proposed scheme will be 2000 ha a total of 8 million to 12 million m3 of water should be abstracted from Lake Victoria.
35

Table 3. Irrigation requirements for Bugwema for average (1993-2002) and dry (2000) conditions.
Average DryETref 1587 1603Crop Water Requirements 970 982Effective Rain 632 388Irrigation Requirements 398 603
5.2.5 Environmental considerations
The area has no specific environmental considerations rather than that drainage water from the area flows directly in Lake Victoria. This implies that if irrigation would be practiced quality of the water should be controlled strictly. Another environmental concern might be that the water required for irrigation would be pumped directly out of Lake Victoria. A rough estimate, based on the previous section “water requirements” assuming that about 500 mm of water would be pumped for the 2000 ha, a total of 10 million m3 of water would be extracted from the lake. However, compared to documented total inflows into the lake (e.g. 22,983 MCM by Piper et al., 1986 and 24,535 MCM by COWI, 2002) and total rainfall over the lake (115,000 MCM as reported by COWI, 2002) this additional abstraction can be considered as negligible.
5.2.6 Institutional and legal framework
The Bugwema proposed scheme is in terms of institutional and legal framework very favorable. The first attempt to develop the irrigation scheme dates back to the 1970s. Development was stopped but there is still interest to restart the project. Part of the infrastructure is already in place and the area is currently under protection of the Production Unit of the Army who might be very supportive in developing the area to a productive irrigation system. Further exploration with responsible entities would be advisable.
5.2.7 Main findings
Based on existing documents, information obtained during the field visit, data gathering and various analyses as described before, a quantitative valuation system has been set up. The system considers five key decision topics each scoring from -2 (negative) to +2 (positive). Note that these scores should be considered as relative values compared to the other proposed schemes. These scores are subsequently used in the last chapter to support the ranking process using the so-called ScoreCard method. For Bugwema the following valuation can be concluded:
• Food production: -2 o The area is not very productive according to SEBAL and water requirements
are very high. • Environment: 2
o No concerns.
36

• Vulnerable people: -2 o Irrigation based on expensive and large-scale pumping.
• Institutional support: 2 o It is very likely that institutional support will be very high given the fact that the
area is still seen as important and still guarded by the military. • Economic viability: -1
o Water is no limitation, but very costly to pump. Infrastructure is lacking and distance to market is high.
5.3 Isanga
5.3.1 Overall description
The proposed irrigation scheme Isanga is located in Misungwi district in the Mwanza region. The area is about 80 km south of Lake Victoria, but a small part of the lake of about 5 km width is close to the proposed location. According to an FAO inventory in 1990 is the potential of irrigation in the Isanga valley about 2,000 ha (FAO, 1990). The same number was confirmed by the report “Tanzania draft report on the rapid baseline assessment” (EWUAP, 2006) The National Irrigation Master PIan (Volume II) indicates that there is a potential to develop water harvesting at 600 ha of which 200 ha is very suitable (NIMP 2002).
Figure 22. Detailed map of the proposed irrigation scheme Isanga (Landsat False Color Composite).
!
!
!
Sisu
Guwalu
Itambu
Mabogo
Mhango
Kitongo
Mahando
Manyero
Bungulwa
Luanungu
Ndagwasa
Mwanatumba
Mwanghanda
Isanga River
Mashigambiti
Sisu Forest Reserve
Isanga Valley
0 1 2 3 4 5km
37
5.3.2 Land suitability
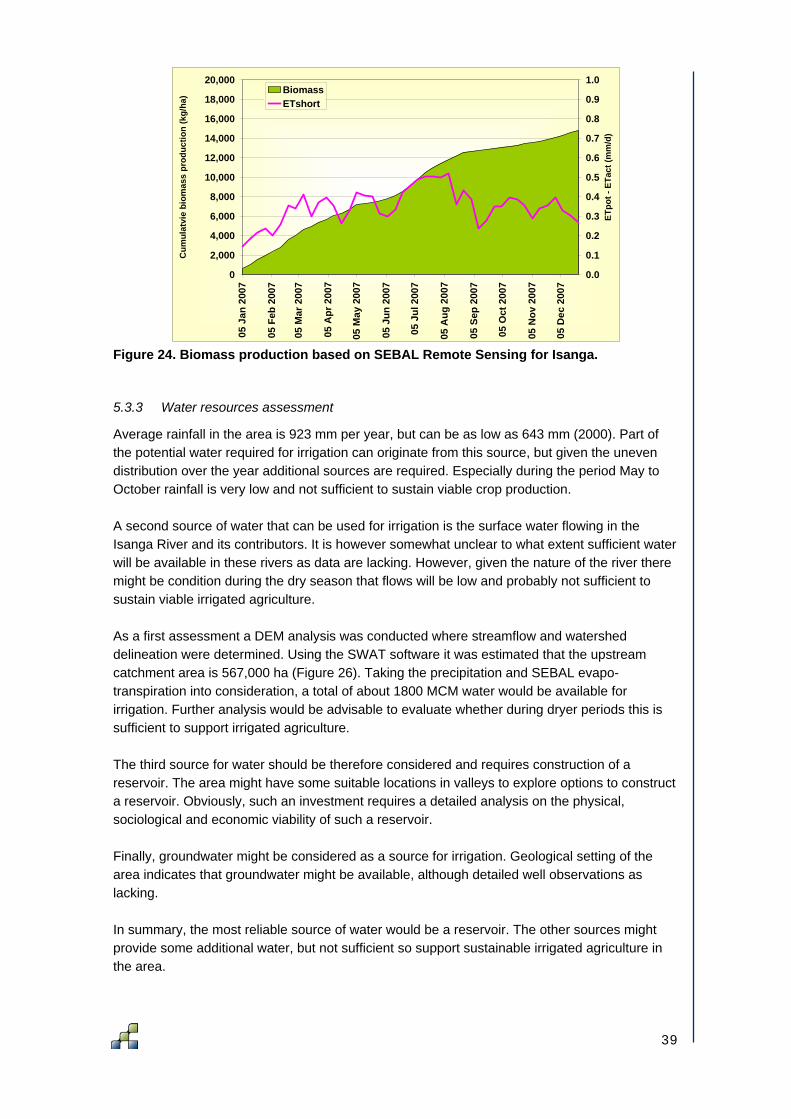
Isanga proposed irrigation scheme is located in a valley with an average elevation of 1140 meters above sea level (MASL) (Figure 23). Width of the valley is about 5 km and mountains located around the valley have elevations ranging from 85 to 275 above the bottom of the valley (1225 to 1415 MASL). Slope of the bottom of the valley is gentle with about is 0.003 m m-1 ( = 0.3%). Soils in the Isanga region and derived soil properties are shown in Figure 8 to Figure 9. Somewhat surprisingly soils are not classified as Fluvisols but as Vertisols. A Vertisol is a soil in which there is a high content of expansive clay known as montmorillonite that forms deep cracks in drier seasons or years. The formal definition for Vertisols is “Other soils which, after the upper 20 cm are mixed, have 30 percent or more clay in all horizons to at least 50 cm from the surface; at some period in most years have cracks at least 1 cm wide at a depth of 50 cm” (UNSESCO, 1974). Average organic carbon content in the area is 12 g per kg soil, corresponding to an organic matter content of 2.4% (Figure 9). Soil water holding capacity can be considered as moderate and is about 120 (Figure 10). Soils are classified as moderately well drained (Figure 11). The SEBAL analysis based on MODIS images for the year 2007 shows that the total annual biomass production for the area is about 15 ton per hectare and that productivity is highest during the months January-February and in July. Water shortage, defined as the difference between the potential and the actual evapotranspiration, varies somewhat during the year and is on average 0.35 mm d-1.
Figure 23. Elevations in and around Isanga.
!
Isanga Valley
0 1 2 3 4 5km
MASLHigh : 2375
Low : 0
38
0
2,000
4,000
6,000
8,000
10,000
12,000
14,000
16,000
18,000
20,000
05 J
an 2
007
05 F
eb 2
007
05 M
ar 2
007
05 A
pr 2
007
05 M
ay 2
007
05 J
un 2
007
05 J
ul 2
007
05 A
ug 2
007
05 S
ep 2
007
05 O
ct 2
007
05 N
ov 2
007
05 D
ec 2
007
Cum
ulat
vie
biom
ass
prod
uctio
n (k
g/ha
)
0.0
0.1
0.2
0.3
0.4
0.5
0.6
0.7
0.8
0.9
1.0
ETpo
t - E
Tact
(mm
/d)
BiomassETshort
Figure 24. Biomass production based on SEBAL Remote Sensing for Isanga.
5.3.3 Water resources assessment
Average rainfall in the area is 923 mm per year, but can be as low as 643 mm (2000). Part of the potential water required for irrigation can originate from this source, but given the uneven distribution over the year additional sources are required. Especially during the period May to October rainfall is very low and not sufficient to sustain viable crop production. A second source of water that can be used for irrigation is the surface water flowing in the Isanga River and its contributors. It is however somewhat unclear to what extent sufficient water will be available in these rivers as data are lacking. However, given the nature of the river there might be condition during the dry season that flows will be low and probably not sufficient to sustain viable irrigated agriculture. As a first assessment a DEM analysis was conducted where streamflow and watershed delineation were determined. Using the SWAT software it was estimated that the upstream catchment area is 567,000 ha (Figure 26). Taking the precipitation and SEBAL evapo-transpiration into consideration, a total of about 1800 MCM water would be available for irrigation. Further analysis would be advisable to evaluate whether during dryer periods this is sufficient to support irrigated agriculture. The third source for water should be therefore considered and requires construction of a reservoir. The area might have some suitable locations in valleys to explore options to construct a reservoir. Obviously, such an investment requires a detailed analysis on the physical, sociological and economic viability of such a reservoir. Finally, groundwater might be considered as a source for irrigation. Geological setting of the area indicates that groundwater might be available, although detailed well observations as lacking. In summary, the most reliable source of water would be a reservoir. The other sources might provide some additional water, but not sufficient so support sustainable irrigated agriculture in the area.
39

0
250
500
750
1000
1250
1500
1981
1982
1983
1984
1985
1986
1987
1988
1989
1990
1991
1992
1993
1994
1995
1996
1997
1998
1999
2000
2001
2002
Prec
ipita
tion
(mm
/ yr
)
0
25
50
75
100
125
150
175
200
Jan Feb Mar Apr May Jun Jul Aug Sep Oct Nov Dec
Prec
ipita
tion
(mm
/ m
onth
)
Figure 25. Annual and average monthly precipitation for Isanga.
Figure 26. Watershed delineation for Isanga.
!
!
Isanga Valley
Manonga
0 10 20 30 40 50km
40
5.3.4 Assessment of water requirements
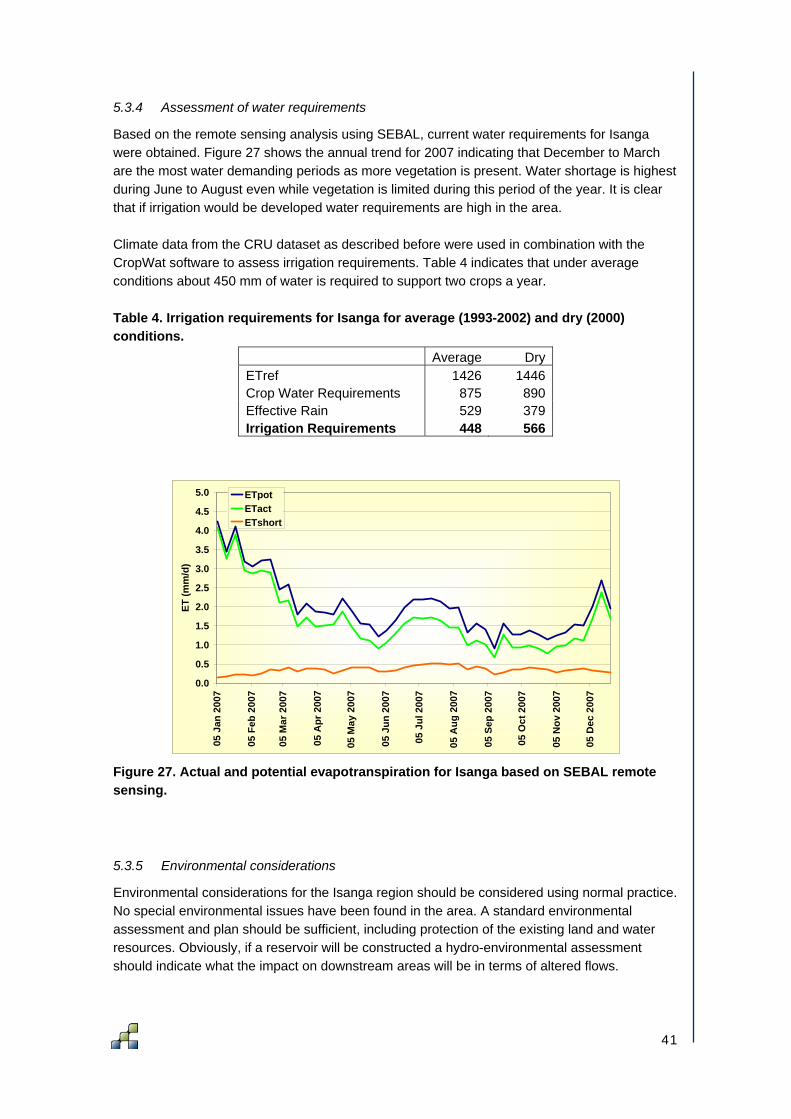
Based on the remote sensing analysis using SEBAL, current water requirements for Isanga were obtained. Figure 27 shows the annual trend for 2007 indicating that December to March are the most water demanding periods as more vegetation is present. Water shortage is highest during June to August even while vegetation is limited during this period of the year. It is clear that if irrigation would be developed water requirements are high in the area. Climate data from the CRU dataset as described before were used in combination with the CropWat software to assess irrigation requirements. Table 4 indicates that under average conditions about 450 mm of water is required to support two crops a year. Table 4. Irrigation requirements for Isanga for average (1993-2002) and dry (2000) conditions.
Average DryETref 1426 1446Crop Water Requirements 875 890Effective Rain 529 379Irrigation Requirements 448 566
0.0
0.5
1.0
1.5
2.0
2.5
3.0
3.5
4.0
4.5
5.0
05 J
an 2
007
05 F
eb 2
007
05 M
ar 2
007
05 A
pr 2
007
05 M
ay 2
007
05 J
un 2
007
05 J
ul 2
007
05 A
ug 2
007
05 S
ep 2
007
05 O
ct 2
007
05 N
ov 2
007
05 D
ec 2
007
ET (m
m/d
)
ETpotETactETshort
Figure 27. Actual and potential evapotranspiration for Isanga based on SEBAL remote sensing.
5.3.5 Environmental considerations
Environmental considerations for the Isanga region should be considered using normal practice. No special environmental issues have been found in the area. A standard environmental assessment and plan should be sufficient, including protection of the existing land and water resources. Obviously, if a reservoir will be constructed a hydro-environmental assessment should indicate what the impact on downstream areas will be in terms of altered flows.
41
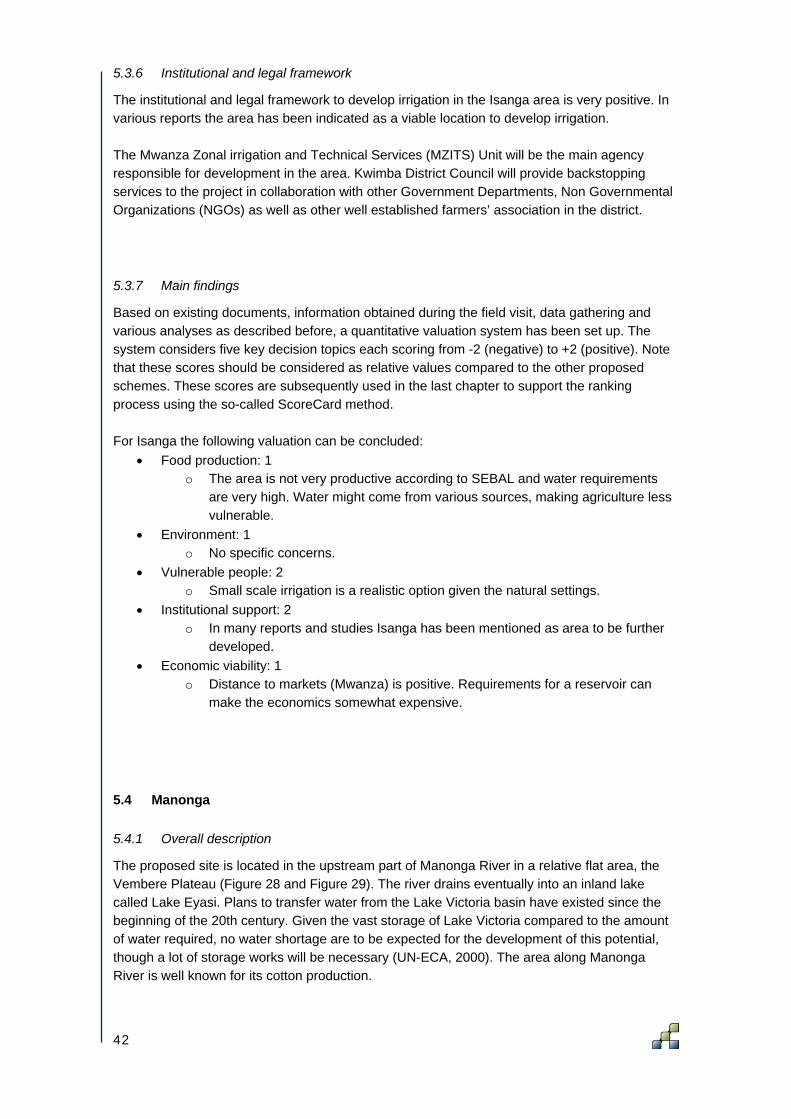
5.3.6 Institutional and legal framework
The institutional and legal framework to develop irrigation in the Isanga area is very positive. In various reports the area has been indicated as a viable location to develop irrigation. The Mwanza Zonal irrigation and Technical Services (MZITS) Unit will be the main agency responsible for development in the area. Kwimba District Council will provide backstopping services to the project in collaboration with other Government Departments, Non Governmental Organizations (NGOs) as well as other well established farmers’ association in the district.
5.3.7 Main findings
Based on existing documents, information obtained during the field visit, data gathering and various analyses as described before, a quantitative valuation system has been set up. The system considers five key decision topics each scoring from -2 (negative) to +2 (positive). Note that these scores should be considered as relative values compared to the other proposed schemes. These scores are subsequently used in the last chapter to support the ranking process using the so-called ScoreCard method. For Isanga the following valuation can be concluded:
• Food production: 1 o The area is not very productive according to SEBAL and water requirements
are very high. Water might come from various sources, making agriculture less vulnerable.
• Environment: 1 o No specific concerns.
• Vulnerable people: 2 o Small scale irrigation is a realistic option given the natural settings.
• Institutional support: 2 o In many reports and studies Isanga has been mentioned as area to be further
developed. • Economic viability: 1
o Distance to markets (Mwanza) is positive. Requirements for a reservoir can make the economics somewhat expensive.
5.4 Manonga
5.4.1 Overall description
The proposed site is located in the upstream part of Manonga River in a relative flat area, the Vembere Plateau (Figure 28 and Figure 29). The river drains eventually into an inland lake called Lake Eyasi. Plans to transfer water from the Lake Victoria basin have existed since the beginning of the 20th century. Given the vast storage of Lake Victoria compared to the amount of water required, no water shortage are to be expected for the development of this potential, though a lot of storage works will be necessary (UN-ECA, 2000). The area along Manonga River is well known for its cotton production.
42

Figure 28. Detailed map of the proposed irrigation scheme Manonga (Landsat False Color Composite).
5.4.2 Land suitability
The proposed irrigation scheme in Manonga is located in an area with an average elevation of 1160 meters above sea level (MASL) (Figure 29). The area has some local hills with maximum elevation of about 1300 MASL. Soils in the Manonga region and derived soil properties are shown in Figure 8 to Figure 9. Soils are classified as Planosols (calci-hyposodic Planosols). Plansols are defined as “Other soils having an albic E horizon overlying a slowly permeable horizon (for example, an argillic or natric B horizon showing an abrupt textural change, a heavy clay, a fragipan) within 125 cm of the surface; showing hydromorphic properties”. (UNSESCO, 1974). Average organic carbon content in the area is low at 8 g per kg soil, corresponding to an organic matter content of 1.6% (Figure 9). Soil water holding capacity can be considered as relatively high at 180 mm (Figure 10). Soils are classified as imperfectly drained (Figure 11). The SEBAL analysis based on MODIS images for the year 2007 shows that the total annual biomass production for the area is about 18 ton per hectare. Variation within a year is relatively low, but slightly higher in January to March and in December. Water shortage, defined as the difference between the potential and the actual evapotranspiration, varies between 0.2 and 0.4 mm d-1.
!
Manonga
0 1 2 3 4 5km
43

Figure 29. Elevations in and around Manonga.
0
2,000
4,000
6,000
8,000
10,000
12,000
14,000
16,000
18,000
20,000
05 J
an 2
007
05 F
eb 2
007
05 M
ar 2
007
05 A
pr 2
007
05 M
ay 2
007
05 J
un 2
007
05 J
ul 2
007
05 A
ug 2
007
05 S
ep 2
007
05 O
ct 2
007
05 N
ov 2
007
05 D
ec 2
007
Cum
ulat
vie
biom
ass
prod
uctio
n (k
g/ha
)
0.0
0.1
0.2
0.3
0.4
0.5
0.6
0.7
0.8
0.9
1.0
ETpo
t - E
Tact
(mm
/d)
BiomassETshort
Figure 30. Biomass production based on SEBAL Remote Sensing for Manonga.
5.4.3 Water resources assessment
Rainfall in the area is 956 mm per year and ranges from 683 mm in 2000 up to 1239 in 1997. Part of the potential water required for irrigation can originate from this source, but given the uneven distribution over the year additional sources are required. Especially during the period June to September rainfall is very low and not sufficient to sustain viable crop production.
!
Manonga
0 1 2 3 4 5km
MASLHigh : 2375
Low : 0
44

Water from the Manonga River will not be sufficient, especially since the proposed scheme is located upstream in the basin. The geological setting is probably also not favorable for extensive groundwater pumping. Based on DEM delineation this total upstream area can be assessed. A detailed streamflow network and upstream watershed area has been determined using the AVSWAT software (threshold value 2000 ha). Total upstream area is 80,862 ha (Figure 32). Taking into consideration the average rainfall and the actual evapotranspiration of SEBAL some 200 MCM would be available from streamflow. However, in dry years and in dryer months hardly any streamflow would be available to sustain irrigated agriculture. An important source of water would therefore be Lake Victoria combined with reservoir storage. However, Lake Victoria is quite a distance from the area and would require substantial investments combined with high operational costs for pumping and maintenance.
0
250
500
750
1000
1250
1500
1981
1982
1983
1984
1985
1986
1987
1988
1989
1990
1991
1992
1993
1994
1995
1996
1997
1998
1999
2000
2001
2002
Prec
ipita
tion
(mm
/ yr
)
0
25
50
75
100
125
150
175
200
Jan Feb Mar Apr May Jun Jul Aug Sep Oct Nov Dec
Prec
ipita
tion
(mm
/ m
onth
)
Figure 31. Annual and average monthly precipitation for Manonga.
45

Figure 32. Watershed delineation for Manonga.
5.4.4 Assessment of water requirements
Water requirements for Manonga in 2007 were obtained using the SEBAL remote sensing technique (Figure 33). There is a clear trend indicating that December to March are the most water demanding periods as more vegetation is present. Water shortage is highest during June to August even while vegetation is limited during this period of the year. It is clear that if irrigation would be developed water requirements are high in the area. For the year 2007 total water shortage for the current vegetation is 131 mm, which would increase substantial if irrigated agriculture will be practiced in the area. SEBAL analysis indicate water shortage under current conditions. Main question is however what the water requirements would be if irrigation will be introduced in the Manonga area. CropWat, as explained in previous sections, was used for this. Table 5 shows that for average conditions 530 mm and for dry conditions around 650 mm annually would be required. This means that on average about 0.4 m3 s-1 is required. However, there are peak requirements that go up to 6 mm d-1 which is similar to 1.4 m3 s-1. Table 5. Irrigation requirements for Manonga Valley for average (1993-2002) and dry (2000) conditions.
Average DryETref 1558 1578Crop Water Requirements 957 972Effective Rain 532 387Irrigation Requirements 532 646
!
Manonga
0 4 8 12 16 20km
46
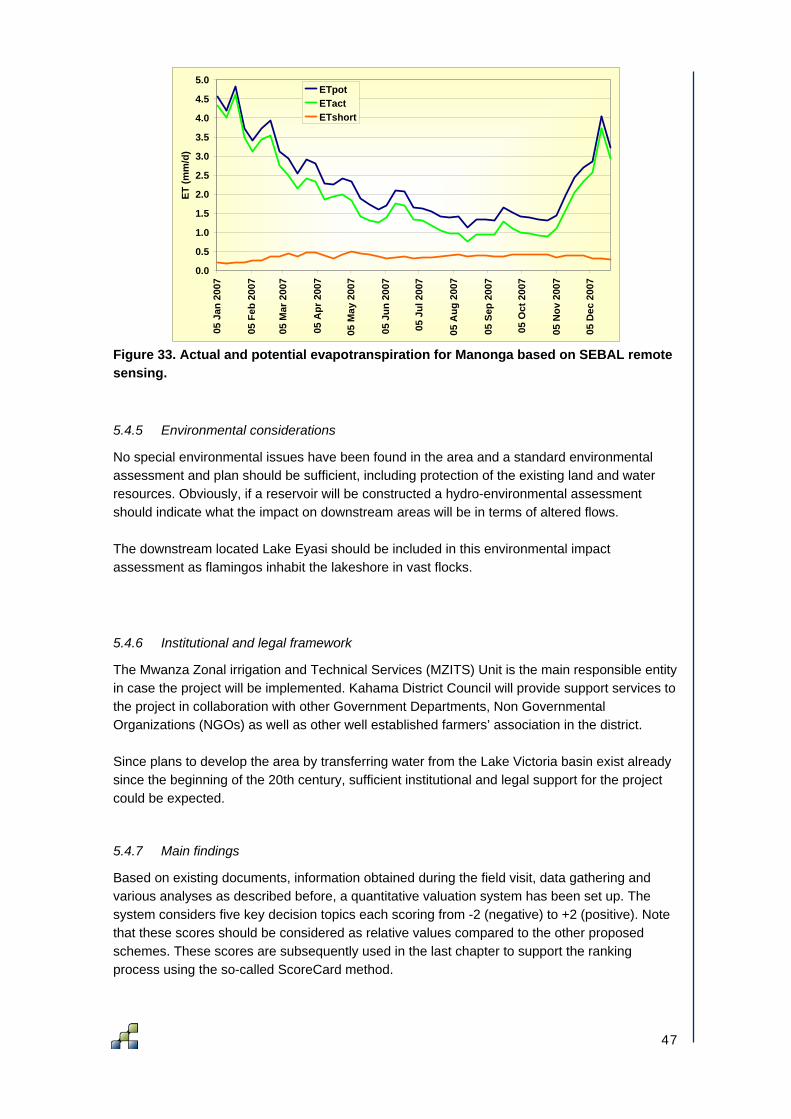
0.0
0.5
1.0
1.5
2.0
2.5
3.0
3.5
4.0
4.5
5.0
05 J
an 2
007
05 F
eb 2
007
05 M
ar 2
007
05 A
pr 2
007
05 M
ay 2
007
05 J
un 2
007
05 J
ul 2
007
05 A
ug 2
007
05 S
ep 2
007
05 O
ct 2
007
05 N
ov 2
007
05 D
ec 2
007
ET (m
m/d
)
ETpotETactETshort
Figure 33. Actual and potential evapotranspiration for Manonga based on SEBAL remote sensing.
5.4.5 Environmental considerations
No special environmental issues have been found in the area and a standard environmental assessment and plan should be sufficient, including protection of the existing land and water resources. Obviously, if a reservoir will be constructed a hydro-environmental assessment should indicate what the impact on downstream areas will be in terms of altered flows. The downstream located Lake Eyasi should be included in this environmental impact assessment as flamingos inhabit the lakeshore in vast flocks.
5.4.6 Institutional and legal framework
The Mwanza Zonal irrigation and Technical Services (MZITS) Unit is the main responsible entity in case the project will be implemented. Kahama District Council will provide support services to the project in collaboration with other Government Departments, Non Governmental Organizations (NGOs) as well as other well established farmers’ association in the district. Since plans to develop the area by transferring water from the Lake Victoria basin exist already since the beginning of the 20th century, sufficient institutional and legal support for the project could be expected.
5.4.7 Main findings
Based on existing documents, information obtained during the field visit, data gathering and various analyses as described before, a quantitative valuation system has been set up. The system considers five key decision topics each scoring from -2 (negative) to +2 (positive). Note that these scores should be considered as relative values compared to the other proposed schemes. These scores are subsequently used in the last chapter to support the ranking process using the so-called ScoreCard method.
47

For Manonga the following valuation can be concluded: • Food production: -2
o Reliability in water resources is low. Area is located upstream so less inflow from upstream areas.
• Environment: 0 o No specific concerns, except the downstream located Lake Eyasi.
• Vulnerable people: 2 o Small scale irrigation seems to be the most suitable option given the natural
settings. • Institutional support: 0
o No specific documents or relevant information was obtained that indicated specific support for the area.
• Economic viability: -1 o Distance to markets somewhat unfavorable, means of transportation low.
Requirements for a reservoir or other water supply means can make the economics somewhat unfavorable.
5.5 Ngono
5.5.1 Overall description
The proposed Ngono irrigation scheme area is located close to Lake Ikamba (Figure 34). The area is located in a fertile area with quite some natural and agricultural vegetation. An important sugar cane estate and factory can be found just North of the proposed irrigation scheme. The nearby Lake Ikamba is about 12 by 18 km and receives water from the South
Figure 34. Detailed map of the proposed irrigation scheme Ngono (Landsat False Color Composite).
!!
!!
!
Ibwera
Ibwera
Katoro
Mikoni
Kishogo
Noolage
Ruhunga
Kabaruka
Kaibanja
KyamuizideKyamuraire
Lake IhimbaLake Ikimba
Ndolage Mission
Ngono Ikamba
0 1 2 3 4 5km
48

Figure 35. Elevations in and around Ngono.
0
2,000
4,000
6,000
8,000
10,000
12,000
14,000
16,000
18,000
20,000
05 J
an 2
007
05 F
eb 2
007
05 M
ar 2
007
05 A
pr 2
007
05 M
ay 2
007
05 J
un 2
007
05 J
ul 2
007
05 A
ug 2
007
05 S
ep 2
007
05 O
ct 2
007
05 N
ov 2
007
05 D
ec 2
007
Cum
ulat
vie
biom
ass
prod
uctio
n (k
g/ha
)
0.0
0.1
0.2
0.3
0.4
0.5
0.6
0.7
0.8
0.9
1.0
ETpo
t - E
Tact
(mm
/d)
BiomassETshort
Figure 36. Biomass production based on SEBAL Remote Sensing for Ngono.
5.5.2 Land suitability
Ngono proposed irrigation scheme is located just downstream a small reservoir. The reservoir level is at 1154 meters above sea level (MASL) while the proposed irrigation scheme is at about 1157 MASL (Figure 35). The area is relatively flat and surrounded by some local hills with elevation levels up to 1420 MASL. Soils in the Ngono region and derived soil properties are shown in Figure 8 to Figure 9. Soils are classified as humi-umbric Leptosols. Leptosols are by far the most extensive group of soils
!
Ngono Ikamba
0 1 2 3 4 5km
MASLHigh : 2375
Low : 0
49

in the world. They are found mainly in mountainous regions and in areas where soil has been eroded to the extent that hard rock comes near to the surface. Other (minor) occurrences are along rivers where gravely deposits have accumulated without substantial admixture of fine earth material (ISRIC, 2008). Average organic carbon content in the area is 26 g per kg soil, corresponding to an organic matter content of 5.3% (Figure 9). Soil water holding capacity can be considered as moderate and is about 170 mm (Figure 10). Soils are classified as excessively drained (Figure 11). The SEBAL analysis for the year 2007 shows that the total annual biomass production for the area is about 20 ton per hectare and that productivity is constant throughout the year. Water shortage, defined as the difference between the potential and the actual evapotranspiration, varies somewhat during the year and is on average 0.3 to 0.4 mm d-1.
0
250
500
750
1000
1250
1500
1981
1982
1983
1984
1985
1986
1987
1988
1989
1990
1991
1992
1993
1994
1995
1996
1997
1998
1999
2000
2001
2002
Prec
ipita
tion
(mm
/ yr
)
0
25
50
75
100
125
150
175
200
Jan Feb Mar Apr May Jun Jul Aug Sep Oct Nov Dec
Prec
ipita
tion
(mm
/ m
onth
)
Figure 37. Annual and average monthly precipitation for Ngono.
5.5.3 Water resources assessment
Total precipitation in the area is high with a long-term average of almost 1300 mm per year. In specific years rainfall can exceed even the 1500 mm (1988, 1995, 2002). In terms of water resources assessments it is therefore essential to include rainfall as an important source. However there might be years where rainfall is limited like in 2000 with 794 mm. Moreover in the months June to September rainfall is also not sufficient to sustain crops.
50
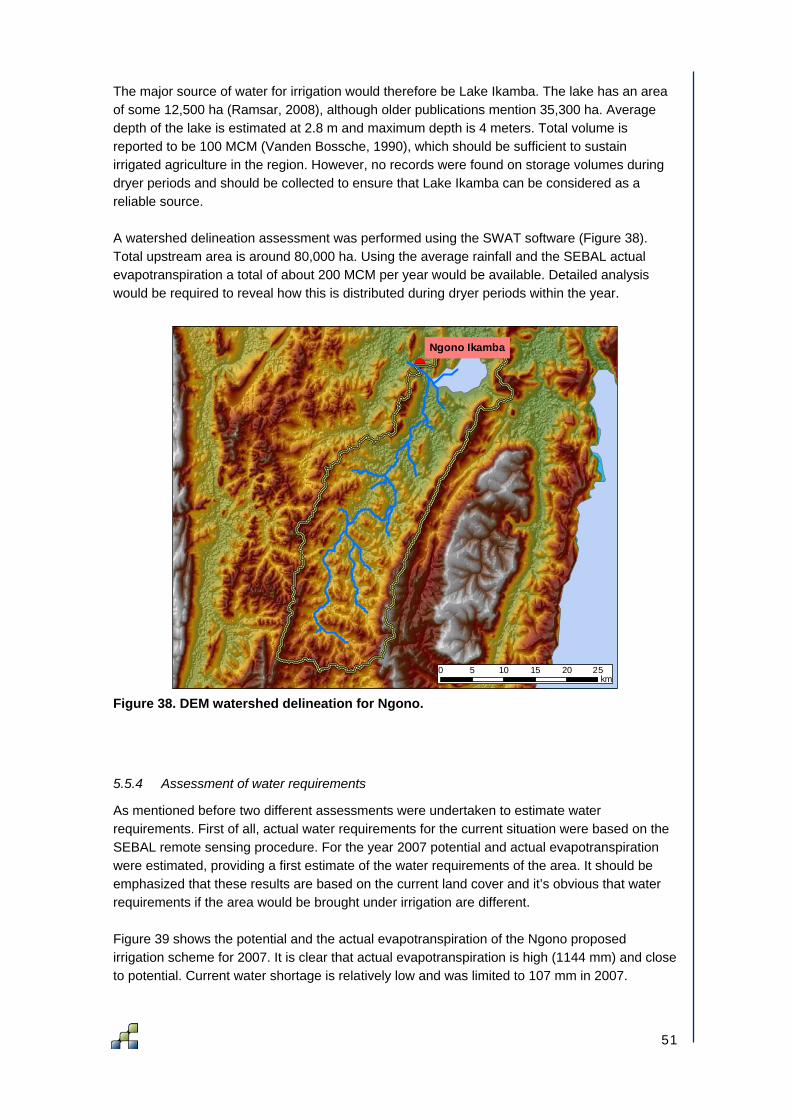
The major source of water for irrigation would therefore be Lake Ikamba. The lake has an area of some 12,500 ha (Ramsar, 2008), although older publications mention 35,300 ha. Average depth of the lake is estimated at 2.8 m and maximum depth is 4 meters. Total volume is reported to be 100 MCM (Vanden Bossche, 1990), which should be sufficient to sustain irrigated agriculture in the region. However, no records were found on storage volumes during dryer periods and should be collected to ensure that Lake Ikamba can be considered as a reliable source. A watershed delineation assessment was performed using the SWAT software (Figure 38). Total upstream area is around 80,000 ha. Using the average rainfall and the SEBAL actual evapotranspiration a total of about 200 MCM per year would be available. Detailed analysis would be required to reveal how this is distributed during dryer periods within the year.
Figure 38. DEM watershed delineation for Ngono.
5.5.4 Assessment of water requirements
As mentioned before two different assessments were undertaken to estimate water requirements. First of all, actual water requirements for the current situation were based on the SEBAL remote sensing procedure. For the year 2007 potential and actual evapotranspiration were estimated, providing a first estimate of the water requirements of the area. It should be emphasized that these results are based on the current land cover and it’s obvious that water requirements if the area would be brought under irrigation are different. Figure 39 shows the potential and the actual evapotranspiration of the Ngono proposed irrigation scheme for 2007. It is clear that actual evapotranspiration is high (1144 mm) and close to potential. Current water shortage is relatively low and was limited to 107 mm in 2007.
!
Ngono Ikamba
0 5 10 15 20 25km
51
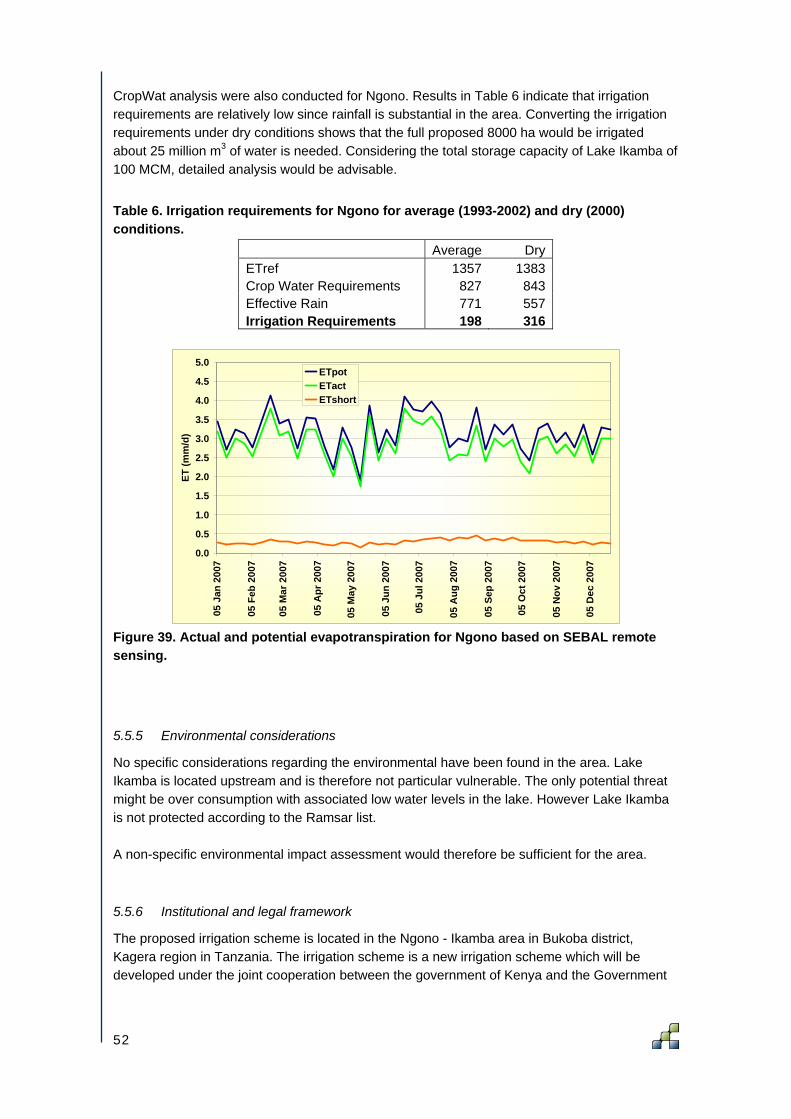
CropWat analysis were also conducted for Ngono. Results in Table 6 indicate that irrigation requirements are relatively low since rainfall is substantial in the area. Converting the irrigation requirements under dry conditions shows that the full proposed 8000 ha would be irrigated about 25 million m3 of water is needed. Considering the total storage capacity of Lake Ikamba of 100 MCM, detailed analysis would be advisable.
Table 6. Irrigation requirements for Ngono for average (1993-2002) and dry (2000) conditions.
Average DryETref 1357 1383Crop Water Requirements 827 843Effective Rain 771 557Irrigation Requirements 198 316
0.0
0.5
1.0
1.5
2.0
2.5
3.0
3.5
4.0
4.5
5.0
05 J
an 2
007
05 F
eb 2
007
05 M
ar 2
007
05 A
pr 2
007
05 M
ay 2
007
05 J
un 2
007
05 J
ul 2
007
05 A
ug 2
007
05 S
ep 2
007
05 O
ct 2
007
05 N
ov 2
007
05 D
ec 2
007
ET (m
m/d
)
ETpotETactETshort
Figure 39. Actual and potential evapotranspiration for Ngono based on SEBAL remote sensing.
5.5.5 Environmental considerations
No specific considerations regarding the environmental have been found in the area. Lake Ikamba is located upstream and is therefore not particular vulnerable. The only potential threat might be over consumption with associated low water levels in the lake. However Lake Ikamba is not protected according to the Ramsar list. A non-specific environmental impact assessment would therefore be sufficient for the area.
5.5.6 Institutional and legal framework
The proposed irrigation scheme is located in the Ngono - Ikamba area in Bukoba district, Kagera region in Tanzania. The irrigation scheme is a new irrigation scheme which will be developed under the joint cooperation between the government of Kenya and the Government
52

of Tanzania. Technical support for irrigation development at Ngono - Ikamba areas irrigation scheme will be through national and international consultancy services.
5.5.7 Main findings
Based on existing documents, information obtained during the field visit, data gathering and various analyses as described before, a quantitative valuation system has been set up. The system considers five key decision topics each scoring from -2 (negative) to +2 (positive). Note that these scores should be considered as relative values compared to the other proposed schemes. These scores are subsequently used in the last chapter to support the ranking process using the so-called ScoreCard method. For Ngono the following valuation was derived:
• Food production: 2 o Productivity of the area is high according to SEBAL analysis. Water resources
are abundant available. • Environment: 1
o No specific concerns. • Vulnerable people: 1
o Irrigation might be somewhat dominantly managed by commercial farmers as water comes from the reservoir. Special provisions for poor people could be organized, especially since water requirements are somewhat lower as rainfall is relatively high.
• Institutional support: 1 o No specific documents or relevant information was obtained that indicated
specific support for the area, but area is already in use. • Economic viability: 1
o Distance to markets somewhat unfavorable. No expensive construction works are available. Mix between commercial and small-scale irrigation possible.
53

54
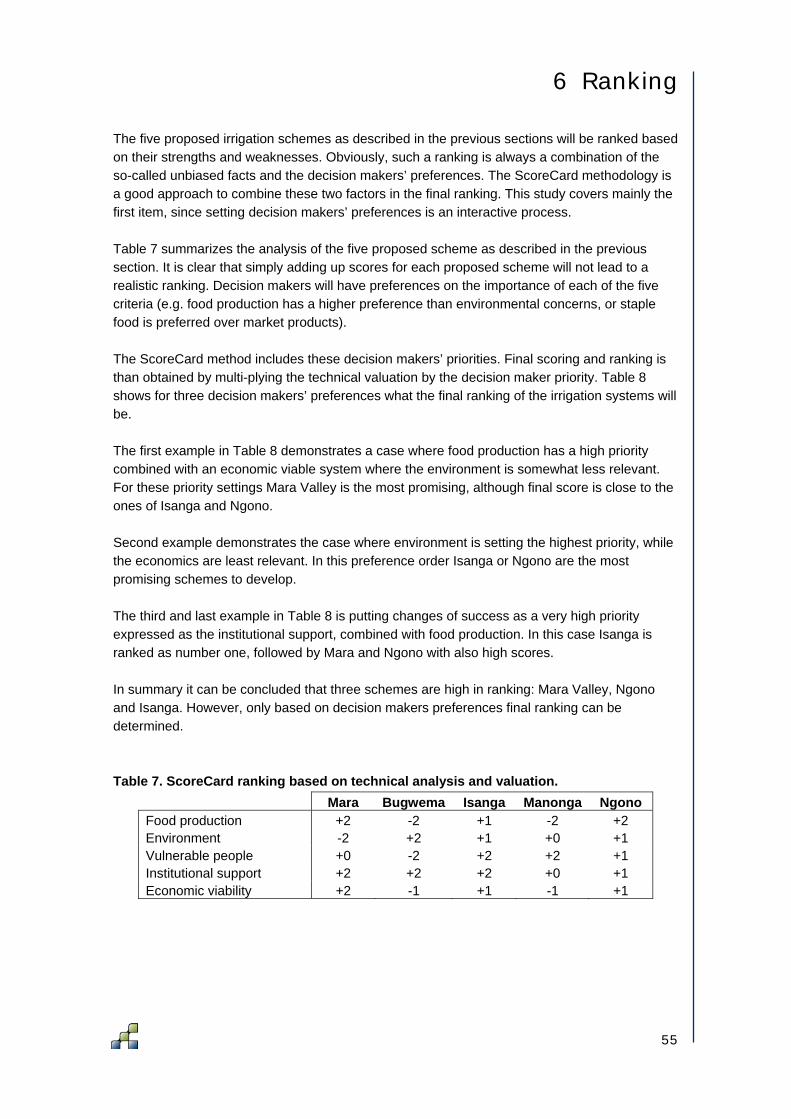
6 Ranking The five proposed irrigation schemes as described in the previous sections will be ranked based on their strengths and weaknesses. Obviously, such a ranking is always a combination of the so-called unbiased facts and the decision makers’ preferences. The ScoreCard methodology is a good approach to combine these two factors in the final ranking. This study covers mainly the first item, since setting decision makers’ preferences is an interactive process. Table 7 summarizes the analysis of the five proposed scheme as described in the previous section. It is clear that simply adding up scores for each proposed scheme will not lead to a realistic ranking. Decision makers will have preferences on the importance of each of the five criteria (e.g. food production has a higher preference than environmental concerns, or staple food is preferred over market products). The ScoreCard method includes these decision makers’ priorities. Final scoring and ranking is than obtained by multi-plying the technical valuation by the decision maker priority. Table 8 shows for three decision makers’ preferences what the final ranking of the irrigation systems will be. The first example in Table 8 demonstrates a case where food production has a high priority combined with an economic viable system where the environment is somewhat less relevant. For these priority settings Mara Valley is the most promising, although final score is close to the ones of Isanga and Ngono. Second example demonstrates the case where environment is setting the highest priority, while the economics are least relevant. In this preference order Isanga or Ngono are the most promising schemes to develop. The third and last example in Table 8 is putting changes of success as a very high priority expressed as the institutional support, combined with food production. In this case Isanga is ranked as number one, followed by Mara and Ngono with also high scores. In summary it can be concluded that three schemes are high in ranking: Mara Valley, Ngono and Isanga. However, only based on decision makers preferences final ranking can be determined. Table 7. ScoreCard ranking based on technical analysis and valuation.
Mara Bugwema Isanga Manonga Ngono Food production +2 -2 +1 -2 +2 Environment -2 +2 +1 +0 +1 Vulnerable people +0 -2 +2 +2 +1 Institutional support +2 +2 +2 +0 +1 Economic viability +2 -1 +1 -1 +1
55

Table 8. ScoreCard ranking based on the technical valuation and three examples of decision makers’ preferences. Numbers in brackets indicate total score.
Decision Preferences Final Ranking 1 Food production 1 Mara (22) 2 Economic viability 2 Isanga (20) 3 Institutional support 2 Ngono (20) 4 Vulnerable people 4 Bugwema (-10) 5 Environment 4 Manonga (-10) Decision Preferences Final Ranking 1 Vulnerable people 1 Isanga (22) 2 Environment 2 Ngono (18) 3 Food production 3 Mara (4) 4 Institutional support 4 Manonga (3) 5 Economic viability 5 Bugwema (-5) Decision Preferences Final Ranking 1 Institutional support 1 Isanga (23) 2 Food production 2 Mara (20) 3 Vulnerable people 3 Ngono (19) 4 Economic viability 4 Bugwema (-4) 5 Environment 4 Manonga (-4)
56
7 References Allen, R.G., L.S. Pereira, D. Raes, M. Smith. 1998. Crop evapotranspiration - Guidelines for
computing crop water requirements - FAO Irrigation and drainage paper 56. Bastiaanssen W.G.M., M. Menenti, R.A. Feddes, A.A.M. Holtslag. 1998. The Surface Energy
Balance Algorithm for Land (SEBAL): Part 1 formulation, Journal of Hydrology: 212-213: 198-212.
Batjes, N.H. 2004. SOTER-Based soil parameter estimates for Southern Africa. Report ISRIC, Wageningen.
COWI. 2002. Integrated Water Quality/ Limnology Study for Lake Victoria; Consultant Technical Report. Dar-es-salaam.
EWUAP. 2006. Tanzania draft report on the rapid baseline assessment. Efficient Water Use for Agricultural Production, Nile Basin Initiative.
FAO. 1988. Soil Map of the World. Revised Legend. Reprinted with corrections. World Soil Resources Report 60. FAO, Rome.
FAO. 1990. Tanzania country paper. Agriculture in the Tanzania wetlands. FAO Review of irrigation.
FAO. 1997. Irrigation Potential in Africa - A Basin Approach; FAO Land and Water Bulletin 4, Rome 1997.
FAO. 1999. CropWat for Windows v. 4.3. ISRIC. 2008. ISRIC World Soil Information. http://www.isric.org/ Mitchell T.D., T.R. Carter, P.D. Jones, M. Hulme, M. New. 2004. A comprehensive set of high
resolution grids of monthly climate for Europe and the globe: the observed records (1901 - 2000) and 16 scenarios (2001-20016), Climate Research Unit, School of Environmental Sciences, University of East Anglia, UK
NIMP. 2002. National Irrigation Master Plan. NIPPON KOEI and JICA. Piper, B.S., D.T. Plinston, J.V. Sutcliffe. 1986 The water balance of Lake Victoria. Hydrological
Sciences Journal 31: 25-37. Ramsar. 2008. Wetlands in Tanzania. http://ramsar.wetlands.org/ TSD. 2008. Concept Notes on proposed irrigation systems: Mara Valley, Bugwema, Isanga,
Manonga, Ngono. Irrigation and Technical Service Division of the Min. of Agriculture, Food Security and Cooperatives.
UN-ECA. 2000.Transboundary River/Lake Basin Water Development in Africa: Prospects, Problems, and Achievements. United Nations Economic Commission for Africa. 2000.
UNESCO. 1974. Legend of the Soil Map of the World. UNESCO, Paris. http://www.fao.org/waicent/Faoinfo/agricult/agl/agll/key2soil.stm
Vanden Bossche, J.P., G.M. Bernacsek. 1990. Source book for the inland fishery resources of Africa: 1. CIFA Technical Paper. No. 18.1. Rome, FAO. 1990. 240p.
57
Appendix 1: Calculation methods During the assessments some assumptions regarding calculations have been made. Some of these are explained hereafter. CropWat
• 10-days interval calculations • ETo distribution model: curve fitted through monthly values • Rainfall distribution model: curve fitted through monthly values • Effective rainfall: USDA Soil Conservation Service method • Irrigation efficiency: 70%
SEBAL
• Penman-Monteith approach • 10 days interval based on MODIS 1x1km
DEM
• Vertical resolution 1 m • Horizontal resolution 1 x 1 km2 • Delineation threshold value: 1000 ha
CRU climate dataset
• Horizontal resolution: 0.5o x 0.50 ~ 50 x 50 km2
58