investigating population pyramids and what they tell us. ap human geography
TRANSCRIPT

Investigating Population Pyramids and what they tell us.
AP Human Geography

Source US Census Bureau International Data Base
A Population Structure is the composition of a population, the most important elements of which are age and sex
Population Pyramids are bar charts, arranged vertically that shows the distribution of a population by age and gender.

Take a couple minutes to study this pyramid. Jot down things you can tell about this country’s population.
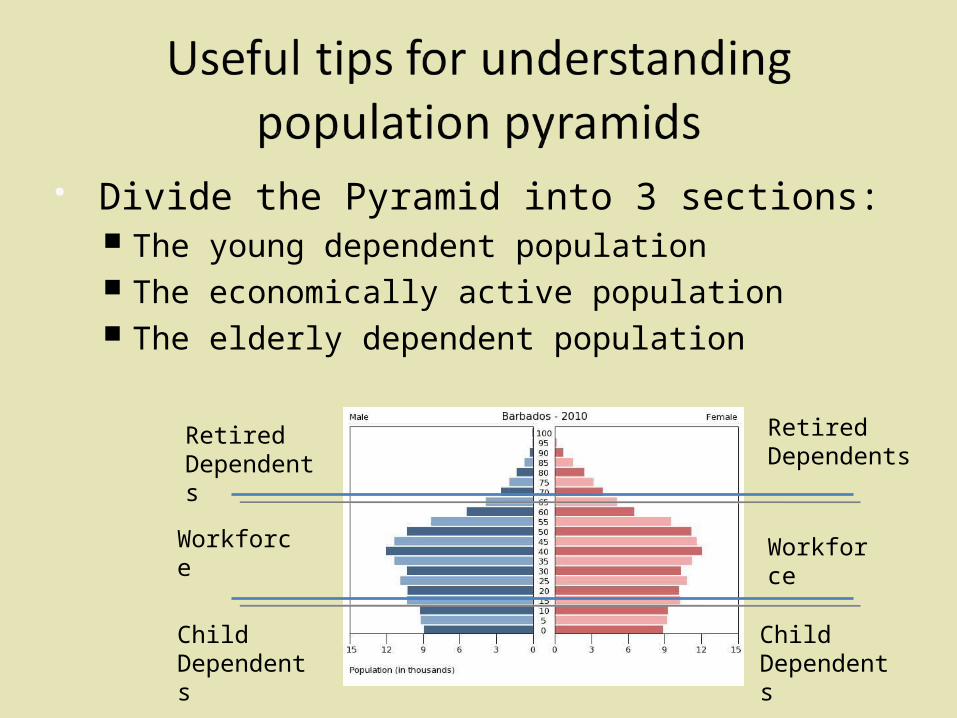
Retired Dependents
Retired Dependents
Workforce Workforce
Child Dependents
Child Dependents
Divide the Pyramid into 3 sections: The young dependent population The economically active population The elderly dependent population

The Pyramid contains information about:• Genders•Population of Specific Ages•Life Expectancy•Death Rate•Birth Rate•Infant Mortality•Population of the workforce•Population of dependents•How the Population changes
Why are population Pyramids Useful?

• Migration Patterns• Identify Areas where
there are ageing populations or young population profiles
• Illustrate Development Indicators like Birth Rate.-
• Predictive tools for future services likes schools, nursing homes, pension programs, health services
• Calculate Dependency Ratios
• Government Policy –pronatalist or antinatalist

Early Expanding Late Expanding
Stationary ContractingSource US Census Bureau International Data Base

• Wide Base (High Birth Rate)
• Rapidly Tapers (High Death Rate)
• Short bars in Higher age groups (Low Life Expectancy)
Source US Census Bureau International Data Base

• Beehive in Shape• Less Tapering (Falling
Death Rate)• Base less wide (Falling
Birth Rates• Improving Life
Expectancy
Source US Census Bureau International Data Base

• Bars change little from generation to generation (low Death Rate)
• Improving Life Expectancy
• Births around replacement level
Source US Census Bureau International Data Base

• ‘Coffin’ Shape• Short Base Bars as Birth
Rate is well below replacement
• Long bars in older generations (Ageing Population)
• Long Life Expectancy
Source US Census Bureau International Data Base
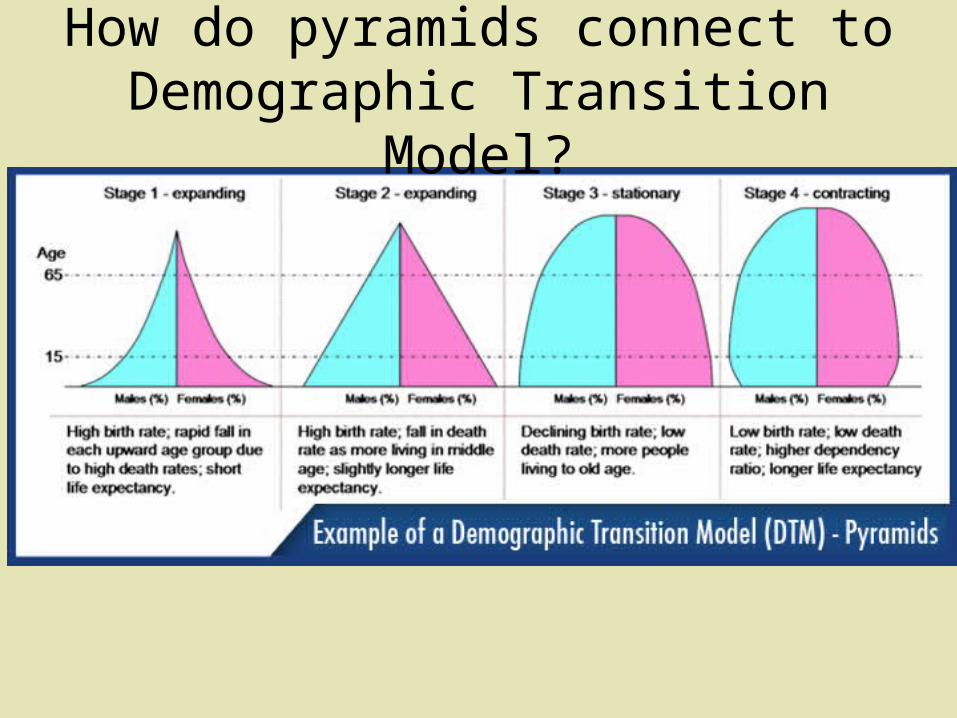
How do pyramids connect to Demographic Transition Model?

1 2 3 4 5

Population Structures: Differences among Countries
• Differences in population structures can be based on one or more of the following: – Migration (in and out, urban/rural) – Sex Ratio – Access to health services (both young and old)

Sex Ratio
• Sex Ratio is the number of males per 100 females in a population.
• Male births consistently exceed female births due to a combination of biological and social reasons (infanticide- a phenomenon we will discuss in the next unit)

Population Projections
• Populations projections are the prediction of future populations based on the present age-gender structure, and with present rates of fertility, mortality and migration.
• Population projections are always hypothetical in nature.