invest in - bkpm in invest in remarkable ... q i 2015 q ii 2015 jan-jun 2015 q i 2016 q ii 2016...
TRANSCRIPT
July, 29th 2016
invest in
Invest in remarkable indonesia Invest in
remarkable indonesiaindonesia
Invest in remarkable indonesia
Invest in remarkable indonesia
Invest in remarkable indonesia
indonesia
Invest in
Invest in remarkable indonesia
Invest in remarkable indonesia
Invest in remarkable indonesia
indonesia
Invest in
Invest in
Invest in
able indonesia Invest
© 2016 by Indonesia Investment Coordinating Board. All rights reserved
Indonesia Investment Coordinating Board
DOMESTIC AND FOREIGN DIRECT INVESTMENT REALIZATION
IN QUARTER II AND JANUARY - JUNE 2016
The Investment Coordinating Board of the Republic of Indonesia
2
DAFTAR ISI
I. QUARTER II 2016 AND JANUARY – JUNE 2016: In Comparison with 2015
II. QUARTER II 2016: Sector, Location, Country of Origin and Region
III. JANUARY – JUNE 2016: Sector, Location, Country of Origin and Region
IV. INDONESIAN LABOR ABSORPTION
V. PROGRESS OF INVESTMENT REALIZATION 2011 – JUNE 2016
The Investment Coordinating Board of the Republic of Indonesia
3
I. QUARTER II 2016 and January – June 2016: In Comparison with 2015
The Investment Coordinating Board of the Republic of Indonesia
4
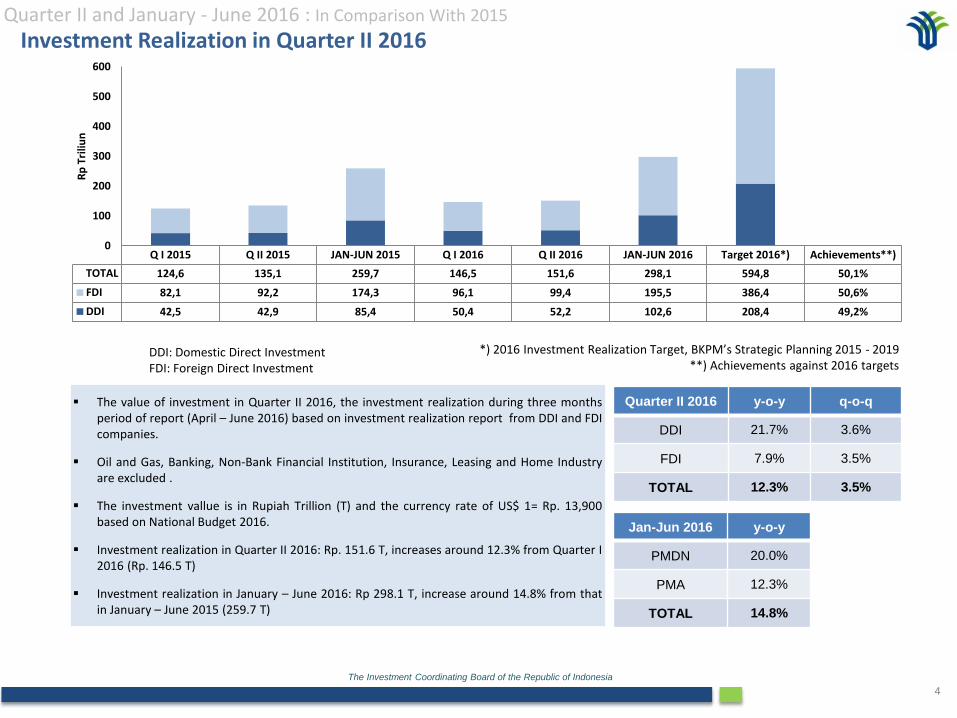
*) 2016 Investment Realization Target, BKPM’s Strategic Planning 2015 - 2019**) Achievements against 2016 targets
Investment Realization in Quarter II 2016
The value of investment in Quarter II 2016, the investment realization during three monthsperiod of report (April – June 2016) based on investment realization report from DDI and FDIcompanies.
Oil and Gas, Banking, Non-Bank Financial Institution, Insurance, Leasing and Home Industryare excluded .
The investment vallue is in Rupiah Trillion (T) and the currency rate of US$ 1= Rp. 13,900based on National Budget 2016.
Investment realization in Quarter II 2016: Rp. 151.6 T, increases around 12.3% from Quarter I2016 (Rp. 146.5 T)
Investment realization in January – June 2016: Rp 298.1 T, increase around 14.8% from thatin January – June 2015 (259.7 T)
DDI: Domestic Direct InvestmentFDI: Foreign Direct Investment
Quarter II 2016 y-o-y q-o-q
DDI 21.7% 3.6%
FDI 7.9% 3.5%
TOTAL 12.3% 3.5%
Jan-Jun 2016 y-o-y
PMDN 20.0%
PMA 12.3%
TOTAL 14.8%
Q I 2015 Q II 2015 JAN-JUN 2015 Q I 2016 Q II 2016 JAN-JUN 2016 Target 2016*) Achievements**)
TOTAL 124,6 135,1 259,7 146,5 151,6 298,1 594,8 50,1%
FDI 82,1 92,2 174,3 96,1 99,4 195,5 386,4 50,6%
DDI 42,5 42,9 85,4 50,4 52,2 102,6 208,4 49,2%
0
100
200
300
400
500
600R
p T
riliu
n
Quarter II and January - June 2016 : In Comparison With 2015
The Investment Coordinating Board of the Republic of Indonesia
5
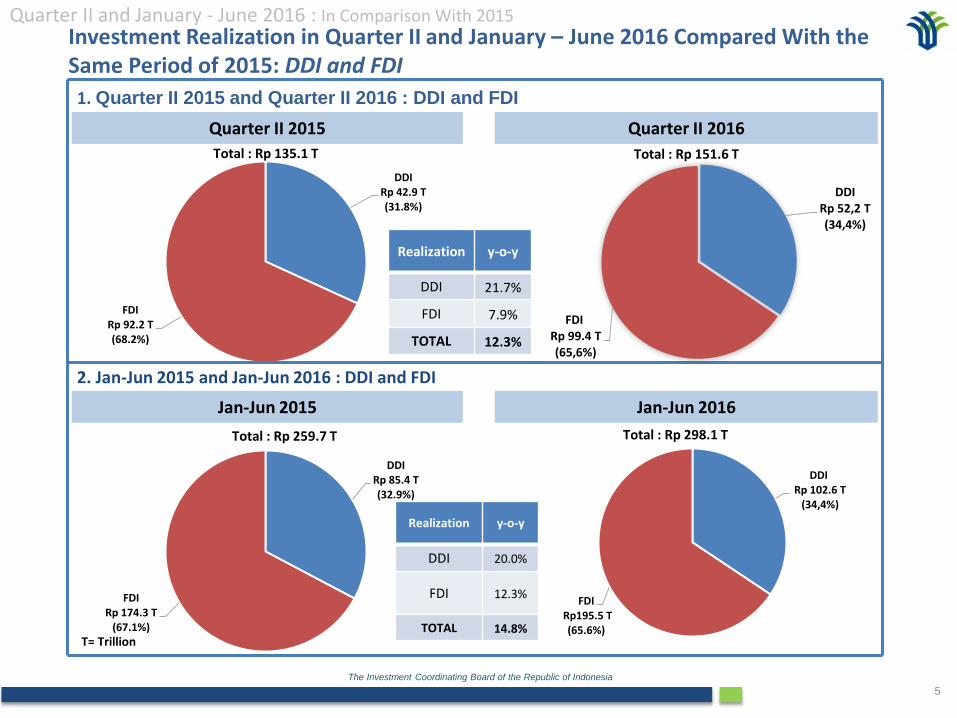
DDIRp 42.9 T(31.8%)
FDIRp 92.2 T(68.2%)
Total : Rp 135.1 T
Investment Realization in Quarter II and January – June 2016 Compared With the Same Period of 2015: DDI and FDI
Quarter II 2015 Quarter II 2016
Jan-Jun 2015 Jan-Jun 2016
1. Quarter II 2015 and Quarter II 2016 : DDI and FDI
2. Jan-Jun 2015 and Jan-Jun 2016 : DDI and FDI
T= Trillion
Quarter II and January - June 2016 : In Comparison With 2015
DDIRp 85.4 T(32.9%)
FDIRp 174.3 T
(67.1%)
Total : Rp 259.7 T
DDI Rp 52,2 T (34,4%)
FDIRp 99.4 T(65,6%)
Total : Rp 151.6 T
DDIRp 102.6 T
(34,4%)
FDIRp195.5 T(65.6%)
Total : Rp 298.1 T
Realization y-o-y
DDI 21.7%
FDI 7.9%
TOTAL 12.3%
Realization y-o-y
DDI 20.0%
FDI 12.3%
TOTAL 14.8%
The Investment Coordinating Board of the Republic of Indonesia
6
Quarter II 2015 Quarter II 2016
Jan-Jun 2015 Jan-Jun 2016
1. Quarter II 2015 dan Quarter II 2016 : Jawa and Outside Java
2. Jan-Jun 2015 dan Jan-Jun 2016 : Jawa dan Outside Java
T= Trillion
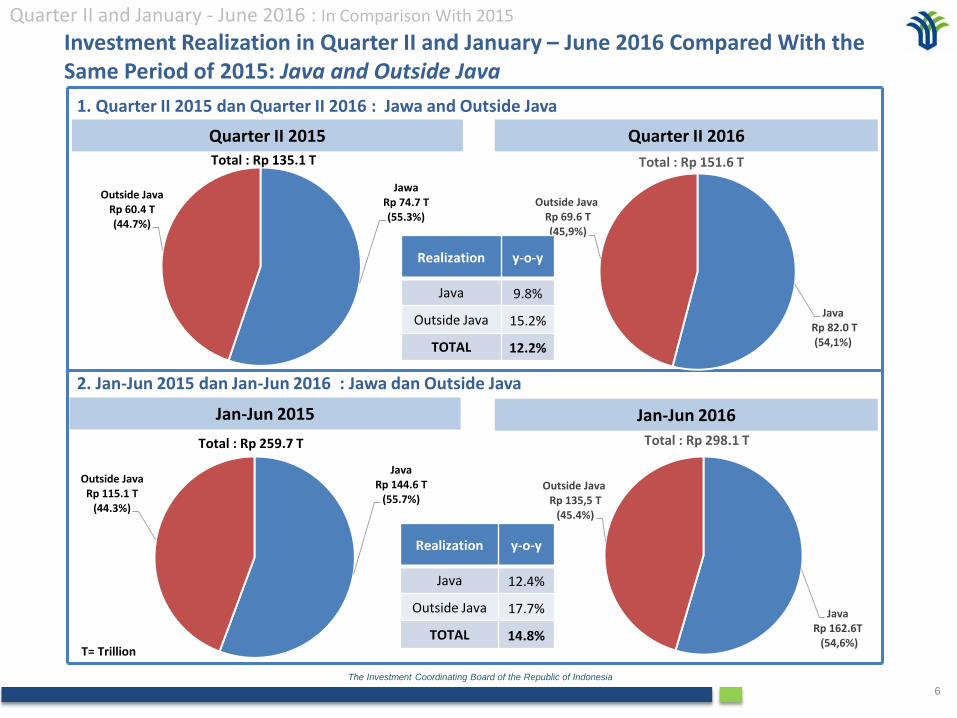
JawaRp 74.7 T(55.3%)
Outside JavaRp 60.4 T(44.7%)
Total : Rp 135.1 T
JavaRp 144.6 T
(55.7%)
Outside JavaRp 115.1 T
(44.3%)
Total : Rp 259.7 T
JavaRp 82.0 T(54,1%)
Outside JavaRp 69.6 T(45,9%)
Total : Rp 151.6 T
Java Rp 162.6T
(54,6%)
Outside JavaRp 135,5 T
(45.4%)
Total : Rp 298.1 T
Realization y-o-y
Java 9.8%
Outside Java 15.2%
TOTAL 12.2%
Realization y-o-y
Java 12.4%
Outside Java 17.7%
TOTAL 14.8%
Investment Realization in Quarter II and January – June 2016 Compared With the Same Period of 2015: Java and Outside Java
Quarter II and January - June 2016 : In Comparison With 2015
The Investment Coordinating Board of the Republic of Indonesia
7
II. Quarter I 2016 : Sector, Location, Country of Origin and Region
The Investment Coordinating Board of the Republic of Indonesia
8
FDI
DDI DDI + FDI
T= TrillionB= Billion
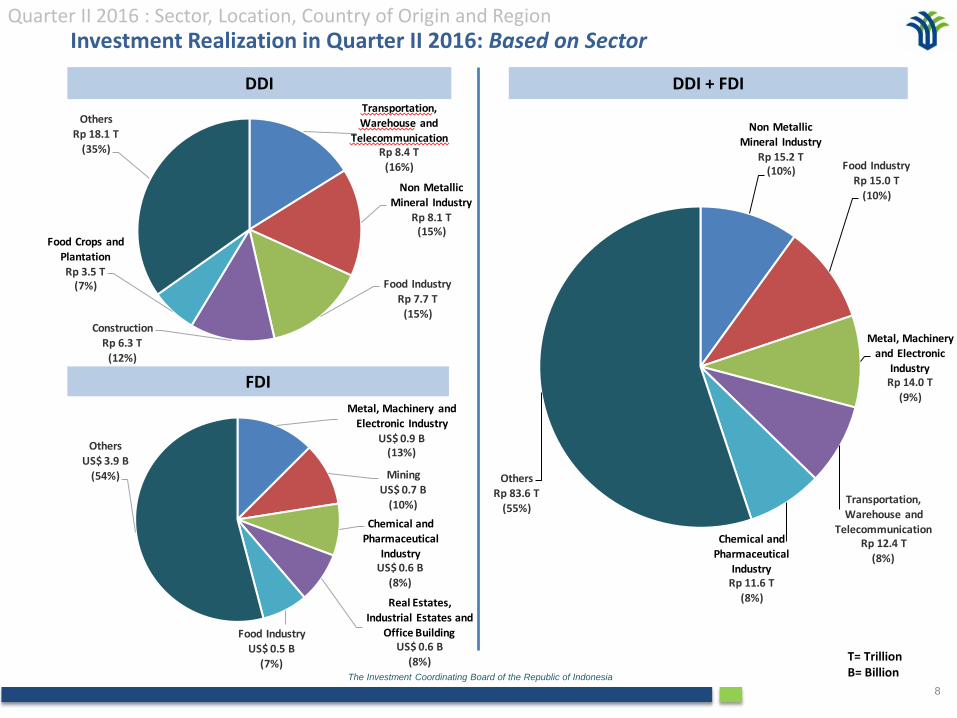
Metal, Machinery and Electronic Industry
US$ 0.9 B(13%)
MiningUS$ 0.7 B
(10%)
Chemical and Pharmaceutical
IndustryUS$ 0.6 B
(8%)
Real Estates,
Industrial Estates and
Office BuildingUS$ 0.6 B
(8%)
Food Industry
US$ 0.5 B
(7%)
Others
US$ 3.9 B
(54%)
Transportation,
Warehouse and
TelecommunicationRp 8.4 T
(16%)
Non Metallic
Mineral Industry
Rp 8.1 T(15%)
Food Industry
Rp 7.7 T(15%)
ConstructionRp 6.3 T
(12%)
Food Crops and
Plantation
Rp 3.5 T(7%)
Others
Rp 18.1 T
(35%)
Non Metallic
Mineral IndustryRp 15.2 T
(10%) Food IndustryRp 15.0 T
(10%)
Metal, Machinery
and Electronic Industry
Rp 14.0 T
(9%)
Transportation, Warehouse and
TelecommunicationRp 12.4 T
(8%)
Chemical and
Pharmaceutical Industry
Rp 11.6 T
(8%)
OthersRp 83.6 T
(55%)
Investment Realization in Quarter II 2016: Based on SectorQuarter II 2016 : Sector, Location, Country of Origin and Region
The Investment Coordinating Board of the Republic of Indonesia
9
FDI
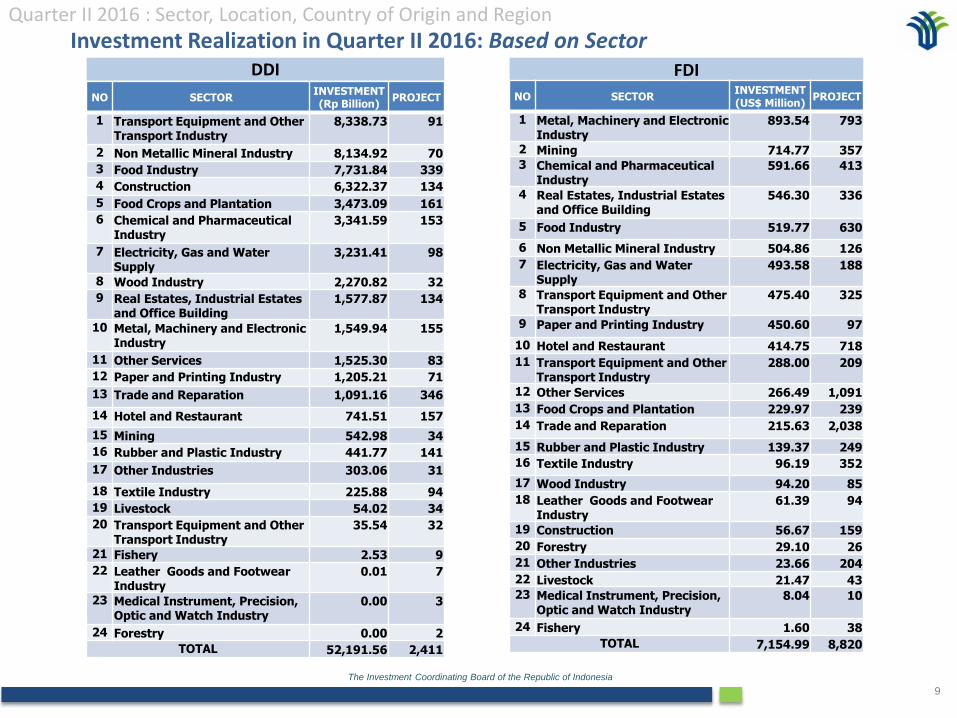
Investment Realization in Quarter II 2016: Based on Sector
NO SECTORINVESTMENT(US$ Million)
PROJECT
1 Metal, Machinery and Electronic Industry
893.54 793
2 Mining 714.77 3573 Chemical and Pharmaceutical
Industry591.66 413
4 Real Estates, Industrial Estates and Office Building
546.30 336
5 Food Industry 519.77 630
6 Non Metallic Mineral Industry 504.86 126
7 Electricity, Gas and Water Supply
493.58 188
8 Transport Equipment and Other Transport Industry
475.40 325
9 Paper and Printing Industry 450.60 97
10 Hotel and Restaurant 414.75 718
11 Transport Equipment and Other Transport Industry
288.00 209
12 Other Services 266.49 1,091
13 Food Crops and Plantation 229.97 239
14 Trade and Reparation 215.63 2,038
15 Rubber and Plastic Industry 139.37 249
16 Textile Industry 96.19 352
17 Wood Industry 94.20 85
18 Leather Goods and Footwear Industry
61.39 94
19 Construction 56.67 159
20 Forestry 29.10 26
21 Other Industries 23.66 204
22 Livestock 21.47 4323 Medical Instrument, Precision,
Optic and Watch Industry8.04 10
24 Fishery 1.60 38
TOTAL 7,154.99 8,820
NO SECTORINVESTMENT(Rp Billion)
PROJECT
1 Transport Equipment and Other Transport Industry
8,338.73 91
2 Non Metallic Mineral Industry 8,134.92 70
3 Food Industry 7,731.84 339
4 Construction 6,322.37 134
5 Food Crops and Plantation 3,473.09 161
6 Chemical and Pharmaceutical Industry
3,341.59 153
7 Electricity, Gas and Water Supply
3,231.41 98
8 Wood Industry 2,270.82 32
9 Real Estates, Industrial Estates and Office Building
1,577.87 134
10 Metal, Machinery and Electronic Industry
1,549.94 155
11 Other Services 1,525.30 83
12 Paper and Printing Industry 1,205.21 71
13 Trade and Reparation 1,091.16 346
14 Hotel and Restaurant 741.51 157
15 Mining 542.98 34
16 Rubber and Plastic Industry 441.77 141
17 Other Industries 303.06 31
18 Textile Industry 225.88 94
19 Livestock 54.02 34
20 Transport Equipment and Other Transport Industry
35.54 32
21 Fishery 2.53 9
22 Leather Goods and Footwear Industry
0.01 7
23 Medical Instrument, Precision, Optic and Watch Industry
0.00 3
24 Forestry 0.00 2
TOTAL 52,191.56 2,411
DDI
Quarter II 2016 : Sector, Location, Country of Origin and Region
The Investment Coordinating Board of the Republic of Indonesia
10
FDI
DDI DDI + FDI
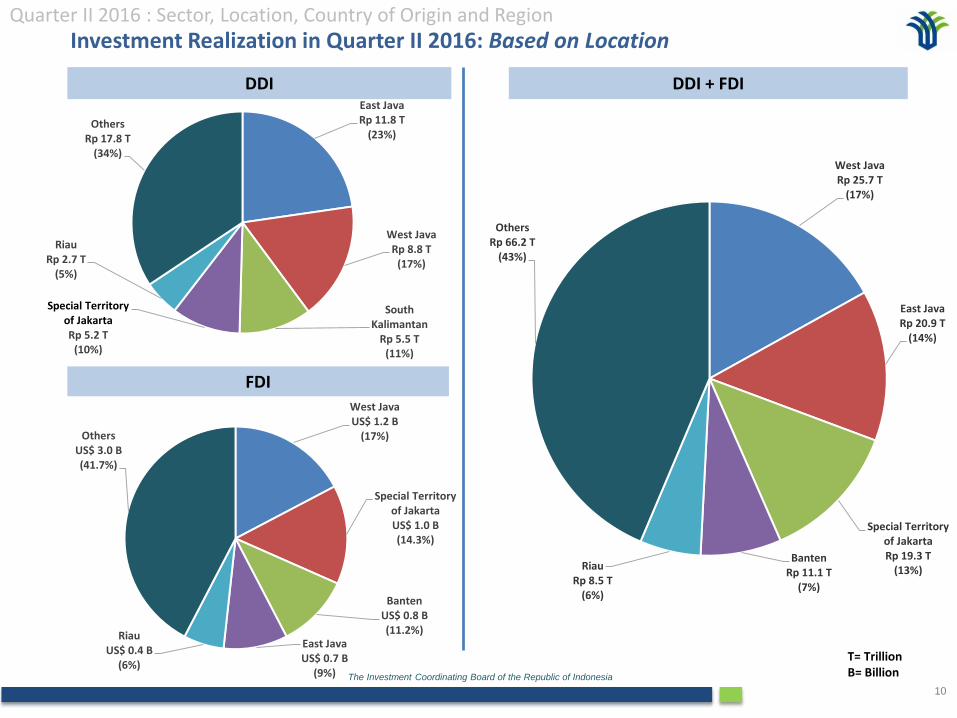
T= TrillionB= Billion
West JavaUS$ 1.2 B
(17%)
Special Territory of JakartaUS$ 1.0 B(14.3%)
BantenUS$ 0.8 B(11.2%)
East JavaUS$ 0.7 B
(9%)
RiauUS$ 0.4 B
(6%)
OthersUS$ 3.0 B(41.7%)
West JavaRp 25.7 T
(17%)
East JavaRp 20.9 T
(14%)
Special Territory of JakartaRp 19.3 T
(13%)Banten
Rp 11.1 T(7%)
RiauRp 8.5 T
(6%)
OthersRp 66.2 T
(43%)
East JavaRp 11.8 T
(23%)
West JavaRp 8.8 T
(17%)
South Kalimantan
Rp 5.5 T(11%)
Special Territory of JakartaRp 5.2 T
(10%)
RiauRp 2.7 T
(5%)
OthersRp 17.8 T
(34%)
Investment Realization in Quarter II 2016: Based on LocationQuarter II 2016 : Sector, Location, Country of Origin and Region
The Investment Coordinating Board of the Republic of Indonesia
11
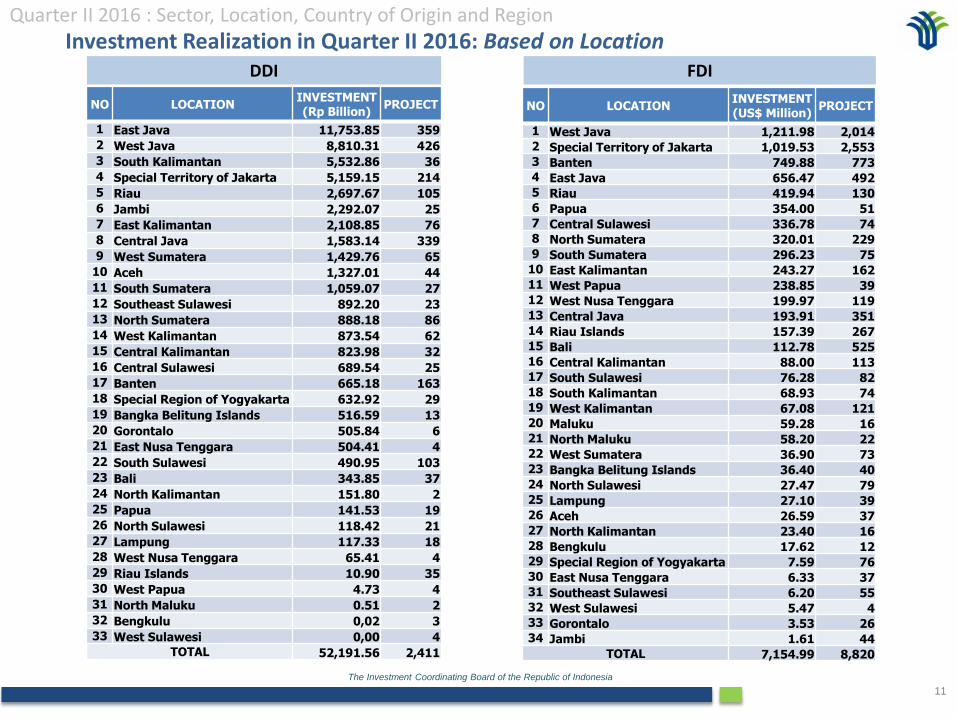
NO LOCATIONINVESTMENT(US$ Million)
PROJECT
1 West Java 1,211.98 2,0142 Special Territory of Jakarta 1,019.53 2,5533 Banten 749.88 7734 East Java 656.47 4925 Riau 419.94 1306 Papua 354.00 517 Central Sulawesi 336.78 748 North Sumatera 320.01 2299 South Sumatera 296.23 75
10 East Kalimantan 243.27 16211 West Papua 238.85 3912 West Nusa Tenggara 199.97 11913 Central Java 193.91 35114 Riau Islands 157.39 26715 Bali 112.78 52516 Central Kalimantan 88.00 11317 South Sulawesi 76.28 8218 South Kalimantan 68.93 7419 West Kalimantan 67.08 12120 Maluku 59.28 1621 North Maluku 58.20 2222 West Sumatera 36.90 7323 Bangka Belitung Islands 36.40 4024 North Sulawesi 27.47 7925 Lampung 27.10 3926 Aceh 26.59 3727 North Kalimantan 23.40 1628 Bengkulu 17.62 1229 Special Region of Yogyakarta 7.59 7630 East Nusa Tenggara 6.33 3731 Southeast Sulawesi 6.20 5532 West Sulawesi 5.47 433 Gorontalo 3.53 2634 Jambi 1.61 44
TOTAL 7,154.99 8,820
FDIDDI
Investment Realization in Quarter II 2016: Based on Location
NO LOCATIONINVESTMENT(Rp Billion)
PROJECT
1 East Java 11,753.85 359
2 West Java 8,810.31 426
3 South Kalimantan 5,532.86 36
4 Special Territory of Jakarta 5,159.15 214
5 Riau 2,697.67 105
6 Jambi 2,292.07 25
7 East Kalimantan 2,108.85 76
8 Central Java 1,583.14 339
9 West Sumatera 1,429.76 65
10 Aceh 1,327.01 44
11 South Sumatera 1,059.07 27
12 Southeast Sulawesi 892.20 23
13 North Sumatera 888.18 86
14 West Kalimantan 873.54 62
15 Central Kalimantan 823.98 32
16 Central Sulawesi 689.54 25
17 Banten 665.18 163
18 Special Region of Yogyakarta 632.92 29
19 Bangka Belitung Islands 516.59 13
20 Gorontalo 505.84 6
21 East Nusa Tenggara 504.41 4
22 South Sulawesi 490.95 103
23 Bali 343.85 37
24 North Kalimantan 151.80 2
25 Papua 141.53 19
26 North Sulawesi 118.42 21
27 Lampung 117.33 18
28 West Nusa Tenggara 65.41 4
29 Riau Islands 10.90 35
30 West Papua 4.73 4
31 North Maluku 0.51 2
32 Bengkulu 0,02 3
33 West Sulawesi 0,00 4
TOTAL 52,191.56 2,411
Quarter II 2016 : Sector, Location, Country of Origin and Region
The Investment Coordinating Board of the Republic of Indonesia
12
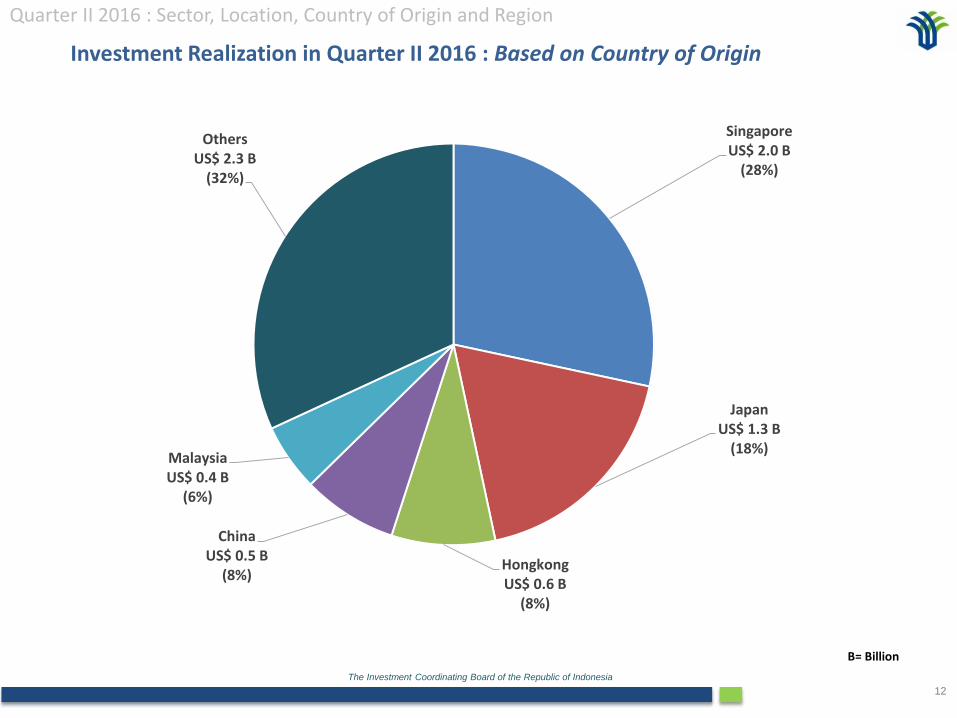
Investment Realization in Quarter II 2016 : Based on Country of Origin
Quarter II 2016 : Sector, Location, Country of Origin and Region
B= Billion
SingaporeUS$ 2.0 B
(28%)
JapanUS$ 1.3 B
(18%)
HongkongUS$ 0.6 B
(8%)
ChinaUS$ 0.5 B
(8%)
Malaysia US$ 0.4 B
(6%)
OthersUS$ 2.3 B
(32%)

The Investment Coordinating Board of the Republic of Indonesia
13
NO COUNTRY OF ORIGININVESTMENT(US$ Million)
PROJECT
1 Singapore 2,028.87 1,927
2 Japan 1,306.90 1,355
3 Hongkong 597.27 347
4 China 549.67 499
5 Malaysia 393.40 520
6 Netherlands 364.38 303
7 United States of America 347.35 196
8 British Virgin Islands 346.40 655
9 South Korea 282.66 1,106
10 Mauritius 228.09 96
11 Switzerland 78.68 85
12 Cayman Islands 65.06 23
13 United Kingdom 56.04 171
14 Australia 52.84 263
15 Taiwan 49.81 150
16 Germany 49.31 129
17 Spain 44.79 43
18 Luxembourg 44.34 66
19 United Arab Emirates 38.16 34
20 Seychelles 33.91 39
21 India 25.28 15122 Thailand 24.09 73
23 Canada 23.08 28
24 Philippine 22.36 20
25 France 20.62 123
26 Belgium 18.83 44
27 Norway 14.73 13
28 New Zealand 8.83 19
29 Panama 8.01 6
30 Italy 5.28 48
31 Afghanistan 4.38 18
32 West Samoa 3.46 32
33 Kuwait 3.22 5
34 Sweden 3.14 13
35 Iraq 1.82 3
36 Ireland 1.70 4
Investment Realization in Quarter II 2016 : Based on Country of Origin
NO COUNTRY OF ORIGININVESTMENT(US$ Million)
PROJECT
37 Turkey 1.03 15
38 Yaman 0.70 4
39 Austria 0.58 13
40 Ukraina 0.55 3
41 Poland 0.46 7
42 Brazil 0.42 4
43 Cyprus 0.41 1
44 Nigeria 0.40 2
45 Argentina 0.40 3
46 Saudi Arabia 0.39 18
47 Lebanon 0.36 5
48 Romania 0.32 1
49 Yordania 0.28 5
50 Slovakia 0.27 1
51 Isle of Man 0.19 3
52 Cameron 0.18 1
53 Netherlands Antilles 0.17 2
54 South Africa 0.16 3
55 Scotland 0.16 4
56 Russia 0.15 9
57 Bahrain 0.13 1
58 Pakistan 0.10 13
59 Syria 0.10 2
60 Egypt 0.08 5
61 Tanzania 0.07 1
62 Czech Rep. 0.06 2
63 Brunei Darussalam 0.04 9
64 French Guinea 0.04 1
65 Estonia 0.03 1
66 Portugal 0.02 5
67 Latvia 0.00 1
68 Iran 0.00 2
69 Denmark 0.00 13
70 Maldives 0.00 1
71 Marshall Island 0.00 1
72 Channel Islands 0.00 6
Quarter II 2016 : Sector, Location, Country of Origin and Region
NO NEGARA ASALINVESTMENT(US$ Million)
PROJECT
73 Liberia 0.00 2
74 Jamaica 0.00 1
75 Vietnam 0.00 2
76 Mauritania 0.00 2
76 Algeria 0.00 1
77 Papua New Guinea 0.00 1
78 Nepal 0.00 1
79 Morocco 0.00 1
80 Bahamas 0.00 1
81 Bangladesh 0.00 1
82 Belize 0.00 2
83 Mexico 0.00 4
84 Anguilla 0.00 1
85 Finland 0.00 3
86 Hungary 0.00 4
87 Columbia 0.00 1
88 Malta 0.00 1
89 Cook Islands 0.00 3
90 Gibraltar 0.00 1
91 Seychelles 0.00 1
92 Bulgaria 0.00 193 Guernsey 0.00 1
94 Sri Lanka 0.00 1
95 Vanuatu 0.00 1
96 Greece 0.00 2
97 Somalia 0.00 1
98 Sudan 0.00 1
TOTAL 7,154.99 8,820
The Investment Coordinating Board of the Republic of Indonesia
14
III. January - June 2016 : Sector, Location, Country of Origin and Region
The Investment Coordinating Board of the Republic of Indonesia
15
FDI
DDI DDI + FDI
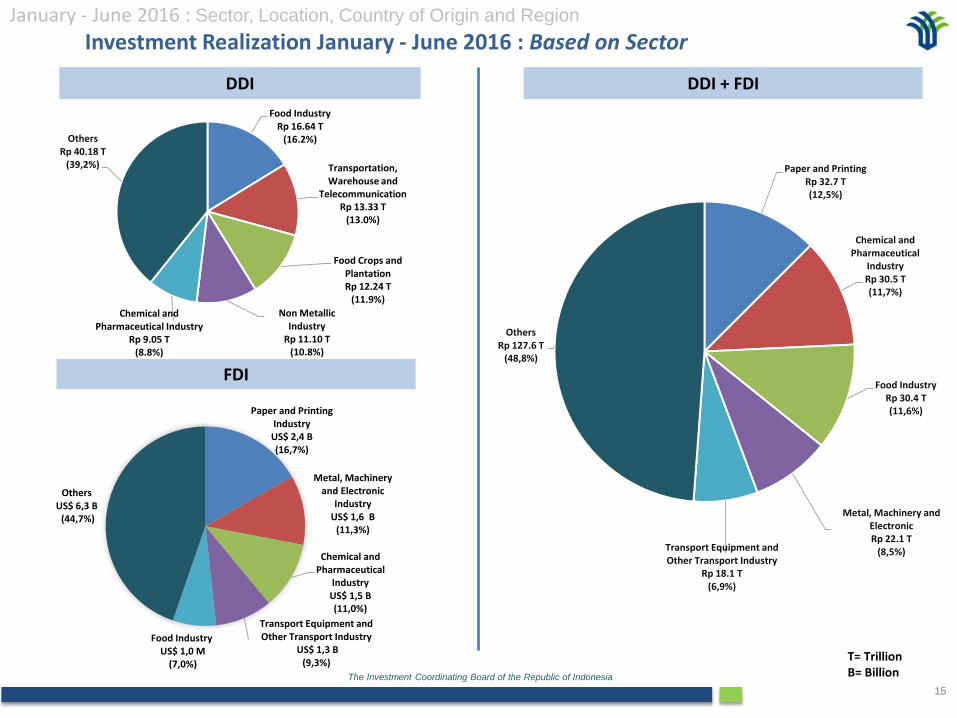
Investment Realization January - June 2016 : Based on SectorJanuary - June 2016 : Sector, Location, Country of Origin and Region
T= TrillionB= Billion
Paper and Printing IndustryUS$ 2,4 B (16,7%)
Metal, Machinery and Electronic
Industry US$ 1,6 B
(11,3%)
Chemical and Pharmaceutical
Industry US$ 1,5 B (11,0%)
Transport Equipment and Other Transport Industry
US$ 1,3 B(9,3%)
Food IndustryUS$ 1,0 M
(7,0%)
Others US$ 6,3 B
(44,7%)
Paper and PrintingRp 32.7 T(12,5%)
Chemical and Pharmaceutical
IndustryRp 30.5 T(11,7%)
Food IndustryRp 30.4 T(11,6%)
Metal, Machinery and ElectronicRp 22.1 T
(8,5%)Transport Equipment and Other Transport Industry
Rp 18.1 T(6,9%)
OthersRp 127.6 T
(48,8%)
Food IndustryRp 16.64 T
(16.2%)
Transportation, Warehouse and
TelecommunicationRp 13.33 T
(13.0%)
Food Crops and PlantationRp 12.24 T
(11.9%)
Non Metallic Industry
Rp 11.10 T(10.8%)
Chemical and Pharmaceutical Industry
Rp 9.05 T(8.8%)
OthersRp 40.18 T
(39,2%)
The Investment Coordinating Board of the Republic of Indonesia
16
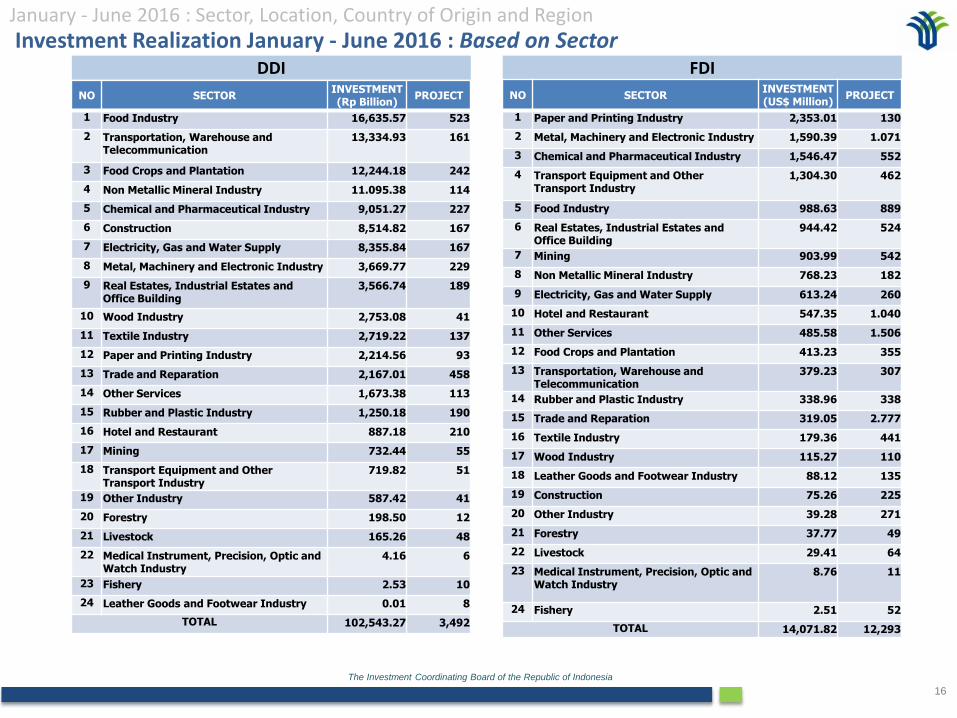
NO SECTORINVESTMENT(Rp Billion)
PROJECT
1 Food Industry 16,635.57 523
2 Transportation, Warehouse and Telecommunication
13,334.93 161
3 Food Crops and Plantation 12,244.18 242
4 Non Metallic Mineral Industry 11.095.38 114
5 Chemical and Pharmaceutical Industry 9,051.27 227
6 Construction 8,514.82 167
7 Electricity, Gas and Water Supply 8,355.84 167
8 Metal, Machinery and Electronic Industry 3,669.77 229
9 Real Estates, Industrial Estates and Office Building
3,566.74 189
10 Wood Industry 2,753.08 41
11 Textile Industry 2,719.22 137
12 Paper and Printing Industry 2,214.56 93
13 Trade and Reparation 2,167.01 458
14 Other Services 1,673.38 113
15 Rubber and Plastic Industry 1,250.18 190
16 Hotel and Restaurant 887.18 210
17 Mining 732.44 55
18 Transport Equipment and Other Transport Industry
719.82 51
19 Other Industry 587.42 41
20 Forestry 198.50 12
21 Livestock 165.26 48
22 Medical Instrument, Precision, Optic and Watch Industry
4.16 6
23 Fishery 2.53 10
24 Leather Goods and Footwear Industry 0.01 8
TOTAL 102,543.27 3,492
FDIDDI
NO SECTORINVESTMENT(US$ Million)
PROJECT
1 Paper and Printing Industry 2,353.01 130
2 Metal, Machinery and Electronic Industry 1,590.39 1.071
3 Chemical and Pharmaceutical Industry 1,546.47 552
4 Transport Equipment and Other Transport Industry
1,304.30 462
5 Food Industry 988.63 889
6 Real Estates, Industrial Estates and Office Building
944.42 524
7 Mining 903.99 542
8 Non Metallic Mineral Industry 768.23 182
9 Electricity, Gas and Water Supply 613.24 260
10 Hotel and Restaurant 547.35 1.040
11 Other Services 485.58 1.506
12 Food Crops and Plantation 413.23 355
13 Transportation, Warehouse and Telecommunication
379.23 307
14 Rubber and Plastic Industry 338.96 338
15 Trade and Reparation 319.05 2.777
16 Textile Industry 179.36 441
17 Wood Industry 115.27 110
18 Leather Goods and Footwear Industry 88.12 135
19 Construction 75.26 225
20 Other Industry 39.28 271
21 Forestry 37.77 49
22 Livestock 29.41 64
23 Medical Instrument, Precision, Optic and Watch Industry
8.76 11
24 Fishery 2.51 52
TOTAL 14,071.82 12,293
Investment Realization January - June 2016 : Based on SectorJanuary - June 2016 : Sector, Location, Country of Origin and Region
The Investment Coordinating Board of the Republic of Indonesia
17
DDI + FDIDDI
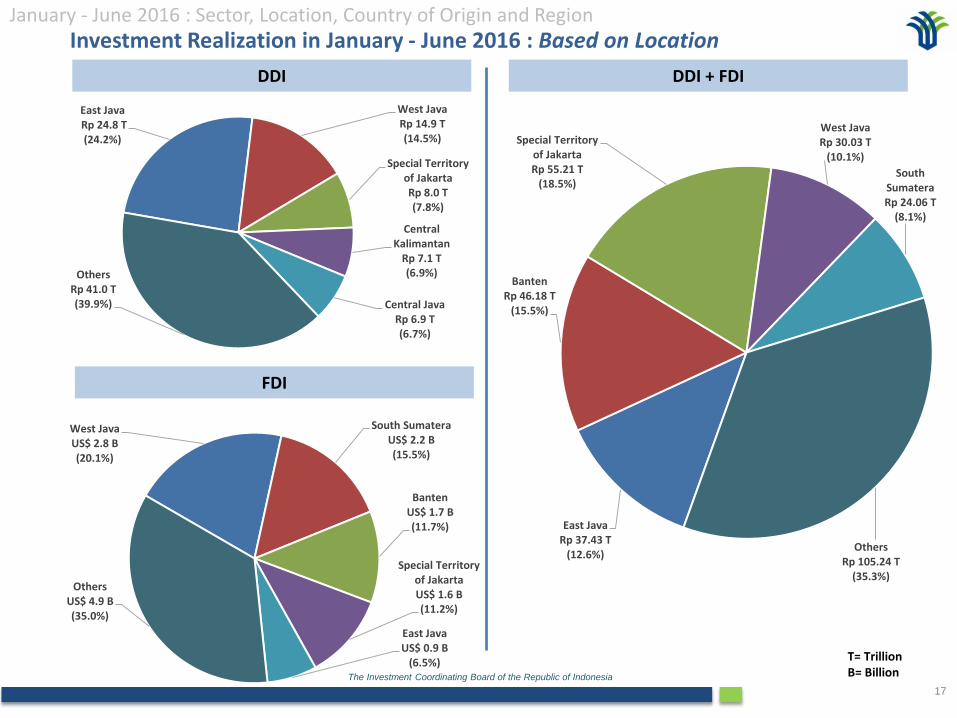
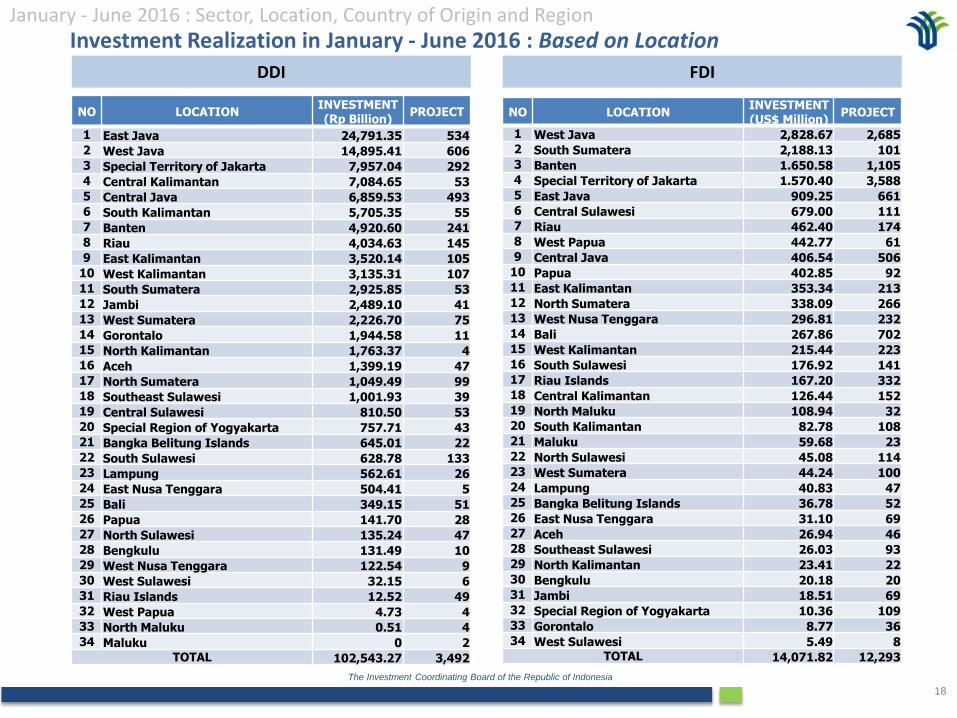
Investment Realization in January - June 2016 : Based on Location
FDI
T= TrillionB= Billion
West JavaUS$ 2.8 B(20.1%)
South SumateraUS$ 2.2 B(15.5%)
BantenUS$ 1.7 B(11.7%)
Special Territory of JakartaUS$ 1.6 B(11.2%)
East JavaUS$ 0.9 B
(6.5%)
OthersUS$ 4.9 B(35.0%)
East JavaRp 24.8 T(24.2%)
West JavaRp 14.9 T(14.5%)
Special Territory of JakartaRp 8.0 T(7.8%)
Central Kalimantan
Rp 7.1 T(6.9%)
Central JavaRp 6.9 T(6.7%)
OthersRp 41.0 T(39.9%)
East JavaRp 37.43 T
(12.6%)
BantenRp 46.18 T
(15.5%)
Special Territory of JakartaRp 55.21 T
(18.5%)
West JavaRp 30.03 T
(10.1%)
South Sumatera Rp 24.06 T
(8.1%)
OthersRp 105.24 T
(35.3%)
January - June 2016 : Sector, Location, Country of Origin and Region
The Investment Coordinating Board of the Republic of Indonesia
18
NO LOCATIONINVESTMENT(US$ Million)
PROJECT
1 West Java 2,828.67 2,6852 South Sumatera 2,188.13 1013 Banten 1.650.58 1,1054 Special Territory of Jakarta 1.570.40 3,5885 East Java 909.25 6616 Central Sulawesi 679.00 1117 Riau 462.40 1748 West Papua 442.77 619 Central Java 406.54 506
10 Papua 402.85 9211 East Kalimantan 353.34 21312 North Sumatera 338.09 26613 West Nusa Tenggara 296.81 23214 Bali 267.86 70215 West Kalimantan 215.44 22316 South Sulawesi 176.92 14117 Riau Islands 167.20 33218 Central Kalimantan 126.44 15219 North Maluku 108.94 3220 South Kalimantan 82.78 10821 Maluku 59.68 2322 North Sulawesi 45.08 11423 West Sumatera 44.24 10024 Lampung 40.83 4725 Bangka Belitung Islands 36.78 5226 East Nusa Tenggara 31.10 6927 Aceh 26.94 4628 Southeast Sulawesi 26.03 9329 North Kalimantan 23.41 2230 Bengkulu 20.18 2031 Jambi 18.51 6932 Special Region of Yogyakarta 10.36 10933 Gorontalo 8.77 3634 West Sulawesi 5.49 8
TOTAL 14,071.82 12,293
FDIDDI
NO LOCATIONINVESTMENT(Rp Billion)
PROJECT
1 East Java 24,791.35 5342 West Java 14,895.41 6063 Special Territory of Jakarta 7,957.04 2924 Central Kalimantan 7,084.65 535 Central Java 6,859.53 4936 South Kalimantan 5,705.35 557 Banten 4,920.60 2418 Riau 4,034.63 1459 East Kalimantan 3,520.14 105
10 West Kalimantan 3,135.31 10711 South Sumatera 2,925.85 5312 Jambi 2,489.10 4113 West Sumatera 2,226.70 7514 Gorontalo 1,944.58 1115 North Kalimantan 1,763.37 416 Aceh 1,399.19 4717 North Sumatera 1,049.49 9918 Southeast Sulawesi 1,001.93 3919 Central Sulawesi 810.50 5320 Special Region of Yogyakarta 757.71 4321 Bangka Belitung Islands 645.01 2222 South Sulawesi 628.78 13323 Lampung 562.61 2624 East Nusa Tenggara 504.41 525 Bali 349.15 5126 Papua 141.70 2827 North Sulawesi 135.24 4728 Bengkulu 131.49 1029 West Nusa Tenggara 122.54 930 West Sulawesi 32.15 631 Riau Islands 12.52 4932 West Papua 4.73 433 North Maluku 0.51 434 Maluku 0 2
TOTAL 102,543.27 3,492
Investment Realization in January - June 2016 : Based on LocationJanuary - June 2016 : Sector, Location, Country of Origin and Region
The Investment Coordinating Board of the Republic of Indonesia
19
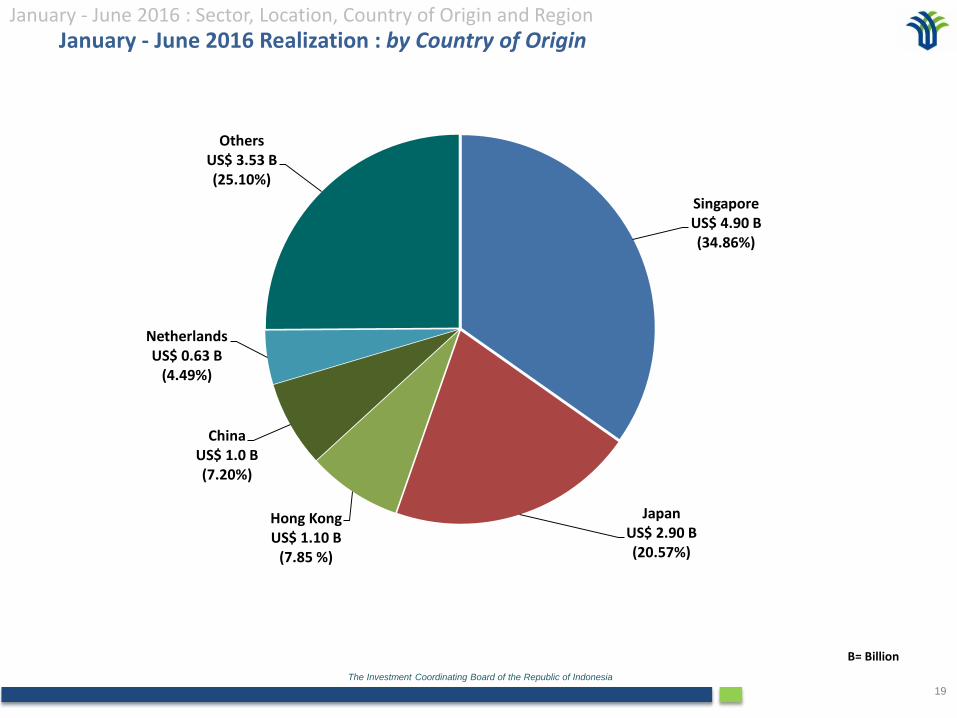
January - June 2016 Realization : by Country of Origin
B= Billion
SingaporeUS$ 4.90 B(34.86%)
JapanUS$ 2.90 B(20.57%)
Hong KongUS$ 1.10 B
(7.85 %)
ChinaUS$ 1.0 B(7.20%)
NetherlandsUS$ 0.63 B
(4.49%)
OthersUS$ 3.53 B(25.10%)
January - June 2016 : Sector, Location, Country of Origin and Region
The Investment Coordinating Board of the Republic of Indonesia
20
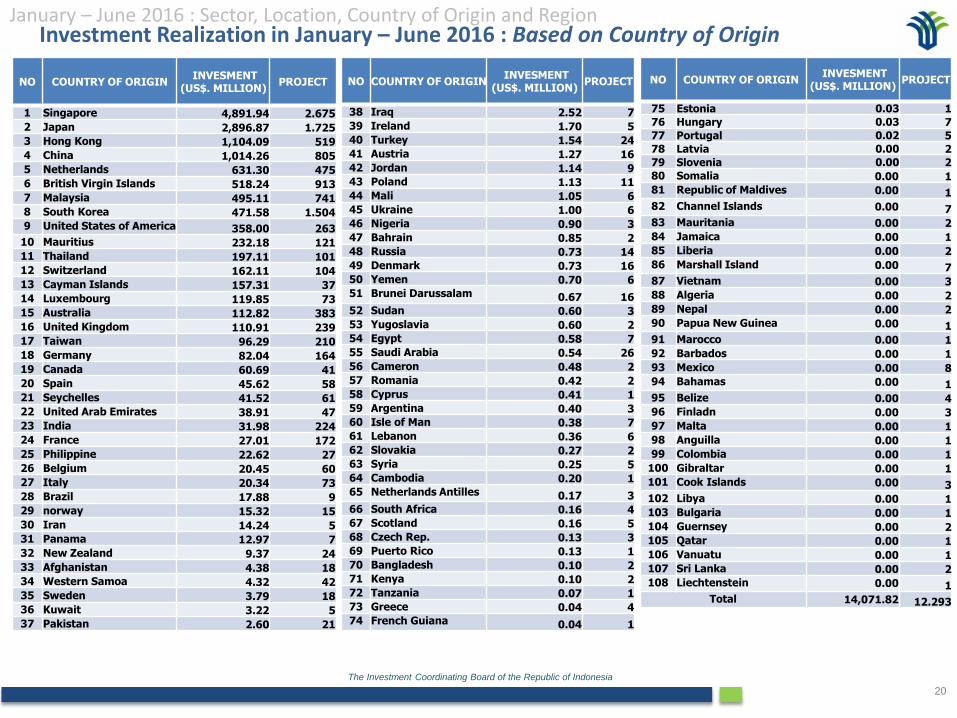
Investment Realization in January – June 2016 : Based on Country of OriginJanuary – June 2016 : Sector, Location, Country of Origin and Region
NO COUNTRY OF ORIGININVESMENT
(US$. MILLION) PROJECT
1 Singapore 4,891.94 2.675
2 Japan 2,896.87 1.725
3 Hong Kong 1,104.09 519
4 China 1,014.26 805
5 Netherlands 631.30 475
6 British Virgin Islands 518.24 913
7 Malaysia 495.11 741
8 South Korea 471.58 1.504
9 United States of America 358.00 263
10 Mauritius 232.18 121
11 Thailand 197.11 101
12 Switzerland 162.11 104
13 Cayman Islands 157.31 37
14 Luxembourg 119.85 73
15 Australia 112.82 383
16 United Kingdom 110.91 239
17 Taiwan 96.29 210
18 Germany 82.04 164
19 Canada 60.69 41
20 Spain 45.62 58
21 Seychelles 41.52 61
22 United Arab Emirates 38.91 47
23 India 31.98 224
24 France 27.01 172
25 Philippine 22.62 27
26 Belgium 20.45 60
27 Italy 20.34 73
28 Brazil 17.88 9
29 norway 15.32 15
30 Iran 14.24 5
31 Panama 12.97 7
32 New Zealand 9.37 24
33 Afghanistan 4.38 18
34 Western Samoa 4.32 42
35 Sweden 3.79 18
36 Kuwait 3.22 5
37 Pakistan 2.60 21
NO COUNTRY OF ORIGININVESMENT
(US$. MILLION) PROJECT
38 Iraq 2.52 7
39 Ireland 1.70 5
40 Turkey 1.54 24
41 Austria 1.27 16
42 Jordan 1.14 9
43 Poland 1.13 11
44 Mali 1.05 6
45 Ukraine 1.00 6
46 Nigeria 0.90 3
47 Bahrain 0.85 2
48 Russia 0.73 14
49 Denmark 0.73 16
50 Yemen 0.70 6
51 Brunei Darussalam 0.67 16
52 Sudan 0.60 3
53 Yugoslavia 0.60 2
54 Egypt 0.58 7
55 Saudi Arabia 0.54 26
56 Cameron 0.48 2
57 Romania 0.42 2
58 Cyprus 0.41 1
59 Argentina 0.40 3
60 Isle of Man 0.38 7
61 Lebanon 0.36 6
62 Slovakia 0.27 2
63 Syria 0.25 5
64 Cambodia 0.20 1
65 Netherlands Antilles 0.17 3
66 South Africa 0.16 4
67 Scotland 0.16 5
68 Czech Rep. 0.13 3
69 Puerto Rico 0.13 1
70 Bangladesh 0.10 2
71 Kenya 0.10 2
72 Tanzania 0.07 1
73 Greece 0.04 4
74 French Guiana 0.04 1
NO COUNTRY OF ORIGININVESMENT
(US$. MILLION) PROJECT
75 Estonia 0.03 1
76 Hungary 0.03 7
77 Portugal 0.02 5
78 Latvia 0.00 2
79 Slovenia 0.00 2
80 Somalia 0.00 1
81 Republic of Maldives 0.00 1
82 Channel Islands 0.00 7
83 Mauritania 0.00 2
84 Jamaica 0.00 1
85 Liberia 0.00 2
86 Marshall Island 0.00 7
87 Vietnam 0.00 3
88 Algeria 0.00 2
89 Nepal 0.00 2
90 Papua New Guinea 0.00 1
91 Marocco 0.00 1
92 Barbados 0.00 1
93 Mexico 0.00 8
94 Bahamas 0.00 1
95 Belize 0.00 4
96 Finladn 0.00 3
97 Malta 0.00 1
98 Anguilla 0.00 1
99 Colombia 0.00 1
100 Gibraltar 0.00 1
101 Cook Islands 0.00 3
102 Libya 0.00 1
103 Bulgaria 0.00 1
104 Guernsey 0.00 2
105 Qatar 0.00 1
106 Vanuatu 0.00 1
107 Sri Lanka 0.00 2
108 Liechtenstein 0.00 1
Total 14,071.82 12.293
The Investment Coordinating Board of the Republic of Indonesia
21
DDI
FDI
DDI and FDI
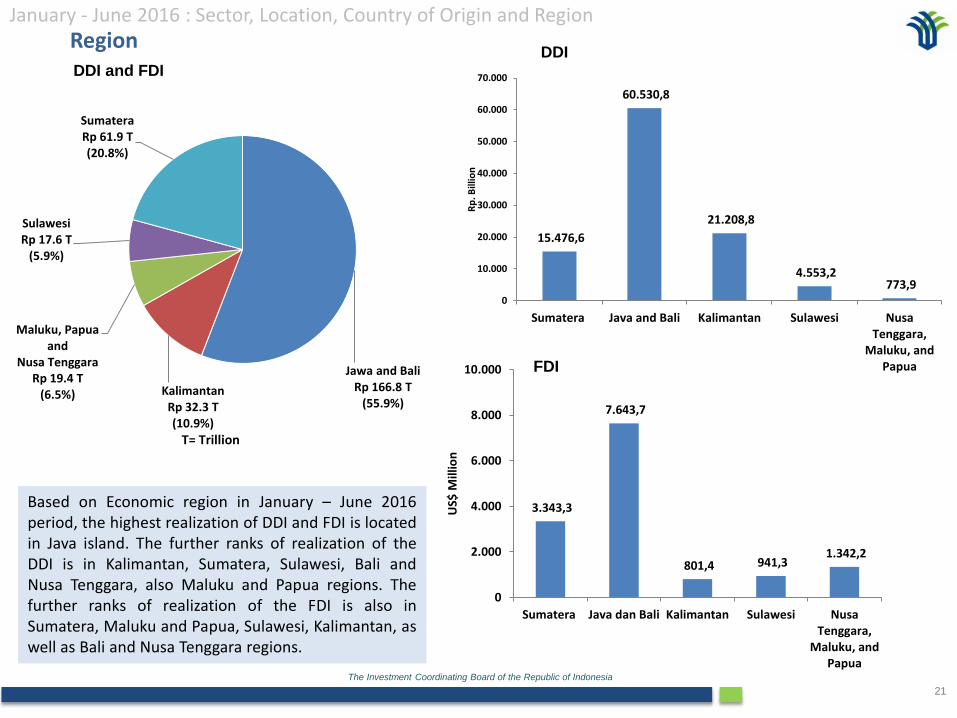
Based on Economic region in January – June 2016period, the highest realization of DDI and FDI is locatedin Java island. The further ranks of realization of theDDI is in Kalimantan, Sumatera, Sulawesi, Bali andNusa Tenggara, also Maluku and Papua regions. Thefurther ranks of realization of the FDI is also inSumatera, Maluku and Papua, Sulawesi, Kalimantan, aswell as Bali and Nusa Tenggara regions.
Region
T= Trillion
January - June 2016 : Sector, Location, Country of Origin and Region
15.476,6
60.530,8
21.208,8
4.553,2 773,9
0
10.000
20.000
30.000
40.000
50.000
60.000
70.000
Sumatera Java and Bali Kalimantan Sulawesi NusaTenggara,
Maluku, andPapua
Rp
. Bill
ion
3.343,3
7.643,7
801,4 941,3 1.342,2
0
2.000
4.000
6.000
8.000
10.000
Sumatera Java dan Bali Kalimantan Sulawesi NusaTenggara,
Maluku, andPapua
US$
Mill
ion
Jawa and BaliRp 166.8 T
(55.9%)Kalimantan
Rp 32.3 T(10.9%)
Maluku, Papua and
Nusa TenggaraRp 19.4 T
(6.5%)
SulawesiRp 17.6 T
(5.9%)
SumateraRp 61.9 T(20.8%)
The Investment Coordinating Board of the Republic of Indonesia
22
IV. Indonesian Labor Absorption
The Investment Coordinating Board of the Republic of Indonesia
23
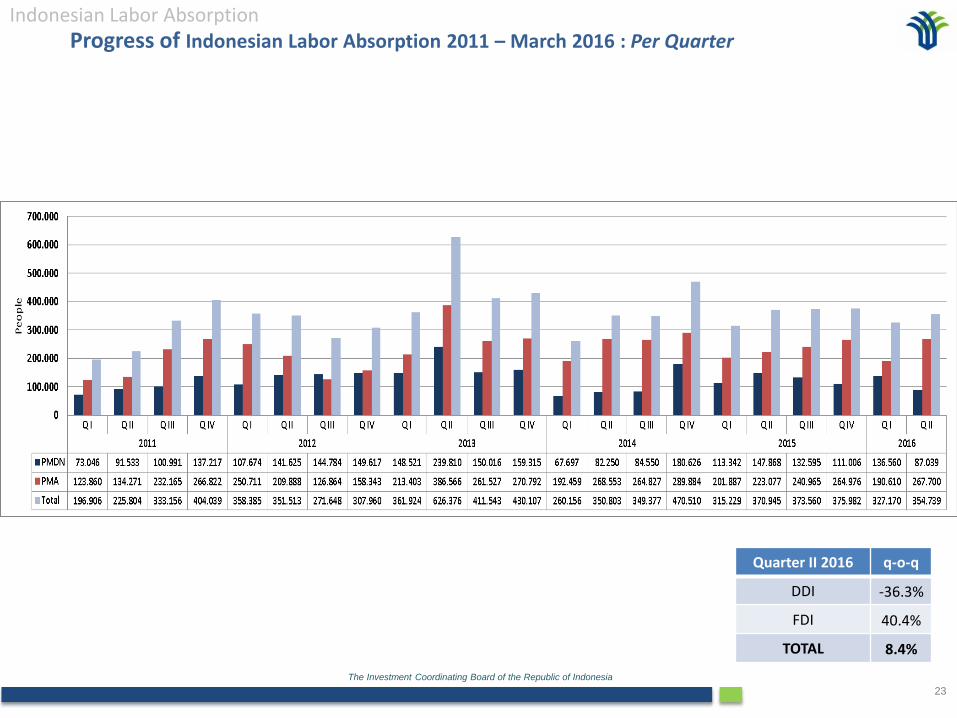
Progress of Indonesian Labor Absorption 2011 – March 2016 : Per QuarterIndonesian Labor Absorption
Quarter II 2016 q-o-q
DDI -36.3%
FDI 40.4%
TOTAL 8.4%
The Investment Coordinating Board of the Republic of Indonesia
24
V. Progress of Investment Realization 2011 - June 2016
The Investment Coordinating Board of the Republic of Indonesia
25
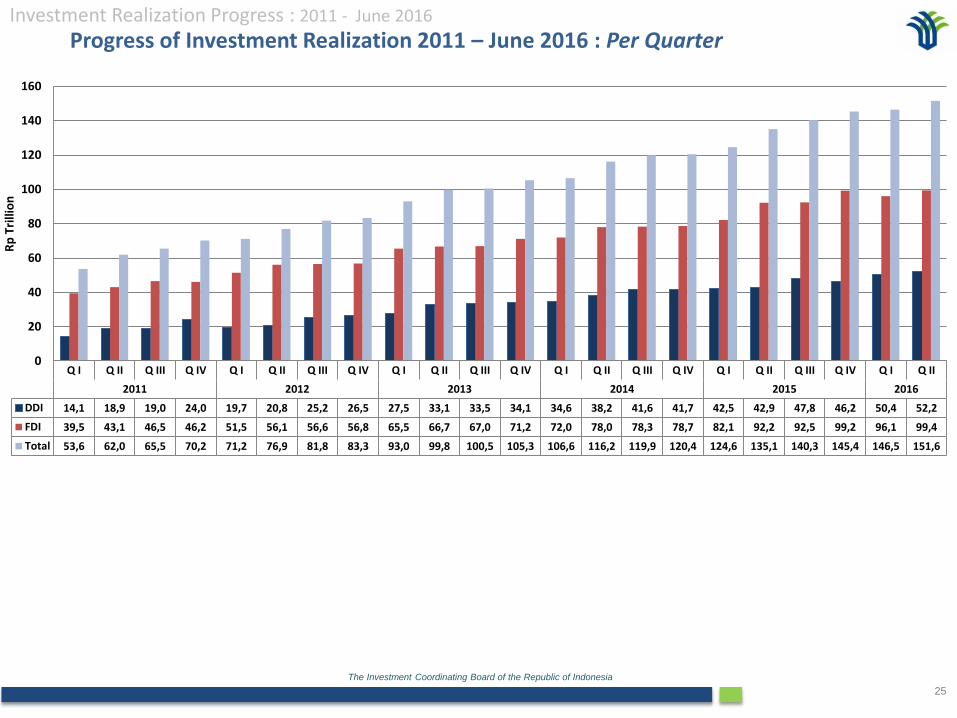
Progress of Investment Realization 2011 – June 2016 : Per QuarterInvestment Realization Progress : 2011 - June 2016
Q I Q II Q III Q IV Q I Q II Q III Q IV Q I Q II Q III Q IV Q I Q II Q III Q IV Q I Q II Q III Q IV Q I Q II
2011 2012 2013 2014 2015 2016
DDI 14,1 18,9 19,0 24,0 19,7 20,8 25,2 26,5 27,5 33,1 33,5 34,1 34,6 38,2 41,6 41,7 42,5 42,9 47,8 46,2 50,4 52,2
FDI 39,5 43,1 46,5 46,2 51,5 56,1 56,6 56,8 65,5 66,7 67,0 71,2 72,0 78,0 78,3 78,7 82,1 92,2 92,5 99,2 96,1 99,4
Total 53,6 62,0 65,5 70,2 71,2 76,9 81,8 83,3 93,0 99,8 100,5 105,3 106,6 116,2 119,9 120,4 124,6 135,1 140,3 145,4 146,5 151,6
0
20
40
60
80
100
120
140
160
Rp
Trill
ion
The Investment Coordinating Board of the Republic of Indonesia
26
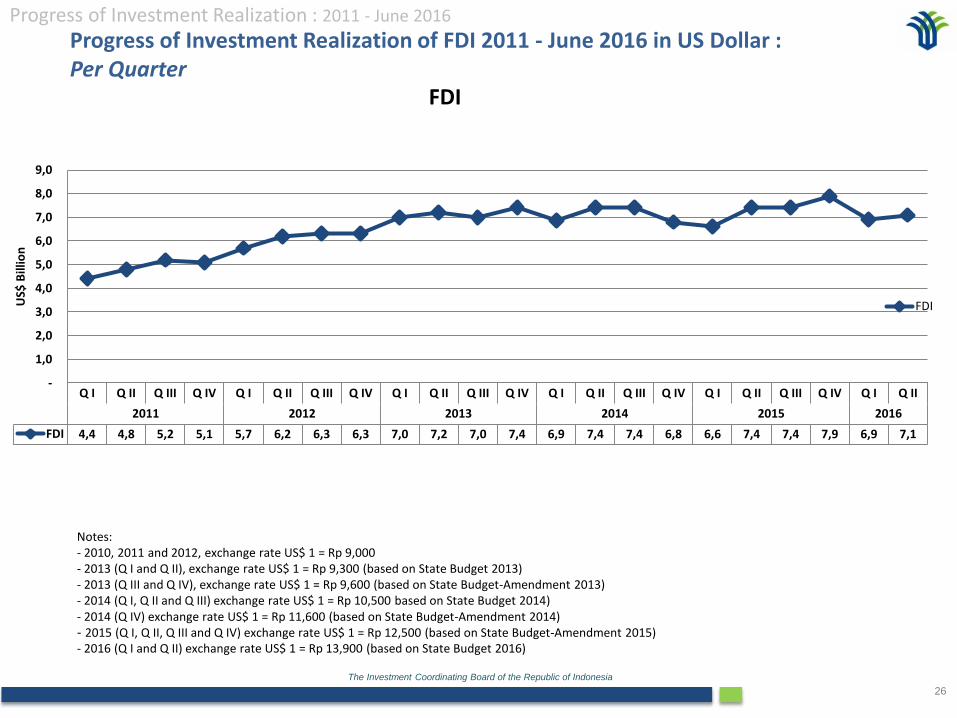
Progress of Investment Realization of FDI 2011 - June 2016 in US Dollar : Per Quarter
Progress of Investment Realization : 2011 - June 2016
Notes:- 2010, 2011 and 2012, exchange rate US$ 1 = Rp 9,000- 2013 (Q I and Q II), exchange rate US$ 1 = Rp 9,300 (based on State Budget 2013)- 2013 (Q III and Q IV), exchange rate US$ 1 = Rp 9,600 (based on State Budget-Amendment 2013)- 2014 (Q I, Q II and Q III) exchange rate US$ 1 = Rp 10,500 based on State Budget 2014)- 2014 (Q IV) exchange rate US$ 1 = Rp 11,600 (based on State Budget-Amendment 2014)- 2015 (Q I, Q II, Q III and Q IV) exchange rate US$ 1 = Rp 12,500 (based on State Budget-Amendment 2015)- 2016 (Q I and Q II) exchange rate US$ 1 = Rp 13,900 (based on State Budget 2016)
Q I Q II Q III Q IV Q I Q II Q III Q IV Q I Q II Q III Q IV Q I Q II Q III Q IV Q I Q II Q III Q IV Q I Q II
2011 2012 2013 2014 2015 2016
FDI 4,4 4,8 5,2 5,1 5,7 6,2 6,3 6,3 7,0 7,2 7,0 7,4 6,9 7,4 7,4 6,8 6,6 7,4 7,4 7,9 6,9 7,1
-
1,0
2,0
3,0
4,0
5,0
6,0
7,0
8,0
9,0
US$
Bill
ion
FDI
FDI
The Investment Coordinating Board of the Republic of Indonesia
27
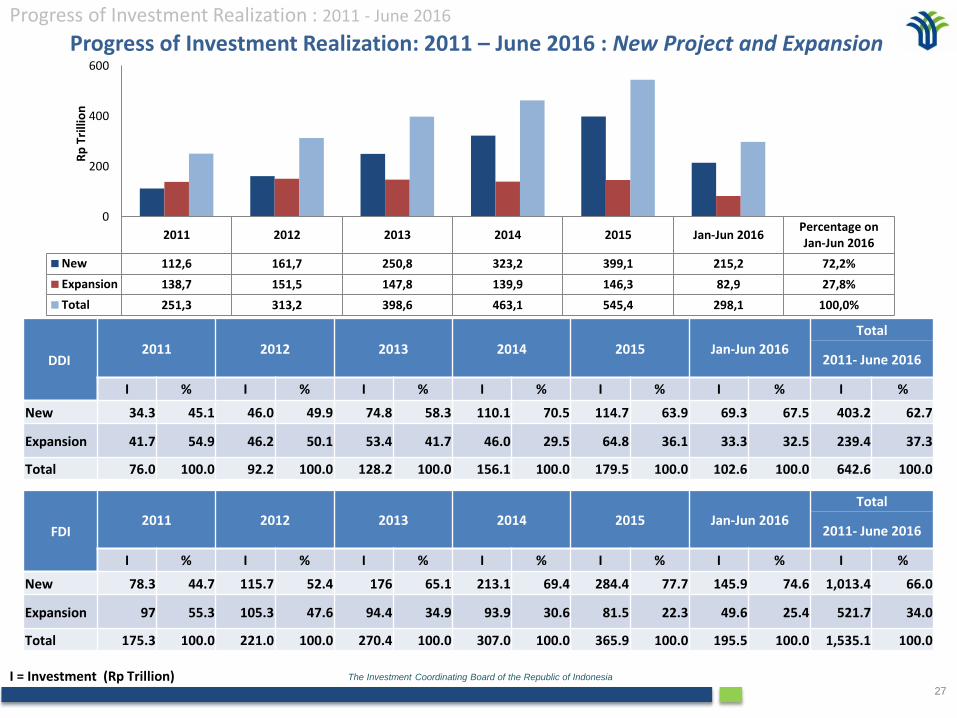
I = Investment (Rp Trillion)
Progress of Investment Realization: 2011 – June 2016 : New Project and Expansion
DDI2011 2012 2013 2014 2015 Jan-Jun 2016
Total
2011- June 2016
I % I % I % I % I % I % I %
New 34.3 45.1 46.0 49.9 74.8 58.3 110.1 70.5 114.7 63.9 69.3 67.5 403.2 62.7
Expansion 41.7 54.9 46.2 50.1 53.4 41.7 46.0 29.5 64.8 36.1 33.3 32.5 239.4 37.3
Total 76.0 100.0 92.2 100.0 128.2 100.0 156.1 100.0 179.5 100.0 102.6 100.0 642.6 100.0
FDI2011 2012 2013 2014 2015 Jan-Jun 2016
Total
2011- June 2016
I % I % I % I % I % I % I %
New 78.3 44.7 115.7 52.4 176 65.1 213.1 69.4 284.4 77.7 145.9 74.6 1,013.4 66.0
Expansion 97 55.3 105.3 47.6 94.4 34.9 93.9 30.6 81.5 22.3 49.6 25.4 521.7 34.0
Total 175.3 100.0 221.0 100.0 270.4 100.0 307.0 100.0 365.9 100.0 195.5 100.0 1,535.1 100.0
Progress of Investment Realization : 2011 - June 2016
2011 2012 2013 2014 2015 Jan-Jun 2016Percentage onJan-Jun 2016
New 112,6 161,7 250,8 323,2 399,1 215,2 72,2%
Expansion 138,7 151,5 147,8 139,9 146,3 82,9 27,8%
Total 251,3 313,2 398,6 463,1 545,4 298,1 100,0%
0
200
400
600R
p T
rilli
on
The Investment Coordinating Board of the Republic of Indonesia
28
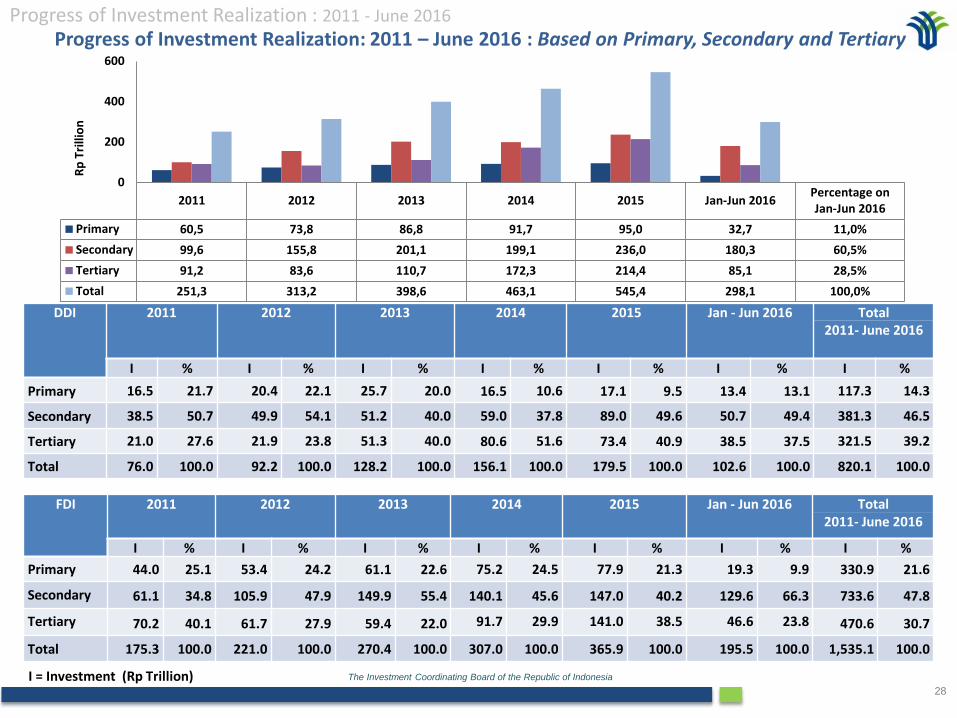
I = Investment (Rp Trillion)
FDI 2011 2012 2013 2014 2015 Jan - Jun 2016 Total2011- June 2016
I % I % I % I % I % I % I %
Primary 44.0 25.1 53.4 24.2 61.1 22.6 75.2 24.5 77.9 21.3 19.3 9.9 330.9 21.6
Secondary 61.1 34.8 105.9 47.9 149.9 55.4 140.1 45.6 147.0 40.2 129.6 66.3 733.6 47.8
Tertiary 70.2 40.1 61.7 27.9 59.4 22.0 91.7 29.9 141.0 38.5 46.6 23.8 470.6 30.7
Total 175.3 100.0 221.0 100.0 270.4 100.0 307.0 100.0 365.9 100.0 195.5 100.0 1,535.1 100.0
DDI 2011 2012 2013 2014 2015 Jan - Jun 2016 Total2011- June 2016
I % I % I % I % I % I % I %
Primary 16.5 21.7 20.4 22.1 25.7 20.0 16.5 10.6 17.1 9.5 13.4 13.1 117.3 14.3
Secondary 38.5 50.7 49.9 54.1 51.2 40.0 59.0 37.8 89.0 49.6 50.7 49.4 381.3 46.5
Tertiary 21.0 27.6 21.9 23.8 51.3 40.0 80.6 51.6 73.4 40.9 38.5 37.5 321.5 39.2
Total 76.0 100.0 92.2 100.0 128.2 100.0 156.1 100.0 179.5 100.0 102.6 100.0 820.1 100.0
Progress of Investment Realization : 2011 - June 2016
Progress of Investment Realization: 2011 – June 2016 : Based on Primary, Secondary and Tertiary
2011 2012 2013 2014 2015 Jan-Jun 2016Percentage onJan-Jun 2016
Primary 60,5 73,8 86,8 91,7 95,0 32,7 11,0%
Secondary 99,6 155,8 201,1 199,1 236,0 180,3 60,5%
Tertiary 91,2 83,6 110,7 172,3 214,4 85,1 28,5%
Total 251,3 313,2 398,6 463,1 545,4 298,1 100,0%
0
200
400
600
Rp
Tri
llio
n
The Investment Coordinating Board of the Republic of Indonesia
29
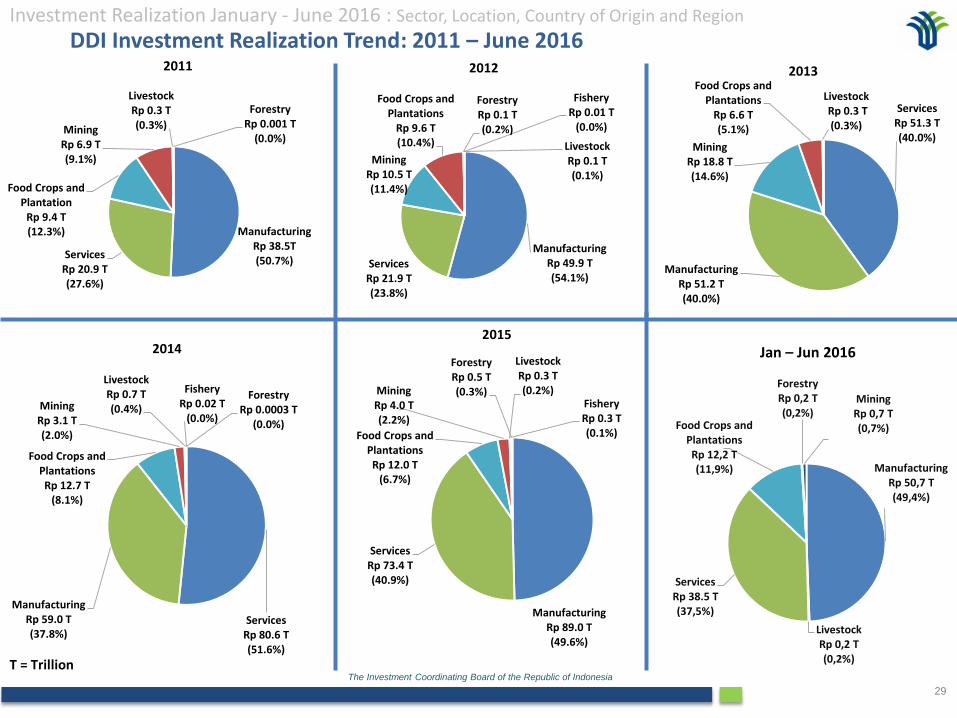
ManufacturingRp 89.0 T(49.6%)
ServicesRp 73.4 T(40.9%)
Food Crops and PlantationsRp 12.0 T
(6.7%)
MiningRp 4.0 T(2.2%)
LivestockRp 0.3 T(0.2%)
FisheryRp 0.3 T(0.1%)
ForestryRp 0.5 T(0.3%)
2015
ServicesRp 80.6 T(51.6%)
ManufacturingRp 59.0 T(37.8%)
Food Crops and PlantationsRp 12.7 T
(8.1%)
MiningRp 3.1 T(2.0%)
LivestockRp 0.7 T(0.4%)
FisheryRp 0.02 T
(0.0%)
ForestryRp 0.0003 T
(0.0%)
2014
ManufacturingRp 49.9 T(54.1%)
ServicesRp 21.9 T(23.8%)
MiningRp 10.5 T(11.4%)
Food Crops and Plantations
Rp 9.6 T(10.4%)
ForestryRp 0.1 T(0.2%)
LivestockRp 0.1 T(0.1%)
FisheryRp 0.01 T
(0.0%)
2012
ServicesRp 51.3 T(40.0%)
ManufacturingRp 51.2 T(40.0%)
MiningRp 18.8 T(14.6%)
Food Crops and Plantations
Rp 6.6 T(5.1%)
LivestockRp 0.3 T (0.3%)
2013
DDI Investment Realization Trend: 2011 – June 2016
T = Trillion
ManufacturingRp 38.5T(50.7%)
ServicesRp 20.9 T(27.6%)
Food Crops and Plantation
Rp 9.4 T(12.3%)
MiningRp 6.9 T(9.1%)
LivestockRp 0.3 T(0.3%)
ForestryRp 0.001 T
(0.0%)
2011
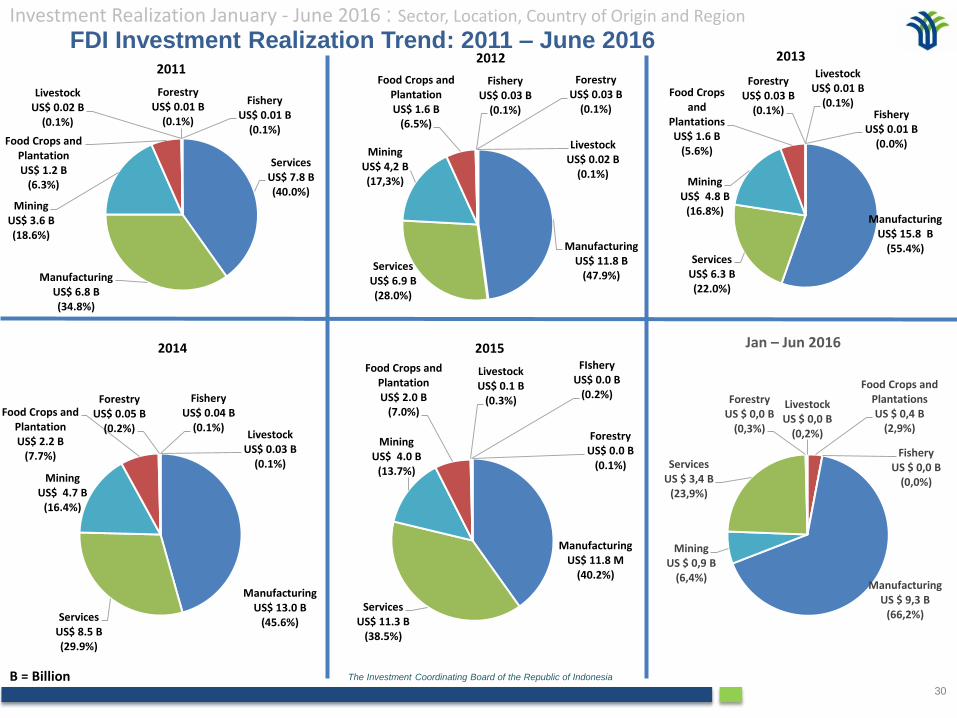
Investment Realization January - June 2016 : Sector, Location, Country of Origin and Region
ManufacturingRp 50,7 T(49,4%)
LivestockRp 0,2 T(0,2%)
ServicesRp 38.5 T(37,5%)
Food Crops and PlantationsRp 12,2 T (11,9%)
ForestryRp 0,2 T(0,2%)
MiningRp 0,7 T(0,7%)
Jan – Jun 2016
The Investment Coordinating Board of the Republic of Indonesia
30
ServicesUS$ 7.8 B(40.0%)
ManufacturingUS$ 6.8 B(34.8%)
MiningUS$ 3.6 B(18.6%)
Food Crops and PlantationUS$ 1.2 B
(6.3%)
LivestockUS$ 0.02 B
(0.1%)
ForestryUS$ 0.01 B
(0.1%)
FisheryUS$ 0.01 B
(0.1%)
2011
FDI Investment Realization Trend: 2011 – June 2016
B = Billion
ManufacturingUS$ 11.8 B
(47.9%)Services
US$ 6.9 B(28.0%)
MiningUS$ 4,2 B(17,3%)
Food Crops and PlantationUS$ 1.6 B
(6.5%)
FisheryUS$ 0.03 B
(0.1%)
ForestryUS$ 0.03 B
(0.1%)
LivestockUS$ 0.02 B
(0.1%)
2012
ManufacturingUS$ 15.8 B
(55.4%)Services
US$ 6.3 B(22.0%)
MiningUS$ 4.8 B
(16.8%)
Food Crops and
PlantationsUS$ 1.6 B
(5.6%)
ForestryUS$ 0.03 B
(0.1%)
LivestockUS$ 0.01 B
(0.1%)Fishery
US$ 0.01 B(0.0%)
2013
Investment Realization January - June 2016 : Sector, Location, Country of Origin and Region
Food Crops and PlantationsUS $ 0,4 B
(2,9%)
FisheryUS $ 0,0 B
(0,0%)
ManufacturingUS $ 9,3 B
(66,2%)
MiningUS $ 0,9 B
(6,4%)
ServicesUS $ 3,4 B
(23,9%)
ForestryUS $ 0,0 B
(0,3%)
LivestockUS $ 0,0 B
(0,2%)
Jan – Jun 2016
ManufacturingUS$ 11.8 M
(40.2%)
ServicesUS$ 11.3 B
(38.5%)
MiningUS$ 4.0 B
(13.7%)
Food Crops and PlantationUS$ 2.0 B
(7.0%)
LivestockUS$ 0.1 B
(0.3%)
FIsheryUS$ 0.0 B
(0.2%)
ForestryUS$ 0.0 B
(0.1%)
2015
ManufacturingUS$ 13.0 B
(45.6%)ServicesUS$ 8.5 B(29.9%)
MiningUS$ 4.7 B
(16.4%)
Food Crops and PlantationUS$ 2.2 B
(7.7%)
ForestryUS$ 0.05 B
(0.2%)
FisheryUS$ 0.04 B
(0.1%)Livestock
US$ 0.03 B(0.1%)
2014
The Investment Coordinating Board of the Republic of Indonesia
31
T = Trillion
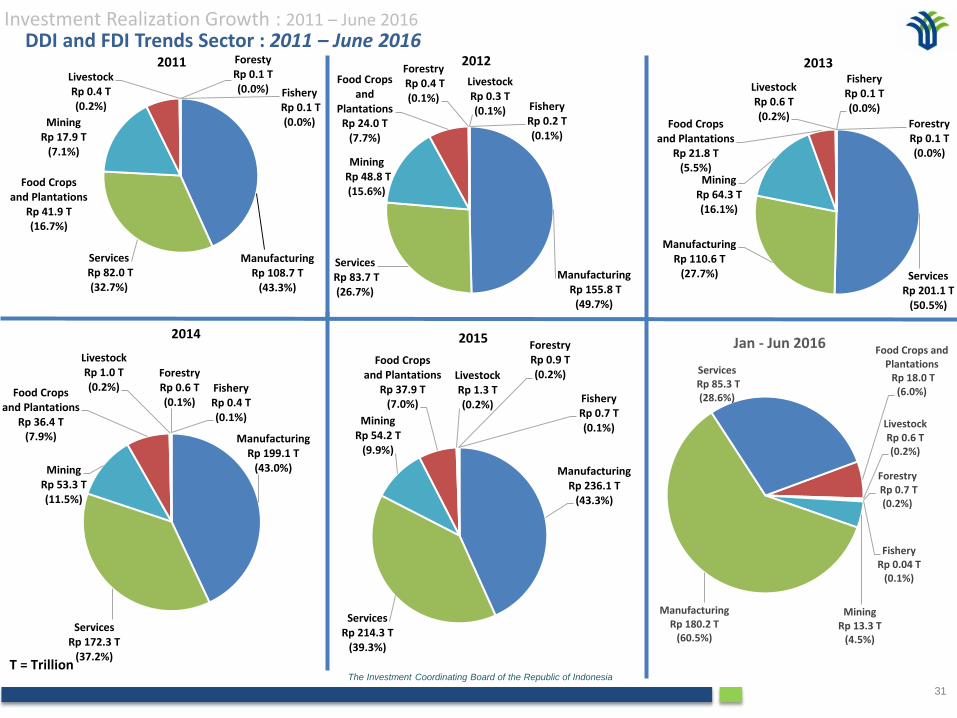
ManufacturingRp 108.7 T
(43.3%)
ServicesRp 82.0 T (32.7%)
Food Crops and Plantations
Rp 41.9 T (16.7%)
MiningRp 17.9 T
(7.1%)
LivestockRp 0.4 T (0.2%)
ForestyRp 0.1 T (0.0%) Fishery
Rp 0.1 T (0.0%)
2011
ManufacturingRp 155.8 T
(49.7%)
ServicesRp 83.7 T (26.7%)
MiningRp 48.8 T (15.6%)
Food Crops and
PlantationsRp 24.0 T
(7.7%)
ForestryRp 0.4 T (0.1%)
LivestockRp 0.3 T (0.1%) Fishery
Rp 0.2 T(0.1%)
2012
ServicesRp 201.1 T
(50.5%)
ManufacturingRp 110.6 T
(27.7%)
MiningRp 64.3 T(16.1%)
Food Cropsand Plantations
Rp 21.8 T(5.5%)
LivestockRp 0.6 T(0.2%)
FisheryRp 0.1 T(0.0%)
ForestryRp 0.1 T(0.0%)
2013
DDI and FDI Trends Sector : 2011 – June 2016
ManufacturingRp 199.1 T
(43.0%)
ServicesRp 172.3 T
(37.2%)
MiningRp 53.3 T(11.5%)
Food Crops and Plantations
Rp 36.4 T(7.9%)
LivestockRp 1.0 T(0.2%)
ForestryRp 0.6 T(0.1%)
FisheryRp 0.4 T(0.1%)
2014
ManufacturingRp 236.1 T
(43.3%)
ServicesRp 214.3 T
(39.3%)
MiningRp 54.2 T
(9.9%)
Food Cropsand Plantations
Rp 37.9 T(7.0%)
LivestockRp 1.3 T(0.2%)
ForestryRp 0.9 T(0.2%)
FisheryRp 0.7 T(0.1%)
2015
Investment Realization Growth : 2011 – June 2016
Food Crops and Plantations
Rp 18.0 T(6.0%)
LivestockRp 0.6 T (0.2%)
ForestryRp 0.7 T (0.2%)
FisheryRp 0.04 T
(0.1%)
MiningRp 13.3 T
(4.5%)
ManufacturingRp 180.2 T
(60.5%)
ServicesRp 85.3 T (28.6%)
Jan - Jun 2016
The Investment Coordinating Board of the Republic of Indonesia
32
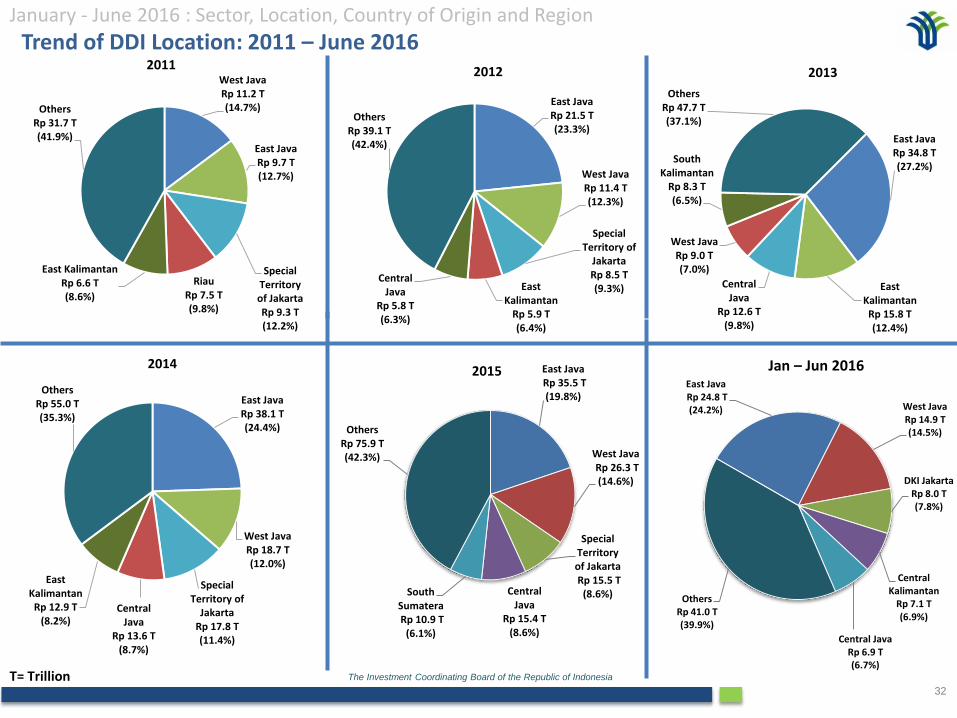
East JavaRp 34.8 T(27.2%)
East KalimantanRp 15.8 T(12.4%)
Central Java
Rp 12.6 T(9.8%)
West JavaRp 9.0 T(7.0%)
South Kalimantan
Rp 8.3 T(6.5%)
OthersRp 47.7 T(37.1%)
2013
Trend of DDI Location: 2011 – June 2016
T= Trillion
West JavaRp 11.2 T(14.7%)
East JavaRp 9.7 T(12.7%)
Special Territory of JakartaRp 9.3 T(12.2%)
RiauRp 7.5 T(9.8%)
East KalimantanRp 6.6 T(8.6%)
OthersRp 31.7 T(41.9%)
2011
East JavaRp 21.5 T(23.3%)
West JavaRp 11.4 T(12.3%)
Special Territory of
JakartaRp 8.5 T(9.3%)East
KalimantanRp 5.9 T(6.4%)
Central Java
Rp 5.8 T(6.3%)
OthersRp 39.1 T(42.4%)
2012
East JavaRp 38.1 T(24.4%)
West JavaRp 18.7 T(12.0%)
Special Territory of
JakartaRp 17.8 T(11.4%)
Central Java
Rp 13.6 T(8.7%)
East KalimantanRp 12.9 T
(8.2%)
OthersRp 55.0 T(35.3%)
2014 East JavaRp 35.5 T (19.8%)
West JavaRp 26.3 T (14.6%)
Special Territory of JakartaRp 15.5 T
(8.6%)Central Java
Rp 15.4 T (8.6%)
South SumateraRp 10.9 T
(6.1%)
OthersRp 75.9 T (42.3%)
2015East JavaRp 24.8 T(24.2%) West Java
Rp 14.9 T(14.5%)
DKI JakartaRp 8.0 T(7.8%)
Central Kalimantan
Rp 7.1 T(6.9%)
Central Java Rp 6.9 T(6.7%)
OthersRp 41.0 T(39.9%)
Jan – Jun 2016
January - June 2016 : Sector, Location, Country of Origin and Region
The Investment Coordinating Board of the Republic of Indonesia
33
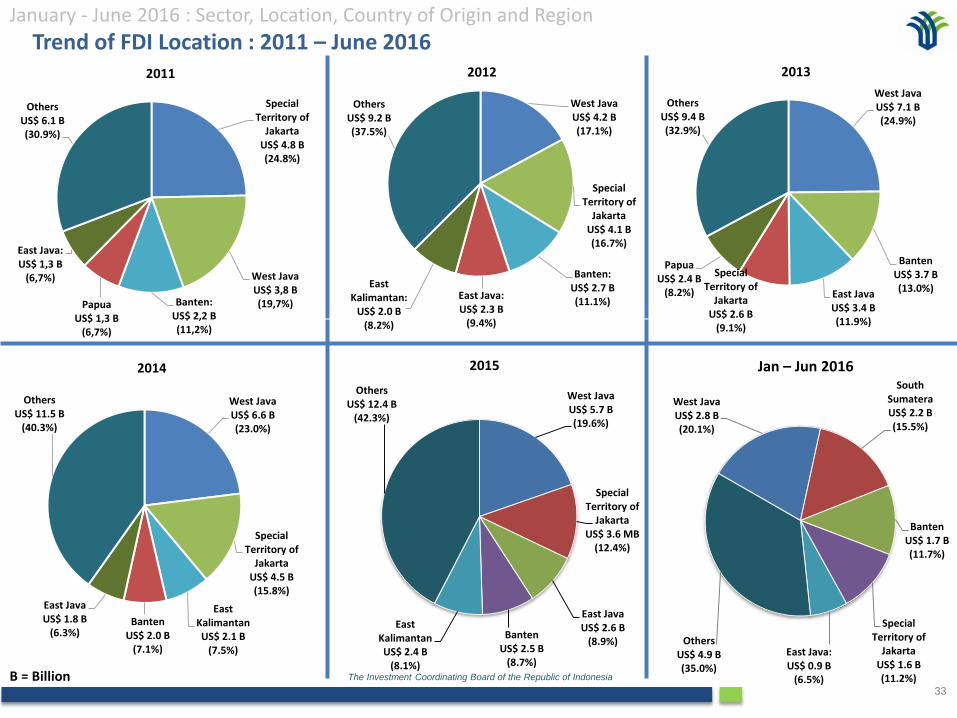
Trend of FDI Location : 2011 – June 2016
B = Billion
Special Territory of
Jakarta US$ 4.8 B(24.8%)
West JavaUS$ 3,8 B(19,7%)Banten:
US$ 2,2 B(11,2%)
PapuaUS$ 1,3 B
(6,7%)
East Java:US$ 1,3 B
(6,7%)
OthersUS$ 6.1 B(30.9%)
2011
West JavaUS$ 6.6 B(23.0%)
Special Territory of
JakartaUS$ 4.5 B(15.8%)
East KalimantanUS$ 2.1 B
(7.5%)
BantenUS$ 2.0 B
(7.1%)
East JavaUS$ 1.8 B
(6.3%)
OthersUS$ 11.5 B
(40.3%)
2014
West Java US$ 4.2 B(17.1%)
Special Territory of
JakartaUS$ 4.1 B(16.7%)
Banten:US$ 2.7 B(11.1%)
East Java:US$ 2.3 B
(9.4%)
East Kalimantan:
US$ 2.0 B(8.2%)
OthersUS$ 9.2 B(37.5%)
2012
West JavaUS$ 7.1 B (24.9%)
BantenUS$ 3.7 B(13.0%)
East JavaUS$ 3.4 B(11.9%)
Special Territory of
JakartaUS$ 2.6 B
(9.1%)
PapuaUS$ 2.4 B
(8.2%)
OthersUS$ 9.4 B(32.9%)
2013
West JavaUS$ 5.7 B (19.6%)
Special Territory of
JakartaUS$ 3.6 MB
(12.4%)
East Java US$ 2.6 B
(8.9%)Banten
US$ 2.5 B (8.7%)
East Kalimantan US$ 2.4 B
(8.1%)
OthersUS$ 12.4 B
(42.3%)
2015
West JavaUS$ 2.8 B (20.1%)
South SumateraUS$ 2.2 B(15.5%)
BantenUS$ 1.7 B (11.7%)
Special Territory of
JakartaUS$ 1.6 B(11.2%)
East Java:US$ 0.9 B
(6.5%)
OthersUS$ 4.9 B(35.0%)
Jan – Jun 2016
January - June 2016 : Sector, Location, Country of Origin and Region
The Investment Coordinating Board of the Republic of Indonesia
34
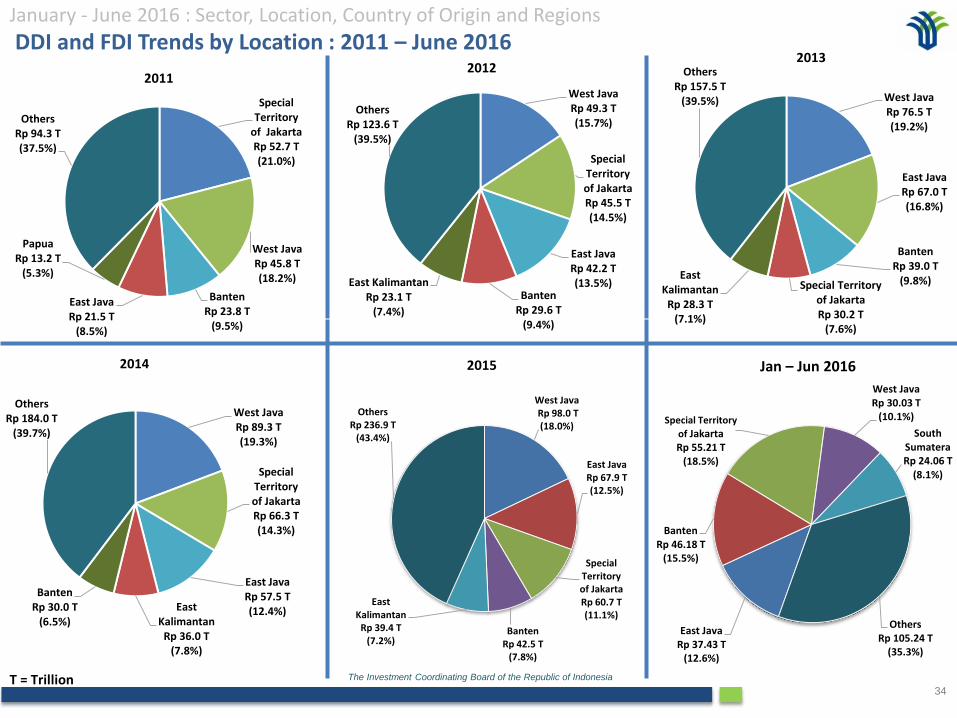
DDI and FDI Trends by Location : 2011 – June 2016
West JavaRp 76.5 T(19.2%)
East JavaRp 67.0 T(16.8%)
BantenRp 39.0 T
(9.8%)Special Territory of JakartaRp 30.2 T
(7.6%)
East Kalimantan
Rp 28.3 T(7.1%)
OthersRp 157.5 T
(39.5%)
2013
T = Trillion
Special Territory
of JakartaRp 52.7 T(21.0%)
West JavaRp 45.8 T(18.2%)
BantenRp 23.8 T
(9.5%)
East JavaRp 21.5 T
(8.5%)
PapuaRp 13.2 T
(5.3%)
OthersRp 94.3 T(37.5%)
2011West JavaRp 49.3 T(15.7%)
Special Territory of JakartaRp 45.5 T(14.5%)
East JavaRp 42.2 T(13.5%)
BantenRp 29.6 T
(9.4%)
East KalimantanRp 23.1 T
(7.4%)
OthersRp 123.6 T
(39.5%)
2012
West JavaRp 89.3 T(19.3%)
Special Territory of JakartaRp 66.3 T(14.3%)
East JavaRp 57.5 T(12.4%)East
Kalimantan Rp 36.0 T
(7.8%)
BantenRp 30.0 T
(6.5%)
OthersRp 184.0 T
(39.7%)
2014
January - June 2016 : Sector, Location, Country of Origin and Regions
West JavaRp 98.0 T (18.0%)
East JavaRp 67.9 T (12.5%)
Special Territory of JakartaRp 60.7 T (11.1%)
BantenRp 42.5 T
(7.8%)
East Kalimantan
Rp 39.4 T (7.2%)
OthersRp 236.9 T
(43.4%)
2015
East JavaRp 37.43 T
(12.6%)
BantenRp 46.18 T
(15.5%)
Special Territory
of JakartaRp 55.21 T
(18.5%)
West JavaRp 30.03 T
(10.1%)
South SumateraRp 24.06 T
(8.1%)
OthersRp 105.24 T
(35.3%)
Jan – Jun 2016
The Investment Coordinating Board of the Republic of Indonesia
35
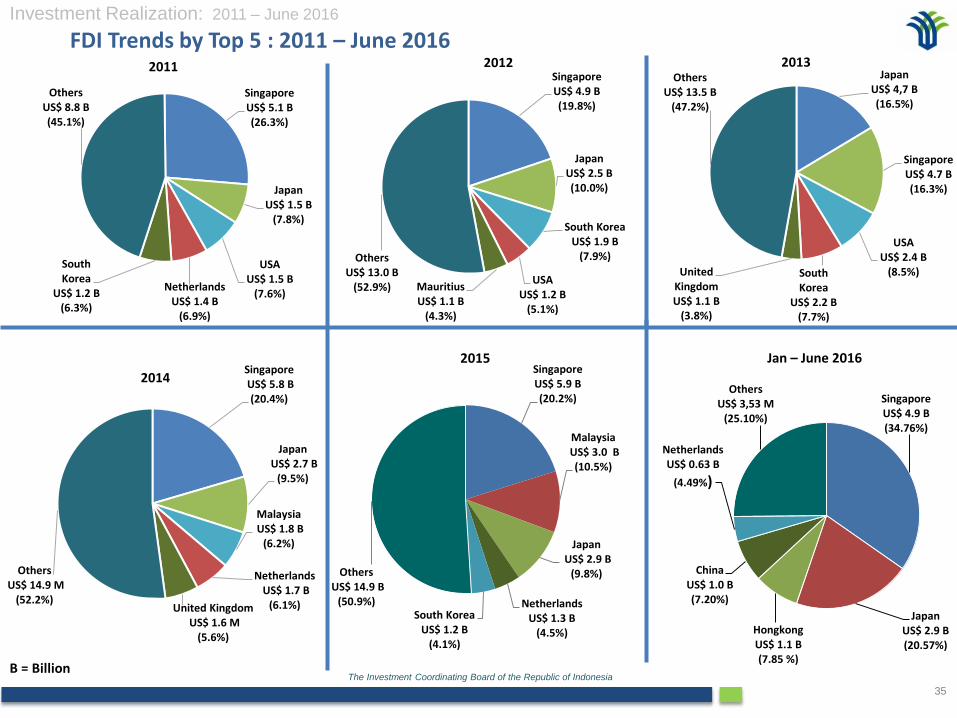
FDI Trends by Top 5 : 2011 – June 2016
B = Billion
SingaporeUS$ 5.1 B(26.3%)
JapanUS$ 1.5 B
(7.8%)
USA US$ 1.5 B
(7.6%)Netherlands
US$ 1.4 B(6.9%)
South Korea
US$ 1.2 B(6.3%)
OthersUS$ 8.8 B(45.1%)
2011SingaporeUS$ 4.9 B(19.8%)
JapanUS$ 2.5 B(10.0%)
South KoreaUS$ 1.9 B
(7.9%)
USAUS$ 1.2 B
(5.1%)
MauritiusUS$ 1.1 B
(4.3%)
OthersUS$ 13.0 B
(52.9%)
2012Japan
US$ 4,7 B(16.5%)
SingaporeUS$ 4.7 B(16.3%)
USAUS$ 2.4 B
(8.5%)South Korea
US$ 2.2 B(7.7%)
United KingdomUS$ 1.1 B
(3.8%)
OthersUS$ 13.5 B
(47.2%)
2013
SingaporeUS$ 5.8 B(20.4%)
JapanUS$ 2.7 B
(9.5%)
MalaysiaUS$ 1.8 B
(6.2%)
NetherlandsUS$ 1.7 B
(6.1%)United KingdomUS$ 1.6 M
(5.6%)
OthersUS$ 14.9 M
(52.2%)
2014
Investment Realization: 2011 – June 2016
SingaporeUS$ 5.9 B (20.2%)
MalaysiaUS$ 3.0 B (10.5%)
JapanUS$ 2.9 B
(9.8%)
NetherlandsUS$ 1.3 B
(4.5%)
South KoreaUS$ 1.2 B
(4.1%)
OthersUS$ 14.9 B
(50.9%)
2015
SingaporeUS$ 4.9 B(34.76%)
JapanUS$ 2.9 B(20.57%)
HongkongUS$ 1.1 B(7.85 %)
ChinaUS$ 1.0 B(7.20%)
NetherlandsUS$ 0.63 B
(4.49%)
OthersUS$ 3,53 M
(25.10%)
Jan – June 2016
The Investment Coordinating Board of the Republic of Indonesia
36
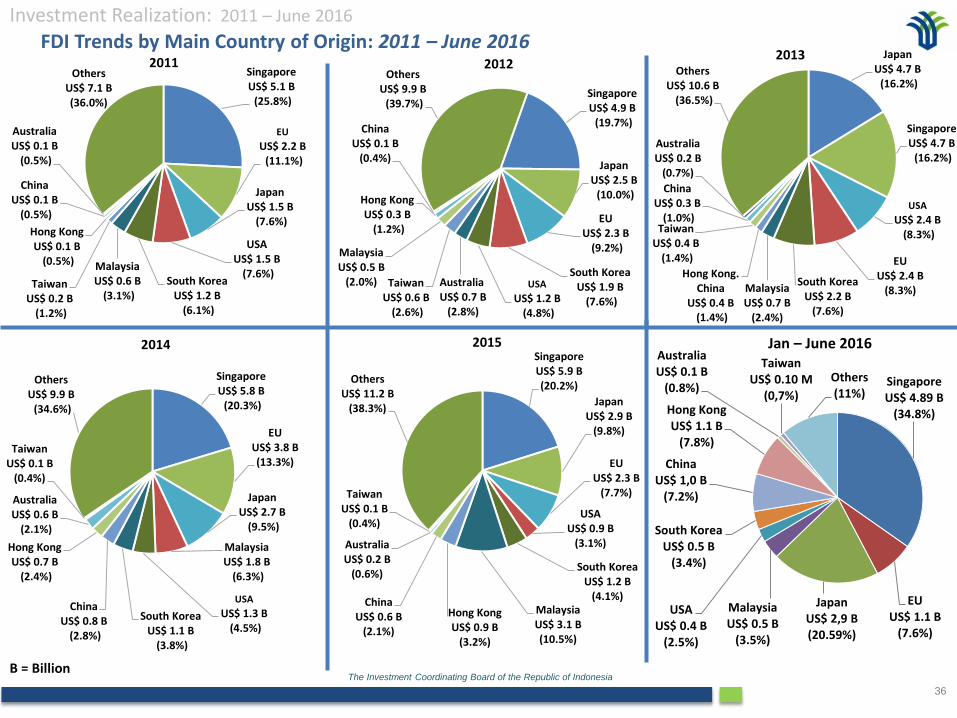
FDI Trends by Main Country of Origin: 2011 – June 2016
B = Billion
Singapore US$ 4.9 B
(19.7%)
Japan US$ 2.5 B
(10.0%)
EUUS$ 2.3 B
(9.2%)
South Korea US$ 1.9 B
(7.6%)
USA
US$ 1.2 B(4.8%)
Australia US$ 0.7 B
(2.8%)
TaiwanUS$ 0.6 B
(2.6%)
Malaysia US$ 0.5 B
(2.0%)
Hong KongUS$ 0.3 B
(1.2%)
China US$ 0.1 B
(0.4%)
Others US$ 9.9 B
(39.7%)
2012Japan
US$ 4.7 B(16.2%)
Singapore US$ 4.7 B
(16.2%)
USA
US$ 2.4 B(8.3%)
EUUS$ 2.4 B
(8.3%)South Korea
US$ 2.2 B (7.6%)
Malaysia US$ 0.7 B
(2.4%)
Hong Kong. China
US$ 0.4 B(1.4%)
Taiwan US$ 0.4 B
(1.4%)
China US$ 0.3 B
(1.0%)
Australia US$ 0.2 B
(0.7%)
Others US$ 10.6 B
(36.5%)
2013
Singapore US$ 5.8 B
(20.3%)
EUUS$ 3.8 B (13.3%)
Japan US$ 2.7 B
(9.5%)
Malaysia US$ 1.8 B
(6.3%)
USA
US$ 1.3 B(4.5%)
South Korea US$ 1.1 B
(3.8%)
China US$ 0.8 B
(2.8%)
Hong KongUS$ 0.7 B
(2.4%)
Australia US$ 0.6 B
(2.1%)
Taiwan US$ 0.1 B
(0.4%)
Others US$ 9.9 B
(34.6%)
2014
Singapore US$ 5.1 B
(25.8%)
EU
US$ 2.2 B(11.1%)
Japan US$ 1.5 B
(7.6%)
USA US$ 1.5 B
(7.6%)South Korea
US$ 1.2 B(6.1%)
MalaysiaUS$ 0.6 B
(3.1%)Taiwan
US$ 0.2 B(1.2%)
Hong KongUS$ 0.1 B
(0.5%)
China US$ 0.1 B
(0.5%)
Australia US$ 0.1 B
(0.5%)
Others US$ 7.1 B (36.0%)
2011
Investment Realization: 2011 – June 2016
SingaporeUS$ 5.9 B(20.2%)
JapanUS$ 2.9 B
(9.8%)
EUUS$ 2.3 B
(7.7%)
USAUS$ 0.9 B
(3.1%)
South KoreaUS$ 1.2 B
(4.1%)MalaysiaUS$ 3.1 B(10.5%)
Hong KongUS$ 0.9 B
(3.2%)
ChinaUS$ 0.6 B
(2.1%)
AustraliaUS$ 0.2 B
(0.6%)
TaiwanUS$ 0.1 B
(0.4%)
OthersUS$ 11.2 B
(38.3%)
2015
SingaporeUS$ 4.89 B
(34.8%)
EUUS$ 1.1 B
(7.6%)
JapanUS$ 2,9 B(20.59%)
MalaysiaUS$ 0.5 B
(3.5%)
USAUS$ 0.4 B
(2.5%)
South KoreaUS$ 0.5 B
(3.4%)
ChinaUS$ 1,0 B
(7.2%)
Hong KongUS$ 1.1 B
(7.8%)
AustraliaUS$ 0.1 B
(0.8%)
TaiwanUS$ 0.10 M
(0,7%)
Others(11%)
Jan – June 2016
Badan Koordinasi Penanaman Modal (BKPM)
Indonesia Investment Coordinating Board
Jln. Jend. Gatot Subroto No. 44
Jakarta 12190 - Indonesia
t . +62 21 5292 1334
f . +62 21 5264 211
www.bkpm.go.id
Thank You
Terima Kasih
Indonesia Investment Promotion Centre (IIPC)