inventory and profile - bhj-mpc
TRANSCRIPT

December 3, 2010 www.camsys.com
BHJ Freight Study
Inventory and Profile
prepared for
Brooke-Hancock-Jefferson Metropolitan Planning Commission
prepared by
Cambridge Systematics, Inc.
technical
memorandum


report
BHJ Freight Study
Inventory and Profile
This document was prepared by funding through BHJ member governments, Claude Worthington Foundation, Federal Transit Administration, Ohio Department of Transportation, U.S. Federal Highway Administration, West
Virginia Department of Transportation, and West Virginia University Foundation.
prepared for
Brooke-Hancock-Jefferson Metropolitan Planning Commission The Metropolitan Planning Organization for Weirton-Steubenville, WV-OH Metropolitan Area 124 North Fourth Street, 2nd Floor Steubenville, OH 43952
prepared by
Cambridge Systematics, Inc. 206 Pine Grove Court Baden, PA 15005
date
December 3, 2010


BHJ Freight Study
Cambridge Systematics, Inc. i 8399-100
Table of Contents
1.0 Introduction ......................................................................................................... 1-1
1.1 Background .................................................................................................. 1-1
1.2 Study Area ................................................................................................... 1-2
2.0 Data Collection and Synthesis ......................................................................... 2-1
3.0 Freight Supporting Infrastructure ................................................................... 3-1
3.1 Roadway Infrastructure ............................................................................. 3-1
Ohio River Bridges ..................................................................................... 3-2
Truck Volumes ............................................................................................ 3-3
Future System .............................................................................................. 3-6
3.2 Railroad Infrastructure .............................................................................. 3-8
Ohio River Bridges and Tunnels .............................................................. 3-9
Railroad Volumes ..................................................................................... 3-10
Future System ............................................................................................ 3-13
3.3 Waterway Infrastructure ......................................................................... 3-13
Waterway Volumes .................................................................................. 3-15
Future System ............................................................................................ 3-17
3.4 Aviation Infrastructure ............................................................................ 3-17
Future System ............................................................................................ 3-17
3.5 Intermodal Linkages ................................................................................ 3-20
4.0 Demand Drivers for Freight Services ............................................................. 4-1
4.1 Population Trends ...................................................................................... 4-1
4.2 Employment Trends ................................................................................... 4-3
4.3 Land Use ...................................................................................................... 4-5
4.4 Freight-Generating Businesses ................................................................. 4-7
5.0 Regional Freight Patterns .................................................................................. 5-1
5.1 Freight Analysis Framework ..................................................................... 5-1
5.2 Freight Volumes .......................................................................................... 5-2
Tons .............................................................................................................. 5-4
Value ............................................................................................................. 5-5
5.3 Study Area Commodities .......................................................................... 5-6
Tons .............................................................................................................. 5-6

Table of Contents, continued
ii Cambridge Systematics, Inc. 8399-100
Value ............................................................................................................. 5-7
Mode ............................................................................................................. 5-8
Truck ........................................................................................................ 5-8
Rail ......................................................................................................... 5-10
Water ...................................................................................................... 5-11
5.4 Trading Partners ....................................................................................... 5-12
Domestic Freight Flows ........................................................................... 5-13
International Freight Flows ..................................................................... 5-15
6.0 Stakeholder Outreach Summary.................................................................... 6-18
6.1 Approach ................................................................................................... 6-18
Online Survey ....................................................................................... 6-18
Stakeholder Interviews........................................................................ 6-18
BHJ Freight Study Steering Committee Kick-Off Meeting ............ 6-19
6.2 Results ........................................................................................................ 6-19
Response Rate ....................................................................................... 6-19
Freight System Performance .............................................................. 6-20
Major Freight-Generating Industries ................................................ 6-20
Principal Commodities Shipped ........................................................ 6-20
Freight Movements .............................................................................. 6-21
Land Use Issues and Regulations ...................................................... 6-24
Attractive Business Location Elements ............................................. 6-24
Workforce Issues .................................................................................. 6-24
Funding Options .................................................................................. 6-25

BHJ Freight Study
Cambridge Systematics, Inc. iii
List of Tables
Table 2.1 Data Collection Matrix ............................................................................ 2-2
Table 3.1 Proposed Roadway Projects ................................................................... 3-6
Table 3.2 Proposed Railroad Projects ................................................................... 3-13
Table 3.3 Proposed Aviation Projects................................................................... 3-18
Table 3.4 Intermodal Linkages .............................................................................. 3-20
Table 4.1 “Freight Intensive” Industries ................................................................ 4-7
Table 4.2 Comparison of “Freight Intensive” and Non-“Freight Intensive” Industries ............................................................................. 4-10
Table 4.3 Largest Freight Intensive Site Locations - Employment ................... 4-11
Table 4.4 Largest Freight Intensive Site Locations - Sales ................................. 4-11
Table 5.1 Summary Flows by Mode in West Virginia ......................................... 5-2
Table 5.2 Summary Flows by Mode in Ohio ......................................................... 5-3
Table 5.3 Summary Flows by Mode in BHJ FAF Region .................................... 5-3


BHJ Freight Study
Cambridge Systematics, Inc. v
List of Figures
Figure 1.1 Study Area – BHJ Freight Study ............................................................ 1-3
Figure 3.1 Roadway Infrastructure .......................................................................... 3-4
Figure 3.2 Roadway Conditions ............................................................................... 3-5
Figure 3.3 Railway Infrastructure .......................................................................... 3-11
Figure 3.4 Railway Conditions ............................................................................... 3-12
Figure 3.5 Waterway Infrastructure ....................................................................... 3-14
Figure 3.6 Waterway Conditions ............................................................................ 3-16
Figure 3.7 Aviation Infrastructure.......................................................................... 3-19
Figure 3.8 Truck Oriented Intermodal Facilities .................................................. 3-21
Figure 3.9 Rail Oriented Intermodal Facilities...................................................... 3-22
Figure 3.10 Water Oriented Intermodal Facilities .................................................. 3-23
Figure 4.1 Population Trend – Age .......................................................................... 4-2
Figure 4.2 Population Trend – Education ............................................................... 4-3
Figure 4.3 Employment Trend – Available Civilian Workforce .......................... 4-4
Figure 4.4 Employment Trend – Unemployment .................................................. 4-4
Figure 4.5 Land Use .................................................................................................... 4-6
Figure 4.6 Harris InfoSource Data Coverage .......................................................... 4-9
Figure 4.7 Freight-Generating Businesses – Number of Employees ................. 4-13
Figure 4.8 Freight-Generating Businesses – Annual Sales .................................. 4-14
Figure 5.1 Freight Flows by Tons (2007) .................................................................. 5-4
Figure 5.2 Freight Flows by Tons (2040) .................................................................. 5-4
Figure 5.3 Freight Flows by Value (2007) ................................................................ 5-5
Figure 5.4 Freight Flows by Value (2040) ................................................................ 5-6
Figure 5.5 Study Area Commodities by Tons (2007) ............................................. 5-7
Figure 5.6 Study Area Commodities by Tons (2040) ............................................. 5-7
Figure 5.7 Study Area Commodities by Value (2007) ........................................... 5-8
Figure 5.8 Study Area Commodities by Value (2040) ........................................... 5-8

List of Figures, continued
vi Cambridge Systematics, Inc.
Figure 5.9 Top 10 Study Area Commodities by Truck (Tons).............................. 5-9
Figure 5.10 Top 10 Study Area Commodities by Truck (Value) ............................ 5-9
Figure 5.11 Top 10 Study Area Commodities by Rail (Tons) ............................... 5-10
Figure 5.12 Top 10 Study Area Commodities by Rail (Value) ............................. 5-11
Figure 5.13 Top 10 Study Area Commodities by Water (Tons) ........................... 5-12
Figure 5.14 Top 10 Study Area Commodities by Water (Value) ......................... 5-12
Figure 5.15 Domestic and International Freight Flows (Tons and Value) .......... 5-13
Figure 5.16 Top 10 Domestic Origins (Tons) .......................................................... 5-14
Figure 5.17 Top 10 Domestic Origins (Value) ......................................................... 5-14
Figure 5.18 Top 10 Domestic Destinations (Tons).................................................. 5-15
Figure 5.19 Top 10 Domestic Destinations (Value) ................................................ 5-15
Figure 5.20 Imports by Country (Tons) ................................................................... 5-16
Figure 5.21 Imports by Country (Value) ................................................................. 5-16
Figure 5.22 Exports by Country (Tons) ................................................................... 5-17
Figure 5.23 Exports by Country (Value) .................................................................. 5-17

BHJ Freight Study
Cambridge Systematics, Inc. 1-1
1.0 Introduction
1.1 BACKGROUND The cities of Steubenville, Ohio, and Weirton, West Virginia anchor the three-county planning area served by Brooke-Hancock-Jefferson Metropolitan Planning Commission (BHJ). As the designated Metropolitan Planning Organization (MPO) for the region, it is BHJ’s responsibility to link intermodal transportation plans together with economic development opportunities and land use, through a continuous, cooperative, and comprehensive planning process. As part of this task, BHJ has partnered with the region’s two economic development agencies, Progress Alliance in Ohio and the Business Development Corporation of the Northern Panhandle in West Virginia, to conduct a study of the region’s freight system to articulate opportunities where freight mobility improvements can be made to spur economic growth.
Today, the greater Steubenville-Weirton area is facing game-changing challenges that will influence future transportation investments. Local governments are facing steep declines in tax revenues due to the waning steel industry, and the region is experiencing a shift to a service-based economy, introducing a new set of transportation needs. As a result, traditional transportation dollars are inadequate to address highway capital and maintenance needs. While similar conditions are surely testing communities across the nation, they present the Steubenville-Weirton area with a unique opportunity to consider creatively strategic transportation investments as a means of attracting economic development opportunities to the region.
Because of its regional leadership role and current economic conditions, BHJ has clear motivation for conducting this Freight Study. For the project, BHJ has established several goals, including:
– Identify and evaluate the freight assets of the BHJ region
– Identify impediments to efficient goods movement
– Explore the linkages between freight movement, land use and economic growth
– Recommend freight system improvements; evaluate and prioritize recommendations through performance metrics
– Disseminate the benefits, costs and opportunities of freight movement to elected officials, stakeholders and the general public
– Enhance the ability to continue future freight planning and implementation efforts

BHJ Freight Study
1-2 Cambridge Systematics, Inc.
This technical memorandum is the first in a series of documents to address BHJ’s stated goals for this project. As a starting point of the project, this technical memorandum defines and articulates freight infrastructure assets and economic conditions in greater Steubenville-Weirton. To accomplish the task, this document is organized into five distinct sections:
• Section 2 – Data Collection contains a synthesis of the available data obtained regarding the BHJ freight system required to conduct this study;
• Section 3 – Freight Infrastructure presents existing data in a visual way that will be later assessed in identifying the BHJ region’s freight transportation system needs and opportunities;
• Section 4 – Economic Drivers contains information on the regions demographic and business profile; and
• Section 5 – Freight Flows contains information on the movement of goods in, out, and through the region.
• Section 6 – Stakeholder Outreach Summary documents the information gathered from area stakeholders through the stakeholder outreach process.
1.2 STUDY AREA The Brooke-Hancock-Jefferson Metropolitan Planning Commission oversees a three-county, bi-state planning area, located in eastern Ohio and the northern panhandle of West Virginia. The Ohio/West Virginia state line, a line that follows the course of the Ohio River, bisects the BHJ region. Brooke and Hancock counties, West Virginia lie on the east bank of the river and to the west is Jefferson County, Ohio. Figure 1.1 highlights BHJ’s planning area, the focus of this study.
In addition to water transport availability via the Ohio River, roadways and railways crisscross this region, though no designated interstate highways run directly through the region. Major neighboring cities include Wheeling, WV (26 miles to the south), Pittsburgh, PA (40 miles to the east), Youngstown, OH (60 miles north), and Canton, OH (60 miles northwest).

BHJ Freight Study
Cambridge Systematics, Inc. 1-3
Figure 1.1 Study Area – BHJ Freight Study


BHJ Freight Study
Cambridge Systematics, Inc. 2-1
2.0 Data Collection and Synthesis
The initial task of the BHJ Freight Study included a data collection and synthesis effort, the goal of which was to combine all appropriate, publicly available data into a single repository for multi-modal freight system analysis via a geographic information system (GIS) platform. In order to establish the baseline for the freight system conditions, the analysis required a data collection effort focused on the most recent, accurate and comprehensive information available. The data collection effort included a wide variety of existing sources to represent BHJ’s intermodal freight network.
The bi-state planning region presented several challenges for data collection. While BHJ maintains a wide variety of core-planning data for the region, this level of freight study needed a greater level of detail. To augment the local data, the collection effort called upon resources available from Ohio and West Virginia as well as federal sources. With data collected from such a wide variety of repositories, several obstacles arise. Among many issues, national, state, and local data sets may differ in design, type, year, and level of detail. Therefore, to overcome these problems, the analysis required extensive GIS manipulation to merge the assorted data records together. In addition, the effort needed to augment local information with the best available national data but as is sometimes the case with national data, the level of granularity needed for local study may not be available, as in the case of the Freight Analysis Framework data. Section 5.0 Freight Flows will discuss this effort in more detail.
Table 2 describes the substantial data collection used in this study report provided by the following agencies and organizations:
• Brooke-Hancock-Jefferson Metropolitan Planning Commission (BHJ);
• Federal Aviation Administration (FAA);
• Federal Highway Administration (FHWA);
• Federal Railroad Administration (FRA);
• Ohio Department of Transportation (ODOT);
• West Virginia Department of Highways (WVDOH); and
• United States Army Corps of Engineers (USACE).
Finally, the data collection and synthesis effort also required purchasing a private database of local employer information to supplement the public data. Section 4.4 Freight-Generating Businesses contains a more detailed description of this data file.
While extensive data were available from the public sector, the private sector operates the majority of freight systems. The ability to receive hard-copy private

BHJ Freight Study
2-2 Cambridge Systematics, Inc.
sector data for public study is often a challenge. Frequently private sector information is proprietary in nature, and as such, there is concern about disseminating information that may benefit their competitors.
As supplement to this hard-copy data collection effort, anecdotal information was collected during interviews with representative public and private sector stakeholders. Section 6.0 Stakeholder Outreach Summary summarizes the data obtained from these interviews.
Table 2.1 Data Collection Matrix
Mode Data Source Data Format
Brief Description Coverage Important Data Fields
Highway
Road Network BHJ, ODOT
Shapefiles Three shapefiles comprise the regional road network: Brook_Hancock_Hwy, Jefferson_Hwy, and the master ODOT state highway network.
BHJ Region
Functional class is available through the Brook_Hancock_Hwy and the ODOT network.
All Bridges BHJ, WVDOH
Shapefiles Two shapefiles provide the location of all regional bridges.
BHJ Region
Bridge characteristics, such as age and capacity, available for Jefferson County only.
Traffic Counts BHJ Shapefiles Raw counts at selected points for 4 years from 2006-9. Not comprehensive.
BHJ Region
Count, direction, and functional class.
Traffic Volumes (Current)
BHJ Shapefile, from Cube file
Volumes for most higher function class roads in region.
BHJ Region
AADT, Truck ADT, peak/non-peak volumes, VMT, capacity.
Traffic Volumes (2030)
BHJ Shapefile and Cube file
Yr 2030 Volumes for most higher function class roads in region. Also available: Yrs. 2014, 2020.
BHJ Region
AADT, Truck ADT, peak/non-peak volumes, VMT, capacity.
NHS Intermodal Connectors
FHWA Shapefile Designated and proposed intermodal connectors. Only one intermodal connector exists nearby and it is south of the study area.
Ohio and West Virginia
Ohio River Crossings
BHJ Shapefile The location of the 5 Ohio River Bridges.
BHJ Region
Bridge name, no volumes.
Railroad
Regional Rail Network
BHJ Shapefile Railroad data apparently extracted from FRA, additional data on WV side from the state.
Regional Ownership, rail density 2006, some information regarding signalization and subdivision name.

BHJ Freight Study
Cambridge Systematics, Inc. 2-3
Mode Data Source Data Format
Brief Description Coverage Important Data Fields
National Rail Network
ORNL Shapefile National rail network maintained by the Oak Ridge National Lab.
National Additional operational data such as signalization, track type, track class. With additional data from ORNL, may be able to determine weight restrictions.
At-Grade Rail Crossings
FRA Shapefile All at-grade rail crossings nationally.
Ohio, West Virginia
Crossing number, RR, road functional class, AADT, signals, day thru, night thru, total trains/day, posted speed, safety info (predicted casualty and fatality rates)
Ohio River Railroad Crossings
BHJ Shapefile Location of the 4 Ohio River railroad crossings
BHJ Region
Bridge type, age, condition. No volumes.
Rail Tunnels WVDOH Shapefile Location of known rail tunnels
Regional No operational data available.
Rail Yards Harris Shapefile Limited data regarding the location of larger, operating rail yards.
BHJ Region
Number of employees, railroad owner.
Transload Terminals
NTAD09 Shapefile Terminals for transload National Facility name, primary mode, modes served, some commodity and shipment data
Water
Bridge Clearance Restriction
USACE Shapefile Ohio River and channel bridges with either height or horizontal clearance restrictions.
Pittsburgh USACE division
Type of clearance issue, height of bridge above waterline in feet, horizontal clearance in ft.
Docks/Wharves USACE Shapefile Location and characteristics of waterborne freight port facilities.
Pittsburgh USACE division
Ownership, intermodal features, rail connections, commodities, berths in feet, depth in feet, crane availability
Locks and Dams BHJ Shapefile Location, name, and physical characteristics of the lock/dam.
BHJ Region
Height
Locks and Dams Characteristics
USACE Shapefile Commodity and delay data for both area locks/dams for Y2009.
Pittsburgh USACE division
Commodity data reported in annual barge volume and by tonnage at the locks, plus detailed delay information.
National Water Imports/Exports
USACE Spreadsheet Macro-view of Y2009 import/export tons by commodity and destination.
National Year, port district, waterway, tonnage, commodity code

BHJ Freight Study
2-4 Cambridge Systematics, Inc.
Mode Data Source Data Format
Brief Description Coverage Important Data Fields
Ohio River Commodity Flows
USACE Shapefile Flows along Ohio River by commodity for Y2009.
Pittsburgh USACE division
Commodity flows broken down by type and up/down river direction along four area river segments.
Ohio River Commodity Flows
USACE Spreadsheet Commodity flows by weight passing through New Cumberland and Pike Island Locks, 1993-2009
BHJ Region
Commodity, Weight
Ohio River Obstruction
USACE Shapefile Obstructions within the navigable portions of the Ohio River.
Pittsburgh USACE division
Type of obstruction and water level depth.
Aviation
Airport Locations NTAD09 Shapefile Location of all airports National Type of airport, ownership, distance from nearest CBD, type of operations allowed (ex. – helicopter), number of aircraft based, enplanements
Airport Cargo by Value
FAA Spreadsheet Cargo by value Top U.S. Airports
Total cargo by value
Economic
Designated Industrial Areas
BHJ Shapefile Location of industrial-zoned land use. Note – Brooke County makes no distinction in their files between commercial and industrial land use.
BHJ Region
Employment Site Data
Harris Shapefile Businesses in the region that potentially generate freight
Regional NAICS, employment, sales volume, facility size.
Freight Analysis Framework (FAF)
FHWA Database Commodity flows by mode, weight, and value by state and region, with future projections
National Commodity, Value, Weight, Mode
Freight Businesses
Harris Shapefile Businesses in the region that potentially generate freight
Regional NAICS, employment, sales volume, facility size.
Socioeconomic Data
BHJ Shapefile SE data by traffic analysis zone. Also have SED from other sources.
BHJ Region
Population, workers, households, household vehicles, 2-digit NAICS code employment, zone type (rural, etc.).
Transportation Firms
Harris Shapefile Businesses in the region that potentially generate freight
Regional NAICS, employment, sales volume, facility size.
Abbreviations: AADT (Average Annual Daily Traffic), ADT (Average Daily Traffic), CBD (Central Business District), Freight Analysis Framework (FAF), ORNL (Oak Ridge National Lab), NAICS (North American Industry Classification System), NTAD09 (National Transportation Atlas Database 2009), RR (Railroad)

BHJ Freight Study
Cambridge Systematics, Inc. 3-1
3.0 Freight Supporting Infrastructure
As described in Section 2.0, numerous sources provided data for the BHJ Freight Study in a variety of formats (e.g. Shapefile, spreadsheet, database, etc.). It was essential to develop a common platform and analyze each data source in combination with each other. Ultimately, this common GIS-platform is the analysis tool used to determine BHJ’s freight system needs and opportunities and enable a wide-variety of mode specific and multi-modal queries. This tool then evaluated the data and mapped out the characteristics of the four primary modes of freight transportation – truck, rail, water, and air, and helped to review the intermodal linkages between these modes. This section contains the following information organized as:
• Roadway Infrastructure
• Railroad Infrastructure
• Waterway Infrastructure
• Aviation Infrastructure
• Intermodal Linkages
3.1 ROADWAY INFRASTRUCTURE As influenced by the Ohio River, several major roadway corridors within the study area have developed in a north-south manner. These chief commerce corridors as shown in Figure 3.1 by functional classification provide passenger and commercial vehicle access. Several major state and U.S. highways serve the study area, however the nearest Interstate Highways are located outside the study area. Both I-70 and I-470 are located about 10 miles from the southern edge of BHJ’s planning boundary; however, National Highway System and other routes provide interstate connectivity for the region. These routes include:
• West Virginia State Route (SR) 2 – for the most part built as a two-lane facility with some four-lane segments, provides north-south connectivity on the West Virginia side of the Ohio River. SR 2 connects to I-70, U.S. 22, and U.S. 30;
• Ohio SR 7 – constructed primarily as a four-lane limited-access facility, provides north-south connectivity on the Ohio side of Ohio River. SR 7 connects to I-70 in Wheeling, WV, I-76 in Youngtown, OH, and U.S. 22;
• United States Route (U.S.) 22 – designed as a four-lane interstate-type highway, facilitates east-west linkage between Ohio and West Virginia via

BHJ Freight Study
3-2 Cambridge Systematics, Inc.
the Veterans Memorial Bridge. U.S. 22 provides connectivity between Cincinnati, OH and Pittsburgh, PA;
• U.S. 30 – supports connectivity between Ohio and West Virginia via the Jennings Randolph Bridge; and
• Ohio SR 43 - provides a north-south connection between Steubenville (SR 7) and Canton/Akron and Cleveland, Ohio.
Although the metropolitan area’s National Highway System accounts for less than 6 percent of the total highway miles, it carries nearly 50 percent of the region’s average daily traffic1, underscoring the important role these routes serve.
Ohio River Bridges
The Ohio River bisects the study area in a north–south direction, serving as the boundary between the states of West Virginia and Ohio and articulating the importance of strategic bridge infrastructure. There are five Ohio River highway bridge crossings within the study area:
• Jennings Randolph Memorial Bridge - connects East Liverpool, Ohio and Chester, West Virginia via U.S. 30 in Hancock County in the northeast corner of the study area;
• Newell Toll Bridge – located in the northern edge of the study area in Hancock County, this privately owned bridge links East Liverpool, Ohio and Newell, West Virginia at the West Virginia SR 2 intersection;
• The Fort Steuben Bridge – formerly designated as U.S. 22 and replaced by the construction of the Veterans Memorial between Weirton and Steubenville. Designated as Ohio SR 822, the Ohio Department of Transportation declared the bridge permanently closed in 2009. The bridge is tentatively scheduled for demolition2 in the Fall of 2011;
• The Veterans Memorial Bridge - constructed as a replacement for the Fort Steuben Bridge, this is the largest, newest bridge in the study area. This structure is a major highway crossing for U.S. 22 and is open to all types of traffic, including trucks traveling between Ohio and West Virginia;
• The Market Street Bridge - is a historic suspension bridge connecting Steubenville to Brooke County north of Follansbee at West Virginia SR 2. At this time, WVDOT has contracted a major rehabilitation and structural repair project to extend the bridge’s lifetime for another ten years. Even with completion of the ongoing repairs, WVDOT will still maintain the current 5-ton weight limit postings.
1 BHJ long Range Transportation Plan, 2008
2 http://www.dot.state.oh.us/districts/d11/pages/ftsteubenbridgedemolition.aspx

BHJ Freight Study
Cambridge Systematics, Inc. 3-3
While significant bridge infrastructure is in place to get people to jobs and goods to market, aside from the Veterans Memorial Bridge, the system is aged. Maintaining a safe system with necessary connectivity at appropriate locations for heavy vehicles is a challenge. Note the closure and planned removal of the Fort Steuben Bridge, and the recent closures and rehabilitation of the Market Street Bridge. These closures underscore the vulnerability of the transportation system - a major structural failure in any of the existing river crossings, in particular the Veterans Memorial Bridge, would cripple the Steubenville-Weirton region.
Truck Volumes
Figure 3.2 shows the Average Annual Daily Traffic (AADT) for trucks within the study area. Neither the State of Ohio nor the State of West Virginia has a designated truck route system, so trucks travel on the most direct routes between origins and destinations. There are particularly high levels of truck traffic concentrated on some key highway corridors within the study area and across the major bridges. U.S. 22, as described above is a major highway through the State of Ohio and is the only crossing of the Ohio River within the central part of the study area that is able to handle heavy vehicles. Truck AADT is greater than 150 vehicles per day on several other routes including SR 43 and SR 7 in Ohio, and parts of SR 2 in West Virginia. It is clear that trucks traveling north-south through the study area are utilizing direct routes to the major highways as evidenced by the heavy truck traffic on West Virginia SR 8 between SR 2 and U.S. 30 on the far northeast corner of the study area. There is a prominence of high truck traffic on the major roadways indicating a preference for larger facilities possibly indicating limitations on local roadways due to truck weight restrictions or inadequate turning radii. Truck traffic is also concentrated near the urbanized areas within the region, likely attracted by increased shipping opportunities in those areas.

BHJ Freight Study
3-4 Cambridge Systematics, Inc.
Figure 3.1 Roadway Infrastructure

BHJ Freight Study
Cambridge Systematics, Inc. 3-5
Figure 3.2 Roadway Conditions

BHJ Freight Study
3-6 Cambridge Systematics, Inc.
Future System
Table 3.1, shown below, describes the long-range improvements planned for roadways within the study area over the next 25 years. The listing, taken from the BHJ 2030 Transportation Plan, includes a wide range of local street, highway, and bridge rehabilitation projects planned for construction throughout the three -county region. This list consists of those projects included in the fiscally constrained portion of the Long Range Transportation Plan, developed in 2008.
A key proposed improvement that will improve capacity of the highway system and ease the ability to cross the Ohio River is the development of a new Ohio River Bridge between Jefferson County and Brooke County connecting Ohio SR 7 in Brilliant with West Virginia SR 2 south of Wellsburg. West Virginia and Ohio Departments of Transportation have designated funding for environmental and preliminary design work to construct the bridge. A new Ohio River Bridge will help mitigate the losses of both the Fort Steuben Bridge and constant repair requirements of the Market Street Bridge in the Steubenville area.
Table 3.1 Proposed Roadway Projects
Roadway Jurisdiction Programmed
Year Cost (000’s)
Potential Freight Impact?
Mode
Brady Avenue / University Blvd from State Route 43 (Sunset Blvd) to Seventh Street - Steubenville - Highway System Preservation
Steubenville 2025 $1,218 Possible Truck
Bridges Over SR043 including Market St Ramp and Adams St Ramps (Washington Street) Steubenville - Bridge System Preservation
Steubenville 2020 $7,526 Yes Truck
Chester Traffic Signal System - Congestion Management / Safety
WVDOT 2025 $1,524 Possible Truck
County Bridge System Preservation Jefferson County
2010-18 $3,911
Yes Truck 2019-24 $2,708
2025-30 $2,232
County Safety Program ODOT 2010-18 $766 Possible Truck
CR 13 (Three Springs Drive) From US 22 To Potomac Avenue - Major/New Construction Capacity Addition
WVDOT 2014 $2,643 Yes Truck
Follansbee Traffic Signal System - Congestion Management / Safety
WVDOT 2019 $1,528 Possible Truck
Franklin Street Extension - Toronto - Highway System Preservation
Steubenville 2026 $2,246 Possible Truck
Intersection at SR043 (Sunset Blvd) & Lovers Lane Road Steubenville - Congestion Management / Safety
Steubenville 2016 $490 Possible Truck
2022 $2,277 Possible Truck

BHJ Freight Study
Cambridge Systematics, Inc. 3-7
Roadway Jurisdiction Programmed
Year Cost (000’s)
Potential Freight Impact?
Mode
John Scott Highway Connector from SR43 (Sunset Blvd) to Steubenville Corporation Limit - Steubenville - Highway System Preservation
Steubenville 2028 $4,590 Possible Truck
Lovers Lane Connector from SR43 (Sunset Blvd) to CR43 - Steubenville - Highway System Preservation
Steubenville 2027 $2,228 Possible Truck
Mall Area Traffic Signal Renovations - Congestion Management / Safety
Steubenville 2026 $834 Possible Truck
MPO Safety Program ODOT 2010-18 $1,595 Possible Truck
New Ohio River Bridge Jefferson Co, OH to Brooke Co, WV - Major/New Construction Capacity Addition
WVDOT
2014 $4,266
Yes Truck 2010 $12,343
2019 $58,858
2019 25,244
ODOT Bridge System Preservation
ODOT
2010-18 $16,060
Yes Truck 2019-24 $9,777
2025-30 $11,845
ODOT State Highway System Preservation
ODOT
2010-18 $32,120
Yes Truck 2019-24 $29,327
2021-30 $35,642
Penco Road Weirton – Major/New Construction Capacity Addition
WVDOT 2011 $2,640 Possible Truck
South Commercial Ave (CR7B) From Clifton Avenue to Mingo Jct So Corporate Line - Highway System Preservation
Jefferson County
2029 $504 Possible Truck
SR 105 (Colliers Way) Bridge Over US 22 Weirton - Bridge Capacity Addition
WVDOT 2021 $7,259 Possible Truck
SR 2 (Commerce Street) From 10th Street To 12th Street - Major Construction Capacity Addition
WVDOT
2021 $2,476 Possible Truck
2026 $5,789 Possible Truck
SR105 Pennsylvania Ave; From 13th St. to Penco Road – Weirton – Major Construction Capacity Addition
WVDOT 2012 $11,221 Possible Truck
SR43 (Washington St) Interchange Ramps - Major/New Construction System Preservation
Steubenville 2021 $2,019 Yes Truck
SR43 Traffic Signal Renovations - Congestion Management / Safety
Steubenville 2025 $2,278 Possible Truck
SR7 (Dean Martin Blvd) Traffic Signal Steubenville 2024 $1,689 Possible Truck

BHJ Freight Study
3-8 Cambridge Systematics, Inc.
Roadway Jurisdiction Programmed
Year Cost (000’s)
Potential Freight Impact?
Mode
Renovations - Congestion Management / Safety
State Route 43 (Sunset Blvd) Brady Avenue West to West Corporate Line - Steubenville - Highway System Preservation
ODOT 2029 $4,590 Possible Truck
Trenton Avenue Bridge - Toronto - Bridge System Preservation
Steubenville 2026 $720 Possible Truck
Weirton Heights Traffic Signal System - Congestion Management / Safety
WVDOT 2012 $1,910 Possible Truck
WVDOT Bridge Program
WVDOT
2010-18 $12,335
Yes Truck 2019-24 $8,862
2025-30 $13,143
WVDOT Federal-Aid Highway Maintenance Program
WVDOT
2010-18 $13,821
Yes Truck 2019-24 $6,548
2025-30 $5,696
WVDOT Highway
WVDOT
2010-18 $23,449
Yes Truck 2019-24 $26,340
2025-30 $41,117
Source: BHJ Long Range Transportation Plan, 2008
3.2 RAILROAD INFRASTRUCTURE Four rail providers - Norfolk Southern (NS), Wheeling & Lake Erie Railway (W&LE), Columbus & Ohio River Railroad (CUOH), and Ohi-Rail Corporation, as shown in Figure 3.3, operate a combined 135 route miles of railroad infrastructure within the study area.
• Norfolk Southern - the largest of the region’s rail operators is NS, a Class I Railroad3 that operates track on both the Ohio and West Virginia sides of the Ohio River. The entire NS system covers approximately 21,000 route miles (2,233 Ohio miles) in 22 states and serves deepwater container ports on the eastern seaboard.
3 U.S. Class I Railroads are line haul freight railroads with 2009 operating revenue of $378.8 million or more. Association of American Railroads, October 2010.

BHJ Freight Study
Cambridge Systematics, Inc. 3-9
• Wheeling & Lake Erie Railway - the W&LE is a Regional Railroad and is the largest Ohio-based railroad in the study area, operating 558 route miles in Ohio.
• Columbus & Ohio River Railroad – the CUOH, a Shortline Railroad acquired by Genesee & Wyoming in 2008, operates on the State of Ohio owned Panhandle Rail Line. This local railroad operates 244 route miles in Ohio.
• Ohi-Rail Corporation – this is a switching railroad that operates 43 route miles in eastern Ohio.
Additionally, there exists an abandoned corridor on the east side of the Ohio River, a remnant from the Conrail acquisition by NS and CSX. Once operated by the Penn Central Railroad and most recently the Consolidated Rail Corporation (Conrail), this corridor provided connectivity from Weirton to Pittsburgh, PA. When abandoned in mid-1990, Conrail pulled the track and the right-of-way is “rail-banked” by the West Virginia State Rail Authority4. Currently the corridor serves as a recreational bike trail.
Ohio River Bridges and Tunnels
As is the case for the highway system, bridges provide critical connectivity for rail operators in the region. NS and W&LE own two of the three largest railroad bridges in the study area. NS owns and maintains the Panhandle Bridge located directly south of the Veterans Memorial Bridge between Steubenville and Weirton. W&LE owns and maintains the Wabash Bridge situated at the south end of Mingo Junction connecting to the West Virginia shore between Follansbee and Wellsburg. The W&LE Bridge is at the confluence of the routes for three railroads – W&LE, NS, and CUOR. Severstal North America, a steel manufacturer formerly known as Wheeling Pittsburgh Steel, owns the third bridge situated between Follansbee, WV and Steubenville, OH just south of the Market Street Bridge. As the railroads hug both the east and west shoreline of the Ohio River, there are several other bridges that cross tributaries feeding the main body.
Additionally, there are numerous rail tunnels within the study area located on the W&LE and the CUOR Panhandle rail line. Specific information on height restrictions in these tunnels was not available at the time of publishing, however anecdotal information indicates that the majority of these tunnels are not double-stack cleared, limiting the nature and quantities of goods that can be transported on the rail line. Recently, the Ohio Rail Development Commission (ORDC) funded a major renovation project for rehabilitation of the Gould Tunnel, located
4 http://www.transportation.wv.gov/rail/Trails/Pages/default.aspx

BHJ Freight Study
3-10 Cambridge Systematics, Inc.
on the state-owned Panhandle rail line a short distance west of Mingo Junction, through the American Recovery and Reinvestment Act.5
Railroad Volumes
Railroad volumes shown by segments of freight density in Figure 3.4, are a calculated snapshot of railroad operations within the study area. The rail segment densities as calculated by the Federal Railroad Administration (FRA), identify rail traffic on a scale of 1-7, with 1 being less dense (congested) and 7 being most dense. Figure 3.4 also shows the number of trains traversing at-grade crossings in the study area.
Generally, the routes on the western side of the Ohio River operate at a higher density than those on the east, while routes south of Steubenville on the W&LE operate at a lower density than the routes north of Steubenville, on the NS. The NS line running along the west side of the Ohio River has the highest densities within the study area. There are no rail segments in the study area operating in the high-density category. This may indicate corridors with excess capacity and room for future growth. The rail segments run by the non-Class I railroads, W&LE, CUOH, and Ohi-Rail, all operate at low densities.
Along the northern side of the Ohio River and into Columbiana County along the NS corridor, there are a large number of at-grade crossings handling up to 16 trains per day – the highest in the study area. Measured at-grade crossing volumes are also higher on the Ohio side of the river (6 to 10 trains/day), from Mingo Junction south to Wheeling. The rail segments operated by the non-Class I railroads, W&LE, CUOH, and Ohi-Rail show no crossings with greater than five trains per day, except on those segments overlapping with NS routes.
5 http://www.dot.state.oh.us/Divisions/Communications/Federal%20Stimulus%20Projects/03-STW-Rail-PanhandleRailLine.pdf

BHJ Freight Study
Cambridge Systematics, Inc. 3-11
Figure 3.3 Railway Infrastructure

BHJ Freight Study
3-12 Cambridge Systematics, Inc.
Figure 3.4 Railway Conditions

BHJ Freight Study
Cambridge Systematics, Inc. 3-13
Future System
According to BHJ’s Long Range Plan, there is only one proposed railroad enhancement listed. The West Virginia Department of Transportation expects construction of a new bridge replacing the Lee Avenue Bridge as a grade-separation over the Norfolk & Southern/Weirton Steel Railroad. This will improve the operating and physical capacity of each railroad within the vicinity of the improvement and lead to travel that is more efficient across the river between West Virginia and Ohio. There is no funding programmed for this project. As previously mentioned, the ORDC received American Recovery and Reinvestment Act (ARRA) monies for the Gould Tunnel Rehabilitation on the Panhandle Rail Line. This project includes rail replacement, bridge timber replacement, crosstie replacement, and surfacing of the track at several locations besides the tunnel along the Panhandle. The ORDC expects to complete this project in 2010. Other projects that do not effect railroad operations but deal with preserving railroad right-of-way for infrastructure development include the implementation of several “rails to trails” projects. This will eventually lead to improvement of the interstate and intrastate connections of an Ohio River trail.
Since operating entities privately fund the vast majority of railroad projects, it is possible that through each organization’s own capital investment program, improvements will be made over time to improve rail-shipping capacity in the study area, if market demand necessitates the investment.
Table 3.2 Proposed Railroad Projects
Roadway Jurisdiction Programmed Year
Cost
(000’s)
Cove Road Bridge Over NS/WSX Rail Crossing Weirton
WVDOT No Funding Available
$17,433
Source: BHJ Long Range Transportation Plan, 2008
3.3 WATERWAY INFRASTRUCTURE Figure 3.5 shows the waterway infrastructure within the study area along the Ohio River. These assets play a major role in the movement of goods throughout the study area, and access to the river is an important consideration for a wide variety of businesses and industries throughout the region. There are over 52 river terminals accessible by the Ohio River system with all but 3 being privately owned. The gold anchor symbol on the figure identifies which river terminals are under private ownership. The figure also shows the location of two locks and dams within the study area that facilitate barge traffic. The New Cumberland Lock & Dam is to the north adjacent to Stratton, Ohio and the Pike Island Lock & Dam is at the very southern edge of the study area at Yorkville, OH, just north of Wheeling, West Virginia.

BHJ Freight Study
3-14 Cambridge Systematics, Inc.
Figure 3.5 Waterway Infrastructure

BHJ Freight Study
Cambridge Systematics, Inc. 3-15
Waterway Volumes
Illustrated in Figure 3.6 are river traffic volumes and types of commodities traveling along the Ohio River within the study area. At Pike Island and New Cumberland, there is a wide variety of commodities carried on barges traversing the locks. An overwhelming majority of barge traffic tonnage is composed of raw materials (including coal). This is consistent with barges being a traditional method of shipping large amounts of bulk materials typically at much lower rates per ton than rail or truck. The majority of barges carry raw materials including coal, followed closely by waste and other materials. Volume of barges carrying these two commodities is much greater than any other commodities traversing the locks, including petroleum products, chemicals, manufactured products (including steel), and agricultural products.
Based on U.S. Army Corps of Engineers data, the most active portion of the river barge traffic within the study area is between the New Cumberland and Pike Island locks. Statistical data demonstrate that the range of traffic volumes between these two locks is in the neighborhood of 23,574 and 27,181 kilotons per year. North of the New Cumberland locks, the traffic declines to less than 23,574. South of Pike Island, outside the study area, the barge traffic increases to greater than 27,181 kilotons. Available information also shows that there are two bridges along the Ohio River that have low clearance - the connection between the Ohio mainland and Brown’s Island in the Ohio River, just north of U.S. 22, and the Veterans Memorial Bridge. Both of these locations may inhibit certain types of barge traffic from traversing those segments of the river, which may contribute to the lower levels of barge traffic within the study area north of Pike Island. Shipping delays caused by the two locks may also contribute to the lower levels of traffic within the center of the study area.
Figure 3.6 also displays berth length, an indication of a port’s flexibility and how much freight it can accommodate. North of the New Cumberland locks, the river port berths are generally less than 1,000 feet with only two berths greater than 1,000 feet. At locations around the Steubenville area, there are more longer berths with two berths of over 1,500 feet in the Steubenville area and around Mingo Junction.

BHJ Freight Study
3-16 Cambridge Systematics, Inc.
Figure 3.6 Waterway Conditions

BHJ Freight Study
Cambridge Systematics, Inc. 3-17
Future System
There are no waterway or port improvement projects designated within BHJ’s Long Range Plan for any jurisdiction within the study area. However, since the 2008 Long Range Plan publication, the Wellsville Intermodal Park has been able to secure Federal Stimulus dollars for upgrading cranes at the Columbiana County facility just outside of the study area. The intermodal facility has the capability of providing truck-rail-water access, at the northernmost point of the Ohio River within Ohio near the Pennsylvania state line. Businesses located in the greater Steubenville-Weirton area may be in a position to build upon and leverage some opportunity from this $5.7 million investment.
Container-On-Barge facilities and improved intermodal facilities that link rail and barge operations hold promise for the greater Steubenville-Weirton area. When a tow leaves Weirton, it takes a day and a half to travel to Pittsburgh. The locks between Weirton and Pittsburgh are too small to take the standard 15-barge tow at one time, resulting in inefficiencies as operators have to split their tow, lock them through separately and reattach them on the other side. Rail service could accomplish the trip faster from Steubenville-Weirton, taking containers off the river in the BHJ region and railing to Pittsburgh rather than towing the entire water route. As the Ohio River has been designated Marine Highway 70, money flowing from the Marine Highway Corridor program could potentially be used for planning and logistics to accomplish such an intermodal movement. Additionally, since the vast majority of the river ports along the Ohio River in the study area are privately-operated or privately-owned, it is possible that through each owner’s capital investment program, improvements will be made over time to increase port and waterway shipping capacity within the study area, if market demand justifies the investment.
3.4 AVIATION INFRASTRUCTURE Figure 3.7 displays the aviation infrastructure within the study area and surrounding areas. For air cargo service, Pittsburgh International Airport is the closest connection, providing global connectivity. There are seven other airports within or abutting the study area; however, at this time these airports provide passenger service only. The most significant regional airport within the study is the Jefferson County Airpark in Jefferson County, Ohio. Eddie Dew Memorial Airport near the town of Toronto, Ohio, is located just a short distance from the Ohio River with proximate access to Ohio SR 7. Each aviation facility within the three-county area is adjacent to a highway, with the exception of the air facility at Herron in Hancock County, West Virginia with the only road access being from county and other local roads.
Future System
The Jefferson County Airpark is interested in hosting air cargo service in the future. While at this time that service is not feasible, two improvements listed in BHJ’s Long Range Plan aim to assist the growth. As shown in Table 3.4, both
BHJ Freight Study
3-18 Cambridge Systematics, Inc.
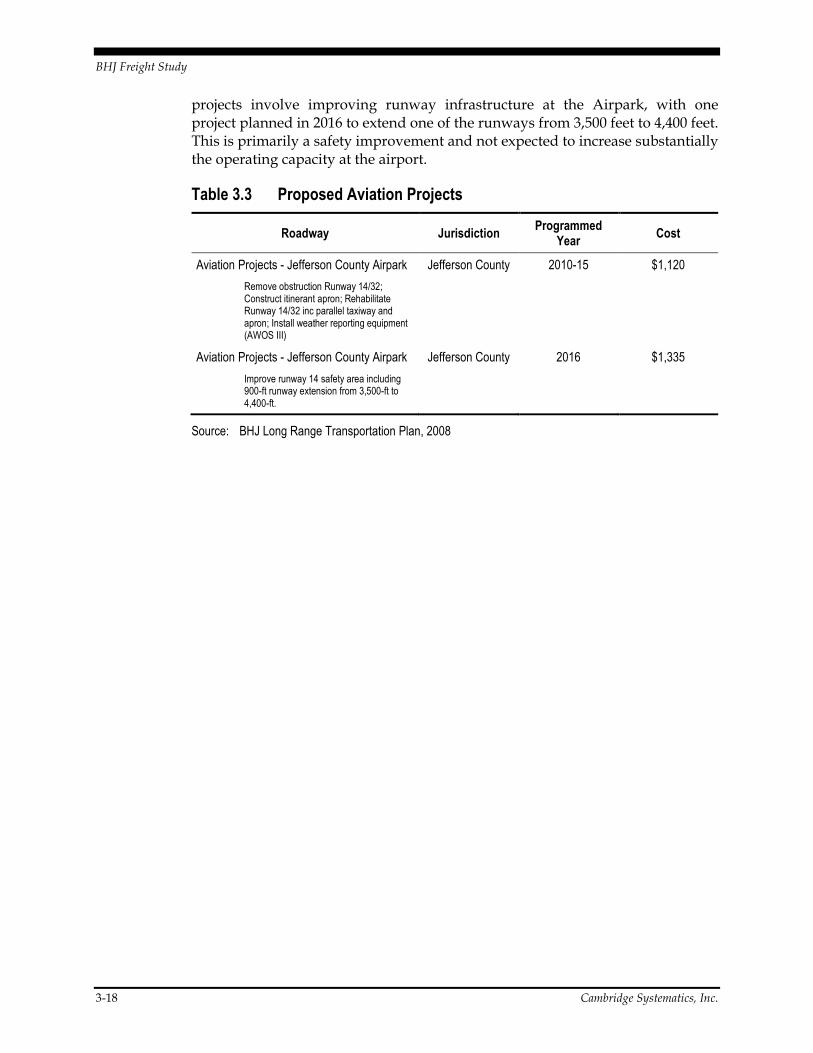
projects involve improving runway infrastructure at the Airpark, with one project planned in 2016 to extend one of the runways from 3,500 feet to 4,400 feet. This is primarily a safety improvement and not expected to increase substantially the operating capacity at the airport.
Table 3.3 Proposed Aviation Projects
Roadway Jurisdiction Programmed
Year Cost
Aviation Projects - Jefferson County Airpark
Remove obstruction Runway 14/32; Construct itinerant apron; Rehabilitate Runway 14/32 inc parallel taxiway and apron; Install weather reporting equipment (AWOS III)
Jefferson County 2010-15 $1,120
Aviation Projects - Jefferson County Airpark
Improve runway 14 safety area including 900-ft runway extension from 3,500-ft to 4,400-ft.
Jefferson County 2016 $1,335
Source: BHJ Long Range Transportation Plan, 2008

BHJ Freight Study
Cambridge Systematics, Inc. 3-19
Figure 3.7 Aviation Infrastructure
BHJ Freight Study
3-20 Cambridge Systematics, Inc.
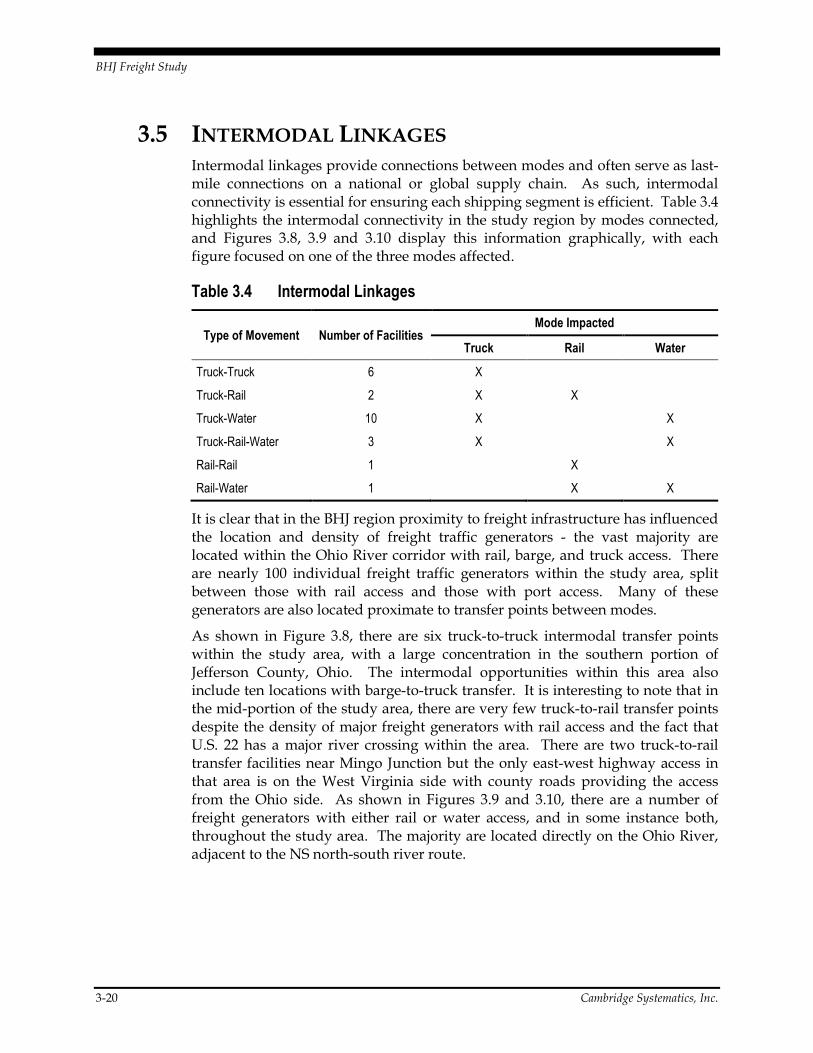
3.5 INTERMODAL LINKAGES Intermodal linkages provide connections between modes and often serve as last-mile connections on a national or global supply chain. As such, intermodal connectivity is essential for ensuring each shipping segment is efficient. Table 3.4 highlights the intermodal connectivity in the study region by modes connected, and Figures 3.8, 3.9 and 3.10 display this information graphically, with each figure focused on one of the three modes affected.
Table 3.4 Intermodal Linkages
Type of Movement Number of Facilities Mode Impacted
Truck Rail Water
Truck-Truck 6 X
Truck-Rail 2 X X
Truck-Water 10 X X
Truck-Rail-Water 3 X X
Rail-Rail 1 X
Rail-Water 1 X X
It is clear that in the BHJ region proximity to freight infrastructure has influenced the location and density of freight traffic generators - the vast majority are located within the Ohio River corridor with rail, barge, and truck access. There are nearly 100 individual freight traffic generators within the study area, split between those with rail access and those with port access. Many of these generators are also located proximate to transfer points between modes.
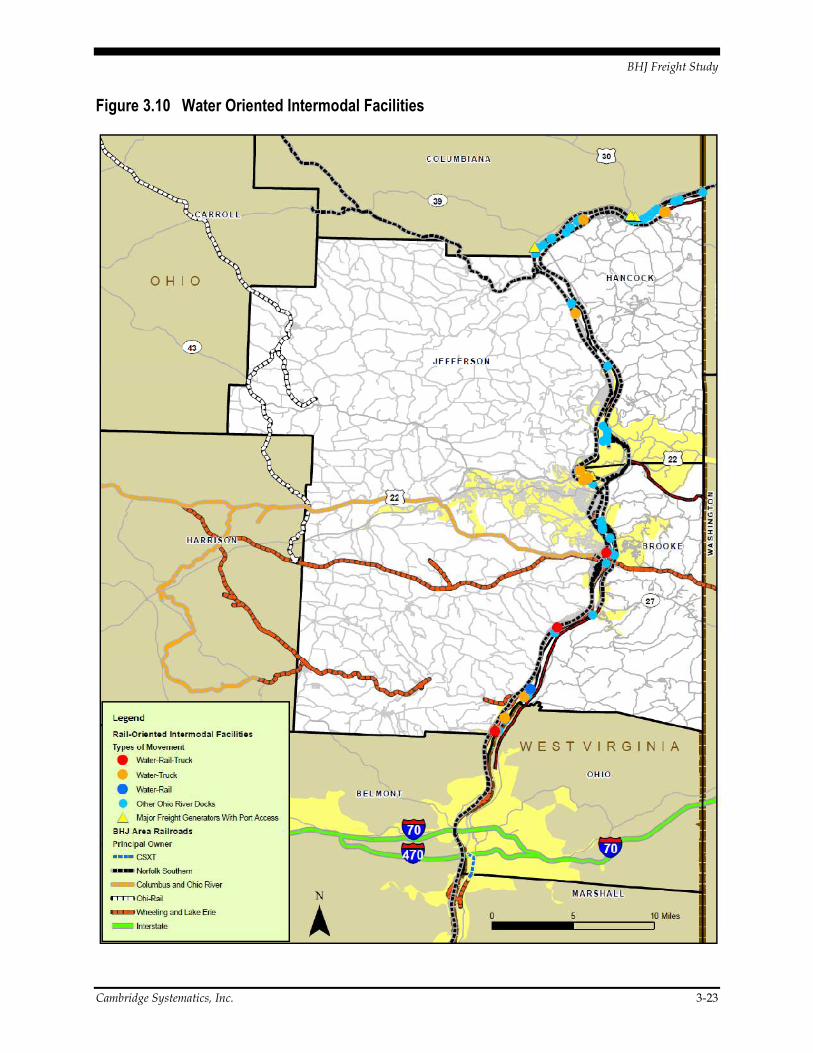
As shown in Figure 3.8, there are six truck-to-truck intermodal transfer points within the study area, with a large concentration in the southern portion of Jefferson County, Ohio. The intermodal opportunities within this area also include ten locations with barge-to-truck transfer. It is interesting to note that in the mid-portion of the study area, there are very few truck-to-rail transfer points despite the density of major freight generators with rail access and the fact that U.S. 22 has a major river crossing within the area. There are two truck-to-rail transfer facilities near Mingo Junction but the only east-west highway access in that area is on the West Virginia side with county roads providing the access from the Ohio side. As shown in Figures 3.9 and 3.10, there are a number of freight generators with either rail or water access, and in some instance both, throughout the study area. The majority are located directly on the Ohio River, adjacent to the NS north-south river route.

BHJ Freight Study
Cambridge Systematics, Inc. 3-21
Figure 3.8 Truck Oriented Intermodal Facilities

BHJ Freight Study
3-22 Cambridge Systematics, Inc.
Figure 3.9 Rail Oriented Intermodal Facilities
BHJ Freight Study
Cambridge Systematics, Inc. 3-23
Figure 3.10 Water Oriented Intermodal Facilities


BHJ Freight Study
Cambridge Systematics, Inc. 4-1
4.0 Demand Drivers for Freight Services
4.1 POPULATION TRENDS Located on the edge of the Appalachian Mountains, the study area has a strong manufacturing history focused on steel production. In recent decades, with the decline of that industry, due in large part to international competition, the region has grappled with job loss, economic decline and an aging population. In the past, the basis for local economic activities was a skilled labor force, but as the U.S. shifts to a service-based economy, it has been difficult for the region to adapt.
Figure 4.1 displays the current population age distribution for the three–county study area - Jefferson County, Ohio, and Brooke and Hancock Counties in West Virginia - according to census data. There are two noticeable age trends among residents. First, the largest number of residents is between the ages of 45-59, with both men and women having between 4-5,000 people for each of the three age cohorts - at least 500 more than any other age group. This indicates a disproportionate number of persons residing in the three counties that are nearing retirement age. Second, there is a “bump” in the number of residents between 15-19 years old with nearly 4,000 people each for male and female categories. This cohort is preparing to enter the full-time workforce and will be looking for local jobs within the next 3-5 years if they choose to stay within the community.
Figure 4.2 shows the population distribution by level of education in the Steubenville-Weirton Metropolitan Statistical Area (MSA) as compared to state and national averages. According to the American Community Survey (2006-2008), within the study area there is a disproportionate percentage of residents that are high school graduates only (including equivalency), at nearly 45 percent of the total. This total is higher than the combined percentages for graduate or professional degrees, bachelor’s degrees, associates degrees, or people with some college, and tracks well below the U.S. average for educational attainment. This indicates that the regions workforce is best suited for skilled labor jobs in the goods movement or logistics industry that do not require college or advanced degrees.
BHJ Freight Study
4-2
Figure 4.1 Population Trend
Source: U.S. Census, 2009.
Cambridge Systematics, Inc.
Population Trend – Age
Source: U.S. Census, 2009. Note: Figures represent total for Brooke, Hancock, and Jefferson
Cambridge Systematics, Inc.
Brooke, Hancock, and Jefferson counties.

Cambridge Systematics, Inc.
Figure 4.2 Population Trend
Source: American Community Survey 2006
4.2 EMPLOYMENT
Consistent with the evaluatiolabor force index has trended lower compared overall to the States of Ohio and West Virginia since 2004BHJ Newsletter, “
of Weirton Steel from 14,meant that more workerunemployment trends described in Figure 4.4. Bureau of Labor Statistics, the MSA tracked somewhatWest Virginia as a whole at between 6 and 7.5 percent.unemployment in the tracked between 2the most recent recession howeverthe study area has gone from about 6 percent to greater than 13 percent, with a peak of nearly 16 percent in 2009. with international competitive challenges since midgreater proportionMSA is located.
6 http://www.bhjmpc.org/Downloads/PDF/Summer%20Issue%202010.pdf
Population Trend – Education
Source: American Community Survey 2006-2008
MPLOYMENT TRENDS Consistent with the evaluation of population distribution and education, the labor force index has trended lower compared overall to the States of Ohio and West Virginia since 2004, as shown in Figure 4.3. As noted in the Summer 2010
“competitive international markets drove the employment size
of Weirton Steel from 14,000+ to less than 1,000 in a 15-year periodmeant that more workers than jobs are available and is consistent with the unemployment trends described in Figure 4.4. Until about 2003, accordingBureau of Labor Statistics, the unemployment rate in the Steubenville
somewhat consistent with the unemployment rate for the State of West Virginia as a whole at between 6 and 7.5 percent. Since that time, however
in the Steubenville-Weirton MSA has spiked and generally tracked between 2-3 percent greater than both Ohio and West Virginiathe most recent recession however, in 2008-2009, the unemployment rate within the study area has gone from about 6 percent to greater than 13 percent, with a
of nearly 16 percent in 2009. This indicates that the regionwith international competitive challenges since mid-2000, has experienced greater proportion of job losses during the recession than the states in which the
http://www.bhjmpc.org/Downloads/PDF/Summer%20Issue%202010.pdf
BHJ Freight Study
4-3
n of population distribution and education, the labor force index has trended lower compared overall to the States of Ohio and
As noted in the Summer 2010 drove the employment size
year period.”6 This has and is consistent with the
Until about 2003, according to the nemployment rate in the Steubenville-Weirton
consistent with the unemployment rate for the State of Since that time, however
has spiked and generally 3 percent greater than both Ohio and West Virginia. During
2009, the unemployment rate within the study area has gone from about 6 percent to greater than 13 percent, with a
region, having dealt has experienced a
than the states in which the
http://www.bhjmpc.org/Downloads/PDF/Summer%20Issue%202010.pdf

BHJ Freight Study
4-4
Figure 4.3 Employment Trend
Source: Bureau of Labo
Figure 4.4 Employment Trend
Source: Bureau of Labor Statistics
Cambridge Systematics, Inc.
Employment Trend – Available Civilian Workforce
Source: Bureau of Labor Statistics
Employment Trend – Unemployment
Source: Bureau of Labor Statistics
Cambridge Systematics, Inc.
Available Civilian Workforce

BHJ Freight Study
Cambridge Systematics, Inc. 4-5
4.3 LAND USE A review of land use is very important due to its link between transportation and development. The majority of land use identified within the study area is either residential or agricultural. Figure 4.5 shows few urbanized areas within the study area with the major concentrations within Steubenville and Weirton city limits and surrounding areas. These correlate to the commercial land in both Ohio and West Virginia within the U.S. 22 highway corridor. There are industrial land use clusters currently scattered throughout the study area with major concentrations near the northeastern bend of the Ohio River between Stratton and Wellsville, Ohio and near the confluence of the NS railroad route from the northwest and the line alongside the Ohio River. There are other pockets of industrial land in north central and southwest Jefferson County. In addition, there is a large proportion of exempt land, mostly consisting of state parks and wilderness areas in both the States of Ohio and West Virginia. Regional planners need to consider opportunities for freight-oriented development proximate to the key economic generators in the region. Improving the infrastructure, especially intermodal linkages, and providing access to available land next to major transportation facilities could lead to attracting new logistics and goods movement oriented businesses to the study area.

BHJ Freight Study
4-6 Cambridge Systematics, Inc.
Figure 4.5 Land Use

BHJ Freight Study
Cambridge Systematics, Inc. 4-7
4.4 FREIGHT-GENERATING BUSINESSES Greater Steubenville-Weirton’s built environment reflects its historic role as a steel producer and heavy manufacturing center. The region is dotted with a large number of freight intensive businesses that either work directly in, or provide support services to, steel or other manufacturing industries. However, a look at recent development in the region finds newer freight intensive activities, such as the Wal-Mart Distribution Center. These types of freight intensive businesses are important to this study, as their transportation needs drive demand on the infrastructure and yield a positive economic impact.
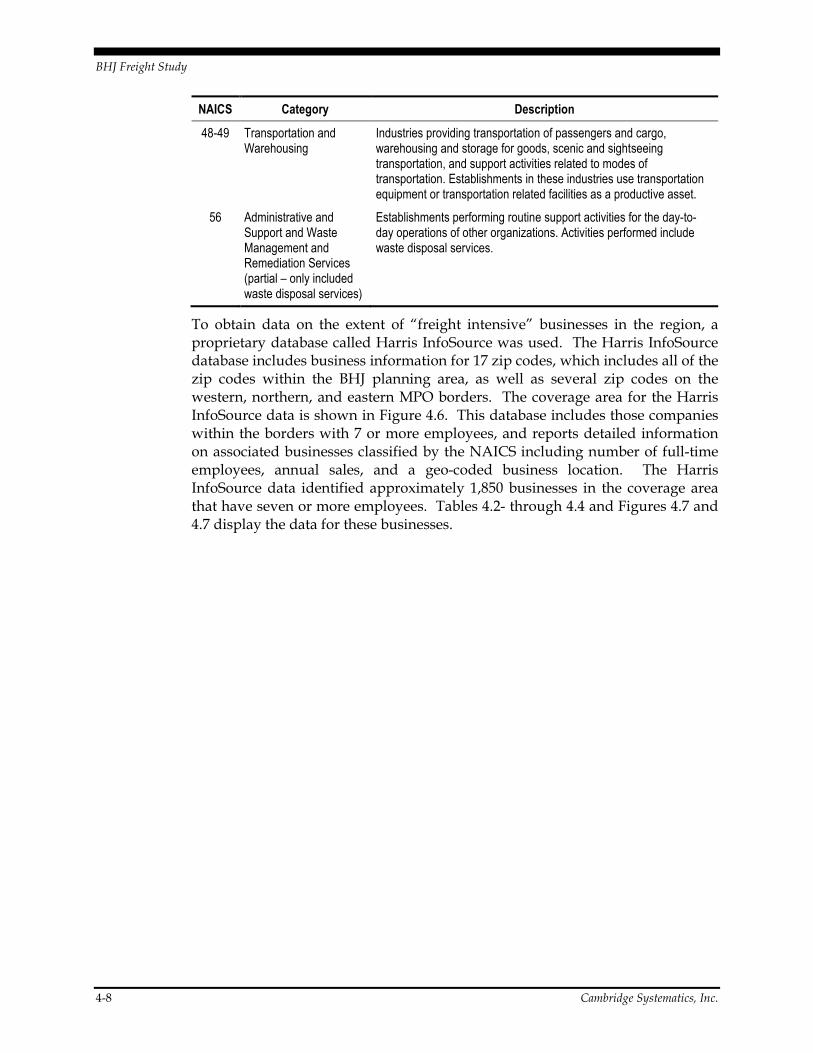
“Freight intensive” businesses, defined in this study, include firms for which the majority of business activity has either a direct or indirect relationship to the movement of commodities or goods. In order to focus on these businesses, this study consulted the North American Industry Classification System (NAICS), the standard used by federal statistical agencies in classifying business establishments for the purpose of collecting, analyzing, and publishing statistical data related to the U.S. business economy7. Table 4.1 displays the “freight intensive” industries identified using the NAICS for further review.
Table 4.1 “Freight Intensive” Industries
NAICS Category Description
11 Agriculture, Forestry, Fishing and Hunting
Establishments primarily engaged in growing crops, raising animals, harvesting timber, and harvesting fish and other animals from a farm, ranch, or their natural habitats
21 Mining Establishments that extract naturally occurring mineral solids, such as coal and ores; liquid minerals, such as crude petroleum; and gases, such as natural gas
22 Utilities Establishments engaged in the provision of the following utility services: electric power, natural gas, steam supply, water supply, and sewage removal (does not include waste management)
31 - 33 Manufacturing Establishments engaged in the mechanical, physical, or chemical transformation of materials, substances, or components into new products
42 Wholesale Trade Establishments engaged in wholesaling merchandise, generally without transformation, and rendering services incidental to the sale of merchandise
44 - 45 Retail Trade Establishments engaged in retailing merchandise, generally without transformation, and rendering services incidental to the sale of merchandise
7 http://www.census.gov/eos/www/naics/
BHJ Freight Study
4-8 Cambridge Systematics, Inc.
NAICS Category Description
48-49 Transportation and Warehousing
Industries providing transportation of passengers and cargo, warehousing and storage for goods, scenic and sightseeing transportation, and support activities related to modes of transportation. Establishments in these industries use transportation equipment or transportation related facilities as a productive asset.
56 Administrative and Support and Waste Management and Remediation Services (partial – only included waste disposal services)
Establishments performing routine support activities for the day-to-day operations of other organizations. Activities performed include waste disposal services.
To obtain data on the extent of “freight intensive” businesses in the region, a proprietary database called Harris InfoSource was used. The Harris InfoSource database includes business information for 17 zip codes, which includes all of the zip codes within the BHJ planning area, as well as several zip codes on the western, northern, and eastern MPO borders. The coverage area for the Harris InfoSource data is shown in Figure 4.6. This database includes those companies within the borders with 7 or more employees, and reports detailed information on associated businesses classified by the NAICS including number of full-time employees, annual sales, and a geo-coded business location. The Harris InfoSource data identified approximately 1,850 businesses in the coverage area that have seven or more employees. Tables 4.2- through 4.4 and Figures 4.7 and 4.7 display the data for these businesses.

BHJ Freight Study
Cambridge Systematics, Inc. 4-9
Figure 4.6 Harris InfoSource Data Coverage
BHJ Freight Study
4-10 Cambridge Systematics, Inc.
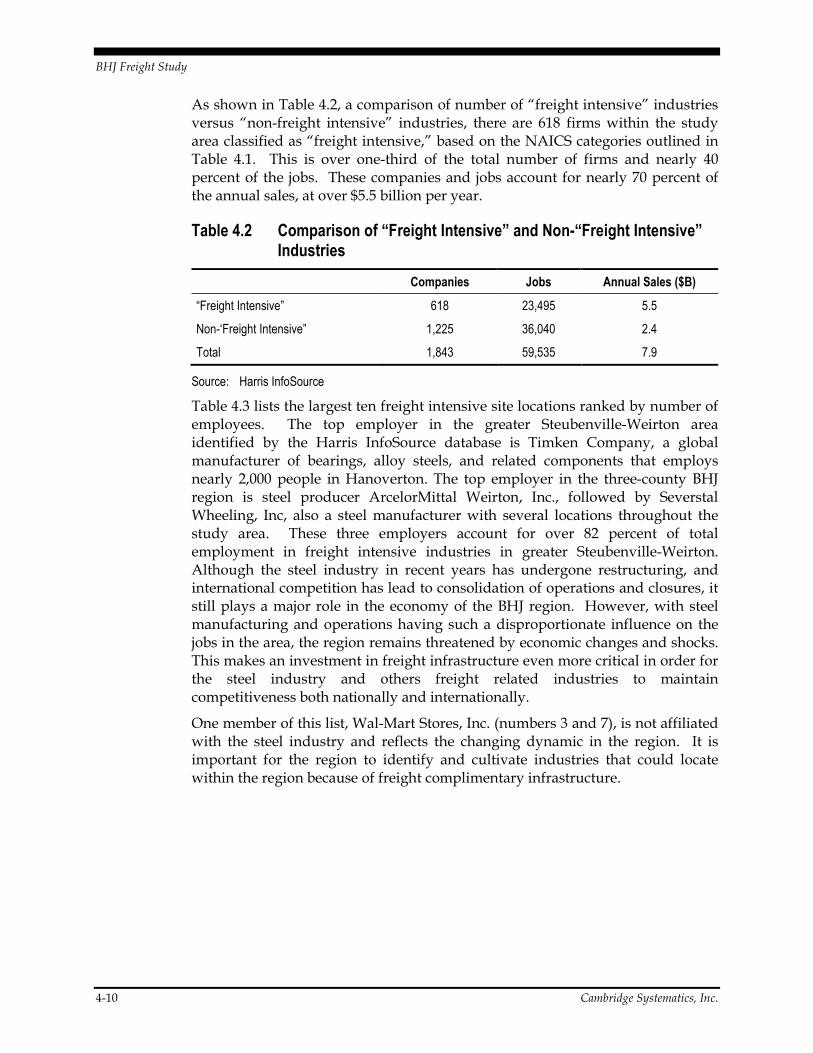
As shown in Table 4.2, a comparison of number of “freight intensive” industries versus “non-freight intensive” industries, there are 618 firms within the study area classified as “freight intensive,” based on the NAICS categories outlined in Table 4.1. This is over one-third of the total number of firms and nearly 40 percent of the jobs. These companies and jobs account for nearly 70 percent of the annual sales, at over $5.5 billion per year.
Table 4.2 Comparison of “Freight Intensive” and Non-“Freight Intensive” Industries
Companies Jobs Annual Sales ($B)
“Freight Intensive” 618 23,495 5.5
Non-‘Freight Intensive” 1,225 36,040 2.4
Total 1,843 59,535 7.9
Source: Harris InfoSource
Table 4.3 lists the largest ten freight intensive site locations ranked by number of employees. The top employer in the greater Steubenville-Weirton area identified by the Harris InfoSource database is Timken Company, a global manufacturer of bearings, alloy steels, and related components that employs nearly 2,000 people in Hanoverton. The top employer in the three-county BHJ region is steel producer ArcelorMittal Weirton, Inc., followed by Severstal Wheeling, Inc, also a steel manufacturer with several locations throughout the study area. These three employers account for over 82 percent of total employment in freight intensive industries in greater Steubenville-Weirton. Although the steel industry in recent years has undergone restructuring, and international competition has lead to consolidation of operations and closures, it still plays a major role in the economy of the BHJ region. However, with steel manufacturing and operations having such a disproportionate influence on the jobs in the area, the region remains threatened by economic changes and shocks. This makes an investment in freight infrastructure even more critical in order for the steel industry and others freight related industries to maintain competitiveness both nationally and internationally.
One member of this list, Wal-Mart Stores, Inc. (numbers 3 and 7), is not affiliated with the steel industry and reflects the changing dynamic in the region. It is important for the region to identify and cultivate industries that could locate within the region because of freight complimentary infrastructure.

BHJ Freight Study
Cambridge Systematics, Inc. 4-11
Table 4.3 Largest Freight Intensive Site Locations - Employment
Rank Company Jobs Site
1 ArcelorMittal Weirton, Inc. 1,300 Weirton
2 Severstal Wheeling, Inc. 1,000 Mingo Junction
3 Wal-Mart Stores, Inc. (Distribution Center) 775 Wintersville
4 Severstal Wheeling, Inc. 650 Yorkville
5 Titanium Metals Corp. 527 Toronto
6 Severstal Wheeling, Inc. 500 Steubenville
7 Bellofram Corp. 400 Newell
8 Severstal Wheeling, Inc. 350 Follansbee
9 Buckeye Power, Inc. 300 Brilliant
10 Kroger Co. 250 Steubenville
Source: Harris InfoSource. Table includes only those sites in Brooke, Hancock or Jefferson Counties.
Table 4.4 displays the largest freight intensive site locations by annual sales. Businesses affiliated with steel production accounts for the majority of total sales. These businesses include Severstal Wheeling, Inc. and Wheeling-Nisshin, Inc. Timken Corp. in Hanoverton also has a large proportion of the sales in the greater Steubenville-Weirton area, $330,942,000. The non-steel related industries, including refining, energy extraction and power generation, account for the remaining sales within the region. The highest sales are shown for the Ergon-West Virginia refinery. The top ten locations alone account for over $2.25 billion dollars in sales for the region. The region has a large stake in the freight intensive industries and needs a transportation system that can support the growth in those industries.
Table 4.4 Largest Freight Intensive Site Locations - Sales
Rank Company Sales Site
1 Ergon - West Virginia, Inc. $481,207,400 Newell
2 Severstal Wheeling, Inc. $388,737,000 Mingo Junction
3 Severstal Wheeling, Inc. $287,094,600 Yorkville
4 Wheeling-Nisshin, Inc. $271,239,000 Follansbee
5 Severstal Wheeling, Inc. $194,368,500 Steubenville
6 Buckeye Power, Inc. $193,573,800 Brilliant
7 Severstal Wheeling, Inc. $164,281,250 Follansbee
8 Jersey Central Power & Light $129,049,200 Stratton
9 Titanium Metals Corp $78,002,324 Toronto
10 Koppers, Inc. $72,271,530 Follansbee
Source: Harris InfoSource. Table includes only those sites in Brooke, Hancock or Jefferson Counties.

BHJ Freight Study
4-12 Cambridge Systematics, Inc.
Figures 4.7 and 4.8 individually list the locations of the major freight generating businesses by number of employees and by annual sales, respectively. It is clear from each graphic that freight intensive industries are concentrated near infrastructure that supports goods movement - both rail and water, with some clustering along major highway corridors. Figure 4.7 shows some firms with large numbers of employees along West Virginia SR 43; however, the density of firms does not occur until the highway approaches the Ohio River, close to the rail lines near Steubenville. The greatest concentration of freight generating businesses with greater than 25 employees is in the urbanized areas of Steubenville and East Liverpool, Ohio, and Weirton and Chester, West Virginia. Clearly, it is more appropriate for the type of businesses that are located within this area to utilize rail and water infrastructure. As businesses transact a large amount of trade in bulk commodities such as coal and steel products, the utilization of rail and water infrastructure, with much lower rates per ton than truck, is appropriate for the region. Still, there are limitations to the rail and water freight infrastructure within the study area, from intermodal connections between the modes to height restrictions and obstructions for barge traffic on the Ohio River.

BHJ Freight Study
Cambridge Systematics, Inc. 4-13
Figure 4.7 Freight-Generating Businesses – Number of Employees
Source: Harris InfoSource

BHJ Freight Study
4-14 Cambridge Systematics, Inc.
Figure 4.8 Freight-Generating Businesses – Annual Sales
Source: Harris InfoSource

BHJ Freight Study
Cambridge Systematics, Inc. 5-1
5.0 Regional Freight Patterns
This section describes the regional freight patterns that affect the BHJ study area. While significant economic impact is brought to the region due to its many local freight intensive industries, these businesses impact freight system operations throughout Ohio, West Virginia, the Midwest, and the Nation. Today, more freight is moving greater distances as part of supply chains among distant trading partners and freight flows and operational considerations do not stop at study boundaries.
The freight flow data presented in Section 3.0 provides a local snapshot of the volume of freight moving on the region’s highway, rail, and waterborne freight systems. In addition to this local data, it is essential to look beyond the region’s borders to understand how freight moving to/from other parts of the nation has an effect on the BHJ freight infrastructure. To accomplish this, this study will use the Federal Highway Administration’s (FHWA) Freight Analysis Framework (FAF) as an analysis tool.
In addition to the semi-regional perspective of goods movement that FAF provides, an online survey tool and one-on-one interviews garnered local stakeholder perspectives. These perspectives of how the local freight system operates, as summarized in Section 6.0, will augment the freight system analysis in future study tasks.
5.1 FREIGHT ANALYSIS FRAMEWORK A solid starting point for compiling freight flow information related to tonnage, value and trading partners by mode was the nationally developed FAF data. FAF integrates data from a variety of sources to create a comprehensive picture of freight movement among states and major metropolitan areas by all modes of transportation. With data from the 2007 Commodity Flow Survey, as well as additional sources, FAF version 3 (FAF3), released in November 2010, provides estimates for tonnage and value, by commodity type, mode, origin, and destination for 2007, the most recent year, and forecasts through 20408.
The BHJ study area focuses on Brooke and Hancock Counties in West Virginia and Jefferson County, Ohio. While FAF3 does not disaggregate data to the counties of interest for this study, this analysis can query a subset of the available FAF information in order to gain an understanding of freight flows in the BHJ region. As noted below, FAF provides data for the following subareas:
8 http://ops.fhwa.dot.gov/freight/freight_analysis/faf/index.htm

BHJ Freight Study
5-2 Cambridge Systematics, Inc.
• Cincinnati, OH-KY-IN CSA (OH Part) – includes Cincinnati-Middletown-Wilmington, OH-KY-IN Combined Statistical Area (OH Part)
• Cleveland, OH CSA – includes Cleveland-Akron-Elyria, OH Combined Statistical Area
• Columbus, OH CSA- includes Columbus-Marion-Chillicothe, OH Combined Statistical Area
• Dayton, OH CSA – includes Dayton-Springfield-Greenville, OH Combined Statistical Area
• Remainder of Ohio – includes all of Ohio, outside the CSAs listed above
• West Virginia – includes State of West Virginia
In the first step, the analysis utilized available data from the above subareas, namely the “State of West Virginia” and the “Remainder of Ohio” as the starting point for the freight flow analysis to generate the BHJ FAF Region.
5.2 FREIGHT VOLUMES Tables 5.1 and 5.2 provide detailed FAF information for the States of West Virginia and Ohio, sorted in order of highest number of 2007 tons. Rail led the pace in West Virginia by tons in 2007; however, it is projected that trucks will outpace rail in 2040 and carry the majority of tons. In Ohio, trucks carried the majority of 2007 tons, and the data in Table 5.2 indicates that trend may continue into 2040. For both Ohio and West Virginia, tons carried by waterborne traffic may drop slightly between 2007 and 2040, but on the other hand, the value of goods transported by water may nearly double.
Table 5.1 Summary Flows by Mode in West Virginia
Mode Tons (000’s) Value ($000’s)
2007 2040 2007 2040
Rail 183,946 126,657 $14,703 $12,259
Truck 141,380 202,732 $90,965 $165,464
Pipeline 14,647 14,316 $7,568 $7,292
Water 9,350 8,521 $774 $828
Multiple modes & mail 8,772 11,717 $10,381 $42,804
Other and unknown 391 502 $1,682 $1,945
Air (include truck-air) 11 29 $463 $3,561
Total 358,497 364,473 $126,536 $234,154
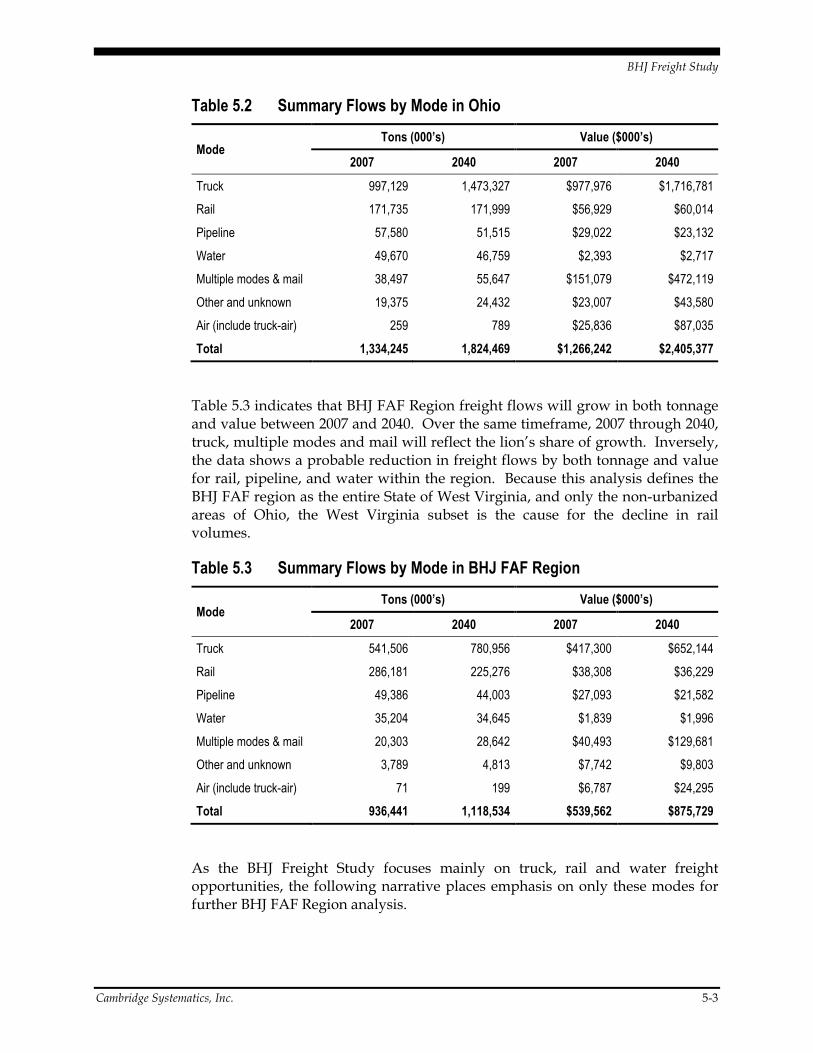
BHJ Freight Study
Cambridge Systematics, Inc. 5-3
Table 5.2 Summary Flows by Mode in Ohio
Mode Tons (000’s) Value ($000’s)
2007 2040 2007 2040
Truck 997,129 1,473,327 $977,976 $1,716,781
Rail 171,735 171,999 $56,929 $60,014
Pipeline 57,580 51,515 $29,022 $23,132
Water 49,670 46,759 $2,393 $2,717
Multiple modes & mail 38,497 55,647 $151,079 $472,119
Other and unknown 19,375 24,432 $23,007 $43,580
Air (include truck-air) 259 789 $25,836 $87,035
Total 1,334,245 1,824,469 $1,266,242 $2,405,377
Table 5.3 indicates that BHJ FAF Region freight flows will grow in both tonnage and value between 2007 and 2040. Over the same timeframe, 2007 through 2040, truck, multiple modes and mail will reflect the lion’s share of growth. Inversely, the data shows a probable reduction in freight flows by both tonnage and value for rail, pipeline, and water within the region. Because this analysis defines the BHJ FAF region as the entire State of West Virginia, and only the non-urbanized areas of Ohio, the West Virginia subset is the cause for the decline in rail volumes.
Table 5.3 Summary Flows by Mode in BHJ FAF Region
Mode Tons (000’s) Value ($000’s)
2007 2040 2007 2040
Truck 541,506 780,956 $417,300 $652,144
Rail 286,181 225,276 $38,308 $36,229
Pipeline 49,386 44,003 $27,093 $21,582
Water 35,204 34,645 $1,839 $1,996
Multiple modes & mail 20,303 28,642 $40,493 $129,681
Other and unknown 3,789 4,813 $7,742 $9,803
Air (include truck-air) 71 199 $6,787 $24,295
Total 936,441 1,118,534 $539,562 $875,729
As the BHJ Freight Study focuses mainly on truck, rail and water freight opportunities, the following narrative places emphasis on only these modes for further BHJ FAF Region analysis.

BHJ Freight Study
5-4 Cambridge Systematics, Inc.
Tons
Figures 5.1 and 5.2 present freight flows by tons in the BHJ FAF Region for 2007 and 2040. In 2007, trucks carried approximately 58% of the freight tonnage in the area. By capturing freight movements previously hauled by rail or water in 2007, tonnage hauled by trucks will increase from 58% in 2007 to 70% in 2040. The freight flow forecasts show a drop in tonnage by rail from 31% in 2007 to 20% in 2040, and water losing 1% of the tonnage share in 2007 to 3% of the share in 2040.
Figure 5.1 Freight Flows by Tons (2007)
Figure 5.2 Freight Flows by Tons (2040)
0% 2% 0%
5%
31%
58%
4%
Air (include truck-air)
Multiple modes & mail
Other and unknown
Pipeline
Rail
Truck
Water
0% 3% 0%
4%
20%
70%
3%
Air (include truck-air)
Multiple modes & mail
Other and unknown
Pipeline
Rail
Truck
Water
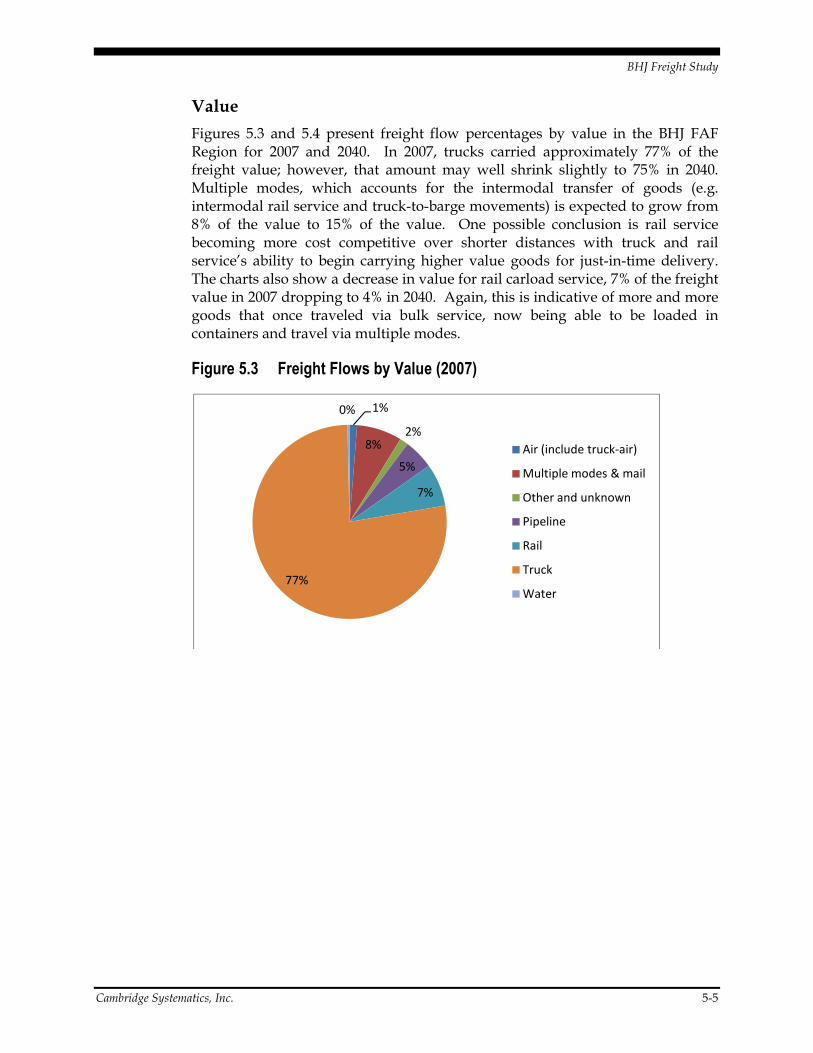
BHJ Freight Study
Cambridge Systematics, Inc. 5-5
Value
Figures 5.3 and 5.4 present freight flow percentages by value in the BHJ FAF Region for 2007 and 2040. In 2007, trucks carried approximately 77% of the freight value; however, that amount may well shrink slightly to 75% in 2040. Multiple modes, which accounts for the intermodal transfer of goods (e.g. intermodal rail service and truck-to-barge movements) is expected to grow from 8% of the value to 15% of the value. One possible conclusion is rail service becoming more cost competitive over shorter distances with truck and rail service’s ability to begin carrying higher value goods for just-in-time delivery. The charts also show a decrease in value for rail carload service, 7% of the freight value in 2007 dropping to 4% in 2040. Again, this is indicative of more and more goods that once traveled via bulk service, now being able to be loaded in containers and travel via multiple modes.
Figure 5.3 Freight Flows by Value (2007)
1%
8%2%
5%
7%
77%
0%
Air (include truck-air)
Multiple modes & mail
Other and unknown
Pipeline
Rail
Truck
Water

BHJ Freight Study
5-6 Cambridge Systematics, Inc.
Figure 5.4 Freight Flows by Value (2040)
5.3 STUDY AREA COMMODITIES
Tons
Figures 5.5 and 5.6 present the commodities in the BHJ FAF Region by tons for 2007 and 2040. In 2007, coal accounted for 29% of the tons carried, however that percent is expected to dramatically shift by 2040 to 18% of the commodity tons. During this period the total coal tonnage is expected to decrease from nearly 274 million tons to just over 191 million tons. This could be due to several causes - waning mining activity in the region, waning manufacturing activity, or the potential shift to non-coal based power generation. The next three top commodities (gravel, cereal grains, and waste/scrap) remain strong by tonnage.
3%
15%1%
2%
4%
75%
0%
Air (include truck-air)
Multiple modes & mail
Other and unknown
Pipeline
Rail
Truck
Water

BHJ Freight Study
Cambridge Systematics, Inc. 5-7
Figure 5.5 Study Area Commodities by Tons (2007)
Figure 5.6 Study Area Commodities by Tons (2040)
Value
Figures 5.7 and 5.8 present the commodities in the BHJ FAF Region by value for 2007 and 2040. For both years, the top commodities appear to contain a diversified mix, with no products dominating the region. Machinery is the top commodity by value for both 2007 and 2040. In 2007, the second leading commodity was motorized vehicles; however, in 2040 this commodity does not appear in the top ten. 2040 shows that heavy manufacturing is waning in the region, with new commodities of precision instruments, chemicals, and pharmaceuticals all at the top of the value list. Mixed freight shipments (often goods packaged in intermodal containers) continue to be in the top ten in 2040.
29%
11%
7%5%5%
4%4%
3%
3%
3%
26%
Coal
Gravel
Cereal grains
Waste/scrap
Coal-n.e.c.
Base metals
Nonmetal min. prods.
Logs
Gasoline
Other foodstuffs
All Other
18%
16%
9%
6%4%4%4%
3%
3%
3%
30%
Coal
Gravel
Cereal grains
Waste/scrap
Nonmetal min. prods.
Chemical prods.
Other foodstuffs
Logs
Nonmetallic minerals
Coal-n.e.c.
All Other

BHJ Freight Study
5-8 Cambridge Systematics, Inc.
Figure 5.7 Study Area Commodities by Value (2007)
Figure 5.8 Study Area Commodities by Value (2040)
Mode
Truck
Figures 5.9 and 5.10 present the commodities in the BHJ FAF Region carried by truck by tons and value. The bar charts illustrate the top ten commodities for the year 2007 as compared to the growth expected for those same commodities in 2040. The figures reveal an increase in total truck tonnage from 541 million tons in 2007 to 780 million tons in 2040, an increase of over 44%.
11%
9%
8%
6%
6%
4%4%4%4%
4%
40%
Machinery
Motorized vehicles
Base metals
Plastics/rubber
Mixed freight
Electronics
Articles-base metal
Gasoline
Other foodstuffs
Chemical prods.
All Other
9%
9%
8%
8%
7%
6%6%
5%4%
4%
34%
Machinery
Precision instruments
Chemical prods.
Pharmaceuticals
Mixed freight
Misc. mfg. prods.
Plastics/rubber
Motorized vehicles
Other foodstuffs
Electronics
All Other

BHJ Freight Study
Cambridge Systematics, Inc. 5-9
Figure 5.9 shows that from a tonnage point of view trucks will continue to carry the same top commodities in the future, however both gravel and cereal grains may significantly grow over the next 30 years. These commodities may very well replace base metals, gasoline, and coal-n.e.c. Figure 5.10 shows that trucks will experience significant growth in value of machinery, mixed freight and chemicals carried, products that historically are well-served by the rail system.
Figure 5.9 Top 10 Study Area Commodities by Truck (Tons)
Figure 5.10 Top 10 Study Area Commodities by Truck (Value)
-
20,000
40,000
60,000
80,000
100,000
120,000
140,000
160,000
00
0's
To
ns
2007
2040
$-
$10,000
$20,000
$30,000
$40,000
$50,000
$60,000
$70,000
$80,000
$0
00
's
2007
2040

BHJ Freight Study
5-10 Cambridge Systematics, Inc.
Rail
Figures 5.11 and 5.12 present the top ten commodities in the BHJ FAF Region carried by rail by tons and value. The bar charts illustrate that the top rail tonnage commodity, coal, will experience significant contraction between 2007 and 2040, as previously noted, without other significant commodity tonnage being captured. Inverse to truck traffic, the charts below indicate that total rail tonnage may slightly decline from an estimated 286 million tons in 2007 to 285 million tons in 2040.
Figure 5.12 shows that so too will the value of coal carried by railroads decline. It appears, from a value perspective, that commodities such as waste/scrap, other foodstuffs, and cereals grains will experience growth over the next 30 years. The statistics seem to link a greater demand for these commodities, in particular foodstuffs and cereal grains, to population growth. However, as indicated by comparing truck and rail mode share for these commodities, it appears that trucks will transport more tonnage and value than rail.
Figure 5.11 Top 10 Study Area Commodities by Rail (Tons)
-
50,000
100,000
150,000
200,000
250,000
00
0's
To
ns
2007
2040

BHJ Freight Study
Cambridge Systematics, Inc. 5-11
Figure 5.12 Top 10 Study Area Commodities by Rail (Value)
Water
Figures 5.13 and 5.14 present the top ten commodities in the BHJ FAF Region carried by water by tons and value. The bar charts illustrate that, similar to rail, the top water tonnage commodity, coal, will experience contraction between 2007 and 2040. From a value perspective, coal shipments may decline slightly by 2040 while crude petroleum, fuel oils, and electronics show growth. These graphs do not predict Ohio’s underutilized waterway system as an opportunity for future growth. Total water tonnage in 2007 was 35 million tons, with tonnage expected to decrease to 34 million tons by 2040.
$-
$2,000
$4,000
$6,000
$8,000
$10,000
$12,000
$0
00
's
2007
2040

BHJ Freight Study
5-12 Cambridge Systematics, Inc.
Figure 5.13 Top 10 Study Area Commodities by Water (Tons)
Figure 5.14 Top 10 Study Area Commodities by Water (Value)
5.4 TRADING PARTNERS Figure 5.15 presents freight flows by trading partner in the BHJ FAF Region for 2007 and 2040. The vast majority of freight movements are domestic in nature (an internal pattern in the U.S. expected to continue into the future through 2040). Additionally, in terms of both tonnage and value, the BHJ FAF Region is
-
5,000
10,000
15,000
20,000
25,000
30,000
35,000
00
0's
To
ns
2007
2040
$-
$100
$200
$300
$400
$500
$600
$700
$800
$900
$1,000
$0
00
's
2007
2040

BHJ Freight Study
Cambridge Systematics, Inc. 5-13
an importing economy, with more goods coming in from international origins than are exported to international destinations.
Figure 5.15 Domestic and International Freight Flows (Tons and Value)
Domestic Freight Flows
Figures 5.16 and 5.17 present freight flows by tonnage and value in the BHJ FAF Region for the top ten domestic origins. Today and in the future, the Midwest is the region’s largest domestic trade originator by tonnage, including Detroit, Michigan, the Combined Statistical Areas (CSA) of Columbus and Cleveland in Ohio, and other parts of Kentucky, Michigan, Illinois and Indiana. From the standpoint of value, the same pattern of receiving goods from other parts of the Midwest remains.
-
200,000
400,000
600,000
800,000
1,000,000
1,200,000
Domestic
Only
Import Export
00
0's
To
ns
2007 Tons
2040 Tons
$-
$100,000
$200,000
$300,000
$400,000
$500,000
$600,000
$700,000
$800,000
$900,000
Domestic Only Import Export
$0
00
's
2007 Value
2040 Value

BHJ Freight Study
5-14 Cambridge Systematics, Inc.
Figure 5.16 Top 10 Domestic Origins (Tons)
Figure 5.17 Top 10 Domestic Origins (Value)
Figures 5.18 and 5.19 present freight flows by tonnage and value in the BHJ FAF Region for the top ten domestic destinations. Today and in the future, the Midwest is the region’s largest domestic trade originator by tonnage. While domestic origins were concentrated in Ohio and several other Midwestern states, the most dominant domestic destinations include eastern Metropolitan Areas such as Pittsburgh, PA, Richmond, VA, Norfolk, VA, and Washington D.C.
-
50,000
100,000
150,000
200,000
250,000
300,000
Remainder
of
Kentucky
Cleveland
OH CSA
Columbus
OH CSA
Detroit MI
CSA
Remainder
of
Michigan
Remainder
of Illinois
Remainder
of Indiana
Wyoming Pittsburgh
PA CSA
Chicago
IL-IN-WI
CSA (IL
Part)
00
0's
To
ns
2007 Tons
2040 Tons
$-
$50,000
$100,000
$150,000
$200,000
$250,000
Detroit MI
CSA
Cleveland
OH CSA
Columbus
OH CSA
Remainder
of Kentucky
Pittsburgh
PA CSA
Remainder
of Indiana
Cincinnati
OH-KY-IN
CSA (OH
Part)
Chicago IL-
IN-WI CSA (IL
Part)
Remainder
of Michigan
Remainder
of
Pennsylvania
$0
00
's
2007 Value
2040 Value

BHJ Freight Study
Cambridge Systematics, Inc. 5-15
Figure 5.18 Top 10 Domestic Destinations (Tons)
Figure 5.19 Top 10 Domestic Destinations (Value)
International Freight Flows
Figures 5.20 and 5.21 present freight flows by tonnage and value in the BHJ FAF Region from International origins. For both tonnage and value, Canada is the region’s largest trading partner for incoming freight. From a value perspective, the region receives goods from Eastern Asia, Mexico, Europe, and Africa. As these goods do not register significant tonnage in Figure 5.20, it is assumed that these commodities are high-value goods, potentially electronics.
-
50,000
100,000
150,000
200,000
250,000
00
0's
To
ns
2007 Tons
2040 Tons
$-
$20,000
$40,000
$60,000
$80,000
$100,000
$120,000
$140,000
$0
00
's
2007 Value
2040 Value

BHJ Freight Study
5-16 Cambridge Systematics, Inc.
Figure 5.20 Imports by Country (Tons)
Figure 5.21 Imports by Country (Value)
Figures 5.22 and 5.23 present freight flows by tonnage and value in the BHJ FAF Region with international destinations. For both tonnage and value, Canada is the region’s largest trading partner for outgoing freight, with Eastern Asia, Mexico, and Europe contributing as well. Comparing tonnage and value charts between international imports and exports, it is evident that this region is a net-importer of goods.
-
5,000
10,000
15,000
20,000
25,000
Africa Canada Eastern
Asia
Europe Mexico Rest of
Americas
SE Asia &
Oceania
SW &
Central
Asia
00
0's
To
ns
2007 Tons
2040 Tons
$-
$2,000
$4,000
$6,000
$8,000
$10,000
$12,000
$14,000
$16,000
$18,000
$20,000
Africa Canada Eastern
Asia
Europe Mexico Rest of
Americas
SE Asia &
Oceania
SW &
Central
Asia
$0
00
's
2007 Value
2040 Value
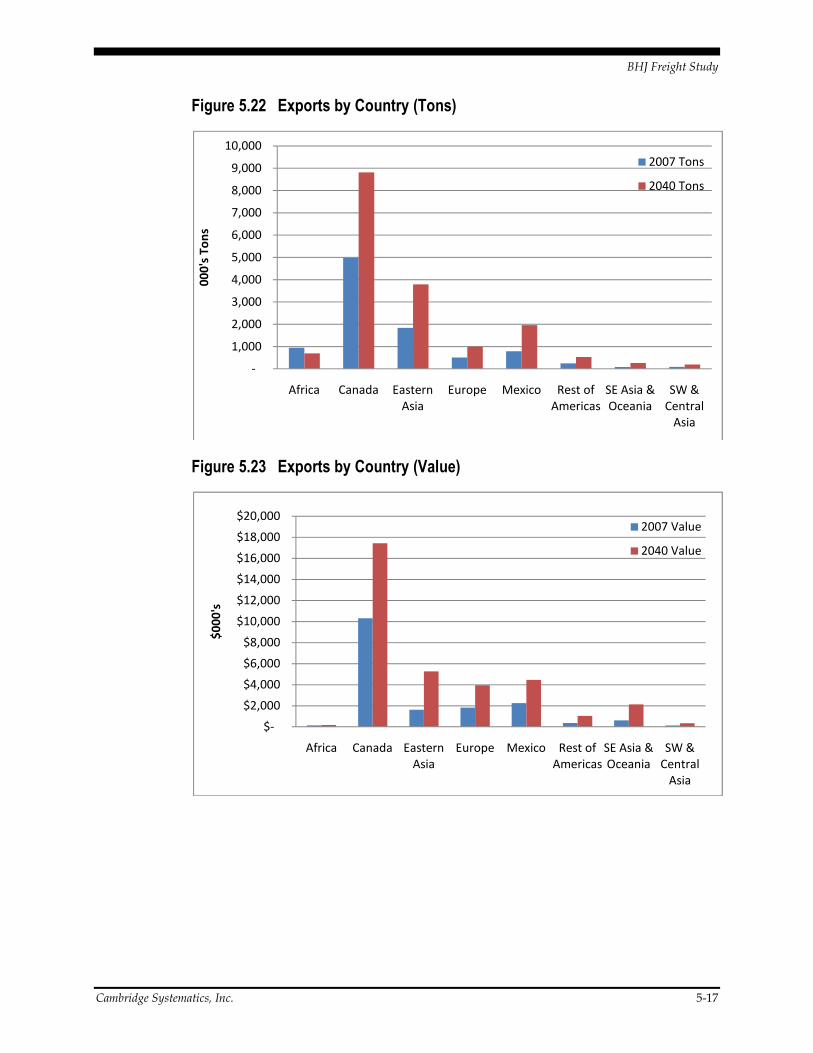
BHJ Freight Study
Cambridge Systematics, Inc. 5-17
Figure 5.22 Exports by Country (Tons)
Figure 5.23 Exports by Country (Value)
-
1,000
2,000
3,000
4,000
5,000
6,000
7,000
8,000
9,000
10,000
Africa Canada Eastern
Asia
Europe Mexico Rest of
Americas
SE Asia &
Oceania
SW &
Central
Asia
00
0's
To
ns
2007 Tons
2040 Tons
$-
$2,000
$4,000
$6,000
$8,000
$10,000
$12,000
$14,000
$16,000
$18,000
$20,000
Africa Canada Eastern
Asia
Europe Mexico Rest of
Americas
SE Asia &
Oceania
SW &
Central
Asia
$0
00
's
2007 Value
2040 Value

BHJ Freight Study
6-18 Cambridge Systematics, Inc.
6.0 Stakeholder Outreach Summary
6.1 APPROACH In recognition that the region’s freight stakeholders are a primary resource for information on which this study will be based, a key component of the study focused on gathering input from the region’s stakeholders. A three-pronged approach was used to ensure all relevant stakeholder perspectives were received - an online survey, individual one-on-one interviews, and input from BHJ Freight Study Steering Committee members at the study’s kick-off meeting. Each of these outreach efforts sought input from representatives of both the public and private sectors.
Online Survey
The online survey asked a range of questions about the freight system in the region. The survey rated overall freight system performance, as well as the trends, obstacles, and improvements in each of four modes: trucking, railroads, waterborne freight, and aviation. Major freight-generating industries were identified, as well as the principal commodities shipped into and out of the region. Other questions related to workforce issues, land use regulations, funding options, and the linkages between economic development and freight mobility.
The link to the online survey was distributed to approximately 300 individuals from both the public and private sectors, with “freight intensive” industries as the focus for the private sector interviewees. Most of these companies were selected from a stakeholder mailing list maintained by BHJ. In addition, this was supplemented by a purchased database of employers in the greater Steubenville-Weirton area, Harris InfoSource. Employers in “freight intensive” industries were selected using their associated North American Industry Classification System (NAICS) codes. Industries included manufacturing, transportation and warehousing, mining, wholesale trade, and construction.
Stakeholder Interviews
To supplement the online surveys, five key stakeholders were identified for the one-on-one interviews. These interviews included representatives of the following stakeholder groups:
• Class I Railroad
• United States Army Corps of Engineers

BHJ Freight Study
Cambridge Systematics, Inc. 6-19
• Statewide Trucking Associations
• Local steel industry representative
• Major shipper
The goal of these interviews was to develop a deeper understanding of the challenges, opportunities, needs, and trends in the region’s freight system. The one-on-one interviews were conducted by telephone, with one or more members of the project team participating. While each interview was customized to apply directly to the participants, questions focused on current and future issues concerning freight transportation by mode in the study area, potential infrastructure improvements that would enhance freight mobility, issues related to economic development and business growth, funding, and potential regulatory and policy changes that might support economic growth in the region.
BHJ Freight Study Steering Committee Kick-Off Meeting
The kick-off meeting of the BHJ Freight Study Steering Committee convened at the BHJ offices in Steubenville on September 22, 2010. At this meeting, the study team presented the scope of work, schedule, and process for the ongoing freight study as well as some of the early data they had assembled for the study. During the meeting, the study team provided Steering Committee members an opportunity to discuss their thoughts and concerns regarding freight mobility in the BHJ region, and the importance of the linkage between mobility and economic development. The study team recorded all input that was received at this meeting, the result of which is summarized below.
6.2 RESULTS Results from the online survey, one-on-one interviews with key stakeholders, and steering committee member input are included below.
Response Rate
The online survey yielded responses from eight public sector and eight private sector individuals. Seven people from five key stakeholder groups participated in one-on-one telephone interviews.
Responses included private sector industry input from representatives of railroads, the waterborne freight industry, and a variety of shippers. Public sector interviewees included representatives from the U.S. Army Corps of Engineers, statewide trucking associations, a rail development commission, and representatives from cities and counties in the study area.
Ten representatives of both public and private sectors in the region attended the BHJ Freight Study Steering Committee kick-off meeting. Participants included rail carriers, manufacturers, municipalities, economic development agencies, and state department of transportation representatives.

BHJ Freight Study
6-20 Cambridge Systematics, Inc.
Freight System Performance
Survey and interview respondents indicated several areas where the greater Steubenville-Weirton area’s freight system is performing well. Responses cited highways several times, specifically 4-lane highways and access to major roadways such as U.S. 22 and I-70, while other parts of the system that were identified as working well included aviation (via the Pittsburgh airport) and access to the Ohio River.
Topping the list of areas of the system identified as not working as well were intermodal connections, whether between highways and rail or waterways and rail. Also identified as needed were last-mile improvements. Respondents also considered the Ohio River, which is running at less than 50% of its capacity, as underutilized.
Interviewees cited a need to provide safe, reliable service with options on all modes in order to create a healthy regional freight system.
Major Freight-Generating Industries
The greater Steubenville-Weirton area’s major freight-generating industries identified by survey respondents were:
• Agriculture, Forestry, and Fishing
• Mining
• Manufacturing
• Transportation, Communications, Electric, Gas, and Sanitary Services
• Wholesale and Retail Trade
In addition to these, distribution and logistics was identified as an emerging industry in the region.
Principal Commodities Shipped
The survey asked respondents to identify the principal commodities that are shipped into and out of the region. The most common responses included:
• Chemical Products
• Miscellaneous Manufacturing Products
• Coal
• Machinery
• Waste/Scrap
• Wood products
Beyond the survey responses, interviews with key stakeholders provided additional insight on this topic. For example, nearly ¾ of the freight on the Ohio River in the region is coal or coal coke. Other significant waterborne
BHJ Freight Study
Cambridge Systematics, Inc. 6-21
commodities are crude materials, chemical products, and petroleum products. Coal, municipal waste, and steel industry-related products dominate the commodities carried by rail in the area. The trucking industry serves warehouses, manufacturing facilities, and distribution centers in the region.
Freight Movements
Highway facilities that businesses rely on included several inside and outside the greater Steubenville-Weirton region. Inside the study area, the most often-cited routes included U.S. 22, an east-west route passing directly through the center of the study area across the Ohio River connecting Steubenville and Weirton. Other state routes include Ohio SR 7 and West Virginia SR 2, which parallel the Ohio River on the west and east side, respectively; and Ohio SR 43 connecting Steubenville and Canton, Ohio.
Important Interstate highways beyond the study area include I-70, an east-west Interstate Highway to the south, I-80, an east-west route to the north, I-77 a north-south route west of the study area, and I-79, a north-south route east running through Pittsburgh. Additionally, Ohio SR 11 travels from the northern tip of the study area, through Youngstown and Warren, and north to Lake Erie.
Trucking
The trucking industry is very important to the region’s freight system. A majority of surveyed private-sector representatives indicated that either most or all of their freight shipments move by truck.
Trends
Responses indicated that the global economic downturn of the past few years has clearly affected the trucking industry. Interviews with representatives from the industry revealed an expectation that business will pick up again in the near future. Some sectors are already picking up, although the market is still tight in many others. In the future, issues in the industry revolve around funding, since levels of funding direct the ability to invest in maintenance, safety, and capacity on the roadways.
Obstacles
Survey results identified several obstacles to efficiency for trucking in the region. The most important obstacle identified was access to and adequacy of the Ohio River crossings. Following this was roadway conditions and issues with speed or congestion. One interviewee cited windy local roads as an issue. On the positive side, respondents rated chokepoints and redundancy in routing options as not being issues.
Improvements
The survey asked respondents to identify the most needed improvements for trucking in the region. Among infrastructure projects, system maintenance was by far the most frequent choice. Rated also as much needed were intersection
BHJ Freight Study
6-22 Cambridge Systematics, Inc.
and interchange improvements. Rest areas, truck parking, and vertical clearances all tended to be rated as not very important.
Rail and Intermodal
Trends
Railroads require continual capital investment by the private sector. The greater Steubenville-Weirton area has vast rail infrastructure, stemming from its history of manufacturing and steel production, and excess capacity given the general decline in those industries. Because of this existing infrastructure, the region is in a position to attract rail-oriented businesses. Railroads expect an increase in rail cargo volumes over the next five to ten years, while other anticipated trends include a need for investment in rail to relieve highway congestion. Another increasingly important improvement anticipated in the future is intermodal connections. Railroads also see expansion and maintenance of rail facilities as essential for mine development in the region.
Obstacles
The biggest identified obstacles to efficiency for the rail and intermodal freight system in the region include rail abandonment and system preservation. An important rail line in the region abandoned in the 1990’s is the east connection of the Panhandle Line from Weirton to Pittsburgh, PA. Other lines in danger of abandonment are often spun off by Class I railroads to short lines, who are able to get public funding assistance for line preservation. Speed reduction is one of the biggest problems on lines due to reduced maintenance, as maintenance budgets are often determined by the amount of traffic on the line. Another factor mentioned was the need for more access points to the rail system in the region.
Steering committee members pointed out that while the area has some excess rail capacity; chokepoints exist at tunnels and overpass clearances that could hamper usage of rail infrastructure. These chokepoints prohibit the railroads traveling through the area the ability to handle double-stacked trains. The committee also cited rate structures and trackage rights as concerns. Additionally, members expressed the need for increased rail competition.
Improvements
The most-needed improvement to rail infrastructure, as rated by survey respondents, is greater intermodal investment. The survey also rated other infrastructure projects and rail improvements as much needed. The steering committee identified last-mile connections, such as rail spurs, as a way to improve multi-modal connectivity. Respondents did not see at-grade crossings and community impact mitigation as being the most important improvements.
Waterborne Freight
Trends
It is generally felt that the freight movements on the river will increase as the economy recovers. On the other hand, environmental regulations may inhibit future growth, as coal moving to electricity generation plants or coke-producing

BHJ Freight Study
Cambridge Systematics, Inc. 6-23
plants is the principal commodity traveling on the Ohio River in the region. With the river operating at less than 50 percent of capacity, there is significant room to grow into the future.
Obstacles
Some of the obstacles facing the waterborne freight industry, as identified by survey respondents, include the need for supporting port infrastructure. Rated also a significant obstacle was access to the waterborne freight port system, through the highway and rail system. Commodity flows in the study area show that the rail or trucking industry is picking up or dropping off very little river traffic. Not seen as obstacles by waterborne freight survey respondents were capacity, reliability, and bridge clearance.
Improvements
Those surveyed cited port access, via highway or rail as a needed improvement in the region’s waterborne freight system. Survey respondents also viewed expansion of port facilities in the area – another way to improve access – as important. Other important needs included harbor and channel maintenance improvements. Steering committee members identified rate structures and access as areas needing improvement in the connections between rail and ports.
Aviation
The freight aviation industry seemed less understood by survey respondents. Only 25 percent of respondents said they were familiar with the aviation system in the greater Steubenville-Weirton area. Perhaps one reason may be that the largest airport in the study area, Jefferson County Airpark, is a general-aviation airport only. The nearest major airport is Pittsburgh International Airport, approximately 30 miles away from the study area.
Trends
Steering committee members noted that there is not a significant presence of aviation business in the area. In their view, the way to change this is to attract businesses to the region that will use the region’s multimodal transportation options.
Obstacles
Survey respondents considered cost as the biggest obstacle to efficiency in the region’s air freight system. Notably, distance to the nearest airport was a non-factor, indicating that the Pittsburgh International Airport is serving the needs of the region.
Improvements
Interviewees or survey respondents suggested no improvements to the aviation system.

BHJ Freight Study
6-24 Cambridge Systematics, Inc.
Land Use Issues and Regulations
Several land use issues and regulations have impacts on businesses in the region. Public-sector survey respondents listed availability of land, either to expand existing facilities or in proximity to intermodal facilities, as the top concern. Private-sector respondents said that government incentives and subsidies would have a major impact on their business. Zoning restrictions on potential expansion or construction of new sites was another significant concern. Survey responses did not view public resistance as a problem. One problem cited was the need for additional truck parking areas or truck stops, since there are designated hours that trucks can unload, requiring truck drivers to park and wait until that time.
The survey asked public-sector respondents about their level of coordination with other municipalities when it comes to freight planning. The vast majority of respondents indicated that there is a lack of coordinated planning between adjacent municipalities in this region.
Involvement of the freight industry or industry representatives in freight planning occurs with about half of public-sector respondents. Interviewees from the private sector indicated a relationship with public-sector agencies.
Slightly more than half of public-sector survey respondents, and about a quarter of private-sector respondents, said that they have participated in public-private partnerships.
Attractive Business Location Elements
The Steubenville-Weirton area has several elements that make it an attractive business location. Survey respondents indicated that the most important element is location. It is located in close proximity to the Pittsburgh, Columbus, and Cleveland markets, three important population centers. Another element of location is proximity to transportation infrastructure. The Ohio River runs through the study area, there is access to several Interstate highways, and several railroads serve the area.
A second major element cited related to costs. In the area, land is relatively low-cost and taxes are comparatively lower than other parts of the country.
Workforce Issues
The survey asked private-sector survey respondents about the workforce issues faced in the freight industry. Expenses of training workers topped the list as the biggest issue. An additional concern is the availability of a skilled workforce over the next five to ten years. The longer-term outlook for skilled workforce is also a concern, albeit at a slightly lower level.
Training opportunities for workers in the region is also a concern, as poorly trained workers and the lack of education or training available specific to freight/logistical operations both were rated as significant issues. Several

BHJ Freight Study
Cambridge Systematics, Inc. 6-25
comments on this topic related to needing better educated and more highly motivated workers.
Interviewees mentioned the aging workforce, and problems attracting young workers to the region and to the freight and manufacturing industries.
Funding Options
Survey respondents were asked to rate a set of options for funding freight system improvements in the region. The two most highly rated options were innovative public-private partnerships in financing, and joint economic development districts. A highly rated response was municipal contributions to pooled funds for regional freight projects. Next on the list were public port authorities, which had significant support from public-sector respondents.
Tolls, property taxes, fuel tax increases, and development impact fees all scored very poorly on this question, especially with private-sector respondents.