introduction to x-ray absorption near edge … to x-ray absorption near edge spectroscopy (xanes)...
TRANSCRIPT

Introduction to X-ray Absorption
Near Edge Spectroscopy (XANES)
Ritimukta Sarangi SSRL, SLAC
Stanford University June 28, 2010

1s 2s 2p 3p 3s 3d continuum
K-edge
L-edges
An edge results when a core electron absorbs energy equal to or greater than its binding energy. Edges are labeled according to the shell the core electron originates from. XAS is an element specific technique.
Basics of X-ray Absorption Spectroscopy (XAS)
Cu K-edge ~9000 eV Cu L-edges ~930 eV Cu M-edges ~70-120 eV
Fe K-edge ~7000 eV Fe L-edges ~720 eV Fe M-edges ~50-100 eV
S K-edge ~2472 eV S L-edges ~200 eV

Pre-edge and Edge (XANES)
EXAFS (extended x-ray absorption fine structure)
XAS or XAFS
Abs
orpt
ion
Coe
ffici
ent (
mu)
Electronic and Geometric Information
Geometric Information
X-ray Absorption Spectrum (XANES + EXAFS Region)

Fast data acquisition time and high signal-to-noise ratio. Can be measured at room temperature without depreciation of data quality.
The pre-edge region can be used to estimate: Ligand-field Spin-State Centrosymmetry
The rising-edge region can be used to estimate:
Geometric Structure Metal-Ligand overlap via Shakedown transitions Ligand arrangement in certain cases Charge on the metal center
Importance of XAS Edges

Qualitatively Uses edges as a “fingerprint” of the electronic structure Compare to known model complexes Use in PCA analysis
Molecular Orbital-Based Approach Obtain a more quantitative description Understand energy and intensity distributions using LF theory Works well for bound state transitions Fails for rising-edge and beyond.
Multiple Scattering-Based Approach Required to simulate rising edge FEFF, MXAN Difficult to relate back to an MO-based picture
Band Structure Approach Density of States
Interpretation of XAS Edges

Metal K-edge XAS
L 3p M 3d
M 4p
M 1s
ener
gy
continuum continuum
edge
edge
pre-edge
pre-edge
Metal K-pre-edge absorptions arise due to a quadrupole-allowed dipole-forbidden 1s 3d excitation (Δl = ±2) - weak Metal K-rising edge absorptions are electric dipole allowed (Δl = ±1)- Intense

Factors that Affect Metal K-edge Shape and Energy
Oxidation State
The rising-edge and the edge maxima shift to higher energy as the oxidation state increases.
Important consideration – similar ligand system.
Cu(II) Cu(III)

Factors that Affect Metal K-edge Shape and Energy
Oxidation State Contd
Both Fe samples. What oxidation states do they represent?
Both Ni samples. What oxidation states do they represent?
Fe(II) Fe(II)
Ni(II) Ni(III)
Spin states are different! High-Spin (S=2) and Low-Spin (S=0)
Ni is special case with little change upon oxidation!

Factors that Affect Metal K-edge Shape and Energy
Coordination Number and Geometry
0.0
0.4
0.8
1.2
8980 8990 9000 9010
Nor
mal
ized
Abs
orpt
ion
Energy ( eV )
2-coord Cu(I) 3-coord Cu(I) 4-coord Cu(I)
Coordination no: 2 3 4
x
y
z
4px,y,z
px,y
pz
px
Py,z px,y,z
Ene
rgy
Cu Cu Cu
Rising edge has strong contribution from the 1s to 4p transition.
In special cases where the 4p orbital is low-lying, the energy and intensity of the edge transition can be used to estimate coordination number/geometry

L 3p M 3d
M 4p
M 1s
Factors that Affect Metal K-edge Shape and Energy
Covalency
0.0
0.4
0.8
1.2
8980 9000 9020
Nor
mal
ized
Abs
orpt
ion
Energy ( eV )
Energy and intensity can be correlated with metal-ligand overlap using the VBCI model.
In comparable systems: Intensity Covalency Energy 1/Covalency
L 3p M 3d
M 4p
M 1s
L 3p M 3d
M 4p
M 1s
Shakedown

Factors that Affect Metal K-edge Shape and Energy
Pre-edge Shape and Energy
7109 7111 7113 7115
Energy ( eV )
Pre-edge intensity Deviation from Centrosymmetry Metal 3d-4p mixing
Pre-edge intensity pattern is dependent on: Spin-State b) Oxidation-State c) Ligand-Field splitting d) Multiplet-Effects
Pre-edge intensity-weighted average energy is modulated by Ligand-Field strength
Fe N
N N
N Fe
N
N N
N
O
O
Fe N
N N
N N
N 0.0
0.4
0.8
1.2
7110 7130 7150
Nor
mal
ized
Abs
orpt
ion
Energy ( eV )

Metal K-pre-edge: Quantitative Use
Pre-edge intensity Deviation from Centrosymmetry Metal 3d-4p mixing
Fe Fe Fe Fe > > >
0.0
0.4
0.8
1.2
7110 7130 7150
Nor
mal
ized
Abs
orpt
ion
Energy ( eV )
7112 7116
Sq-py Td Sq-Py* Oh
Td Oh
Td 4p orbitals : t2 symmetry 3d orbitals: t2 and e symmetry Mixing = Intense pre-edge
Oh 4p orbitals : t1u symmetry 3d orbitals: t2g and eg symmetry No Mixing = Weak pre-edge

Metal K-pre-edge Energy
Cu 3dx2-y
2
ener
gy
Ligand Field
Zeff
2p
1s
Pre-edge intensity-weighted average energy is modulated by Ligand-Field strength
Zeff or charge on the metal affects the energy of all energy levels equally, therefore has minimal effect on pre-edge energy position
0.0
0.4
0.8
1.2
8980 9000 9020
Nor
mal
ized
Abs
orpt
ion
Energy ( eV )
8976 8978 8980 8982

Pre-edge Example 1 : Cobalamin
Vitamin B12 derivative: Cobalamin
Problem: Determination of Co-C bond distance in Me-Cobalamin

-8.0
-4.0
0.0
4.0
8.0
0 5 10 15
k3 *
EX
AFS
k ( Å-1 )
Data courtesy Prof. Serena DeBeer
Pre-edge Example 1 : Cobalamin Crystallography consistently gave a long Co-C distance than reasonable.
Question – Could the diffraction data have error from beam-damage/decomposition?
Me-Cbl H2O-Cbl
Me-Cbl and H2O-Cbl have similar EXAFS
0.0
0.5
1.0
1.5
7750 7850N
orm
aliz
ed A
bsor
ptio
nEnergy ( eV )
7708 7712 7716
Me-Cbl H2O-Cbl
Pre- and rising-edge data distinct
Near-edge data were used to show a) crystal structure was erroneous b) determine the Me-Co distance to atomic resolution.

Pre-edge Example 2 : MCR
Methyl Coenzyme M Reductase
1 billion tonnes of methane is generated annually by MCR. Active site contains a Ni-tetrapyrrolic cofactor called F430.
Enzymatic activity is observed only in its fully reduced state - Ni(I)
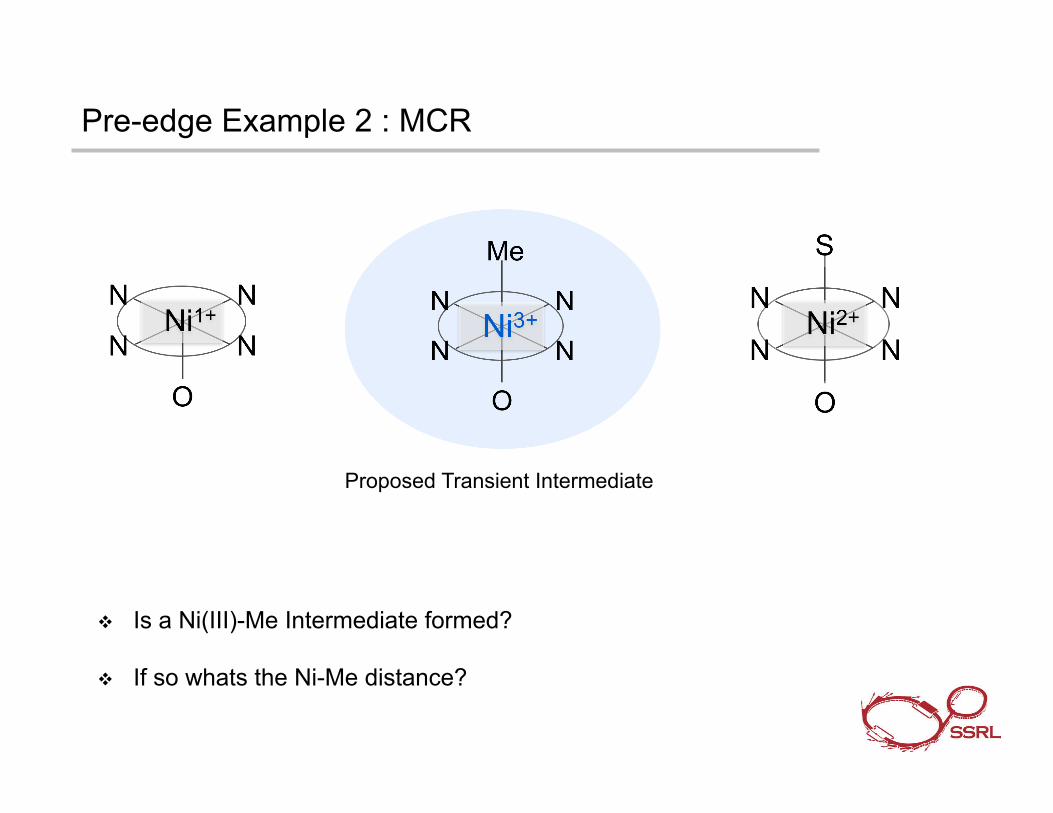
Pre-edge Example 2 : MCR
Proposed Transient Intermediate
Is a Ni(III)-Me Intermediate formed? If so whats the Ni-Me distance?
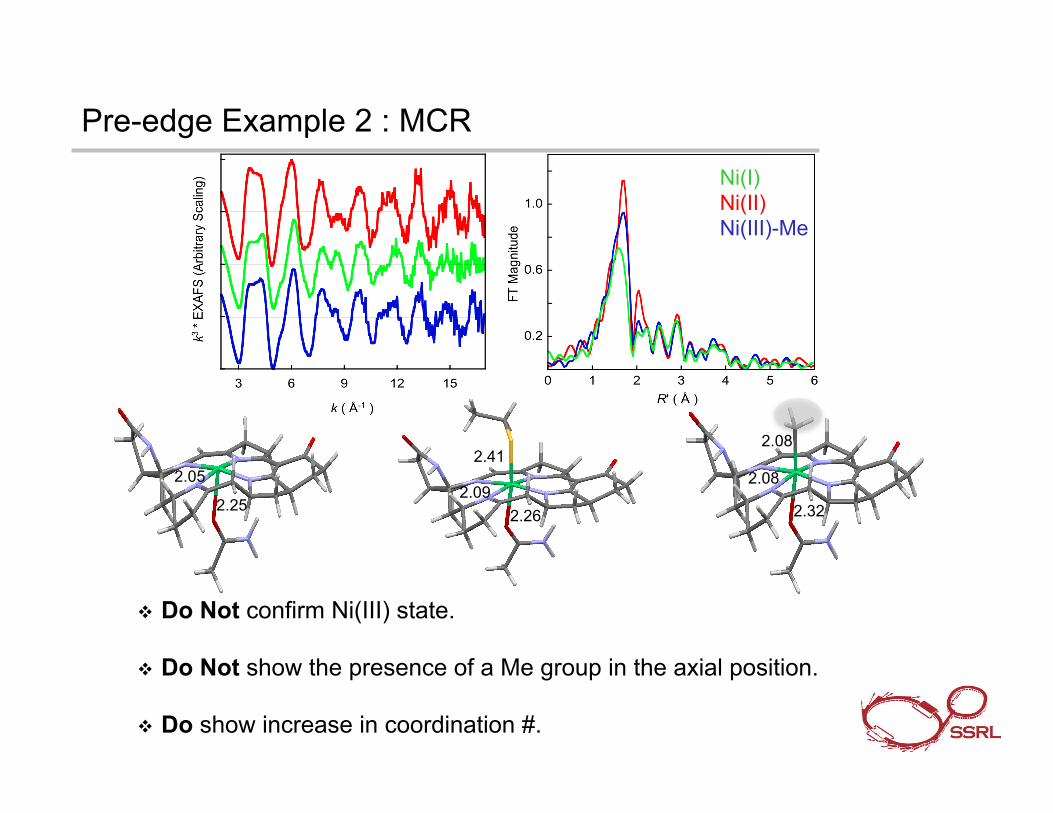
Pre-edge Example 2 : MCR
2.41
2.26 2.09
2.25
2.05
2.08
2.32
2.08
Do Not confirm Ni(III) state.
Do Not show the presence of a Me group in the axial position.
Do show increase in coordination #.
Ni(I) Ni(II) Ni(III)-Me
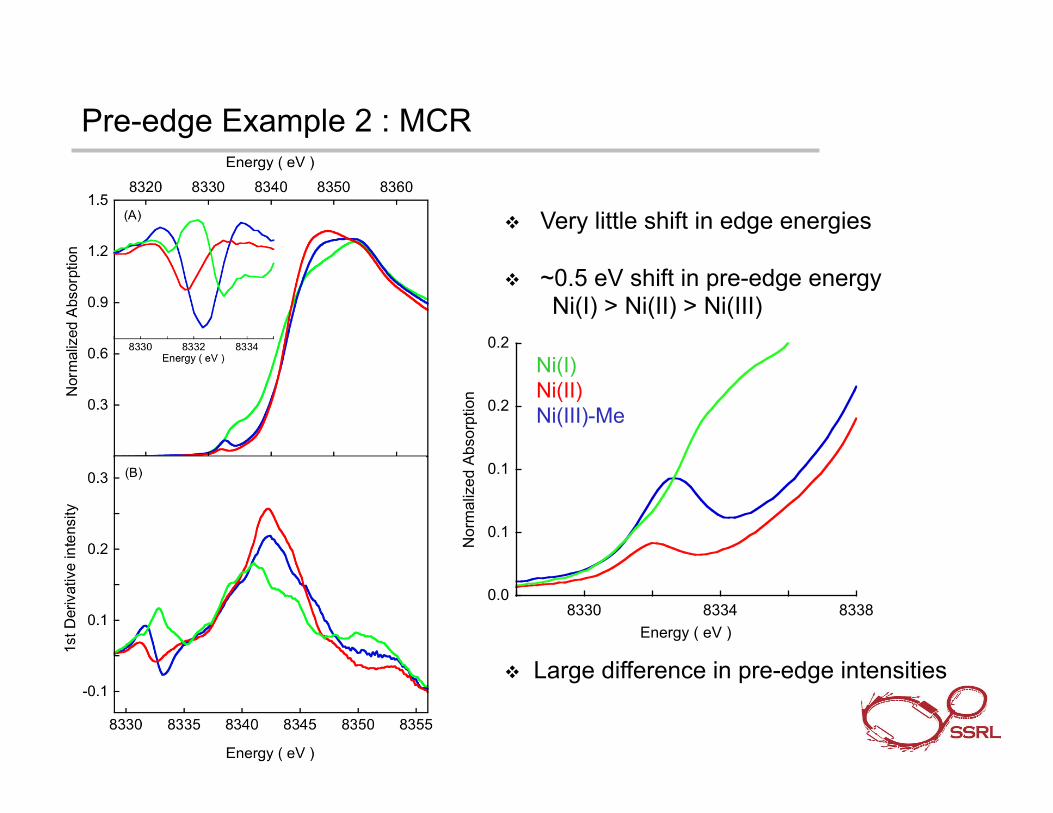
Pre-edge Example 2 : MCR
Very little shift in edge energies ~0.5 eV shift in pre-edge energy
Ni(I) > Ni(II) > Ni(III)
0.0
0.1
0.1
0.2
0.2
8330 8334 8338
Nor
mal
ized
Abs
orpt
ion
Energy ( eV )
Large difference in pre-edge intensities
Ni(I) Ni(II) Ni(III)-Me

Pre-edge Example 2 : MCR
0.00
0.04
0.08
8328 8332 8336
Nor
mal
ized
Abs
orpt
ion
C
Energy ( eV )
DFT Calculations
The high intensity only occurs in the case of a Ni-Me coordination.
The energy of the transition is only achieved in the case on Ni(III).
The intensity and energy are in the right place when a trans-axial ligand is present.

Near-edge Analysis for Structure Determination
EXAFS data not available to high k due to very low concentrations? EXAFS data too weak beyond k ~ 10 Å-1 ? Sample undergoes beam-damage too fast to obtain good quality data?
Comparison of data at different temperatures is required? Micro-XANES data with low signal/noise ratio?
Near-edge XAS has interesting features, but EXAFS are plain ?

Multiple-Scattering Approach to XANES Data Analysis
MXAN – Multiple Scattering XANes
Full multiple-scattering Theory. The potential is generated using the Muffin-tin approach.
EXAFS: SERIES Solution
φTotal=φ1+ φ2+………… φn
MXAN: EXACT Solution
ALL Scattering Paths

Method can be applied to dilute samples. ( k =6-7 Å-1) A full multiple-scattering analysis gives important angular information.
Can be applied to higher temperature samples. Since MXAN obtains an exact solution using all possible MS components the bond-distance resolution is infinite.
MXAN: Near-edge Analysis

MXAN: Near-edge Analysis
Fits are performed on data set : -10 eV to ~200 eV (0 eV = Edge Inflection) Initial structural parameters added as Cartesian or polar coordinates for all the atoms of a model of choice. The structural and non-structural parameters are varied iteratively (shown to have very low interdependence).
x
y
z
R !
"
!"! #$===
N
1iii
2i
2.expi
N
1inn
.thi
2sq w/w}/]y,..),r(..y{[R

Sepctroscopic studies on the wild-type and the mutant (N694C) protein show that N694C has a distorted active site.
However no information is available on whether the S is bound
Geometric Structure of N694C sLO1
Fe (His)N
N(His)
N(His)
(Ile)O (Cys)S
O(Gln)

Structural Possibilities
Fe (His)N
N(His)
N(His)
(Cys)S
O(Gln) Fe
(His)N N(His)
N(His)
(Cys)S
O(Gln) (His)N
N(His)
N(His)
(Cys)S
H2O
Fe O
O (Gln)
Geometric Structure of N694C sLO1

Geometric Structure of N694C sLO1
1 O/N 1.96 4 O/N 2.12 1 O/N 2.49
1 O/N 1.97 3 O/N 2.12 1 S 2.28
1 O/N 1.97 4 O/N 2.12 1 S 2.71
F=0.136 F=0.138 F=0.150
The EXAFS fits show that the data are consistent with several different structural models (different coordinations at the Fe site)

F=3.71 F=0.95 F=3.91
MXAN Fits using different models gave error values that were distinctly different to differentiate between the possible local structures. The data reveal that the geometric structure is best described as a 5+1 coordinate structure with 1 long Fe-O(H2O) bond.
MXAN Analysis of N694C sLO1

The edge-region of an XAS spectrum provides a powerful spectroscopic tool for geometric and electronic structure elucidation.
Information related to: Oxidation State Spin State Covalency Site-symmetry Ligand Field Local Structure
A lot is still not known about the rising-edge and near-edge region. Theoretical advances will unlock this region and help us better understand our data in the future.
Summary of XANES Talk

A special thanks to all authors of the articles, which were presented in this talk.
SSRL
DOE, Office of Basic Energy Sciences SMB program supported by the NIH, NCRR, Biomedical Technology
Program, and the DOE, BER.
Thank You For Your Attention
Acknowledements

References
R. G. Shulman et al., Proc. Nat. Acad. Sci., 1976, 73, 1384. T. Westre et al., J. Am. Chem. Soc. 1997, 119, 6297-6314. J.E. Penner-Hahn et al., Chem. Phys. Lett. 1982, 88, 595–598.
L.S. Kau et al., J. Am. Chem. Soc., 1987, 109, 6433.
R. Sarangi et. al. J. Am. Chem. Soc. 2006, 128, 8286–8296.
R. Sarangi, et al. Biochemistry 2009, 48, 3146–3156.
http://www.esrf.eu/computing/scientific/MXAN/ R. Sarangi et al., Inorg. Chem., 2008, 47,11543
Metal K- pre-edge intensity
Metal K- pre-edge energy
Rising edge-intensities in Cu(I) complexes
J.L. DuBois et al., J. Am. Chem. Soc. 2000, 122, 5775-5787.
Covalency from the rising edge
Pre-edge EXAMPLE 2
MXAN and EXAMPLE
Pre-edge EXAMPLE 1
H. A. Hassanin, et al., Dalton Trans., 2010, 39, 10626-10630