introduction to system dynamics workforce modelling to... · introduction to system dynamics...
TRANSCRIPT

Introduction to System Dynamics
workforce modelling
December 2016 For further information please contact us using the contact form at https://www.healthylondon.org/

Contents
2
1 –Workforce Modelling: Context
2 – Introduction to Stella and System Dynamics Software
Introduction
This pack is designed to introduce elements of systems dynamics modelling and the basics of using the Stella application to develop workforce models.
3
The pack is part of a resource library created by the HLP Workforce Programme to
support the Primary Care, Social Care and Mental Health models that have been
developed.
More comprehensive information on how to use Stella, a system dynamics software
package referenced in this guide, can be found on the developers’ website:
http://www.iseesystems.com/
01
Transforming London’s health and care together 4
Workforce Modelling: Context
Aim: To share learning and
enable health and social care
organisations to benefit from
the workforce modelling tools
and approach developed by the
London HLP Workforce
Modelling team
London Workforce Programme

Workforce modelling
5
In order to effectively plan for the future, all organisations need to understand and
support the development of their workforce. A key element of this, especially within
clinical health care services, is to understand how the evolving needs for services
will affect the numbers and types of staff required.
Workforce modelling helps us to quantify how current and future workforces perform in
terms of meeting patient needs. It helps investigate if the current channels of recruitment
and retention will be sufficient to enable future demand to be met.
Workforce modelling as a tool can be applied in a variety of ways from predicting the
supply of GPs over a 5 year period to modelling the optimal usage of various staff types.
This pack gives a brief introduction to the rationale behind developing a workforce model
and the stages that are required in model development. More information on this can be
found in the ‘How to build a model’ guide developed by HLP.
The main purpose of this pack is a brief introduction to the Stella tool that can be used for
system dynamics modelling.

Page 6
Workforce Planning
Right People
Right Skills
Right Place
Right Time
Right Cost
Workforce modelling is usually applied to support workforce planning to ensure that five key enablers are in place. For instance, workforce modelling can test current and future scenarios including new ways of working, new roles, the adoption of new technology and demographic and societal changes.
What is workforce modelling? What does workforce modelling provide?

How to develop a workforce model
7
© 2011 Moorhouse Consulting Ltd.
Workforce modelling takes existing data and uses it to develop a quantitative analysis of an organisation’s workforce needs. This pack will explore what is required to develop a workforce model, and explain the steps required to develop one. The key points covered include: • Types of data and assumptions required for a workforce model.
• Appropriate stakeholder management to deliver a workforce model.
• Different types of workforce models that can be developed.
• Tools that can be used to support workforce model development.
1. A System Dynamics ‘Stella’ workforce model 2. An Excel based workforce model
Workforce Model Examples
Fundamental principles
8
Workforce modelling is based on the principles of supply and demand. In
simple terms the model compares the current and future supply to expected
demand.
• The elements of the supply function will vary and generally depend on the time
scale that you are looking to map. Key elements include the number of each staff
type, their skills, their availability (‘participation rate’) and longer term factors such
as recruitment, leaver and retirement rates.
• The demand side of the model used by HLP is built by combining the activities that
require time from the workforce.
• Depending on the available data and the objective of the piece of work, network
flow analysis and optimisation techniques including linear programming can be
applied to produce an optimal strategy for using the existing and future workforce.
How to build a model
9
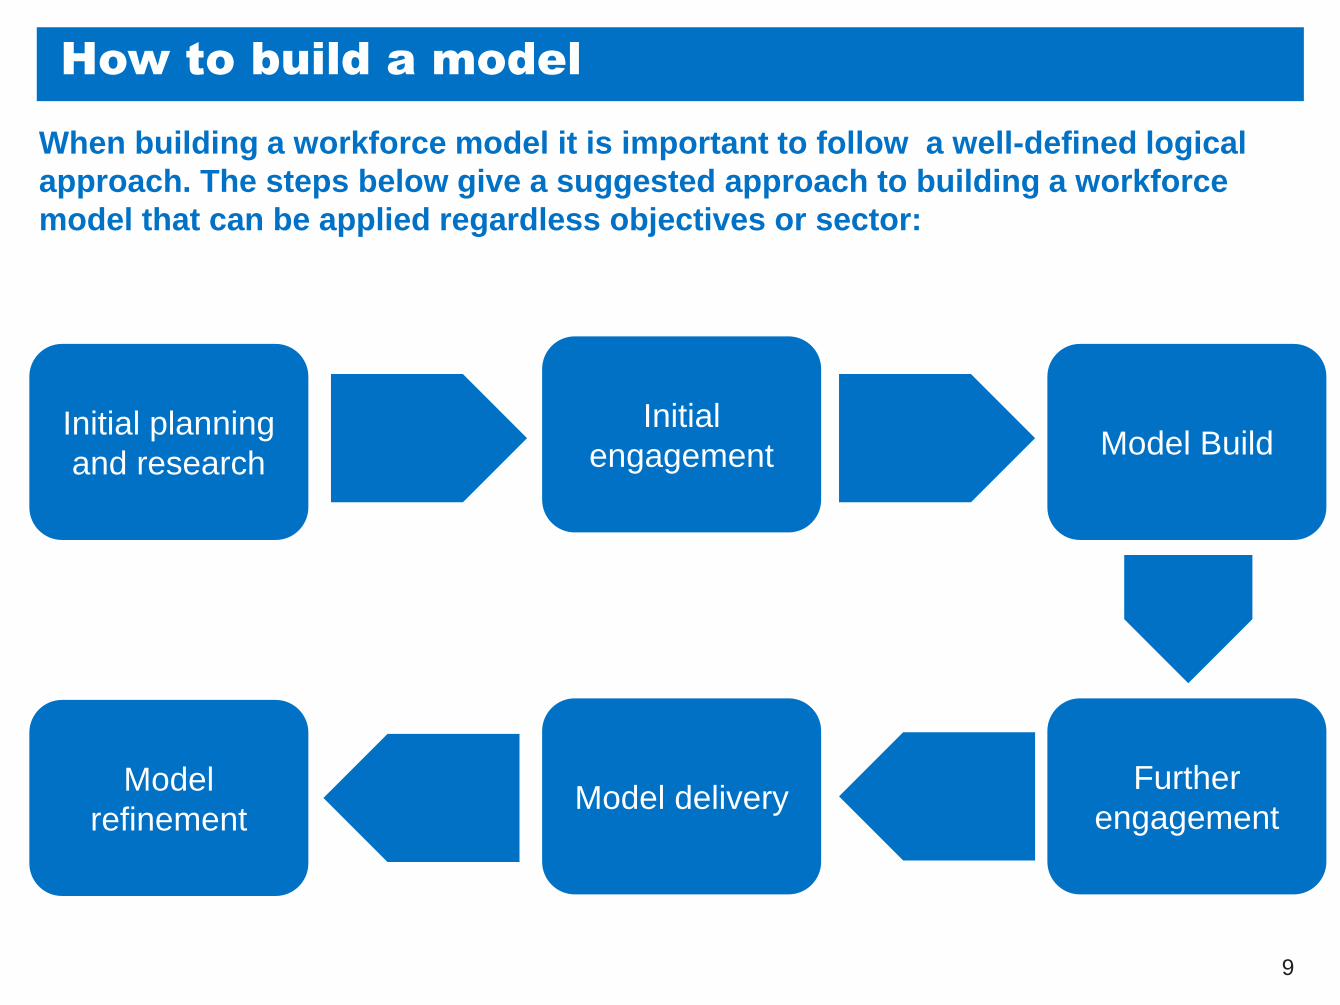
Initial planning
and research
Initial
engagement Model Build
Further
engagement Model delivery
Model
refinement
When building a workforce model it is important to follow a well-defined logical
approach. The steps below give a suggested approach to building a workforce
model that can be applied regardless objectives or sector:
General hints for building a model
10
When building any model there are a number of useful points to bear in mind. These apply
to all software packages and will make the model easier to build, revise and correct as and
when this is needed:
• Build the model in sections; if there are errors it will be easier to find them. In Stella these sections can
be modules. Each section should have a readout of the numbers at this stage of the model, this is key
when checking the results to see if they are correct or not.
• If possible, find previous trends to compare your model’s outputs to. If this data doesn’t exist make sure
that you validate the outputs with stakeholders and/or external experts.
• Continually refer back to the key business question to ensure what you are doing will add value.
• Build in flexibility. Just because a segment or filter is not required in the initial iteration, it doesn’t mean
that it will never be needed. It is easier to add this flexibility at the start rather than at the end as it can
mean making significant changes to the model structure.
• Modelling is an iterative process so make sure you continuously revise the model throughout the project
to reflect any new information that you receive.
• In the first instance, build a model that reflects a “no change” scenario. This reduces the number of
assumptions around future ways of working that are required, making the model more accurate. It is also
easier to understand the results of not changing which makes it easier for your results to be validated by
published data sources or your data steering group.

Further Information
11
A more detailed guide, ‘Building Workforce Models’, has been published by HLP
alongside this introduction to system dynamics. In this guide you will find:
• More information on the types of workforce model that can be built.
• More information on the software that can be used for modelling.
• A step by step guide to the workforce modelling process introduced above.
• Tips on how to carry out the necessary engagement to enable effective workforce
modelling.
• Example deliverables, and the system benefits, that can result from using a workforce
model.

01
Transforming London’s health and care together
Introduction to Stella & System
Dynamics Software
12
Aim: To share learning and
enable health and social care
organisations to benefit from
the workforce modelling tools
and approach developed by the
London HLP Workforce
Modelling team
London Workforce Programme
02
What is system dynamics?
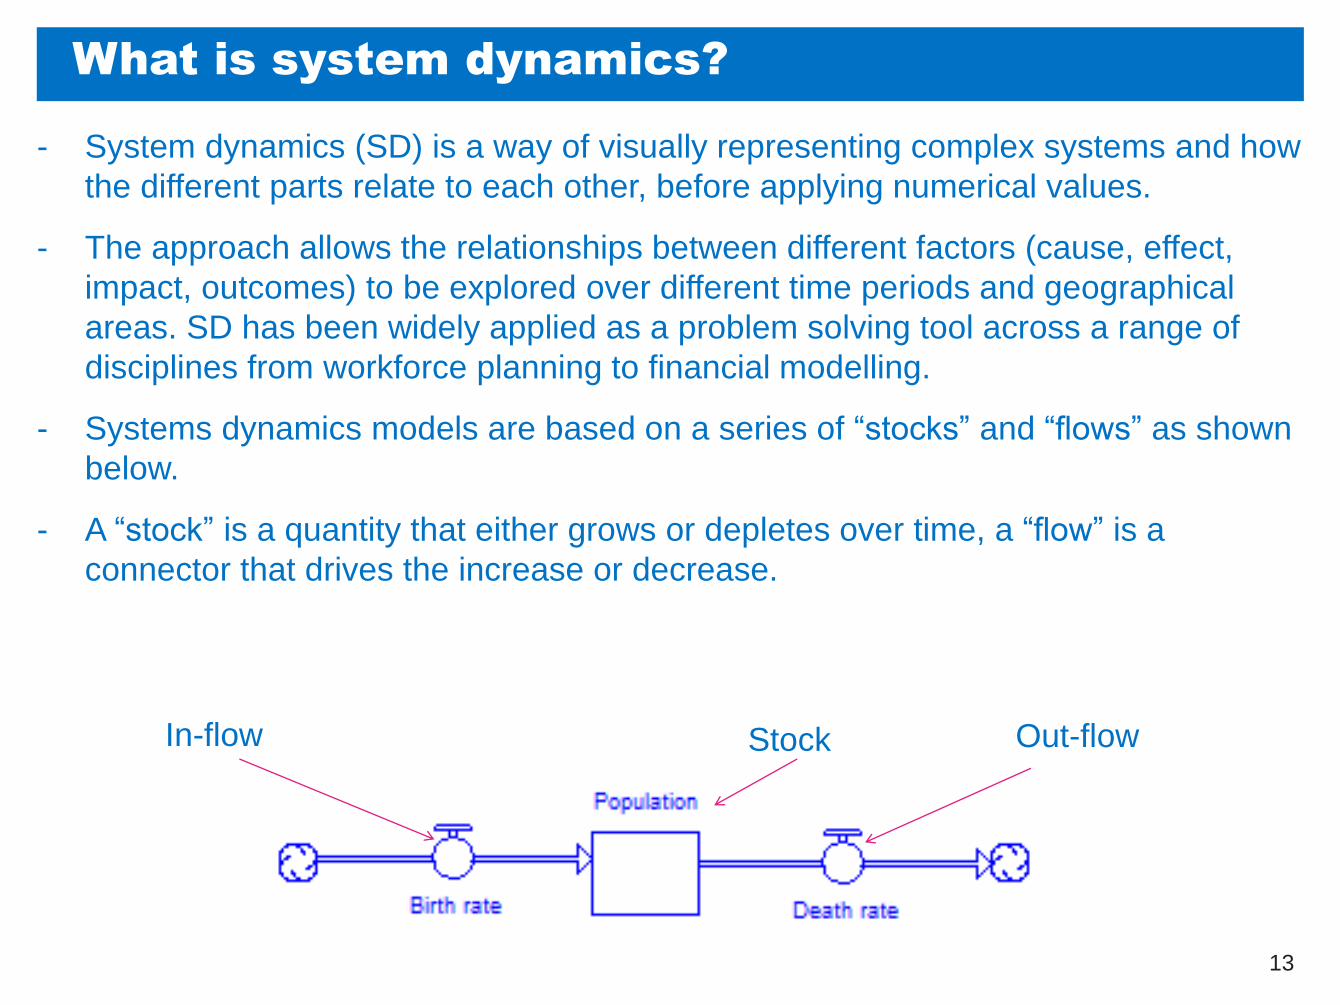
- System dynamics (SD) is a way of visually representing complex systems and how
the different parts relate to each other, before applying numerical values.
- The approach allows the relationships between different factors (cause, effect,
impact, outcomes) to be explored over different time periods and geographical
areas. SD has been widely applied as a problem solving tool across a range of
disciplines from workforce planning to financial modelling.
- Systems dynamics models are based on a series of “stocks” and “flows” as shown
below.
- A “stock” is a quantity that either grows or depletes over time, a “flow” is a
connector that drives the increase or decrease.
13
Stock In-flow Out-flow

What are the benefits
By testing different ‘what if’ scenarios, System Dynamics allows users to:
• Understand and analyse risks in different terms (e.g. cost and gaps between supply
and demand)
• Design and test new strategies which can lead to improved outcomes
• Develop more effective structures, approaches and project plans
• Accelerate collective learning about potential behaviour and impacts of complex
systems
• Model and test policy and program design options
• Analyse and improve business processes
• Understand program performance and sustainability
• Facilitate constructive dialogue among stakeholders
• Lead to strategic decisions that are realistically framed and more likely to accomplish
their objectives.
14
What is required when using System Dynamics?
The key requirement of any system dynamics modelling project is having a clearly
defined problem and scope. In most instances, it is not advisable to build ‘general’
models which look at systems more broadly.
Key considerations include:
• Define who is/are the target audience or end user? Strategic or tactical purpose.
• What relationships drive system behaviours? Causal loop diagram (CLD).
• Start with a qualitative diagram of relationships in the system. This is an excellent
means of building consensus on the structure and function of the current system.
• Quantifying these relationships; build the quantitative SD model.
• Flows control rate of change in the system (e.g. appointments per week) whilst stocks
are the accumulations of ‘things’ that can be counted (e.g. GP headcount or FTE).
• Data collection and validation – using assumptions where necessary.
• Refine, test, validate and iterate – this should be a continuous process.
15
What is Stella?
- Stella is a systems dynamics software program produced by ISEE systems
- It follows SD principles and uses stocks and flows to enable the modelling of
systems
- Further information about the tool can be found on the ISEE website:
https://www.iseesystems.com/
- A series of useful example models have been published on the ISEE website and
can be accessed at:
- http://xmile.iseesystems.com/
16

What are ‘Stocks’?
- In Stella, stocks are the primary way for holding the quantities that you want to track.
For example, if you wanted to track the population over time you would use a stock to
hold the population that you are tracking with flows to manage the people coming in
and leaving.
- To insert a stock into Stella use the icon boxed below. This is found in the top left of
the Stella window
- When you click on the stock menu you will see a dropdown appear containing stocks
with alternative functionality. For the purpose of this introduction we will focus on the
standard stocks.
- Three key points to note when using stocks are:
1 - They have memory. Stocks will retain all inflows which means that if an inflow is
cut off then the size of the stock will not decrease unless there is an additional outflow
attached to it.
2 - Always note their units. This helps to avoid confusion throughout a model.
3 - Only flows can be used to modify stocks. These flows are regulated by
converters and connectors.
17

What are ‘Flows’?
Flows are the only way to add to and take away from stocks. To insert a flow into Stella
use the icon boxed below which can be found in the top left of the Stella window.
When you click on the flow, you will see two boxes drop down: one with 2 arrows, one
with a single arrow. The flow with 2 arrows is a bi-flow and is used if population can flow
either way between stocks; the single arrow represents a single direction of flow.
18
- To the right is an example of a simple
stock and flow, with the resulting
graph. In this example we have set
the population to increase by 50 every
year.
- In this the flow population gain is set to
50. So over 6 years the population
stock increases to 300 (50 every year).
- Note how the population is equal to the
integral of the population gain line
(combined population gain over time).

What are ‘Converters?’
Converters are used to apply changes to stocks throughout a model. Any equations or
constants should always be put into a converter for easy model modification. To insert a
converter into Stella use the icon highlighted below. This is found in the top left of the
window.
- When using a converter they must always be connected with a connector.
- Converters cannot be directly connected to a stock. They need to be linked to either
another converter or a flow.
19
In this example we have set the population to increase by 20% every year.
This is achieved by setting the population delta converter to 0.2 and the population gain flow to population*population delta.
Note how population is now connected to population gain as it is included in the equation.
Now in the chart the pink population gain line is increasing with population.

As seen in the examples, you can track the progress of a simulation using charts. Charts
are inserted using the toolbar at the top of the page.
Once inserted, a green icon will appear which can be dragged around the page. Double
click on the icon to bring up the body of the chart. To edit this double click again to bring
up the define graph screen
How do I show my outputs in charts?
20
To select the elements that you would like to
show move them to the right hand box.
To adjust the scale of the series select them
on the right hand side of the selected box
and adjust the scale box.

How to run a model: The ‘run specs’
Before a model can be run, the run specs need to be adjusted. This is done from Run >
Run Specs in the toolbar.
21
- Choose the appropriate time gaps and
from the unit of time column and the
number of periods that the model
should run for in the From and To
boxes. Generally ‘From’ will always be
set to 0, in the example here the
model will run for 10 years.
- Sim speed can be adjusted in the Sim
speed box, with a higher number
slowing the simulation.
The model is run using the boxes in the
bottom left corner of the screen.
Example 1 – Connecting Stocks
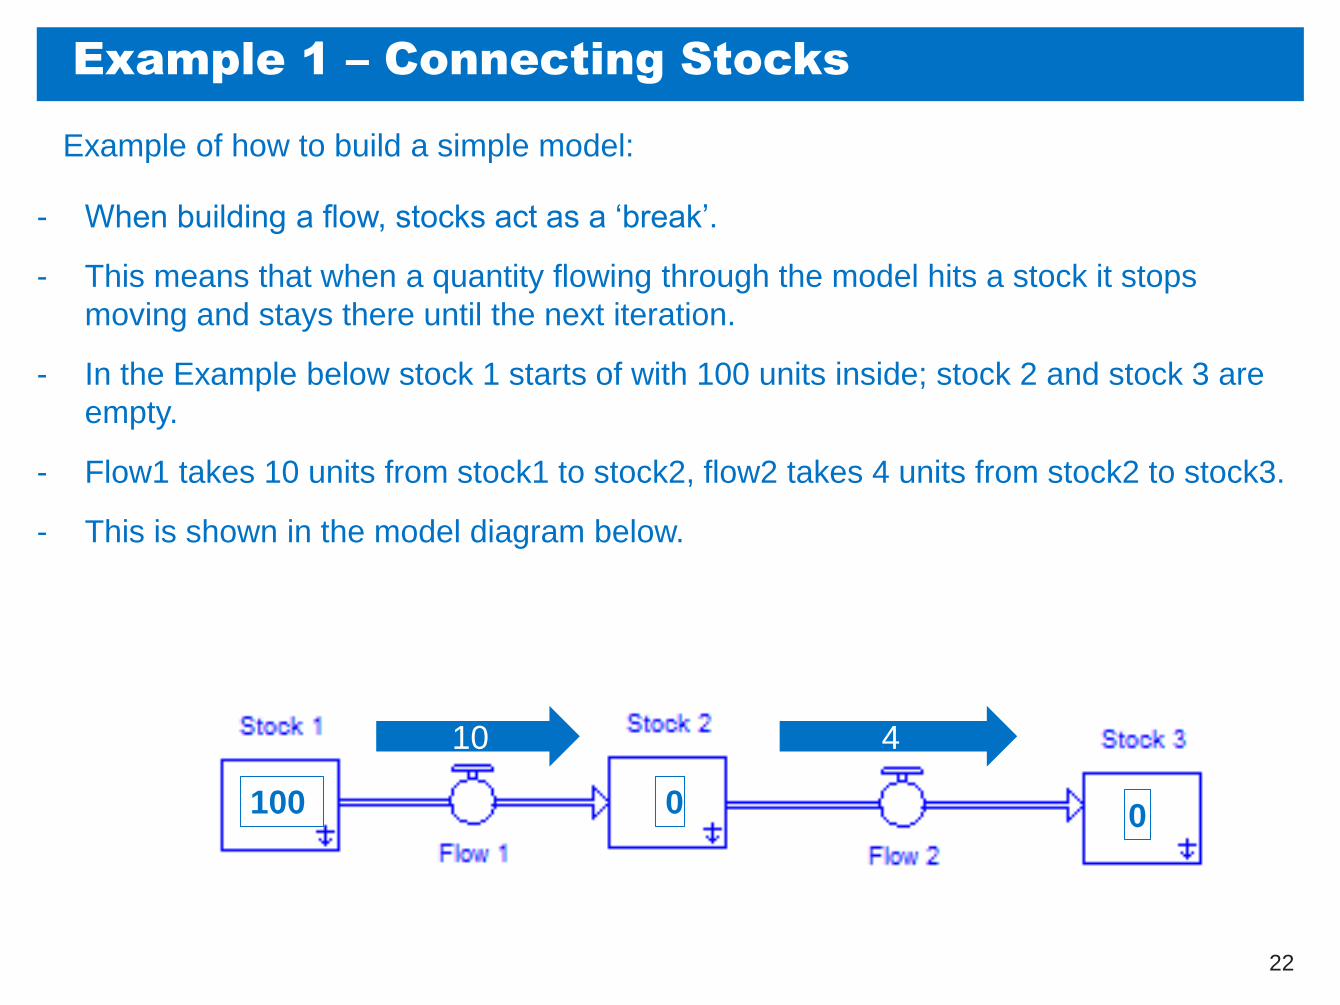
Example of how to build a simple model:
- When building a flow, stocks act as a ‘break’.
- This means that when a quantity flowing through the model hits a stock it stops
moving and stays there until the next iteration.
- In the Example below stock 1 starts of with 100 units inside; stock 2 and stock 3 are
empty.
- Flow1 takes 10 units from stock1 to stock2, flow2 takes 4 units from stock2 to stock3.
- This is shown in the model diagram below.
22
100 0 0
10 4

100 0 0
10 4
23
Example 1 – Connecting Stocks cont’d
Example of how to build a simple model
- This graph shows 5 iterations of the
model (months 0 to 5).
- This chart shows stock 1 losing 10
units per iteration, going from 100 to
50.
- Stock2 has a net gain of 6 per
iteration, input of 10 from flow 1 but
loosing 4 through flow2.
- Stock3 has a gain of 4 from flow2.

Example 1 – Connecting Stocks cont’d
Example of how to build a simple model
- This chart shows what happens as the model progresses to 25 iterations.
- Stock 1 gets drained after 10 iterations and stops filling stock 2.
- Stock 2 then begins to be emptied by flow 2 until it is empty and all of the units are in stock 3 after 25 iterations.
24
100 0 0
10 4

03
Transforming London’s health and care together
Building a simple
population model
25
Building a simple model
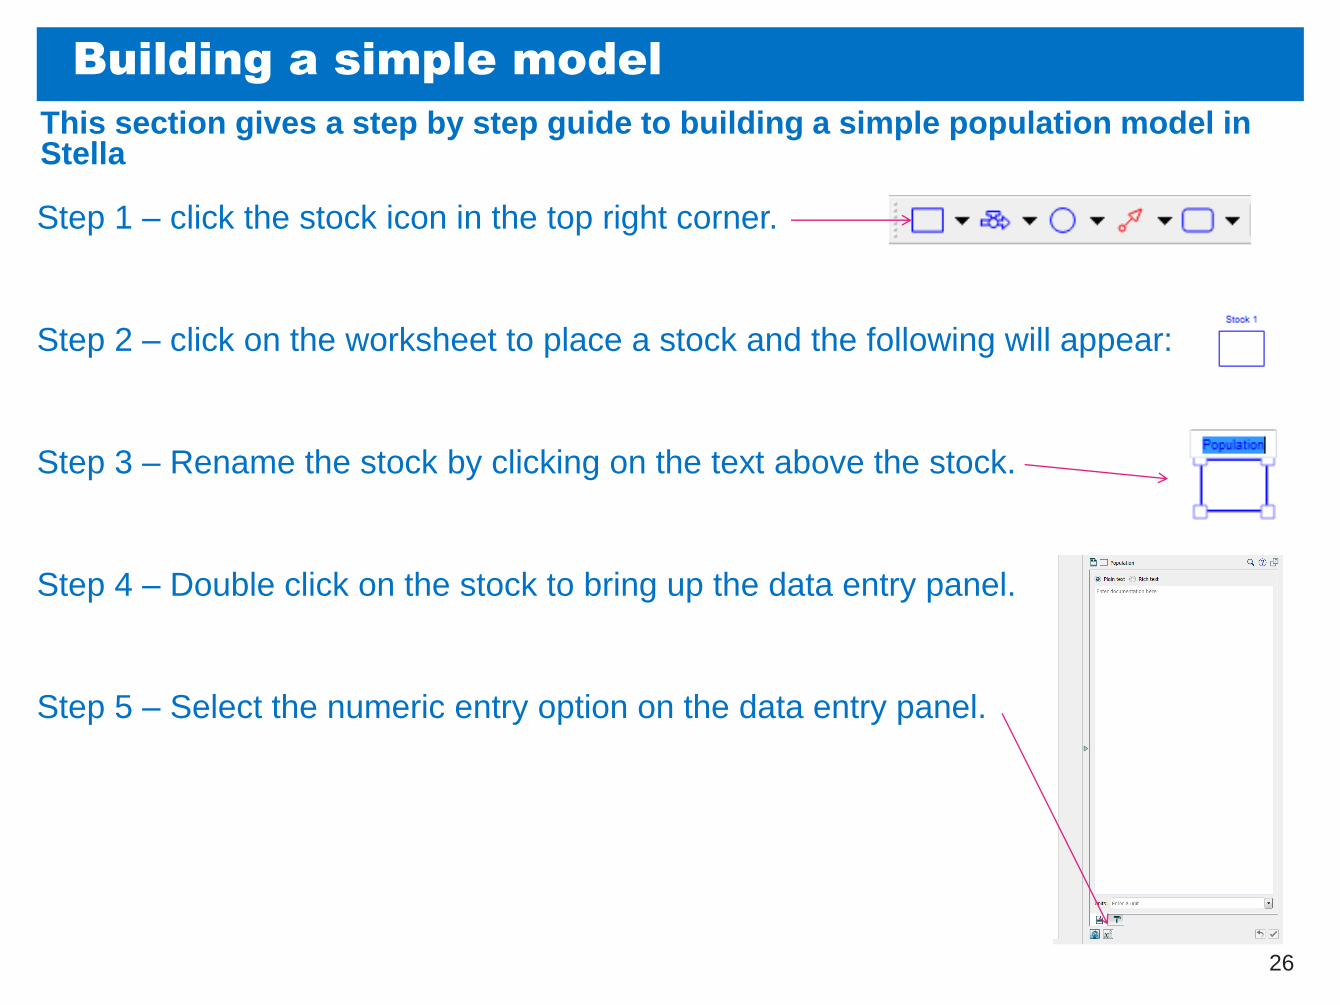
This section gives a step by step guide to building a simple population model in Stella
Step 1 – click the stock icon in the top right corner.
Step 2 – click on the worksheet to place a stock and the following will appear:
Step 3 – Rename the stock by clicking on the text above the stock.
Step 4 – Double click on the stock to bring up the data entry panel.
Step 5 – Select the numeric entry option on the data entry panel.
26
Building a simple model cont’d
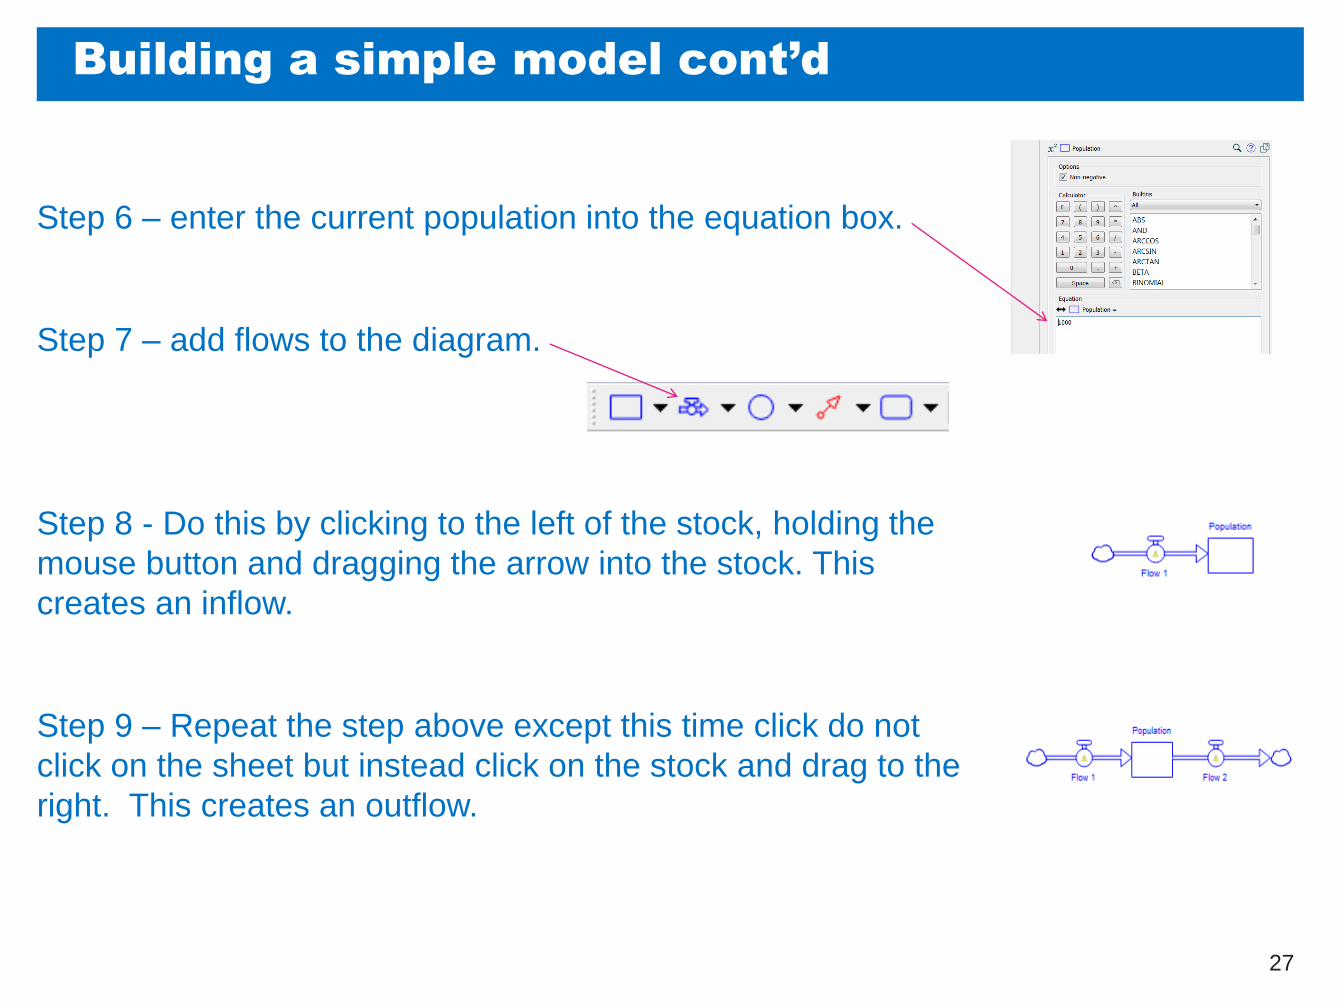
Step 6 – enter the current population into the equation box.
Step 7 – add flows to the diagram.
Step 8 - Do this by clicking to the left of the stock, holding the
mouse button and dragging the arrow into the stock. This
creates an inflow.
Step 9 – Repeat the step above except this time click do not
click on the sheet but instead click on the stock and drag to the
right. This creates an outflow.
27

Building a simple model cont’d
28
Step 10 – name the flows in the same way as the stock.
Step 11 – click on the ‘births’ inflow and add the estimated
number of births in a time period.
Step 12 – add a converter to the model above the deaths flow
and name it death rate.

Building a simple model cont’d
29
Step 13 – add connectors to the model. These will connect the
‘Deaths’ flow with the Population stock and the Death rate
connector.
Step 14 - to connect the connector with the flow, click the
connector icon, then click and hold on the converter and drag
down to the flow.
Step 15 - to connect the flow with the stock, click the connector
icon, then click and hold on the stock and drag down to the
flow.
Step 16 – click on the converter and add the death rate into the
equation box, in this case 0.1.

Building a simple model cont’d
30
Step 17 – set the Deaths flow to equal the death rate multiplied
by the population. Do this by clicking on the flow and setting
the equation box to Death_Rate*Population.
Step 18 – add a chart to the model by clicking on the chart icon
and then on the workbook.
Step 19 – double click on the chart to bring up the chart panel
on the right hand side.
Step 20 – add data series to the chart by clicking the green +
arrow. Add population births and deaths to the chart.

Building a simple model cont’d
31
Step 21 – now the “run specs” of the model need to be set. To
do this, click ‘model’ in the top toolbar and select the “Run
Specs” option from the dropdown. The Run Specs tile should
appear to the right of the screen.
Step 22 – set the model to run for 5 time periods by changing
stop time to 5.
Step 23 – run the model by clicking the arrow in the bottom left
corner of the screen.
This will update the corresponding charts and tables you have
created.