introduction to outcomes research - jones & bartlett learning
TRANSCRIPT

�
Introduction to Outcomes Research
Several factors are responsible for the growing attention to quality of care. There is a growing sense that Americans spend too much on health care for too little value. People are beginning to demand better quality. Much has been made of the dangers of medical errors (Kohn, Corrigan, & Donaldson, 2000). Under Section 5001(c) of the Deficit Reduction Act of 2005, Medicare will no longer pay for a defined set of hospital associated complications.
Two basic strategies exist. One relies on more informed consumers who will make wiser choices if given information about quality, despite evidence that this rarely happens (Hibbard & Jewett, 1997; Hibbard, Peters, Dixon, & Tusler, 2007). The second, usually called pay for perfor-mance, is more direct; it offers incentives to clinicians and organizations for providing better care or for achieving better results (Glickman et al., 2007; Lindenauer et al., 2007; Rosenthal, Landon, Normand, Frank, & Epstein, 2006), but it can have perverse effects, such as encouraging pro-viders to exclude difficult cases (Werner & Asch, 2005).
There is a new call for evidence-based practice and comparative effec-tiveness reviews, which compare the effectiveness of alternative treatments. All of this requires information about the outcomes of care. Much atten-tion has been devoted to methods for assessing the quality of the medical literature and summarizing the findings from it (Juni, Altman, & Egger, 2001; Sackett, Richardson, Rosenberg, & Haynes, 1997). The Cochrane Collaborating Centers have developed a library of reports that assess the literature on various topics and make recommendations for practice.1 The
ch
ap
te
r
1
1See http://www.cochrane.org
© Jones & Bartlett Learning, LLC. NOT FOR SALE OR DISTRIBUTION.
© Jones & Bartlett Learning, LLCNOT FOR SALE OR DISTRIBUTION
© Jones & Bartlett Learning, LLCNOT FOR SALE OR DISTRIBUTION
© Jones & Bartlett Learning, LLCNOT FOR SALE OR DISTRIBUTION
© Jones & Bartlett Learning, LLCNOT FOR SALE OR DISTRIBUTION
© Jones & Bartlett Learning, LLCNOT FOR SALE OR DISTRIBUTION
© Jones & Bartlett Learning, LLCNOT FOR SALE OR DISTRIBUTION
© Jones & Bartlett Learning, LLCNOT FOR SALE OR DISTRIBUTION
© Jones & Bartlett Learning, LLCNOT FOR SALE OR DISTRIBUTION
© Jones & Bartlett Learning, LLCNOT FOR SALE OR DISTRIBUTION
© Jones & Bartlett Learning, LLCNOT FOR SALE OR DISTRIBUTION
© Jones & Bartlett Learning, LLCNOT FOR SALE OR DISTRIBUTION
© Jones & Bartlett Learning, LLCNOT FOR SALE OR DISTRIBUTION
© Jones & Bartlett Learning, LLCNOT FOR SALE OR DISTRIBUTION
© Jones & Bartlett Learning, LLCNOT FOR SALE OR DISTRIBUTION
© Jones & Bartlett Learning, LLCNOT FOR SALE OR DISTRIBUTION
© Jones & Bartlett Learning, LLCNOT FOR SALE OR DISTRIBUTION
© Jones & Bartlett Learning, LLCNOT FOR SALE OR DISTRIBUTION
© Jones & Bartlett Learning, LLCNOT FOR SALE OR DISTRIBUTION
© Jones & Bartlett Learning, LLCNOT FOR SALE OR DISTRIBUTION
© Jones & Bartlett Learning, LLCNOT FOR SALE OR DISTRIBUTION

� Chapter1 IntroduCtIontooutComesresearCh
Agency for Healthcare Research and Quality (AHRQ) has chartered a set of Evidence-based Practice Centers to conduct systematic literature reviews and report on the findings with a direct goal of providing the bases for practice recommendations (Agency for Healthcare Research and Quality, 2002).
As a result, assessing outcomes of care has taken on new importance. Although many studies still examine outcomes like mortality and clinical parameters, the focus of much clinical research has broadened to address larger questions about the ultimate impact of care. The outcomes exam-ined in outcomes research are more likely to approximate what one ultimately wants health care to achieve (e.g., improvements in functional status and quality of life). It is hard to get a clinical trial funded now without at least some effort to assess quality of life, and typically, health-related quality of life.
Outcomes research differs from other medical research in another important way. It is more inclusive of what can be considered an inter-vention. Whereas most medical research may examine the effects of a particular drug or surgical intervention, outcomes research may examine the effects of such elements as counseling or even reorganizing the way care is delivered. For example, outcomes research may not only ask “are individuals with CHD better off with angioplasty or medical therapy?” (a valid outcomes research question) but “are individuals with CHD who get their health care in HMOs better off than others?”
Like Moliere’s bourgeois gentilhomme who suddenly discovered he had been speaking prose all his life, healthcare providers seem to have awak-ened to the need to examine the results of their labors. The observations about the large variation in the rates of various medical activities and utilization of care stirred interest in whether these differences had any effect on outcomes (Fisher et al., 2003). The rise of managed care, with its industrial accountability and productivity models stimulated a revised way of thinking about care. As the variation data generated a press for greater consistency, which was translated into a demand for clinical guide-lines, it became quickly evident that medicine does not have a vast store of empirically verified information about the relationship between what is done and the results.
Coincident with all this attention to outcomes has been a growth in outcomes research programs. Most academic medical centers now have some entity charged with leading research on the outcomes of care. Many managed care programs have such a unit, either directed at research per
© Jones & Bartlett Learning, LLC. NOT FOR SALE OR DISTRIBUTION.
© Jones & Bartlett Learning, LLCNOT FOR SALE OR DISTRIBUTION
© Jones & Bartlett Learning, LLCNOT FOR SALE OR DISTRIBUTION
© Jones & Bartlett Learning, LLCNOT FOR SALE OR DISTRIBUTION
© Jones & Bartlett Learning, LLCNOT FOR SALE OR DISTRIBUTION
© Jones & Bartlett Learning, LLCNOT FOR SALE OR DISTRIBUTION
© Jones & Bartlett Learning, LLCNOT FOR SALE OR DISTRIBUTION
© Jones & Bartlett Learning, LLCNOT FOR SALE OR DISTRIBUTION
© Jones & Bartlett Learning, LLCNOT FOR SALE OR DISTRIBUTION
© Jones & Bartlett Learning, LLCNOT FOR SALE OR DISTRIBUTION
© Jones & Bartlett Learning, LLCNOT FOR SALE OR DISTRIBUTION
© Jones & Bartlett Learning, LLCNOT FOR SALE OR DISTRIBUTION
© Jones & Bartlett Learning, LLCNOT FOR SALE OR DISTRIBUTION
© Jones & Bartlett Learning, LLCNOT FOR SALE OR DISTRIBUTION
© Jones & Bartlett Learning, LLCNOT FOR SALE OR DISTRIBUTION
© Jones & Bartlett Learning, LLCNOT FOR SALE OR DISTRIBUTION
© Jones & Bartlett Learning, LLCNOT FOR SALE OR DISTRIBUTION
© Jones & Bartlett Learning, LLCNOT FOR SALE OR DISTRIBUTION
© Jones & Bartlett Learning, LLCNOT FOR SALE OR DISTRIBUTION
© Jones & Bartlett Learning, LLCNOT FOR SALE OR DISTRIBUTION
© Jones & Bartlett Learning, LLCNOT FOR SALE OR DISTRIBUTION

se or linked more closely to clinical activity under the general heading of quality improvement.
Outcomes analysis can be undertaken for several reasons:
1. To make market decisions. Under a scheme of what has been termed value-based purchasing, consumers looking for help in an ideal world might want to know how a given clinician has performed in treating their specific problem. Likewise, those acting on behalf of consumers (e.g., benefits managers) might want such information to help in their contracting decisions.
2. For accountability. Several agencies have a stake in the quality of medical care. Formal regulatory activity is vested in the govern-ment and in professional societies. Payers may also be concerned that the care they are buying is of adequate quality. In effect, the same information on the outcomes achieved can be analyzed at the level of a clinician or a clinic or a hospital (if the sample size is large enough). In conducting such analyses, however, appropriate adjustments for case mix and other relevant risk factors are needed in both cases.
3. To improve the knowledge base of medicine. The substrate for evidence-based medicine (EBM) is good evidence on which to base it. Solid outcomes information is the crucial building block for the EBM edifice. The enthusiasm for establishing guidelines for care has been somewhat dampened by the growing realization that the empirical database for most of these recommendations is quite weak, and they are forced to rely on clinical consensus judg-ments. While some would hold that the only real science comes from randomized controlled trials (RCT), much can be learned by carefully applying epidemiological analyses to large databases of well collected experiential information. Indeed, outcomes research attempts to address a particular type of medical knowledge, in other words, the knowledge of certain types of those outcomes closest to health and broader sorts of questions.
4. For quality improvement (QI). Medical care organizations seeking to improve their care need to know how well they are doing as a basis for choosing to intervene. Likewise they need to track out-comes to assess whether their QI is working.
I n t r o d u C t I o n t o o u t C o m e s r e s e a r C h �
© Jones & Bartlett Learning, LLC. NOT FOR SALE OR DISTRIBUTION.
© Jones & Bartlett Learning, LLCNOT FOR SALE OR DISTRIBUTION
© Jones & Bartlett Learning, LLCNOT FOR SALE OR DISTRIBUTION
© Jones & Bartlett Learning, LLCNOT FOR SALE OR DISTRIBUTION
© Jones & Bartlett Learning, LLCNOT FOR SALE OR DISTRIBUTION
© Jones & Bartlett Learning, LLCNOT FOR SALE OR DISTRIBUTION
© Jones & Bartlett Learning, LLCNOT FOR SALE OR DISTRIBUTION
© Jones & Bartlett Learning, LLCNOT FOR SALE OR DISTRIBUTION
© Jones & Bartlett Learning, LLCNOT FOR SALE OR DISTRIBUTION
© Jones & Bartlett Learning, LLCNOT FOR SALE OR DISTRIBUTION
© Jones & Bartlett Learning, LLCNOT FOR SALE OR DISTRIBUTION
© Jones & Bartlett Learning, LLCNOT FOR SALE OR DISTRIBUTION
© Jones & Bartlett Learning, LLCNOT FOR SALE OR DISTRIBUTION
© Jones & Bartlett Learning, LLCNOT FOR SALE OR DISTRIBUTION
© Jones & Bartlett Learning, LLCNOT FOR SALE OR DISTRIBUTION
© Jones & Bartlett Learning, LLCNOT FOR SALE OR DISTRIBUTION
© Jones & Bartlett Learning, LLCNOT FOR SALE OR DISTRIBUTION
© Jones & Bartlett Learning, LLCNOT FOR SALE OR DISTRIBUTION
© Jones & Bartlett Learning, LLCNOT FOR SALE OR DISTRIBUTION
© Jones & Bartlett Learning, LLCNOT FOR SALE OR DISTRIBUTION
© Jones & Bartlett Learning, LLCNOT FOR SALE OR DISTRIBUTION

� Chapter1 IntroduCtIontooutComesresearCh
5. For marketing. Some organizations have used quality information as a basis for distinguishing themselves from the competition. Given what appeals to most consumers, this set of outcomes data usually emphasizes satisfaction with care.
Outcomes can be expressed in different ways. Perhaps the simplest and most direct measure is survival, although some ethicists and economists might seek to complicate even this determination, arguing that all life is not equal. Economists would add a dimension of quality of life as a basis for weighting each year survived, what they call Quality Adjusted Life Years (QALYs). Clinicians are most familiar with clinical measures ranging from death to values of specific parameters like blood pressure. Outcomes can also be derived from symptoms or even the results of physical examinations. They can be the results of simple tests, like blood levels, or more complex physiological measures. Another set of outcomes relies on information collected from patients. This data usually reflects how they have experienced the illness and the effects it has had on their lives. These outcomes include measures of functioning as well as measures of affect. Satisfaction with care and with life in general can be considered part of this set of outcomes. In general, clinicians place greater faith in the data they get from laboratory tests and their own observations than what patients report, but this prejudice may not be appropriate. One cannot actually measure health in a laboratory. For example, knowing the oxygen saturation in the great toe of a person with impaired circulation may be important, but it is more salient to know that the patient still cannot walk. Patient derived information can be as valid as, or even more valid, than that obtained from a machine. For example, the results of a scale based on patient perceptions of events may be as valid as the infer-ence placed on the results of a colorimetric reaction that is interpreted as reflecting the level of enzymatic activity.
Looking directly at the outcomes of care (as opposed to concentrating on the process of care) makes a lot of sense. In the best traditions of Willie Sutton, that is where the treasure can be found. However, using outcomes may be less satisfying than one may wish. Clinicians have difficulties with outcomes on several grounds:
1. Joint accountability. The outcomes of care may be due to many things, only some of which are under the clinician’s control. Outcomes are rarely the product of a single individual’s efforts.
© Jones & Bartlett Learning, LLC. NOT FOR SALE OR DISTRIBUTION.
© Jones & Bartlett Learning, LLCNOT FOR SALE OR DISTRIBUTION
© Jones & Bartlett Learning, LLCNOT FOR SALE OR DISTRIBUTION
© Jones & Bartlett Learning, LLCNOT FOR SALE OR DISTRIBUTION
© Jones & Bartlett Learning, LLCNOT FOR SALE OR DISTRIBUTION
© Jones & Bartlett Learning, LLCNOT FOR SALE OR DISTRIBUTION
© Jones & Bartlett Learning, LLCNOT FOR SALE OR DISTRIBUTION
© Jones & Bartlett Learning, LLCNOT FOR SALE OR DISTRIBUTION
© Jones & Bartlett Learning, LLCNOT FOR SALE OR DISTRIBUTION
© Jones & Bartlett Learning, LLCNOT FOR SALE OR DISTRIBUTION
© Jones & Bartlett Learning, LLCNOT FOR SALE OR DISTRIBUTION
© Jones & Bartlett Learning, LLCNOT FOR SALE OR DISTRIBUTION
© Jones & Bartlett Learning, LLCNOT FOR SALE OR DISTRIBUTION
© Jones & Bartlett Learning, LLCNOT FOR SALE OR DISTRIBUTION
© Jones & Bartlett Learning, LLCNOT FOR SALE OR DISTRIBUTION
© Jones & Bartlett Learning, LLCNOT FOR SALE OR DISTRIBUTION
© Jones & Bartlett Learning, LLCNOT FOR SALE OR DISTRIBUTION
© Jones & Bartlett Learning, LLCNOT FOR SALE OR DISTRIBUTION
© Jones & Bartlett Learning, LLCNOT FOR SALE OR DISTRIBUTION
© Jones & Bartlett Learning, LLCNOT FOR SALE OR DISTRIBUTION
© Jones & Bartlett Learning, LLCNOT FOR SALE OR DISTRIBUTION

Outcomes result from the collaboration and coordination of many people, working within a system. System failure is at least as deadly as individual error (Berwick, 1989). It is much more satisfying to be able to say you did all the right things, even if something bad happened. Some estimates suggest that medical care only has a limited effect on overall health of a population. Numbers in the range of 10 to 25% are bandied about. It seems reasonable to assume that the size of the effect of treatment on specific sick people is larger, but other factors will still influ-ence the results. It is not necessary that treatment explain all (or even most) of the variance on outcomes to make it worthwhile to examine its effectiveness. One can change the risk of a suc-cessful outcome by several orders of magnitude by interventions that fail to explain even a modest amount of the variance in outcomes.
2. No clear remedial action. Although theory suggests that outcomes and process measures are closely linked, the relationship between process and outcomes is often weak. Hence, a poor outcome does not necessarily indicate what needs to be done differently. At best, outcomes can only suggest to an investigator where to look for more information about the process of care. In clinical practice, outcomes are often best thought of as screeners. Rather than exam-ining the processes of care for all the care provided, a pattern of poor outcomes can suggest which types of care (or which providers) need closer scrutiny.
3. Effort for data collection. Outcomes information usually requires extra effort (and expense) to collect. Medical record keeping is notoriously inconsistent (Weed, 1968a, 1968b). Much informa-tion is recorded as judgments and definitions vary widely. For example, what does “within normal limits” mean? Omissions are also frequent. Medical practice does not routinely gather system-atic information about the outcomes of care. At best, clinicians are generally aware of only those patients who return for further care. Rarely do they systematically follow the course of those who do not return, although these may be the outcomes of greatest interest. Even less often do clinicians systematically collect data on other variables that might influence the outcomes.
I n t r o d u C t I o n t o o u t C o m e s r e s e a r C h �
© Jones & Bartlett Learning, LLC. NOT FOR SALE OR DISTRIBUTION.
© Jones & Bartlett Learning, LLCNOT FOR SALE OR DISTRIBUTION
© Jones & Bartlett Learning, LLCNOT FOR SALE OR DISTRIBUTION
© Jones & Bartlett Learning, LLCNOT FOR SALE OR DISTRIBUTION
© Jones & Bartlett Learning, LLCNOT FOR SALE OR DISTRIBUTION
© Jones & Bartlett Learning, LLCNOT FOR SALE OR DISTRIBUTION
© Jones & Bartlett Learning, LLCNOT FOR SALE OR DISTRIBUTION
© Jones & Bartlett Learning, LLCNOT FOR SALE OR DISTRIBUTION
© Jones & Bartlett Learning, LLCNOT FOR SALE OR DISTRIBUTION
© Jones & Bartlett Learning, LLCNOT FOR SALE OR DISTRIBUTION
© Jones & Bartlett Learning, LLCNOT FOR SALE OR DISTRIBUTION
© Jones & Bartlett Learning, LLCNOT FOR SALE OR DISTRIBUTION
© Jones & Bartlett Learning, LLCNOT FOR SALE OR DISTRIBUTION
© Jones & Bartlett Learning, LLCNOT FOR SALE OR DISTRIBUTION
© Jones & Bartlett Learning, LLCNOT FOR SALE OR DISTRIBUTION
© Jones & Bartlett Learning, LLCNOT FOR SALE OR DISTRIBUTION
© Jones & Bartlett Learning, LLCNOT FOR SALE OR DISTRIBUTION
© Jones & Bartlett Learning, LLCNOT FOR SALE OR DISTRIBUTION
© Jones & Bartlett Learning, LLCNOT FOR SALE OR DISTRIBUTION
© Jones & Bartlett Learning, LLCNOT FOR SALE OR DISTRIBUTION
© Jones & Bartlett Learning, LLCNOT FOR SALE OR DISTRIBUTION

� Chapter1 IntroduCtIontooutComesresearCh
4. Probability, not certainty. Outcomes are essentially probability state-ments. Because outcomes can be influenced by many different factors, one should not try to judge the success of any single case. Rather, outcomes are addressed in the aggregate. The rate of success is compared. Thus, outcomes reflect the experience of a clinician, not the results of any single effort.
5. Need for group data. Because outcomes rely on group data, there must be enough cases to analyze. For many clinicians, the volume of cases around a specific condition is too small to permit rapid aggregation for analysis. One must either collect cases over several years or use a group of physicians as the unit of analysis. Both strategies have disadvantages.
6. Out of date data. Outcome results take a long time to assemble. First, you have to accumulate cases. For each case, you have to wait for the outcomes to become evident. As a result, by the time an outcomes report is available, the care reported on may have occurred some time ago. The results may no longer be up-to-date.
Given all these problems, it is little wonder that people would rather talk about outcomes than deal with them. It is much easier to test the extent to which care complies with extant orthodoxy. But we quickly run into a paradox. Despite all the attention to EBM, our beliefs about what constitutes appropriate care are still more often based on beliefs than on hard evidence. Before we endorse an orthodoxy, we would like to have bet-ter proof that a given approach really leads to better outcomes. Consensus should not be confused with wisdom. Imagine what would have happened if there had been a consensus conference in the mid-1800s on cupping and leaching. Developing such linkages means having a data system that can provide the needed grist for the analytic mill.
Three strategies are available to collect outcomes information. They are: (1) Every clinical action could be subjected to a randomized con-trolled trial. Given all the possible interventions and all the variations in practice and patients, this does not seem like a realistic strategy. (2) Routine medical practice can incorporate systematic data collection and feedback to track outcomes of care. The rise of managed care, with its improved information systems and its concerns about efficiency, may prove a catalyst for this effort. (3) Special practices can be designated to operate data collection activities under some scientific aegis that would
© Jones & Bartlett Learning, LLC. NOT FOR SALE OR DISTRIBUTION.
© Jones & Bartlett Learning, LLCNOT FOR SALE OR DISTRIBUTION
© Jones & Bartlett Learning, LLCNOT FOR SALE OR DISTRIBUTION
© Jones & Bartlett Learning, LLCNOT FOR SALE OR DISTRIBUTION
© Jones & Bartlett Learning, LLCNOT FOR SALE OR DISTRIBUTION
© Jones & Bartlett Learning, LLCNOT FOR SALE OR DISTRIBUTION
© Jones & Bartlett Learning, LLCNOT FOR SALE OR DISTRIBUTION
© Jones & Bartlett Learning, LLCNOT FOR SALE OR DISTRIBUTION
© Jones & Bartlett Learning, LLCNOT FOR SALE OR DISTRIBUTION
© Jones & Bartlett Learning, LLCNOT FOR SALE OR DISTRIBUTION
© Jones & Bartlett Learning, LLCNOT FOR SALE OR DISTRIBUTION
© Jones & Bartlett Learning, LLCNOT FOR SALE OR DISTRIBUTION
© Jones & Bartlett Learning, LLCNOT FOR SALE OR DISTRIBUTION
© Jones & Bartlett Learning, LLCNOT FOR SALE OR DISTRIBUTION
© Jones & Bartlett Learning, LLCNOT FOR SALE OR DISTRIBUTION
© Jones & Bartlett Learning, LLCNOT FOR SALE OR DISTRIBUTION
© Jones & Bartlett Learning, LLCNOT FOR SALE OR DISTRIBUTION
© Jones & Bartlett Learning, LLCNOT FOR SALE OR DISTRIBUTION
© Jones & Bartlett Learning, LLCNOT FOR SALE OR DISTRIBUTION
© Jones & Bartlett Learning, LLCNOT FOR SALE OR DISTRIBUTION
© Jones & Bartlett Learning, LLCNOT FOR SALE OR DISTRIBUTION
systematically collect data on outcomes and relate them to the process of care (much the way academic centers conduct clinical trials to test new therapies). Practitioners would then rely on the validated processes for assessing their quality of care.
The first strategy relies on randomized trials, whereas the latter two use data derived from routine care. In essence, the trade-off is between fear of selection bias and of weak generalizability.
Having recognized the discrepancy between what we know and what we believe, medicine was at an impasse. One camp, anxious for fast results, pushed for creating practice guidelines based on the best available information and filling in the rest with expert opinion. They argued that, at worst, such a strategy would produce the equivalent of a higher quality textbook. The other camp maintained that enforcing arbitrary rules that were not based on empirical evidence was equivalent to codifying beliefs. They urged greater restraint until a better science base was developed.
The early experience with guideline writing confirmed the weak sci-ence base that underlies much of clinical practice (Field & Lohr, 1992). Systematic outcomes research provides an obvious remedy for the situation. However, the choice of the best research strategy remained in question.
The classical view of quality of medical care uses a framework that divides such work into structure, process, and outcome (Donabedian, 1966). Structure refers to such aspects as the training of the care providers or the equipment of the facility in which the care is provided. Process addresses what was done: Was the correct (appropriate) action taken? Was it done skillfully? Outcomes refer to the results of these actions. There is an assumption that these three aspects are directly related, but that belief has often proven hard to demonstrate empirically. One explanation is that the “lore” or medicine is just that, a set of beliefs and traditions that are poorly grounded in empirical evidence. Other interpretations include thinking the process is too complex, subject to too many factors, or that the effects of care are simply too subtle to be easily revealed by most studies, especially nonexperimental ones.
The weak relationships, often found between process and structure on the one hand and outcomes on the other, cut both ways. Investigators seeking to demonstrate the validity of their outcomes findings may turn to structural and process relationships. Turning the system on its head, one might test the validity of guidelines by assessing whether those adhering to the guidelines achieve better results than those who do not. If outcomes measures work, one would expect to find better outcomes
I n t r o d u C t I o n t o o u t C o m e s r e s e a r C h �
© Jones & Bartlett Learning, LLC. NOT FOR SALE OR DISTRIBUTION.
© Jones & Bartlett Learning, LLCNOT FOR SALE OR DISTRIBUTION
© Jones & Bartlett Learning, LLCNOT FOR SALE OR DISTRIBUTION
© Jones & Bartlett Learning, LLCNOT FOR SALE OR DISTRIBUTION
© Jones & Bartlett Learning, LLCNOT FOR SALE OR DISTRIBUTION
© Jones & Bartlett Learning, LLCNOT FOR SALE OR DISTRIBUTION
© Jones & Bartlett Learning, LLCNOT FOR SALE OR DISTRIBUTION
© Jones & Bartlett Learning, LLCNOT FOR SALE OR DISTRIBUTION
© Jones & Bartlett Learning, LLCNOT FOR SALE OR DISTRIBUTION
© Jones & Bartlett Learning, LLCNOT FOR SALE OR DISTRIBUTION
© Jones & Bartlett Learning, LLCNOT FOR SALE OR DISTRIBUTION
© Jones & Bartlett Learning, LLCNOT FOR SALE OR DISTRIBUTION
© Jones & Bartlett Learning, LLCNOT FOR SALE OR DISTRIBUTION
© Jones & Bartlett Learning, LLCNOT FOR SALE OR DISTRIBUTION
© Jones & Bartlett Learning, LLCNOT FOR SALE OR DISTRIBUTION
© Jones & Bartlett Learning, LLCNOT FOR SALE OR DISTRIBUTION
© Jones & Bartlett Learning, LLCNOT FOR SALE OR DISTRIBUTION
© Jones & Bartlett Learning, LLCNOT FOR SALE OR DISTRIBUTION
© Jones & Bartlett Learning, LLCNOT FOR SALE OR DISTRIBUTION
© Jones & Bartlett Learning, LLCNOT FOR SALE OR DISTRIBUTION
© Jones & Bartlett Learning, LLCNOT FOR SALE OR DISTRIBUTION
� Chapter1 IntroduCtIontooutComesresearCh
among those providers judged by some external standard to give better care. What does it mean when care provided in teaching hospitals is no better than care offered in community hospitals? On the one hand, the measures may be insensitive; alternatively, there may be less difference than one suspects. If the results are the inverse of what is expected, there will obviously be greater cause for concern, but failure to find a difference where orthodox teaching says one should be found may raise at least as many questions about the orthodoxy as there are challenges to the validity of the observation. Ironically, one approach to addressing this dilemma would be to validate the guidelines by comparing the results of care deliv-ered according to guidelines to care given without guidelines.
AN OUTCOMES APPROACH
An outcomes approach requires more than simply collecting data on the outcomes of care. It should be thought of in terms of an outcomes information system. Careful and complete data collection for purposes of both outcomes ascertainment and risk adjustment has to be combined with proper analyses.
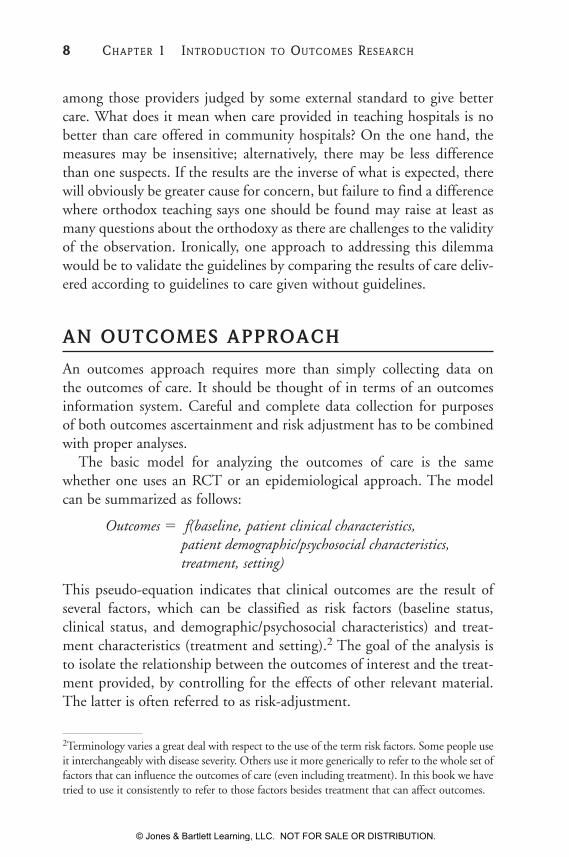
The basic model for analyzing the outcomes of care is the same whether one uses an RCT or an epidemiological approach. The model can be summarized as follows:
Outcomes f (baseline, patient clinical characteristics, patient demographic/psychosocial characteristics, treatment, setting)
This pseudo-equation indicates that clinical outcomes are the result of several factors, which can be classified as risk factors (baseline status, clinical status, and demographic/psychosocial characteristics) and treat-ment characteristics (treatment and setting).2 The goal of the analysis is to isolate the relationship between the outcomes of interest and the treat-ment provided, by controlling for the effects of other relevant material. The latter is often referred to as risk-adjustment.
2Terminology varies a great deal with respect to the use of the term risk factors. Some people use it interchangeably with disease severity. Others use it more generically to refer to the whole set of factors that can influence the outcomes of care (even including treatment). In this book we have tried to use it consistently to refer to those factors besides treatment that can affect outcomes.
© Jones & Bartlett Learning, LLC. NOT FOR SALE OR DISTRIBUTION.
© Jones & Bartlett Learning, LLCNOT FOR SALE OR DISTRIBUTION
© Jones & Bartlett Learning, LLCNOT FOR SALE OR DISTRIBUTION
© Jones & Bartlett Learning, LLCNOT FOR SALE OR DISTRIBUTION
© Jones & Bartlett Learning, LLCNOT FOR SALE OR DISTRIBUTION
© Jones & Bartlett Learning, LLCNOT FOR SALE OR DISTRIBUTION
© Jones & Bartlett Learning, LLCNOT FOR SALE OR DISTRIBUTION
© Jones & Bartlett Learning, LLCNOT FOR SALE OR DISTRIBUTION
© Jones & Bartlett Learning, LLCNOT FOR SALE OR DISTRIBUTION
© Jones & Bartlett Learning, LLCNOT FOR SALE OR DISTRIBUTION
© Jones & Bartlett Learning, LLCNOT FOR SALE OR DISTRIBUTION
© Jones & Bartlett Learning, LLCNOT FOR SALE OR DISTRIBUTION
© Jones & Bartlett Learning, LLCNOT FOR SALE OR DISTRIBUTION
© Jones & Bartlett Learning, LLCNOT FOR SALE OR DISTRIBUTION
© Jones & Bartlett Learning, LLCNOT FOR SALE OR DISTRIBUTION
© Jones & Bartlett Learning, LLCNOT FOR SALE OR DISTRIBUTION
© Jones & Bartlett Learning, LLCNOT FOR SALE OR DISTRIBUTION
© Jones & Bartlett Learning, LLCNOT FOR SALE OR DISTRIBUTION
© Jones & Bartlett Learning, LLCNOT FOR SALE OR DISTRIBUTION
© Jones & Bartlett Learning, LLCNOT FOR SALE OR DISTRIBUTION
© Jones & Bartlett Learning, LLCNOT FOR SALE OR DISTRIBUTION

Risk AdjustmentThe patient’s baseline status is very important. With a few exceptions (such as plastic surgery and elective orthopedics), most medical treatment does not get a patient better than he or she was before the episode that started the need for treatment. Thus, there are really two types of baseline status information that need to be collected: (1) status at the outset of treatment, which can be used to show how much change has occurred since treatment began, and (2) usual status before the onset of the prob-lem that requires treatment, which defines the upper bound of just how much improvement is possible, or likely. Information on baseline status basically corresponds to what will be later collected to assess outcomes.
Patient clinical characteristics cover a lot of territory. One of the reasons we make diagnoses is to group patients into classes that share a need for a given type of therapy and/or suggest an expected course. Knowing a patient’s diagnosis would thus play a central role in building an outcomes data system. Many patients have more than one diagnosis, often referred to as comorbidities. It is necessary for purposes of analysis to identify one diagnosis as the primary diagnosis and to treat the others as modifiers.3
Diagnoses can be further refined in terms of their implications for outcomes by addressing characteristics that suggest varying prognoses. These are termed severity measures. In addition to severity, one may be concerned about other modifiers of diagnoses, such as duration of the problem and history of previous episodes. In general, it is usually safer to be as inclusive as possible. Because clinicians are especially distrust-ful of non-RCTs, they need a great deal of reassurance that all possible differences between groups have been considered. By including elements that seem unnecessary, the investigator may eventually gain greater acceptance for the results. Nothing is more frustrating than presenting an analysis, especially one that challenges conventional wisdom, only to have the clinical audience say: “Yes, but did you consider...?” A policy of inclusion is not an automatic talisman against rejection, but it can help avoid it. At some point, of course, the cost of collecting seemingly irrelevant data can be overwhelming. A reasonable compromise must
3It would be possible to deal with clusters of diagnoses, but the numbers of combinations could quickly become unmanageable.
a n o u t C o m e s a p p r o a C h �
© Jones & Bartlett Learning, LLC. NOT FOR SALE OR DISTRIBUTION.
© Jones & Bartlett Learning, LLCNOT FOR SALE OR DISTRIBUTION
© Jones & Bartlett Learning, LLCNOT FOR SALE OR DISTRIBUTION
© Jones & Bartlett Learning, LLCNOT FOR SALE OR DISTRIBUTION
© Jones & Bartlett Learning, LLCNOT FOR SALE OR DISTRIBUTION
© Jones & Bartlett Learning, LLCNOT FOR SALE OR DISTRIBUTION
© Jones & Bartlett Learning, LLCNOT FOR SALE OR DISTRIBUTION
© Jones & Bartlett Learning, LLCNOT FOR SALE OR DISTRIBUTION
© Jones & Bartlett Learning, LLCNOT FOR SALE OR DISTRIBUTION
© Jones & Bartlett Learning, LLCNOT FOR SALE OR DISTRIBUTION
© Jones & Bartlett Learning, LLCNOT FOR SALE OR DISTRIBUTION
© Jones & Bartlett Learning, LLCNOT FOR SALE OR DISTRIBUTION
© Jones & Bartlett Learning, LLCNOT FOR SALE OR DISTRIBUTION
© Jones & Bartlett Learning, LLCNOT FOR SALE OR DISTRIBUTION
© Jones & Bartlett Learning, LLCNOT FOR SALE OR DISTRIBUTION
© Jones & Bartlett Learning, LLCNOT FOR SALE OR DISTRIBUTION
© Jones & Bartlett Learning, LLCNOT FOR SALE OR DISTRIBUTION
© Jones & Bartlett Learning, LLCNOT FOR SALE OR DISTRIBUTION
© Jones & Bartlett Learning, LLCNOT FOR SALE OR DISTRIBUTION
© Jones & Bartlett Learning, LLCNOT FOR SALE OR DISTRIBUTION
© Jones & Bartlett Learning, LLCNOT FOR SALE OR DISTRIBUTION

�0 Chapter1 IntroduCtIontooutComesresearCh
be struck. If the clinician audience is involved in planning the study, at least those elements that seem most important should be covered. Other clinical information may address different risk factors (e.g., exposure to toxins, diet, habits).
The other set of patient information concerns demographic and psy-chosocial factors. Some obvious items, like age and gender, seem to need no justification, but even they should be thoughtfully addressed. A specific conceptual model that indicates the expected influence of each variable is a critical first step in planning an outcomes study. Others, like education and social support, may exert their effects more subtly. The relevance of specific elements may vary with the condition being examined. Other psychosocial variables, like the patient’s cognitive or emotional state, may have an influence on the effects of treatment on other outcomes.
TreatmentSetting refers to both the physical location where the care is provided as well as the organization of that site. It can also address other attributes, such as the philosophy of care provided. For example, one may want to compare the same basic care provided in an inpatient and outpatient con-text. Alternatively, one may want to address the level of risk aversion or the extent of staffing for apparently similar models of care. One site may have a philosophy of encouraging patients to do as much as possible for themselves, whereas another may be inclined to provide a lot of services to assist patients in performing basic activities, either because the organiza-tion is concerned about safety or because they feel that doing things for patients may be faster in the long run.
At its most basic level, treatment can refer simply to gross types (e.g., does medical management work better than surgical?). It can even be simply a proxy for care given in one hospital versus another, or by one physician versus others. Measuring the effects of treatment first requires a clear, useful taxonomy for treatments. Surprisingly, little work has gone into creating such schema. One needs to think not only about formal treatments like prescribed drugs, but also about over-the-counter medi-cations. The definition of a therapy may not be limited to what is done in a clinical setting. Informal care may play a substantial role. In some cases, the treatment may extend over several sites. For example, much of the care formerly rendered in hospitals is now provided in nursing homes and even at home.
© Jones & Bartlett Learning, LLC. NOT FOR SALE OR DISTRIBUTION.
© Jones & Bartlett Learning, LLCNOT FOR SALE OR DISTRIBUTION
© Jones & Bartlett Learning, LLCNOT FOR SALE OR DISTRIBUTION
© Jones & Bartlett Learning, LLCNOT FOR SALE OR DISTRIBUTION
© Jones & Bartlett Learning, LLCNOT FOR SALE OR DISTRIBUTION
© Jones & Bartlett Learning, LLCNOT FOR SALE OR DISTRIBUTION
© Jones & Bartlett Learning, LLCNOT FOR SALE OR DISTRIBUTION
© Jones & Bartlett Learning, LLCNOT FOR SALE OR DISTRIBUTION
© Jones & Bartlett Learning, LLCNOT FOR SALE OR DISTRIBUTION
© Jones & Bartlett Learning, LLCNOT FOR SALE OR DISTRIBUTION
© Jones & Bartlett Learning, LLCNOT FOR SALE OR DISTRIBUTION
© Jones & Bartlett Learning, LLCNOT FOR SALE OR DISTRIBUTION
© Jones & Bartlett Learning, LLCNOT FOR SALE OR DISTRIBUTION
© Jones & Bartlett Learning, LLCNOT FOR SALE OR DISTRIBUTION
© Jones & Bartlett Learning, LLCNOT FOR SALE OR DISTRIBUTION
© Jones & Bartlett Learning, LLCNOT FOR SALE OR DISTRIBUTION
© Jones & Bartlett Learning, LLCNOT FOR SALE OR DISTRIBUTION
© Jones & Bartlett Learning, LLCNOT FOR SALE OR DISTRIBUTION
© Jones & Bartlett Learning, LLCNOT FOR SALE OR DISTRIBUTION
© Jones & Bartlett Learning, LLCNOT FOR SALE OR DISTRIBUTION
© Jones & Bartlett Learning, LLCNOT FOR SALE OR DISTRIBUTION

A simple model to classify treatment can be derived from drug therapy, where one talks about such constructs as type, dosage, duration, and tim-ing. A similar approach can be applied to other treatments like surgery. The next level of analysis might ask whether the same treatment in dif-ferent hands produces different results. At this point, the issue becomes individual skill.
Treatment relates directly to Donabedian’s process of care, which can be said to be composed of two basic aspects: (1) doing the right and appropriate thing and (2) doing it well (1966; 1988). The goal of out-comes research is to establish what treatment is appropriate for a given situation by isolating the effects of treatment from the effects of other factors that influence outcomes. It is harder to use outcomes to address skill compared to appropriateness, but in the end, that is the only real way. Although some may try to tease out the skill component by using some sort of direct analysis, such a strategy will not readily distinguish between skill and appropriateness. A more precise approach is first to ascertain what type of care produces the best (or at least acceptable levels of ) results for a given problem (or group of patients). Then, one can apply the same deductive analytic approach to examining those cases where the appropriate care was given to look for differences across providers. Where such differences are found, they can be said to reflect differences in skill.
Types of Study DesignsThere is substantial confusion about the relationship of study design to outcomes research. (This topic is discussed at length in Chapter 2.) Clinical research worships at the shrine of the RCT. The basic difference between an RCT and well conducted prospective observational study is the allocation of patients. In an RCT, the allocation is not under the control of either the medical practitioner or the patient. Although RCTs are at the top of the usual clinical science hierarchy, they have their own limitations. As their name implies, they are randomized and controlled. They utilize random assignment to treatment and control conditions (uninfluenced by either the treating clinician or the patient) and stan-dardized treatment. But the enrollment into such trials is rarely based on a representative sample of the patient population. Indeed, most RCTs have strict inclusion and exclusion criteria. RCTs are typically conducted in specialized institutions under tightly controlled conditions. As their
a n o u t C o m e s a p p r o a C h ��
© Jones & Bartlett Learning, LLC. NOT FOR SALE OR DISTRIBUTION.
© Jones & Bartlett Learning, LLCNOT FOR SALE OR DISTRIBUTION
© Jones & Bartlett Learning, LLCNOT FOR SALE OR DISTRIBUTION
© Jones & Bartlett Learning, LLCNOT FOR SALE OR DISTRIBUTION
© Jones & Bartlett Learning, LLCNOT FOR SALE OR DISTRIBUTION
© Jones & Bartlett Learning, LLCNOT FOR SALE OR DISTRIBUTION
© Jones & Bartlett Learning, LLCNOT FOR SALE OR DISTRIBUTION
© Jones & Bartlett Learning, LLCNOT FOR SALE OR DISTRIBUTION
© Jones & Bartlett Learning, LLCNOT FOR SALE OR DISTRIBUTION
© Jones & Bartlett Learning, LLCNOT FOR SALE OR DISTRIBUTION
© Jones & Bartlett Learning, LLCNOT FOR SALE OR DISTRIBUTION
© Jones & Bartlett Learning, LLCNOT FOR SALE OR DISTRIBUTION
© Jones & Bartlett Learning, LLCNOT FOR SALE OR DISTRIBUTION
© Jones & Bartlett Learning, LLCNOT FOR SALE OR DISTRIBUTION
© Jones & Bartlett Learning, LLCNOT FOR SALE OR DISTRIBUTION
© Jones & Bartlett Learning, LLCNOT FOR SALE OR DISTRIBUTION
© Jones & Bartlett Learning, LLCNOT FOR SALE OR DISTRIBUTION
© Jones & Bartlett Learning, LLCNOT FOR SALE OR DISTRIBUTION
© Jones & Bartlett Learning, LLCNOT FOR SALE OR DISTRIBUTION
© Jones & Bartlett Learning, LLCNOT FOR SALE OR DISTRIBUTION
© Jones & Bartlett Learning, LLCNOT FOR SALE OR DISTRIBUTION

�� Chapter1 IntroduCtIontooutComesresearCh
name further implies, great pains are taken to standardize the treatment. As a result of these conditions, questions are often raised about whether the results of an RCT are generalizable to actual practice. By contrast, so-called quasi-experimental (or observational or epidemiological) designs rely on regular practice (or perhaps care in the upper end of the quality distribution) with potential variation in who gets what kinds of treatment that reflects what happens in actual practice. As a result, the assignment of patients to treatment is not a random event but one in which clini-cians (and patients) play an active role. In essence, one trades off potential selection bias against the ability to generalize the findings (Heckman, 2008). Often complex statistical techniques are used to try to counter the selection bias (Stukel et al., 2007).
The science of medicine depends on matching treatment to need. The real question from the perspective of scientific study is whether some unmeasured factor might be responsible for the choice of treatment. Random assign-ment obviates that risk. It does not necessarily mean that the experimental and control groups are equivalent. (It is still possible to get differences by chance.) But it does mean that any differences are not systematic (i.e., they do not reflect bias). Those using observational methods are under great pres-sure to prove the comparability of the treated and untreated groups. Even when all measured variables are examined, there always remains the possibil-ity of some systematic difference of an unmeasured variable.
The ability to assign subjects randomly to either experimental or control status confers an aura of science that is unsurpassed.4 Indeed, serious questions of bias can arise whenever the decision to treat or not to treat (or how to treat) is determined by some external force. Those reviewing the results of nonrandomized studies need to be reassured that potential risk factors have been identified and addressed. Nonetheless, there remains a concern that experimental and control groups are not completely comparable, and hence unknown factors may account for differences found. A number of statistical procedures have been devel-oped to address this issue, but the level of comfort with the results of
4Random assignment does not confer an absolute protection against bias. It simply reduces the likelihood that such bias has occurred. It is still important to examine the characteristics of the experimental and control groups to look for such bias and to consider the value of sub-group analysis where the effects of treatment may be greater with one portion of the sample than another.
© Jones & Bartlett Learning, LLC. NOT FOR SALE OR DISTRIBUTION.
© Jones & Bartlett Learning, LLCNOT FOR SALE OR DISTRIBUTION
© Jones & Bartlett Learning, LLCNOT FOR SALE OR DISTRIBUTION
© Jones & Bartlett Learning, LLCNOT FOR SALE OR DISTRIBUTION
© Jones & Bartlett Learning, LLCNOT FOR SALE OR DISTRIBUTION
© Jones & Bartlett Learning, LLCNOT FOR SALE OR DISTRIBUTION
© Jones & Bartlett Learning, LLCNOT FOR SALE OR DISTRIBUTION
© Jones & Bartlett Learning, LLCNOT FOR SALE OR DISTRIBUTION
© Jones & Bartlett Learning, LLCNOT FOR SALE OR DISTRIBUTION
© Jones & Bartlett Learning, LLCNOT FOR SALE OR DISTRIBUTION
© Jones & Bartlett Learning, LLCNOT FOR SALE OR DISTRIBUTION
© Jones & Bartlett Learning, LLCNOT FOR SALE OR DISTRIBUTION
© Jones & Bartlett Learning, LLCNOT FOR SALE OR DISTRIBUTION
© Jones & Bartlett Learning, LLCNOT FOR SALE OR DISTRIBUTION
© Jones & Bartlett Learning, LLCNOT FOR SALE OR DISTRIBUTION
© Jones & Bartlett Learning, LLCNOT FOR SALE OR DISTRIBUTION
© Jones & Bartlett Learning, LLCNOT FOR SALE OR DISTRIBUTION
© Jones & Bartlett Learning, LLCNOT FOR SALE OR DISTRIBUTION
© Jones & Bartlett Learning, LLCNOT FOR SALE OR DISTRIBUTION
© Jones & Bartlett Learning, LLCNOT FOR SALE OR DISTRIBUTION
© Jones & Bartlett Learning, LLCNOT FOR SALE OR DISTRIBUTION

these efforts varies with the discipline. Clinicians, who are usually not statistically sophisticated, need a lot of reassurance that experimental and control groups are comparable.
In recent years, biostatisticians have promoted propensity scores as a way of providing clinicians with more confidence about well conducted observational studies (D’Agostino, 1998). In essence, propensity scores identify the variables that might be associated with using or not using a given service. Clinically homogeneous risk subgroups are created on the basis of these measured variables and the results compared across each of these subgroups. Some researchers, especially economists, still worry about unmeasured variables and have developed procedures that attempt to adjust for these. One of the most common is the use of instrumental variables (IVs; Angrist, Imbens, & Rubin, 1996; Heckman, 1979; Lee, 1994). These are variables that are statistically associated with the likeli-hood of treatment but not with the outcomes. By using these IVs, the researchers can presumably adjust for unmeasured effects. The problem lies in finding IVs that fit the bill. In most cases, it is hard to identify a variable that is associated with getting care but not with its outcomes. The most common IVs are measures of access to care. These two approaches to addressing selection bias may yield different results (Stukel et al., 2007).
RCTs may encourage false confidence. They are not a guarantee of good science. Problems with attrition, for example, may create new sources of bias. Standards for the conduct and reporting of RCTs, like CONSORT (Consolidated Standards of Reporting Trials), promote bet-ter research quality (Begg et al., 1996).
RCTs have real limitations. In general, randomized trials use great care in design to specify inclusion criteria. Because RCTs are complicated and difficult to mount, they are usually restricted to very tightly targeted groups of patients. Often the investigators are not actively concerned about how the subjects are obtained and rely on random allocation to distribute any differences equally across the two groups. As a result, ran-domized trials often trade internal validity (tightness of comparisons) for external validity (generalizability). Thus, randomization does not provide the protective shield that some think. Even if the groups are more compa-rable (and such a distribution is not assured by random assignment), the pertinent analyses may still require looking at the data within subclasses. It does not seem feasible to rely exclusively on RCTs for all, or even most, of the needed empirical data linking outcomes to the process of care.
a n o u t C o m e s a p p r o a C h ��
© Jones & Bartlett Learning, LLC. NOT FOR SALE OR DISTRIBUTION.
© Jones & Bartlett Learning, LLCNOT FOR SALE OR DISTRIBUTION
© Jones & Bartlett Learning, LLCNOT FOR SALE OR DISTRIBUTION
© Jones & Bartlett Learning, LLCNOT FOR SALE OR DISTRIBUTION
© Jones & Bartlett Learning, LLCNOT FOR SALE OR DISTRIBUTION
© Jones & Bartlett Learning, LLCNOT FOR SALE OR DISTRIBUTION
© Jones & Bartlett Learning, LLCNOT FOR SALE OR DISTRIBUTION
© Jones & Bartlett Learning, LLCNOT FOR SALE OR DISTRIBUTION
© Jones & Bartlett Learning, LLCNOT FOR SALE OR DISTRIBUTION
© Jones & Bartlett Learning, LLCNOT FOR SALE OR DISTRIBUTION
© Jones & Bartlett Learning, LLCNOT FOR SALE OR DISTRIBUTION
© Jones & Bartlett Learning, LLCNOT FOR SALE OR DISTRIBUTION
© Jones & Bartlett Learning, LLCNOT FOR SALE OR DISTRIBUTION
© Jones & Bartlett Learning, LLCNOT FOR SALE OR DISTRIBUTION
© Jones & Bartlett Learning, LLCNOT FOR SALE OR DISTRIBUTION
© Jones & Bartlett Learning, LLCNOT FOR SALE OR DISTRIBUTION
© Jones & Bartlett Learning, LLCNOT FOR SALE OR DISTRIBUTION
© Jones & Bartlett Learning, LLCNOT FOR SALE OR DISTRIBUTION
© Jones & Bartlett Learning, LLCNOT FOR SALE OR DISTRIBUTION
© Jones & Bartlett Learning, LLCNOT FOR SALE OR DISTRIBUTION
© Jones & Bartlett Learning, LLCNOT FOR SALE OR DISTRIBUTION

�� Chapter1 IntroduCtIontooutComesresearCh
There are those who maintain that nothing but randomized controlled trials can provide real evidence of efficacy. Epidemiological models applied to observational data can never be absolutely sure that differ-ences found were not due to unobserved variations in the two groups. Random allocation is a powerful tool, but both because of other limita-tions, especially with regard to examining the effectiveness of a treatment (i.e., how it actually works in practice), and simply for reasons of logistics, epidemiological (observational) studies will inevitably play a major role. It is crucial that these latter studies be carefully designed to minimize their limitations (Shadish, Cook, & Campbell, 2002). (Chapter 2 provides a more detailed discussion about the alternative approaches.)
In effect, both approaches require some level of extrapolation and infer-ence. The RCT requires a heavy set of inferences to extrapolate the results based on extensive participant selection and fixed interventions to clinical practice. The epidemiological approach requires a substantial amount of inference in the analysis itself, but the translation to practice is thus much easier because many of the relevant variables have already been addressed.
Because the epidemiological approach is essentially a naturalistic tech-nique that relies on data collected as part of extant practice, questions will arise about the comparability of those who receive different forms of care. The assignment to treatment groups is not based on chance. Factors, both overt and more subtle, determine who gets what care. The burden of proof lies with the investigator. In truth, no amount of evidence can absolutely guarantee comparability, but a lot of informational benefit can accrue from using carefully analyzed information derived from real practice.
A much more important problem in using clinical information is its quality. Clinical investigators quickly appreciate that clinical data is not recorded systematically or thoroughly. Patient information is entered when patients visit the system. No systematic follow-up is obtained. Much of the information recorded summarizes clinicians’ summary impressions rather than capturing the presence of specific signs and symptoms. Two clinicians may opt to record quite disparate information, even when they use the same headings. Investigators seeking to mount outcomes studies will need to plan these studies to include prospective data collection and incorporate deliberate steps that attend to the quality of information at each stage. Most good observational studies require a prospective design with standardized, systematic data collection on all aspects (i.e., case mix, treatment, and outcomes).
© Jones & Bartlett Learning, LLC. NOT FOR SALE OR DISTRIBUTION.
© Jones & Bartlett Learning, LLCNOT FOR SALE OR DISTRIBUTION
© Jones & Bartlett Learning, LLCNOT FOR SALE OR DISTRIBUTION
© Jones & Bartlett Learning, LLCNOT FOR SALE OR DISTRIBUTION
© Jones & Bartlett Learning, LLCNOT FOR SALE OR DISTRIBUTION
© Jones & Bartlett Learning, LLCNOT FOR SALE OR DISTRIBUTION
© Jones & Bartlett Learning, LLCNOT FOR SALE OR DISTRIBUTION
© Jones & Bartlett Learning, LLCNOT FOR SALE OR DISTRIBUTION
© Jones & Bartlett Learning, LLCNOT FOR SALE OR DISTRIBUTION
© Jones & Bartlett Learning, LLCNOT FOR SALE OR DISTRIBUTION
© Jones & Bartlett Learning, LLCNOT FOR SALE OR DISTRIBUTION
© Jones & Bartlett Learning, LLCNOT FOR SALE OR DISTRIBUTION
© Jones & Bartlett Learning, LLCNOT FOR SALE OR DISTRIBUTION
© Jones & Bartlett Learning, LLCNOT FOR SALE OR DISTRIBUTION
© Jones & Bartlett Learning, LLCNOT FOR SALE OR DISTRIBUTION
© Jones & Bartlett Learning, LLCNOT FOR SALE OR DISTRIBUTION
© Jones & Bartlett Learning, LLCNOT FOR SALE OR DISTRIBUTION
© Jones & Bartlett Learning, LLCNOT FOR SALE OR DISTRIBUTION
© Jones & Bartlett Learning, LLCNOT FOR SALE OR DISTRIBUTION
© Jones & Bartlett Learning, LLCNOT FOR SALE OR DISTRIBUTION
© Jones & Bartlett Learning, LLCNOT FOR SALE OR DISTRIBUTION

MEASURING OUTCOMES
Outcomes come in a variety of sizes and shapes. The selection of an outcomes measure should be based on a clear sense of what one wants to measure and why. Outcomes measures can be both generic and specific to a given prob-lem. The generic measures are useful for looking at policy issues or reflecting the bottom line effects of care on health status or even aspects of quality of life. They provide a sort of lingua franca that can be used to compare the treatments for various conditions in analyses such as cost-effectiveness.
Because much medical care can affect specific signs and symptoms but may not have a profound impact on the greater spheres of life, most clini-cians are accustomed to looking at the more limited effects of care. These are more closely linked to specific interventions and hence are usually more satisfying to see. Condition-specific outcomes, as the name implies, will vary with the condition being treated, although some measures may prove useful for more than one condition.
Generic measures address larger constructs; hence, their causal links to specific treatment events may be more difficult to trace. The generic measures can include both measures of function in various sectors (e.g., self-care, social activity, emotional state) as well as satisfaction with the care provided, the way it is provided, and perhaps even the setting in which it is provided. It is not always easy to separate opinions about the quality of care from feelings about the results of treatment. While someone may feel satisfied that a clinician did his best even if the results are disappointing, it is likely that patients will be more satisfied when the results are favorable.
Both generic and condition-specific outcomes measures (as well as the other components of the outcomes equation) often need to be aggregated to create some sort of summary measure. The aggregation process is com-plex. There is a strong temptation to simply add raw scores to generate a total score, but such a step is foolhardy. In the simplest case, it implies an equal weighting among the components, an assumption that is not automatically true. Even worse, the components may take on different weights because of the way the answers are constructed. For example, a response with five categories may receive a score of 1 through 5, while a dichotomous answer would be 0 or 1. There is no a priori reason to suspect that a 5 on the first scale is any more important than a 1 on the second. Even when the responses are in some apparent order, a response of 5 is not necessarily five times more than a response of 1.
m e a s u r I n g o u t C o m e s ��
© Jones & Bartlett Learning, LLC. NOT FOR SALE OR DISTRIBUTION.
© Jones & Bartlett Learning, LLCNOT FOR SALE OR DISTRIBUTION
© Jones & Bartlett Learning, LLCNOT FOR SALE OR DISTRIBUTION
© Jones & Bartlett Learning, LLCNOT FOR SALE OR DISTRIBUTION
© Jones & Bartlett Learning, LLCNOT FOR SALE OR DISTRIBUTION
© Jones & Bartlett Learning, LLCNOT FOR SALE OR DISTRIBUTION
© Jones & Bartlett Learning, LLCNOT FOR SALE OR DISTRIBUTION
© Jones & Bartlett Learning, LLCNOT FOR SALE OR DISTRIBUTION
© Jones & Bartlett Learning, LLCNOT FOR SALE OR DISTRIBUTION
© Jones & Bartlett Learning, LLCNOT FOR SALE OR DISTRIBUTION
© Jones & Bartlett Learning, LLCNOT FOR SALE OR DISTRIBUTION
© Jones & Bartlett Learning, LLCNOT FOR SALE OR DISTRIBUTION
© Jones & Bartlett Learning, LLCNOT FOR SALE OR DISTRIBUTION
© Jones & Bartlett Learning, LLCNOT FOR SALE OR DISTRIBUTION
© Jones & Bartlett Learning, LLCNOT FOR SALE OR DISTRIBUTION
© Jones & Bartlett Learning, LLCNOT FOR SALE OR DISTRIBUTION
© Jones & Bartlett Learning, LLCNOT FOR SALE OR DISTRIBUTION
© Jones & Bartlett Learning, LLCNOT FOR SALE OR DISTRIBUTION
© Jones & Bartlett Learning, LLCNOT FOR SALE OR DISTRIBUTION
© Jones & Bartlett Learning, LLCNOT FOR SALE OR DISTRIBUTION
© Jones & Bartlett Learning, LLCNOT FOR SALE OR DISTRIBUTION

�� Chapter1 IntroduCtIontooutComesresearCh
Deciding how to weight the components of a summary scale properly can be a serious undertaking. Ordinarily, one needs some construct to use as the basis for normalizing the values placed on each component. Techniques that vary in sophistication and ease of implementation (usu-ally inversely) can be applied to obtaining the value weights of different constituencies. In the outcomes trade, these values are usually referred to as utility weights. Sometimes they are directly related to overt concepts; sometimes they are inferred from observed behaviors.
The science of measurement has come a long way. Before an outcomes measure can be said to have attained its pedigree, it must pass a series of tests. The criteria for a useful measure are that it is reliable (i.e., it will yield the same results consistently); it is valid (i.e., it measures what it says it does); and it is responsive (i.e., it can detect meaningful increments of change; Guyatt, Deyo, Charlson, Levine, & Mitchell, 1989).
Some measures have been extensively studied; others are more novel. Few if any can be used on all occasions. The astute outcomes researcher must weigh the measure’s reputation against its actual content and the application intended. For example, some measures work well with some populations but not with others. They may cover only a limited portion of the full performance spectrum, or be better at distinguishing among some aspects of function than others.
CONCEPTUAL MODELING
There are five keys steps in outcomes research. Although they are per-formed sequentially, they are not as independent as they might seem. Indeed, most study design efforts involve a substantial amount of cycling back to adjust questions based on design issues and models based on data issues. Greater clarification of later steps may entail revising earlier ones. In the end, any presentation must be internally coherent. The individual steps must be shown, and they must relate to one another. The five steps are:
1. Define a researchable question.
2. Develop a conceptual model.
3. Conduct a literature review.
4. Operationalize the variables.
5. Develop a research plan.
© Jones & Bartlett Learning, LLC. NOT FOR SALE OR DISTRIBUTION.
© Jones & Bartlett Learning, LLCNOT FOR SALE OR DISTRIBUTION
© Jones & Bartlett Learning, LLCNOT FOR SALE OR DISTRIBUTION
© Jones & Bartlett Learning, LLCNOT FOR SALE OR DISTRIBUTION
© Jones & Bartlett Learning, LLCNOT FOR SALE OR DISTRIBUTION
© Jones & Bartlett Learning, LLCNOT FOR SALE OR DISTRIBUTION
© Jones & Bartlett Learning, LLCNOT FOR SALE OR DISTRIBUTION
© Jones & Bartlett Learning, LLCNOT FOR SALE OR DISTRIBUTION
© Jones & Bartlett Learning, LLCNOT FOR SALE OR DISTRIBUTION
© Jones & Bartlett Learning, LLCNOT FOR SALE OR DISTRIBUTION
© Jones & Bartlett Learning, LLCNOT FOR SALE OR DISTRIBUTION
© Jones & Bartlett Learning, LLCNOT FOR SALE OR DISTRIBUTION
© Jones & Bartlett Learning, LLCNOT FOR SALE OR DISTRIBUTION
© Jones & Bartlett Learning, LLCNOT FOR SALE OR DISTRIBUTION
© Jones & Bartlett Learning, LLCNOT FOR SALE OR DISTRIBUTION
© Jones & Bartlett Learning, LLCNOT FOR SALE OR DISTRIBUTION
© Jones & Bartlett Learning, LLCNOT FOR SALE OR DISTRIBUTION
© Jones & Bartlett Learning, LLCNOT FOR SALE OR DISTRIBUTION
© Jones & Bartlett Learning, LLCNOT FOR SALE OR DISTRIBUTION
© Jones & Bartlett Learning, LLCNOT FOR SALE OR DISTRIBUTION
© Jones & Bartlett Learning, LLCNOT FOR SALE OR DISTRIBUTION

1. Define a researchable question. In most cases, the research ques-tion precedes the underlying model, but not necessarily. Asking a researchable question is much harder than simply posing a question. A researchable question must be answerable by direct means. It is not a philosophic proposition. It should have a clear statement of what is done to whom, perhaps with some concerns about the con-text of the care. Often the test of the completeness and directness of the question will come from the conceptual model. Frequently the question will be modified after the model is refined.
2. Develop a conceptual model. A critical step in developing an out-comes study is the creation of a conceptual model. This need will be stressed frequently in this book, because it is so central to suc-cessful outcomes work. In essence, the conceptual model indicates what is believed to cause the outcome. It identifies the critical path-ways and what other factors are likely to affect these. It should iden-tify which variables, chosen to represent the various components of the basic outcomes equation described earlier, are pertinent to the study at hand. The variables and their relationship both to the outcomes of interest and to each other should be specified.
3. Conduct a literature review. The conceptual model is usually the result of a literature search, but not always. Sometimes the reverse is true; one starts with a model in mind and uses the literature review to refine it. As with all steps in this process, the actual course is typically cyclical. There are two types of literature reviews: systematic reviews and advocacy reviews. Ideally every outcomes study should be preceded by a systematic review of the literature, which identifies the current state of knowledge on the topic. Detailed methods have been developed for such systematic reviews (Agency for Healthcare Research and Quality, 2002; Juni, Altman, & Egger, 2001)
Most research proposals (and certainly most research articles) utilize a different strategy, one that tends to lead the reader to a predetermined conclusion (i.e., the need for and feasibility of the proposed study or report). This type of review, which may be termed “advocacy” is designed with the conclusion in mind; whereas, the systematic review starts with an intellectually neutral slate and judges the results by what is unearthed—consistent and strong evidence.
C o n C e p t u a l m o d e l I n g ��
© Jones & Bartlett Learning, LLC. NOT FOR SALE OR DISTRIBUTION.
© Jones & Bartlett Learning, LLCNOT FOR SALE OR DISTRIBUTION
© Jones & Bartlett Learning, LLCNOT FOR SALE OR DISTRIBUTION
© Jones & Bartlett Learning, LLCNOT FOR SALE OR DISTRIBUTION
© Jones & Bartlett Learning, LLCNOT FOR SALE OR DISTRIBUTION
© Jones & Bartlett Learning, LLCNOT FOR SALE OR DISTRIBUTION
© Jones & Bartlett Learning, LLCNOT FOR SALE OR DISTRIBUTION
© Jones & Bartlett Learning, LLCNOT FOR SALE OR DISTRIBUTION
© Jones & Bartlett Learning, LLCNOT FOR SALE OR DISTRIBUTION
© Jones & Bartlett Learning, LLCNOT FOR SALE OR DISTRIBUTION
© Jones & Bartlett Learning, LLCNOT FOR SALE OR DISTRIBUTION
© Jones & Bartlett Learning, LLCNOT FOR SALE OR DISTRIBUTION
© Jones & Bartlett Learning, LLCNOT FOR SALE OR DISTRIBUTION
© Jones & Bartlett Learning, LLCNOT FOR SALE OR DISTRIBUTION
© Jones & Bartlett Learning, LLCNOT FOR SALE OR DISTRIBUTION
© Jones & Bartlett Learning, LLCNOT FOR SALE OR DISTRIBUTION
© Jones & Bartlett Learning, LLCNOT FOR SALE OR DISTRIBUTION
© Jones & Bartlett Learning, LLCNOT FOR SALE OR DISTRIBUTION
© Jones & Bartlett Learning, LLCNOT FOR SALE OR DISTRIBUTION
© Jones & Bartlett Learning, LLCNOT FOR SALE OR DISTRIBUTION
© Jones & Bartlett Learning, LLCNOT FOR SALE OR DISTRIBUTION

�� Chapter1 IntroduCtIontooutComesresearCh
Writing an advocacy review requires skill. Since you know where you want to end up, you want to shape the arguments to make the strongest case, but you cannot omit salient information (especially because the person reviewing your work may well have written it). The task then is to show what has been done and what are the limitations with that work to date. Each time you cite a limitation, you should indicate how your study will address it. You may also want to argue by analogy, suggesting that earlier work on a differ-ent topic or a different context has used methods that parallel what you propose, thereby bolstering your method, but showing it will be applied innovatively.
4. Operationalize the variables. Once these elements have been identi-fied, they can be operationalized. Each one can be captured in one or more measures. The delineation of the model and the specification of variables represent two of the major components of a research design. Once again, they are reciprocal; changes in one may affect the other. The best way to lay out the variables is in a variables table, which indicates the source and form of each variable. The latter has implications for the analysis plan. Table 1-1 provides a model using elements from a congestive heart failure example.
A familiar maxim in outcomes research is that what cannot be measured does not exist. In one sense, the concept is attractive. We need to be able to reduce complex attributes to measurable representations in order to study it and to compare its presence across programs. However, one must approach measurement with respect. Measurement involves distortion; it is by nature a process of abstraction and something is inevitably lost in the process.
Likewise, the commitment to measurement should not be construed as endorsing the idea that everything that can be measured is useful. Perhaps one of the most memorable misuses of measurement was the theory behind the conduct of the Vietnam War. Body counts and arbitrary definitions of successful missions do not necessarily lead to a successful conclusion. Quantitative analysis works best when it serves conceptual thinking, not when it is a substitute for it.
5. Develop a research plan. The last key ingredient is the research plan, which consists of two basic components: (1) how the data will be collected (or if a secondary analysis, what data are available), and
© Jones & Bartlett Learning, LLC. NOT FOR SALE OR DISTRIBUTION.
© Jones & Bartlett Learning, LLCNOT FOR SALE OR DISTRIBUTION
© Jones & Bartlett Learning, LLCNOT FOR SALE OR DISTRIBUTION
© Jones & Bartlett Learning, LLCNOT FOR SALE OR DISTRIBUTION
© Jones & Bartlett Learning, LLCNOT FOR SALE OR DISTRIBUTION
© Jones & Bartlett Learning, LLCNOT FOR SALE OR DISTRIBUTION
© Jones & Bartlett Learning, LLCNOT FOR SALE OR DISTRIBUTION
© Jones & Bartlett Learning, LLCNOT FOR SALE OR DISTRIBUTION
© Jones & Bartlett Learning, LLCNOT FOR SALE OR DISTRIBUTION
© Jones & Bartlett Learning, LLCNOT FOR SALE OR DISTRIBUTION
© Jones & Bartlett Learning, LLCNOT FOR SALE OR DISTRIBUTION
© Jones & Bartlett Learning, LLCNOT FOR SALE OR DISTRIBUTION
© Jones & Bartlett Learning, LLCNOT FOR SALE OR DISTRIBUTION
© Jones & Bartlett Learning, LLCNOT FOR SALE OR DISTRIBUTION
© Jones & Bartlett Learning, LLCNOT FOR SALE OR DISTRIBUTION
© Jones & Bartlett Learning, LLCNOT FOR SALE OR DISTRIBUTION
© Jones & Bartlett Learning, LLCNOT FOR SALE OR DISTRIBUTION
© Jones & Bartlett Learning, LLCNOT FOR SALE OR DISTRIBUTION
© Jones & Bartlett Learning, LLCNOT FOR SALE OR DISTRIBUTION
© Jones & Bartlett Learning, LLCNOT FOR SALE OR DISTRIBUTION
© Jones & Bartlett Learning, LLCNOT FOR SALE OR DISTRIBUTION
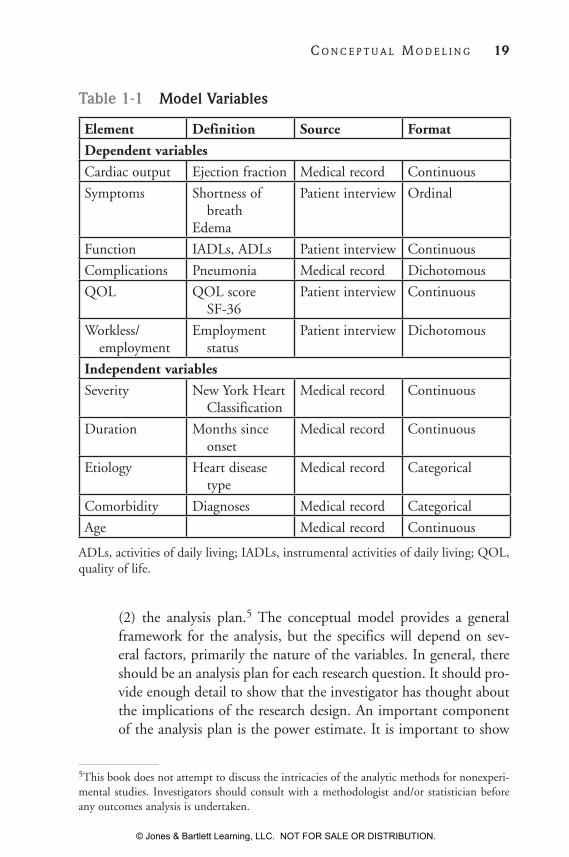
(2) the analysis plan.5 The conceptual model provides a general framework for the analysis, but the specifics will depend on sev-eral factors, primarily the nature of the variables. In general, there should be an analysis plan for each research question. It should pro-vide enough detail to show that the investigator has thought about the implications of the research design. An important component of the analysis plan is the power estimate. It is important to show
Table 1-1 Model Variables
Element Definition Source Format
Dependent variables
Cardiac output Ejection fraction Medical record Continuous
Symptoms Shortness of breathEdema
Patient interview Ordinal
Function IADLs, ADLs Patient interview Continuous
Complications Pneumonia Medical record Dichotomous
QOL QOL score SF-36
Patient interview Continuous
Workless/ employment
Employment status
Patient interview Dichotomous
Independent variables
Severity New York Heart Classification
Medical record Continuous
Duration Months since onset
Medical record Continuous
Etiology Heart disease type
Medical record Categorical
Comorbidity Diagnoses Medical record Categorical
Age Medical record Continuous
ADLs, activities of daily living; IADLs, instrumental activities of daily living; QOL, quality of life.
5This book does not attempt to discuss the intricacies of the analytic methods for nonexperi-mental studies. Investigators should consult with a methodologist and/or statistician before any outcomes analysis is undertaken.
C o n C e p t u a l m o d e l I n g ��
© Jones & Bartlett Learning, LLC. NOT FOR SALE OR DISTRIBUTION.
© Jones & Bartlett Learning, LLCNOT FOR SALE OR DISTRIBUTION
© Jones & Bartlett Learning, LLCNOT FOR SALE OR DISTRIBUTION
© Jones & Bartlett Learning, LLCNOT FOR SALE OR DISTRIBUTION
© Jones & Bartlett Learning, LLCNOT FOR SALE OR DISTRIBUTION
© Jones & Bartlett Learning, LLCNOT FOR SALE OR DISTRIBUTION
© Jones & Bartlett Learning, LLCNOT FOR SALE OR DISTRIBUTION
© Jones & Bartlett Learning, LLCNOT FOR SALE OR DISTRIBUTION
© Jones & Bartlett Learning, LLCNOT FOR SALE OR DISTRIBUTION
© Jones & Bartlett Learning, LLCNOT FOR SALE OR DISTRIBUTION
© Jones & Bartlett Learning, LLCNOT FOR SALE OR DISTRIBUTION
© Jones & Bartlett Learning, LLCNOT FOR SALE OR DISTRIBUTION
© Jones & Bartlett Learning, LLCNOT FOR SALE OR DISTRIBUTION
© Jones & Bartlett Learning, LLCNOT FOR SALE OR DISTRIBUTION
© Jones & Bartlett Learning, LLCNOT FOR SALE OR DISTRIBUTION
© Jones & Bartlett Learning, LLCNOT FOR SALE OR DISTRIBUTION
© Jones & Bartlett Learning, LLCNOT FOR SALE OR DISTRIBUTION
© Jones & Bartlett Learning, LLCNOT FOR SALE OR DISTRIBUTION
© Jones & Bartlett Learning, LLCNOT FOR SALE OR DISTRIBUTION
© Jones & Bartlett Learning, LLCNOT FOR SALE OR DISTRIBUTION
© Jones & Bartlett Learning, LLCNOT FOR SALE OR DISTRIBUTION

�0 Chapter1 IntroduCtIontooutComesresearCh
that the planned data will be sufficient to detect a real difference if one is present. Likewise, in a quasi-experimental design, one needs to address the plans for dealing with selection bias.
Most analyses, especially those that rely on an epidemiological approach will have to be multivariate. One or another variation of regression mod-eling will likely be employed. Although multivariate modeling can take into account the effects of intervening variables, nonrandom assignment invariably raises questions about the comparability of treatment and control groups. Even groups that seem very comparable on the basis of examined variables may vary widely along some other parameter. Some researchers have proposed statistical models to deal with this so-called selection bias. Special models are developed to identify and deal with the correlated error associated with such a bias (see Chapter 3). These corrections use factors that are related to the treatment but not to the outcome.
Interpreting the results of regression equations can be complicated. Fundamentally, the major question is whether the independent variable of greatest interest (usually treatment) is significantly related to the dependent variable (i.e., the outcome) after the effects of other factors has been consid-ered. This relationship can be examined in two ways: (1) the extent to which a change in the risk factor affects the dependent variable (e.g., the odds ratio), and (2) the capacity of the full equation to explain the variance in the model. It is quite feasible for a variable to be very significantly related to the depen-dent variable in an equation that explains very little of the overall variance. Conversely, explaining the variance does not examine the relationship between the independent variables and the dependent variable. In epidemiological terms, the size and strength of a coefficient from the regression equation reflect the power of the relationship, whereas the amount of variance explained describes the power of the overall model. It is possible to have a statistically significant relationship among variables and still not explain much of the total variance in the distribution of the dependent variable. Outcomes may be influenced by many things, not all of them measurable. As a result, many outcomes equations do not account for a great proportion of the variance, although the adjusted relationship between variables of interest may be very significant. Being able to establish a clear relationship between a treatment and its purported effects is important even when that relationship does not account for all, or even most, of the effect. A clear understanding of how a treatment influences outcomes for defined subgroups of patients lays the foundation for meaningful guidelines about what constitutes appropriate care.
© Jones & Bartlett Learning, LLC. NOT FOR SALE OR DISTRIBUTION.
© Jones & Bartlett Learning, LLCNOT FOR SALE OR DISTRIBUTION
© Jones & Bartlett Learning, LLCNOT FOR SALE OR DISTRIBUTION
© Jones & Bartlett Learning, LLCNOT FOR SALE OR DISTRIBUTION
© Jones & Bartlett Learning, LLCNOT FOR SALE OR DISTRIBUTION
© Jones & Bartlett Learning, LLCNOT FOR SALE OR DISTRIBUTION
© Jones & Bartlett Learning, LLCNOT FOR SALE OR DISTRIBUTION
© Jones & Bartlett Learning, LLCNOT FOR SALE OR DISTRIBUTION
© Jones & Bartlett Learning, LLCNOT FOR SALE OR DISTRIBUTION
© Jones & Bartlett Learning, LLCNOT FOR SALE OR DISTRIBUTION
© Jones & Bartlett Learning, LLCNOT FOR SALE OR DISTRIBUTION
© Jones & Bartlett Learning, LLCNOT FOR SALE OR DISTRIBUTION
© Jones & Bartlett Learning, LLCNOT FOR SALE OR DISTRIBUTION
© Jones & Bartlett Learning, LLCNOT FOR SALE OR DISTRIBUTION
© Jones & Bartlett Learning, LLCNOT FOR SALE OR DISTRIBUTION
© Jones & Bartlett Learning, LLCNOT FOR SALE OR DISTRIBUTION
© Jones & Bartlett Learning, LLCNOT FOR SALE OR DISTRIBUTION
© Jones & Bartlett Learning, LLCNOT FOR SALE OR DISTRIBUTION
© Jones & Bartlett Learning, LLCNOT FOR SALE OR DISTRIBUTION
© Jones & Bartlett Learning, LLCNOT FOR SALE OR DISTRIBUTION
© Jones & Bartlett Learning, LLCNOT FOR SALE OR DISTRIBUTION

ORGANIZATION OF THE BOOK
The next three chapters in this introductory section address overarching design issues; two address study design issues, and one is on measure-ment principles. The next section of this book is organized to discuss the implications of the basic outcomes model. Each component is discussed at some length to identify the issues that must be considered and to suggest some measures that may prove useful (along with caveats about using them). The first series of chapters addresses outcomes measures including generic measures, condition-specific measures, and satisfac-tion. The second set of chapters covers the major components of risk adjustment, including severity of illness, comorbidity, and demographic and psychosocial characteristics. The last chapter in this section discusses treatment and proposes a taxonomy for this central component. The final three chapters address some overarching issues in conducting out-comes research. Cost-effectiveness is a growing area of related interest in outcomes research. The next chapter addresses some practical issues in implementing research studies in a clinical setting. We then offer some final thoughts for those who are anxious to launch into outcomes stud-ies. Although these observations are intended primarily for neophytes, we hope that even more experienced outcomes researchers may gain some useful insights from them.
REFERENCES
Agency for Healthcare Research and Quality. (2002). Systems to rate the strength of scientific evidence (No. 47). Available at: www.ahrq .gov/clinic/epcsums/strengthsum.htm. Accessed March 31, 2010.
Angrist, J. D., Imbens, G. W., & Rubin, D. B. (1996). Identification of causal effects using instrumental variables. Journal of the American Statistical Association, 91(434), 444–472.
Begg, C., Cho, M., Eastwood, S., Horton, R., Moher, D., Olkin, I., . . .Stroup, D. F. (1996). Improving the quality of reporting of randomized controlled trials: The CONSORT statement. JAMA, 276, 637–649.
Berwick, D. M. (1989). Continuous improvement as an ideal in health care. New England Journal of Medicine, 320(1), 53–56.
r e f e r e n C e s ��
© Jones & Bartlett Learning, LLC. NOT FOR SALE OR DISTRIBUTION.
© Jones & Bartlett Learning, LLCNOT FOR SALE OR DISTRIBUTION
© Jones & Bartlett Learning, LLCNOT FOR SALE OR DISTRIBUTION
© Jones & Bartlett Learning, LLCNOT FOR SALE OR DISTRIBUTION
© Jones & Bartlett Learning, LLCNOT FOR SALE OR DISTRIBUTION
© Jones & Bartlett Learning, LLCNOT FOR SALE OR DISTRIBUTION
© Jones & Bartlett Learning, LLCNOT FOR SALE OR DISTRIBUTION
© Jones & Bartlett Learning, LLCNOT FOR SALE OR DISTRIBUTION
© Jones & Bartlett Learning, LLCNOT FOR SALE OR DISTRIBUTION
© Jones & Bartlett Learning, LLCNOT FOR SALE OR DISTRIBUTION
© Jones & Bartlett Learning, LLCNOT FOR SALE OR DISTRIBUTION
© Jones & Bartlett Learning, LLCNOT FOR SALE OR DISTRIBUTION
© Jones & Bartlett Learning, LLCNOT FOR SALE OR DISTRIBUTION
© Jones & Bartlett Learning, LLCNOT FOR SALE OR DISTRIBUTION
© Jones & Bartlett Learning, LLCNOT FOR SALE OR DISTRIBUTION
© Jones & Bartlett Learning, LLCNOT FOR SALE OR DISTRIBUTION
© Jones & Bartlett Learning, LLCNOT FOR SALE OR DISTRIBUTION
© Jones & Bartlett Learning, LLCNOT FOR SALE OR DISTRIBUTION
© Jones & Bartlett Learning, LLCNOT FOR SALE OR DISTRIBUTION
© Jones & Bartlett Learning, LLCNOT FOR SALE OR DISTRIBUTION
© Jones & Bartlett Learning, LLCNOT FOR SALE OR DISTRIBUTION

�� Chapter1 IntroduCtIontooutComesresearCh
D’Agostino, R. B., Jr. (1998). Propensity score methods for bias reduction in the comparison of a treatment to a non-randomized control group. Statistics in Medicine, 17, 2265–2281.
Donabedian, A. (1966). Evaluating the quality of medical care. Milbank Memorial Fund Quarterly, 44(3), 166–206.
Donabedian, A. (1988). The quality of care: How can it be assessed? JAMA, 260, 1743–1748.
Field, M., & Lohr, K. (Eds.). (1992). Guidelines for clinical practice: From development to use. Washington, DC: National Academy Press.
Fisher, E. S., Wennberg, D. E., Stukel, T. A., Gottlieb, D. J., Lucas, F. L., & Pinder, E. L. (2003). The implications of regional variations in Medicare spending. Part 2: Health out-comes and satisfaction with care. Annals of Internal Medicine, 138(4), 288–298.
Glickman, S. W., Ou, F.-S., DeLong, E. R., Roe, M. T., Lytle, B. L., Mulgund, J., . . .Peterson, E. D. (2007). Pay for performance, quality of care, and outcomes in acute myocardial infarction. JAMA, 297(11), 2373–2380.
Guyatt, G. H., Deyo, R. A., Charlson, M., Levine, M. N., & Mitchell, A. (1989). Responsiveness and validity in health status measurement: A clarification. Journal of Clinical Epidemiology, 42(5), 403–408.
Heckman, J. (1979). Sample selection bias as a specification error. Econometrica, 47, 153–161.
Heckman, J. J. (2008). Econometric causality. International Statistical Review, 76(1), 1–27.
Hibbard, J. H., & Jewett, J. J. (1997). Will quality report cards help consumers? Health Affairs, 16(3), 218–228.
Hibbard, J. H., Peters, E., Dixon, A., & Tusler, M. (2007). Consumer competencies and the use of comparative quality information: It isn’t just about literacy. Medical Care Research Review, 64(4), 379–394.
© Jones & Bartlett Learning, LLC. NOT FOR SALE OR DISTRIBUTION.
© Jones & Bartlett Learning, LLCNOT FOR SALE OR DISTRIBUTION
© Jones & Bartlett Learning, LLCNOT FOR SALE OR DISTRIBUTION
© Jones & Bartlett Learning, LLCNOT FOR SALE OR DISTRIBUTION
© Jones & Bartlett Learning, LLCNOT FOR SALE OR DISTRIBUTION
© Jones & Bartlett Learning, LLCNOT FOR SALE OR DISTRIBUTION
© Jones & Bartlett Learning, LLCNOT FOR SALE OR DISTRIBUTION
© Jones & Bartlett Learning, LLCNOT FOR SALE OR DISTRIBUTION
© Jones & Bartlett Learning, LLCNOT FOR SALE OR DISTRIBUTION
© Jones & Bartlett Learning, LLCNOT FOR SALE OR DISTRIBUTION
© Jones & Bartlett Learning, LLCNOT FOR SALE OR DISTRIBUTION
© Jones & Bartlett Learning, LLCNOT FOR SALE OR DISTRIBUTION
© Jones & Bartlett Learning, LLCNOT FOR SALE OR DISTRIBUTION
© Jones & Bartlett Learning, LLCNOT FOR SALE OR DISTRIBUTION
© Jones & Bartlett Learning, LLCNOT FOR SALE OR DISTRIBUTION
© Jones & Bartlett Learning, LLCNOT FOR SALE OR DISTRIBUTION
© Jones & Bartlett Learning, LLCNOT FOR SALE OR DISTRIBUTION
© Jones & Bartlett Learning, LLCNOT FOR SALE OR DISTRIBUTION
© Jones & Bartlett Learning, LLCNOT FOR SALE OR DISTRIBUTION
© Jones & Bartlett Learning, LLCNOT FOR SALE OR DISTRIBUTION
© Jones & Bartlett Learning, LLCNOT FOR SALE OR DISTRIBUTION

Juni, P., Altman, D. G., & Egger, M. (2001). Systematic reviews in health care: Assessing the quality of controlled clinical trials. British Medical Journal, 323, 42–46.
Kohn, L. T., Corrigan, J. M., & Donaldson, M. S. (Eds.). (2000). To err is human: Building a safer health system. Washington, DC: National Academy Press.
Lee, L. F. (1994). Semiparametric instrumental variable estimation of simultaneous equation sample selection models. Journal of Econometrics, 63(2), 341–388.
Lindenauer, P. K., Remus, D., Roman, S., Rothberg, M. B., Benjamin, E. M., Ma, A., & Bratzler, D. W. (2007). Public reporting and pay for performance in hospital quality improve-ment. New England Journal of Medicine, 356(5), 486–496.
Rosenthal, M. B., Landon, B. E., Normand, S.-L. T., Frank, R. G., & Epstein, A. M. (2006). Pay for performance in commercial HMOs. New England Journal of Medicine, 355(18), 1895–1902.
Sackett, D. L., Richardson, W. S., Rosenberg, W. M. C., & Haynes, R. B. (1997). Evidence-based medicine: How to practice and teach EBM. New York: Churchill Livingstone Press.
Shadish, W. R., Cook, T. D., & Campbell, D. T. (2002). Experimental and quasi-experimental designs for generalized causal inference. Boston: Houghton Mifflin.
Stukel, T. A., Fisher, E. S., Wennberg, D. E., Alter, D. A., Gottlieb, D. J., & Vermeulen, M. J. (2007). Analysis of observational stud-ies in the presence of treatment selection bias: Effects of invasive cardiac management on AMI survival using propensity score and instrumental variable methods. JAMA, 297(3), 278–285.
Weed, L. L. (1968a). Medical records that guide and teach. New England Journal of Medicine, 278(11), 593–600.
Weed, L. L. (1968b). Medical records that guide and teach. New England Journal of Medicine, 278(12), 652–657.
Werner, R. M., & Asch, D. A. (2005). The unintended consequences of publicly reporting quality information. JAMA, 293(10), 1239–1244.
r e f e r e n C e s ��
© Jones & Bartlett Learning, LLC. NOT FOR SALE OR DISTRIBUTION.
© Jones & Bartlett Learning, LLCNOT FOR SALE OR DISTRIBUTION
© Jones & Bartlett Learning, LLCNOT FOR SALE OR DISTRIBUTION
© Jones & Bartlett Learning, LLCNOT FOR SALE OR DISTRIBUTION
© Jones & Bartlett Learning, LLCNOT FOR SALE OR DISTRIBUTION
© Jones & Bartlett Learning, LLCNOT FOR SALE OR DISTRIBUTION
© Jones & Bartlett Learning, LLCNOT FOR SALE OR DISTRIBUTION
© Jones & Bartlett Learning, LLCNOT FOR SALE OR DISTRIBUTION
© Jones & Bartlett Learning, LLCNOT FOR SALE OR DISTRIBUTION
© Jones & Bartlett Learning, LLCNOT FOR SALE OR DISTRIBUTION
© Jones & Bartlett Learning, LLCNOT FOR SALE OR DISTRIBUTION
© Jones & Bartlett Learning, LLCNOT FOR SALE OR DISTRIBUTION
© Jones & Bartlett Learning, LLCNOT FOR SALE OR DISTRIBUTION
© Jones & Bartlett Learning, LLCNOT FOR SALE OR DISTRIBUTION
© Jones & Bartlett Learning, LLCNOT FOR SALE OR DISTRIBUTION
© Jones & Bartlett Learning, LLCNOT FOR SALE OR DISTRIBUTION
© Jones & Bartlett Learning, LLCNOT FOR SALE OR DISTRIBUTION
© Jones & Bartlett Learning, LLCNOT FOR SALE OR DISTRIBUTION
© Jones & Bartlett Learning, LLCNOT FOR SALE OR DISTRIBUTION
© Jones & Bartlett Learning, LLCNOT FOR SALE OR DISTRIBUTION
© Jones & Bartlett Learning, LLCNOT FOR SALE OR DISTRIBUTION