introduction to: moving target indicator radar (draft) · 10/24/2017 draft 1 introduction to:...
TRANSCRIPT

10/24/2017
DRAFT 1
Introduction to:Moving Target Indicator Radar
(DRAFT)
Armin Doerry
1
This presentation is an informal communication intended for a limited audience comprised of attendees to the Institute for Computational and Experimental Research in Mathematics (ICERM) Semester Program on "Mathematical and Computational Challenges in Radar and Seismic Reconstruction“ (September 6 ‐December 8, 2017).
This presentation is not intended for further distribution, dissemination, or publication, either whole or in part.
2
"Nothing happens until something moves."— Albert Einstein
Courtesy Wikimedia

10/24/2017
DRAFT 2
Basic Moving Target Detection (MTI) Modes
• Ground‐Moving‐Target Indicator (GMTI) Radar
– GMTI Wide‐Area Search (GWAS)
– Surface‐Moving‐Target Indicator (SMTI)
– Dismount Moving‐Target Indicator (DMTI)
– Airborne Moving‐Target Indicator (AMTI)
• Video‐SAR
3
All SAR images in this presentation are Courtesy of Sandia National Laboratories, Airborne ISR, unless otherwise noted.
One radar pulse can measure time delay to a target point
Because we know the speed of the radar wave, we can calculate a target point range from that time delay.
So… with a single radar pulse we can measure Range
If we collect two or more radar pulses, we can measure range changes from pulse to pulse.
So… with multiple pulses we can measure Range Rate
Range-rate will cause a proportional Doppler shift to the radar echo.
Basic Concepts
4

10/24/2017
DRAFT 3
What is Doppler in SAR?
5
The Doppler effect (or Doppler shift) is the change in frequency of a wave (or other periodic event) for an observer moving relative to its source. It is named after the Austrian physicist Christian Doppler, who proposed it in 1842 in Prague. It is commonly heard when a vehicle sounding a siren or horn approaches, passes, and recedes from an observer. – Wikipedia, 21 September 2017
0 02
, , rect ... cos 2R R n sx t n A f t t rc
s
Received signal from a static range
Received signal from a linearly changing range
0 0 0
0 00 0 0
2, , rect ... cos 2
4 42rect ... cos 2 1
R R n s s
R s n s s n
x t n A f t t r v t tc
f fA f v t t r v t t
c c c
s
, 0s n srr
, 0 0s n s sr v t t r
Time/Frequency scaling inside of a pulse Pulse‐to‐pulse phase change
Consider a CW pulse echo – from earlier analysis(pulses of fixed‐frequency signal)
Principal exploited effectOften ignored
What is Doppler in GMTI Radar?
6
A tacit assumption in GMTI is that tn
increases linearly with pulse index n, which doesn’t really care about where along the flight path those pulses emanate.
So, for SAR, a pulse‐to‐pulse phase change becomes a spatially‐dependent phase change, i.e. a wavenumber measure.
For SAR, ultimately the velocity, and hence the times at which data are collected, is immaterial. The important factor is “where” the synthetic aperture has been sampled.
For GMTI, it is all about “when” the radar echoes are collected.
Doppler processing is typically about observing manifestations in ‘slow‐time’
Doppler effects within a single pulse’s echo are typically ignored.

10/24/2017
DRAFT 4
A B
C
Stationary targets A, B, and C are all being approached by the radar at different rates. They all have different “Range Rates”.
A filter set for different range rates will isolate and separate the different targets.
SAR Refresh
7
This is the SAR case.
Static reflectors
A SAR image is just the answer to the question “How much echo energy is there at different pairs of ‘range’ and ‘range rate’.
However, the ‘image’ is usually restricted to range and range-rate combinations that are within the antenna beam footprint.
A SAR image is an echo energy map with dimensions of Range and Range-rate…
Equivalently, dimensions of Range and Doppler.
SAR Refresh
8
All echoes are presumed to be from static reflectors

10/24/2017
DRAFT 5
If we create a SAR image beyond the antenna footprint, then we are measuring echo energy corresponding to range and range-rate for which no echo energy should exist (assuming static reflectors).
All we should see is Noise…
Noise region outside of antenna beam footprint
9
The SAR image usually throws away the exo-clutter region before displaying some subset of the endo-clutter region.
Endo-clutter region
Exo-clutter region
SAR Refresh
10

10/24/2017
DRAFT 6
A B
C
If a target is moving, it is going to have a range rate that is 1. Due to its location,
-- AND--2. Due to its motion.
The radar is going to map its energy to its range and ‘total’ range rate.
Moving Reflectors
11
Moving reflector
Note that it is NOT the absolute speed of the vehicle that is important.
Rather, it is the rate at which it is closing with the radar compared to the stationary clutter around it. This will typically be less than the vehicle’s ground speed.
Moving Reflectors
12

10/24/2017
DRAFT 7
A Moving target will have its energy mapped to a position in the SAR image that corresponds to its TOTAL range-rate.
It will be mapped to a range-rate that is different than the range-rate due just to its location. The fact that the target is moving will cause its energy to shift in the ‘image’.
A moving target’s echo energy will be shifted in a Range-Doppler map.
They will be shifted one way if velocity is towards the radar. They will be shifted the other way if the velocity is away from the radar.
The amount of shift is proportional to the velocity towards or away from the radar.
Moving Reflectors
13
Note the displaced energy due to train motion.
14

10/24/2017
DRAFT 8
Moving Reflectors
15
In addition, a moving reflector will not generally ‘fit’ the profile of a static reflector, so will often be misfocussed, even if not substantially shifted.
This manifests as ‘streaks’ in a SAR image – essentially misfocussed echo energy.
The pulsed nature of many radar systems also allows multiple velocities to ‘alias’ to the same Doppler frequency.
Consequently, MTI radars often operate at higher PRF than, say, SAR systems.
Since we are usually more interested in detection, rather than imaging, we would generally like energy to stack up into single pixels. This causes us to limit data collections to fractions of a second, else nonuniform target range‐rate will cause smearing across multiple pixels, diluting their detectability – we lose target coherence.
Oddball streaks are often an indication of motion.
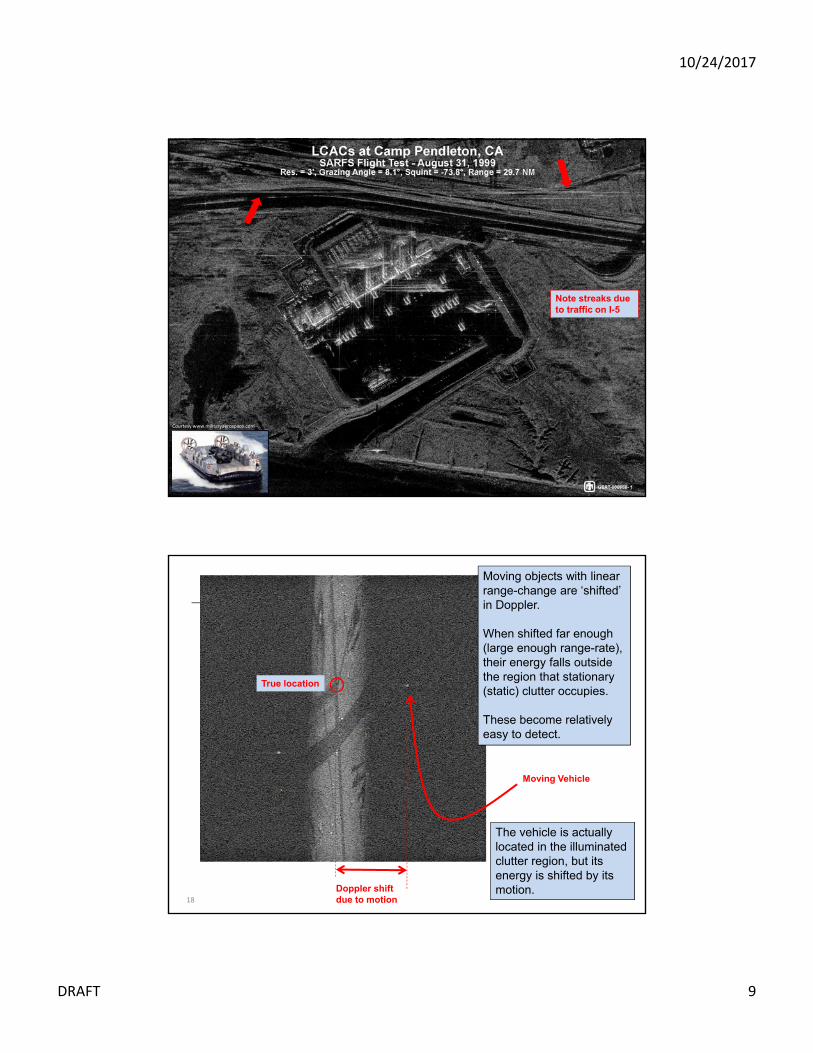
16
10/24/2017
DRAFT 9
Note streaks due to traffic on I-5
17
Courtesy www.militaryaerospace.com
Moving Vehicle
The vehicle is actually located in the illuminated clutter region, but its energy is shifted by its motion.Doppler shift
due to motion
True location
18
Moving objects with linear range-change are ‘shifted’ in Doppler.
When shifted far enough (large enough range-rate), their energy falls outside the region that stationary (static) clutter occupies.
These become relatively easy to detect.

10/24/2017
DRAFT 10
GMTI normally does not display the range-Doppler map as a data product.
Rather, the range-Doppler map is an intermediary product on the way to an automatic detection system.
The GMTI product is typically just ‘detection reports’ with suitable metadata (e.g. RCS estimate, closing velocity, estimated physical location, etc.).
Detections are then simply displayed on a map,sometimes color-coded, or tagged with metadata,often with tracking (time-history) information.
GMTI Products
19
Ground Truth
Doppler
Ran
ge
GMTI Range‐Doppler Map
20
Courtesy Wikipedia
Courtesy Wikipedia
Courtesy San Diego Motorsport Rentals

10/24/2017
DRAFT 11
If moving targets are moving fast enough so their energy is shifted out of the antenna beam clutter (into the exo-clutter region), then we can detect them relatively easily.
But what if they are shifted only a little bit?
GMTI Range‐Doppler Map
21
Is this bright spot a stationary object, or is it a moving object that has been shifted only a little bit, just not enough to push its energy into the exo-clutter region?
This suggests that to be clearly identified as a moving object, its energy must be shifted into the exo-clutter region.
It must have a minimum velocity in order to be detected – a Minimum Detectable Velocity (MDV)…
GMTI Range‐Doppler Map
22
?

10/24/2017
DRAFT 12
If we don’t know the object’s true position, we can’t really know its true velocity.
All we can measure is the total range-rate due to both its position AND its own speed on the ground.
So what do we do?
But what is the True location?
But what is the True shift?Target’s true velocity???
GMTI Range‐Doppler Map
23
Conventionally, we decide that the ‘best guess’ object location is in the center of the antenna beam footprint (in azimuth).
And the target velocity is the difference in range-rate from the center of the beam to the detected target’s energy.
But this naturally leads to errors in the reported versus actual azimuth position and closing velocity.
Reported Location
Reported Velocity
GMTI Range‐Doppler Map
24
Noisy locations

10/24/2017
DRAFT 13
The amount of target velocity that would cause a target’s energy to shift from the beam center to the beam edge is the conventionally reported “Minimum Detectable Velocity” (MDV).
However, if a target is located left or right of the beam centerline, then it’s shift may need to be more or less than the MDV in order to appear in the exo-clutter region.
MDV
Targets > MDV can sometimes be missed, and Targets < MDV can sometimes be detected.
GMTI Range‐Doppler Map
25
In any case, the GMTI algorithm will generally ‘cut out’ the region within the ‘MDV’ limits, and not attempt to detect anything inside of this region.
Detections are limited to outside the ‘endo-clutter’ region.
This, of course, requires knowing where the clutter region is in range and range-rate.
GMTI Range‐Doppler Map
26

10/24/2017
DRAFT 14
A B
C
The range-rate component due to aircraft motion depends on the aircraft velocity. This component is based solely on position, and is true for all objects, including stationary objects, i.e. clutter…
The range-rate component due to target motion does NOT depend on the aircraft velocity.
Moving Target Doppler
27
So… The faster the radar flies, the greater is the range-rate (Doppler) spread due to position…
Stationary clutter gets wider in the range-Doppler map
But moving objects do not shift proportionately.
Position-based RR Velocity-based RR
Position-based RR Velocity-based RR
Total RR
Total RRDoubling the radar’s velocity will double the clutter width, but not double the shift of a moving object.
Moving Target Doppler
28

10/24/2017
DRAFT 15
If the radar flies faster, the clutter region widens, but the vehicle Doppler shift due to its own motion is unchanged.
We start to lose MDV(MDV gets bigger).
Note that the vehicle energy is closer to the clutter edge.
Moving Target Doppler
29
At very high velocities, the clutter takes up all the Doppler bandwidth.
There is little or no exo-clutter region.
All movers are inside the clutter region and therefore undetectable by the simple means.
This is typical of fast jet aircraft.
Is this bright dot a mover that is shifted just a little bit, or is it a stationary object?
Moving Target Doppler
30

10/24/2017
DRAFT 16
So… We like narrow clutter regions so that we can have a low MDV.
We can make the clutter region narrower again by using a narrower beamwidth antenna. This means an antenna with larger azimuth dimension; a bigger antenna…
We can also make the clutter region narrower by flying slower. We can mimic this by pointing the antenna closer to the nose of the aircraft.
In this manner we can detect some rather slow-moving targets, like people walking (sometimes called “dismounts”).
Detectable Velocity
31
Ideally, the radar is stationary, i.e. hovering
Courtesy Lockheed Martin
The width of the clutter region depends on the tangential (a.k.a. cross-line-of-sight, cross-range) velocity.
The velocity component in the cross-range direction
Actual aircraft velocity
Relevant aircraft velocity
MDV is lowest straight-ahead, or straight-behind the aircraft heading.
Detectable Velocity
32

10/24/2017
DRAFT 17
Squint angle
Detectable Velocity
33
Determining the exclusion region for detections depends on knowing where the clutter region is in range and Doppler.
BUT…
The range and range-rate depends on the radar’s viewing geometry… which in turns depends on the scene topography…
Detectable Velocity
34

10/24/2017
DRAFT 18
If we get the clutter exclusion region wrong, then we will detect as a moving target some echo energy that is really from a stationary clutter object.
-- increased False Alarms
Or perhaps miss a valid moving target.
-- decreased Probability of Detection
Expected clutter region
Detectable Velocity
35
-400-200
0200
400
-2000
-1500
-1000
-500
0
500
1000
1500
2000
-400
-200
0
200
400
s z - m
sx - m
sy - m
Suppose we have an array of stationary corner reflectors on the ground.
What would this clutter look like in a range-Doppler map?
Topography Effects
36

10/24/2017
DRAFT 19
-20 -15 -10 -5 0 5 10 15 20-2500
-2000
-1500
-1000
-500
0
500
1000
1500
2000
2500
r sc -
m
vlos,sc
- m/s
At broadside, the array looks essentially vertical, although with some distortion that shrinks in azimuth at farther ranges.
This is due to the fact that Range-rate, or Doppler is an angle phenomenon, and our ground-truth has constant linear distance dimensions.
Topography Effects
37 -20 -15 -10 -5 0 5 10 15 20-2500
-2000
-1500
-1000
-500
0
500
1000
1500
2000
2500
r sc -
m
vlos,sc
- m/s
At squint angles, the clutter is warped to a non-vertical band.
-20 -15 -10 -5 0 5 10 15 20-2500
-2000
-1500
-1000
-500
0
500
1000
1500
2000
2500
r sc -
m
vlos,sc
- m/s
flat scene
200 m elevation
If the scene is at a different altitude than expected, the clutter band will shift in both range AND range-rate (Doppler).
Topography Effects
38
A vertical velocity component (radar climbing or descending) will also warp the clutter band.
-20 -15 -10 -5 0 5 10 15 20-2500
-2000
-1500
-1000
-500
0
500
1000
1500
2000
2500
r sc -
m
vlos,sc
- m/s
level flight
vz = 10 m/s

10/24/2017
DRAFT 20
-400-200
0200
400
-2000
-1500
-1000
-500
0
500
1000
1500
2000
-1000
100
sx - m
sy - m
s z - m
-20 -15 -10 -5 0 5 10 15 20-2500
-2000
-1500
-1000
-500
0
500
1000
1500
2000
2500
r sc -
m
vlos,sc
- m/s
flat scene
3-D scene
If the scene has non-level topography, then the range-Doppler map will reflect this with corresponding range-rate displacements.
Topography Effects
39
A scene that is tilted in cross-range will exhibit a broadening or narrowing of the clutter band.
-20 -15 -10 -5 0 5 10 15 20-2500
-2000
-1500
-1000
-500
0
500
1000
1500
2000
2500
r sc -
m
vlos,sc
- m/s
flat scene
azimuth tilt
-400-200
0200
400
-2000
-1500
-1000
-500
0
500
1000
1500
2000
-200
0
200
sx - m
sy - m
s z - m
Bottom Line:
To minimize False Alarms, and maximize detections, the radar needs to account for topography when deciding where the clutter band is.
The radar needs access to DTED data – especially in mountains.
Topography Effects
40
It’s all about accounting for “layover”
DTED = Digital Terrain Elevation Data

10/24/2017
DRAFT 21
h
v
h
v
vh
x
y
radar
rc
SRP
vh
x
y
radar
rc
SRP
What if the antenna beam is twisted about its axis?
If the beam is twisted, the antenna beam footprint will be different than expected…
and the clutter band will be different than expected…
Antenna Twist
41
An issue for 2‐axis gimballed antennae
-4 -2 0 2 4
-6
-4
-2
0
2
4
6
horizontal offset - deg.
vert
ical
off
set
- de
g.
Antenna Pattern
-2000 -1000 0 1000 2000-3000
-2000
-1000
0
1000
2000
3000
4000
5000
6000
x offset - m
y of
fset
- m
Ground Projection
-4 -2 0 2 4
-6
-4
-2
0
2
4
6
horizontal offset - deg.
vert
ical
off
set
- de
g.
Antenna Pattern
-2000 -1000 0 1000 2000-3000
-2000
-1000
0
1000
2000
3000
4000
5000
6000
x offset - m
y of
fset
- m
Ground Projection
-4 -2 0 2 4
-6
-4
-2
0
2
4
6
horizontal offset - deg.
vert
ical
off
set
- de
g.
Antenna Pattern
-2000 -1000 0 1000 2000-3000
-2000
-1000
0
1000
2000
3000
4000
5000
6000
x offset - m
y of
fset
- m
Ground Projection
-4 -2 0 2 4
-6
-4
-2
0
2
4
6
horizontal offset - deg.
vert
ical
off
set
- de
g.
Antenna Pattern
-2000 -1000 0 1000 2000-3000
-2000
-1000
0
1000
2000
3000
4000
5000
6000
x offset - m
y of
fset
- m
Ground Projection
42

10/24/2017
DRAFT 22
Sometimes stationary clutter isn’t all that stationary
up to 0.32 m/s for wooded hills with 40 kt wind,up to 1.1 m/s for sea echoes,up to 1.2 m/s for chaff in 25 kt wind, andup to 4.0 m/s for rain clouds.
Likely to have more false alarms on windy days
Clutter Motion
43
Sometimes we want to detect some very slow-moving targets, like people (or “dismounts”) walking.
These have small RCS, 0 dBsm to -10 dBsm,
and move with low velocities, less than 1 m/s.
Dismount Moving Target Indicator (DMTI) radar.
DMTI is just GMTI for people targets…
Reducing MDV
With a single‐beam antenna, we would need some combination of1. Large antenna2. Slow radar velocity3. Limited to forward or aft squint angles
Basic Multi‐Channel DMTI/GMTI
44
Sometimes we need “more”

10/24/2017
DRAFT 23
45
“If a problem can’t be solved, enlarge it.”-- Dwight D. Eisenhower
Dwight D. Eisenhower Presidential Library and Museum, National Archives (63‐92)
An alternative is to use a more exotic GMTI scheme.
We essentially need to separate or discriminate the energy of the stationary clutter from the energy of the slow-moving vehicle or dismount.
This requires another degree of freedom, that is, another source of information. This is accomplished with a multi-phase-center (or multi-beam) antenna and a multi-channel radar system. This is a more complex hardware and software solution.
Reducing MDV
46
A new dimension to the data

10/24/2017
DRAFT 24
If clutter is sufficiently cancelled or suppressed (filtered), the moving targets become ‘visible’ again.
These techniques are generically called “Endo-clutter” GMTI techniques.
Such systems are typical for fast-moving platforms, such as J-STARS, GlobalHawk, and orbital GMTI concepts.
These systems are harder to design, build, calibrate, etc.Clutter band region
Clutter Cancellation/Suppression
47
For example, we can take two separate SAR images of the same scene, but at slightly different times, but equal in all other respects.
Whatever is different between the two images must be due to something that has moved, even if by only a fraction of a wavelength. [change detection]
The basic idea for detecting moving targets in the endo-clutter region is to:
Make two (or more) range-Doppler mapsFrom essentially the same place in space (along same flight path)But at slightly different times (i.e. front-half and back-half of antenna)
Complex pixels that ‘match’ are identified as ‘clutter’. By mapping the “mis-match” in the range-Doppler map, we have essentially cancelled, or suppressed, stationary (static) clutter.
Pixels that ‘don’t match’ in the range-Doppler map are identified as ‘moving objects’.
Having the second range-Doppler map yields an extra degree of freedom - an extra amount of information to allow separating stationary clutter from moving targets.
Clutter Cancellation/Suppression
48

10/24/2017
DRAFT 25
Clutter Cancellation/Suppression
49
All practical GMTI processing algorithms have in common the notion that we have ‘multiple’ simultaneous perspectives (antennas) along with multiple time history of pulses for each of them.
In this manner, we can somewhat decouple ‘space’ from ‘time.’
This, of course, means we need to process across both dimensions of ‘space’ and ‘time.’
Space‐Time Processing
Gives us an angle measure Gives us a Doppler measure
“Data cube”
Fast‐tim
e
Slow‐time
There are a variety of processing algorithms for multiple antenna phase centers, or multiple antenna beams.
These go by various names, like
1. Displaced Phase Center Antenna (DPCA)2. Along Track Interferometry (ATI)3. Space‐Time Adaptive Processing (STAP)
All are related and essentially try to do the same thing; look for reflectors that do not behave as static clutter.
Clutter Cancellation/Suppression
50

10/24/2017
DRAFT 26
Displaced Phase Center Antenna (DPCA)
51
Background: Consider the sum of two echo signals, after demodulation, one that is at a constant range, and one that is at a range that is changing with pulse number.
Now take the difference between adjacent pulses, spaced Tp apart in time.
0 0 00 1 1 0
4 4 4cos cosR s s s n
f f fx n r r v t t
c c c
Stationary target Moving target
0 0 01 1 1 0
4 4 41 sinR R s p s s n
f f fx n x n v T r v t t
c c c
The stationary target has been cancelled, but the moving target, by virtue of its velocity, passes this simple filter.
Single‐delay canceller.More elaborate schemes exist
Target velocity
Displaced Phase Center Antenna (DPCA)
52
As a pair of antennae fly past a target scene, the fore antenna interrogates the scene, followed by the aft antenna interrogating the same scene from the same place in space, but delayed in time.
A pair of antennae are arranged to follow the same flight path exactly, and are otherwise in all respects the same.
The echo from the aft antenna at pulse n+1 are subtracted from the echo of the fore antenna at pulse n to yield a stationary‐clutter cancelled output.
This is done for every pixel in a range‐Doppler map.

10/24/2017
DRAFT 27
Alternatively, suppose that we had a separate angle measure for each and every pixel in a range-Doppler map.
If the separate angle measure shows the direction of the echo is different than to where it shows up in the range-Doppler map, then the target’s energy must have been shifted due to its motion.
So this pixel’s echo energy must be from a slow mover.
But suppose that a separate angle measure says that the target should be here.
Our range-Doppler map shows that this energy is located here.
Along Track Interferometry (ATI)
53
Monopulse Antennae
54
Monopulse techniques are derived from early tracking radars, where the ratio of separate beams were used directly to drive the pointing of an antenna to keep it centered onto a target.
“Monopulse” refers to the ability to determine Direction of Arrival (DOA) using “nulls” generated from multiple beams with a single pulse.
An inherent truth with filters and antenna beams is that “nulls” are much sharper (more localized) than peaks.
Courtesy BAE Systems
Uniformly illuminated aperture blue = sum pattern green = left right
Courtesy NY Daily News
‐‐ better suited for DOA measurements

10/24/2017
DRAFT 28
How to measure angle: Amplitude Monopulse Antenna
Common for dish reflector antennae.
A B C
Right Beam
Left Beam
In this configuration, we have two beams slightly squinted with respect to each other.
Each beam has angle‐dependent gain, but since the beams have different squint, their angle‐dependent gains are different from each other.
Target direction A has more gain in the left beam than the right beam.
Target direction B has equal gains in both beams.
Target direction C has more gain in the right beam than the left beam.
Each beam yields a separate range‐Doppler image.
By comparing the relative strength of target echo in both images, we can estimate the angle at which the target resides…
without regard for, and independent of, Doppler.
55
Dual‐Feed Reflector Antenna
By using two feeds, each slightly offset from the focal point of a reflector antenna, we can create the two beams with effectively common origin, but slightly different squint angles.
reflector
Dual feeds
Amplitude Monopulse Antenna
56

10/24/2017
DRAFT 29
For signal processing convenience, frequently instead of left and right channels, the radar receives sum and difference channels.
The monopulse network is bi‐directional.
The transmitted signal is usually fed to the sum channel, so that it is applied equally to both feeds,
R L
reflector
Dual feeds
Monopulse Network R‐LR+L
SumChannel
DifferenceChannel
Amplitude Monopulse Antenna
57
Has some advantages when dealing with processing channel imbalances.
How to measure angle: Phase Monopulse Antenna
Right Beam
Left Beam
In this configuration, we have two beams with slightly different phase center locations, but otherwise squinted the same.
Each beam has slightly different range to target, manifesting as a slight phase‐difference in the respective target echoes.
The phase difference depends on how left or right the target is with respect to the boresight direction.
Each beam yields a separate range‐Doppler image.
By comparing the relative phase between the echoes, we can estimate the angle at which the target resides…
without regard for, and independent of, Doppler.
Common for flat-panel array antennae.
The choice between amplitude versus phase monopulse is more about convenience for a particular antenna technology (e.g. dish vs. flat panel array). Otherwise there is no real advantage of one over the other for a given antenna size constraint.
58

10/24/2017
DRAFT 30
Space‐Time Adaptive Processing (STAP)
59
For each and every range‐Doppler combination, we want to examine the data over the physical antenna array to see if a signal can be detected in the presence of noise and whatever interference/clutter may exist.
Thermal noise (AWGN model)
interference
clutter
signal
Antenna array
We wish our filter to ‘adapt’ to the RF environment, to maximize our ability to detect the signal, with minimum expected mean‐squared‐error.
11 1Hopt s s s
nn nnw v R v R v
x0 x1 x2 …
test direction
Hopty w x
optimal weights
nnRwhere Covariance matrix of everything undesired
Optimally filtered output
s v Steering vector for desired look direction
“Adaptive beamforming”
Space‐Time Adaptive Processing (STAP)
60
The performance of STAP is highly dependent on accurate estimation of the covariance matrix
This is especially difficult due to1. Limited data with which to estimate2. Nonhomogeneous clutter from
which to estimate
These difficulties lead to suboptimal filters, which lead to excessive false alarms and reduced detection probabilities.
Schemes to deal with these difficulties abound.
nnR
More recently, there has been some success in developing the optimal filter without overtly calculating the covariance matrix, usually involving some iterative adaptation.
Hard part

10/24/2017
DRAFT 31
Actually, multiple antenna beams allows separating position information from velocity information.
We can now resolve this ambiguity as well.
Consequently, multiple antenna beams allow more accurate azimuth position information.
Two or more antennas allow improved exo-clutter Direction of Arrival (DOA) measurement.
But what is the True location?
But what is the True shift?Target’s true velocity???
Moving Target Geolocation
61
Moving Target Geolocation
62
Courtesy Wikimedia.org
Clearly, we desire to know accurately just where the moving targets are located; placing them in their correct location, and on their correct path.

10/24/2017
DRAFT 32
How many antenna beams are enough?
63
Fundamentally, N samples can produce N‐1 independent nulls.
In addition, we can view the problem of determining DOA as one of optimal null‐steering.
One phase center can “detect” an exo‐clutter target, but does a poor job of DOA; limits DOA to “within the antenna beam.”
Two phase centers allow “detecting” an endo‐clutter target, but DOA estimation for a single exo‐clutter target.
Three phase centers allow DOA estimation for an endo‐clutter target.
Additional phase centers allow nulling additional interfering signals; one additional interfering signal for each additional phase center.
Courtesy GlobalSecurity.org
J‐STARS – 3 phase centers
NGC VADER – 4 phase centersPhase centers are assumed to be linear in azimuth
Photo by Alan Radecki
For moving vehicles within the clutter band, any one pixel is a sum of both moving target energy, and stationary clutter energy.
This messes up the DOA measurement. While two antenna beams allows detection inside the clutter, target location is still inaccurate inside the clutter.
To facilitate good moving target location accuracy inside the clutter, we need three or more antenna phase centers (beams)
Endo-clutter moving target
How many antenna beams are enough?
64

10/24/2017
DRAFT 33
Target Elevation
65
More recently, there is an increasing need to distinguish slow‐moving targets “on the ground” from slow‐moving targets “just above the ground.”
This will require an ability to measure target elevation, likely via elevation DOA techniques similar to IFSAR/InSAR.
Also helps with topography effects.
Target Tracking
66
It is often not sufficient to know the location of all moving targets.
In particular, we often want to follow a particularmoving target,
or understand from where, and/or to where, those targets are moving, i.e. a time‐history.
This means ‘tracking’ those targets.
Courtesy Wikimedia.org
Need to follow

10/24/2017
DRAFT 34
Nonlinear Motion
67
Not all motion is translational.
Sometimes motion may be rotation, vibration, etc.
YouTube video courtesy Sterling Davis Photo
Moving Features
68
Vibrating vent
Wind turbines
Rotating antenna
Image Courtesy of General Atomics, ASI.
The motion information is in the sidelobes.

10/24/2017
DRAFT 35
Moving Features – Vibration & Rotation
69
Vibration and rotation involve alternating positive and negative line‐of‐sight velocities during a synthetic aperture.
These will tend to throw Doppler sidelobes in both directions.
Corner reflector on vibration apparatus
Image courtesy of University of New Mexico
Truck with engine running
SAR image Clutter cancelled
Moving Features – People
70
Golfer direct return
Golfer shadow
Golfer shadow
People generally can’t hold still enough to focus well. They tend to smear in Doppler even when standing still. However, their shadows don’t exhibit Doppler effects.
Golf putting green
Ka‐band
Golf bag
Person
Ku‐band

10/24/2017
DRAFT 36
Doppler
Rang
e (4
-inch
reso
lutio
n)
0 20 40 60 80 100 120 140 1600
0.01
0.02
0.03
0.04
0.05
0.06HRR Profile of a 2.5 Ton Truck
Range Bin [ 4 inches / bin ]
Po
we
r Truck Cab
Stakes
The unique ultra-fine range resolution allows High-Range-Resolution (HRR) Ground Moving Target Indication (GMTI). This allows exploiting vehicles’ unique range profiles for moving target discrimination and identification.
71
High‐Range‐Resolution (HRR) GMTI
UHRR Micro‐Doppler SignaturesFull UHRR Range/Doppler Image
UHRR Signature of 2.5 Ton Truck (4 inch range resolution)
Photograph of 2.5 Ton Truck
Radar returns from front axle lug nuts
Radar returns from dual rear axles
72

10/24/2017
DRAFT 37
Micro‐Doppler Motion Analysis
73
Micro‐Doppler analysis allows assessment of articulated motion, leading to classification and identification of target classes, activities, and state‐of‐health.
Courtesy Ancortek Inc.
Courtesy Ancortek Inc.
Tahmoush & Silvious, 2009
Motion Analysis
74
Google Project Soli
Virtual Tool Gestures
Images courtesy Google

10/24/2017
DRAFT 38
VideoSAR
75
Inverse‐SAR (ISAR)
76
It is possible to image moving targets.
This involves estimating and compensating for its motion, and essentially rendering only its micro‐Doppler energy.
Works best if there is minimal background clutter, as with ships, aircraft, spacecraft, etc. – but much more difficult for land vehicles, especially slow vehicles.
Courtesy General Atomics ASI, Inc.
Courtesy NASA
Courtesy Fraunhofer FHR

10/24/2017
DRAFT 39
Select References
• Performance Limits for Exo‐Clutter Ground Moving Target Indicator (GMTI) Radar
– Sandia National Laboratories Report SAND2010‐5844
77