introduction to financial statement analysis · 2017-12-26 · ©2017©2017 pearson pearson...
TRANSCRIPT
©2017 Pearson Education, Inc. ©2017 Pearson Education, Inc.
Corporate Finance The Core 4th Edition Berk SOLUTIONS MANUAL
Full download at:
https://testbankreal.com/download/corporate-finance-the-core-4th-edition-
berk-solutions-manual/
Corporate Finance The Core 4th Edition Berk TEST BANK
Full download at:
https://testbankreal.com/download/corporate-finance-the-core-4th-edition-
berk-test-bank/
Chapter 2
Introduction to Financial Statement
Analysis
2-1. What four financial statements can be found in a firm’s 10-K filing? What checks are there on
the accuracy of these statements?
In a firm’s 10-K filing, four financial statements can be found: the balance sheet, income statement,
statement of cash flows, and statement of stockholders’ equity. Financial statements in form 10-K are
required to be audited by a neutral third party, who checks and ensures that the financial statements are
prepared according to GAAP and that the information contained is reliable.
2-2. Who reads financial statements? List at least three different categories of people. For each
category, provide an example of the type of information they might be interested in and discuss
why.
Users of financial statements include present and potential investors, financial analysts, and other
interested outside parties (such as lenders, suppliers and other trade creditors, and customers).
Financial managers within the firm also use the financial statements when making financial decisions.
Investors. Investors are concerned with the risk inherent in, and return provided by, their investments.
Bondholders use the firm’s financial statements to assess the ability of the company to make its debt
payments. Stockholders use the statements to assess the firm’s profitability and ability to make future
dividend payments.
Financial analysts. Financial analysts gather financial information, analyze it, and make
recommendations. They read financial statements to determine a firm’s value and project future earnings,
so that they can provide guidance to businesses and individuals to help them with their investment
decisions.
Managers. Managers use financial statements to look at trends in their own business, and to compare
their own results with that of competitors.
2-3. Find the most recent financial statements for Starbucks’ corporation (SBUX) using the following
sources:
a. From the company’s Web site www.starbucks.com (Hint: Search for “investor relations.”)
b. From the SEC Web site www.sec.gov. (Hint: Search for company filings in the EDGAR
database.)
©2017 Pearson Education, Inc. ©2017 Pearson Education, Inc.
c. From the Yahoo! Finance Web site http://finance.yahoo.com.
d. From at least one other source. (Hint: Enter “SBUX 10K” at www.google.com.)
Each method will help find the same SEC filings. Yahoo! Finance also provides some analysis such as
charts and key statistics.
4

©2017 Pearson Education, Inc. ©2017 Pearson Education, Inc.
Chapter 2/Introduction to Financial Statement Analysis 5 5 Berk/DeMarzo, Corporate Finance, Fourth Edition
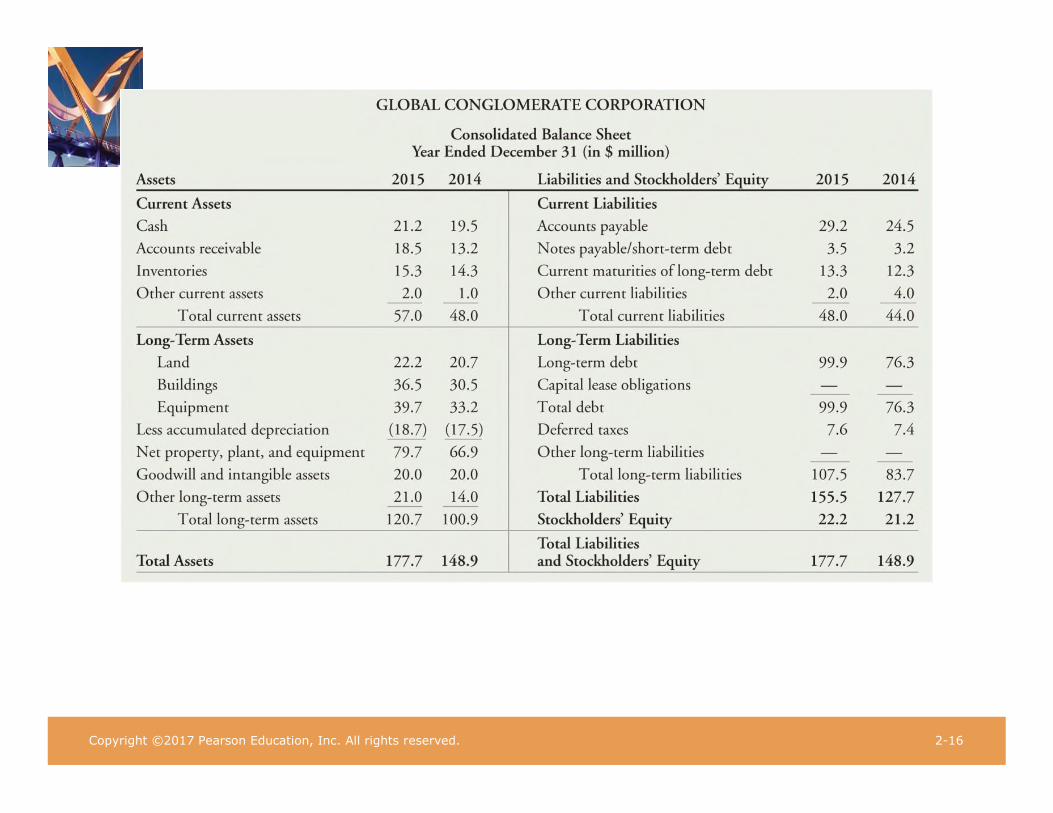
2-4. Consider the following potential events that might have taken place at Global Conglomerate on
December 30, 2015. For each one, indicate which line items in Global’s balance sheet would be
affected and by how much. Also indicate the change to Global’s book value of equity. (In all
cases, ignore any tax consequences for simplicity.)
a. Global used $20 million of its available cash to repay $20 million of its long-term debt.
b. A warehouse fire destroyed $5 million worth of uninsured inventory.
c. Global used $5 million in cash and $5 million in new long-term debt to purchase a $10
million building.
d. A large customer owing $3 million for products it already received declared bankruptcy,
leaving no possibility that Global would ever receive payment.
e. Global’s engineers discover a new manufacturing process that will cut the cost of its flagship product by over 50%.
f. A key competitor announces a radical new pricing policy that will drastically undercut Global’s prices.
a. Long-term liabilities would decrease by $20 million, and cash would decrease by the same
amount. The book value of equity would be unchanged.
b. Inventory would decrease by $5 million, as would the book value of equity.
c. Long-term assets would increase by $10 million, cash would decrease by $5 million, and long-
term liabilities would increase by $5 million. There would be no change to the book value of equity.
d. Accounts receivable would decrease by $3 million, as would the book value of equity.
e. This event would not affect the balance sheet.
f. This event would not affect the balance sheet.
2-5. What was the change in Global Conglomerate’s book value of equity from 2014 to 2015
according to Table 2.1? Does this imply that the market price of Global’s shares increased in 2015? Explain.
Global Conglomerate’s book value of equity increased by $1 million from 2014 to 2015. An increase
in book value does not necessarily indicate an increase in Global’s share price. The market value of a
stock does not depend on the historical cost of the firm’s assets, but on investors’ expectation of the
firm’s future performance. There are many events that may affect Global’s future profitability, and hence
its share price, that do not show up on the balance sheet.
2-6. Use EDGAR to find Qualcomm’s 10-K filing for 2015. From the balance sheet, answer the
following questions:
a. How much did Qualcomm have in cash and short-term investments?
b. What were Qualcomm’s total accounts receivable?
c. What were Qualcomm’s total assets?
d. What were Qualcomm’s total liabilities? How much of this was long-term debt?
e. What was the book value of Qualcomm’s equity?
a. $7,560 million (cash) and $9,761 million (short-term investments/marketable securities) for a total of $17,321 million
b. $1,964 million
c. $50,796 million
©2017 Pearson Education, Inc. ©2017 Pearson Education, Inc.
Chapter 2/Introduction to Financial Statement Analysis 6 6 Berk/DeMarzo, Corporate Finance, Fourth Edition
d. $19,382 million, $9,969 million.
e. $31,414 million.
2-7. Find online the annual 10-K report for Costco Wholesale Corporation (COST) for fiscal year
2015 (filed in October 2015). Answer the following questions from their balance sheet:
a. How much cash did Costco have at the end of the fiscal year?
b. What were Costco’s total assets?
c. What were Costco’s total liabilities? How much debt did Costco have?
d. What was the book value of Costco’s equity?
a. At the end of the fiscal year, Costco had cash and cash equivalents of $4,801 million.
b. Costco’s total assets were $33,440 million.
c. Costco’s total liabilities were $22,597 million, and it had $6,157 million in debt.
d. The book value of Costco’s equity was $10,843 million.
2-8. In early 2012, General Electric (GE) had a book value of equity of $116 billion, 10.6 billion
shares outstanding, and a market price of $17 per share. GE also had cash of $84 billion, and
total debt of $410 billion. Three years later, in early 2015, GE had a book value of equity of $128
billion, 10.0 billion shares outstanding with a market price of $25 per share, cash of $85 billion,
and total debt of $302 billion. Over this period, what was the change in GE’s:
a. market capitalization?
b. market-to-book ratio?
c. enterprise value?
a. 2012 Market Capitalization: 10.6 billion shares × $17/share = $180.2. 2015 Market Capitalization:
10.0 billion shares × $25/share = $250. The change over the period is $250 – $180.2 = $69.8 billion.
b. 2012 Market-to-Book = 180.2/116 = 1.55. 2015 Market-to-Book = 250/128 = 1.95. The change over the period is: 1.95 – 1.55 = 0.40.
e. 2012 Enterprise Value = $180.2 – 84 + 410 = $506.2 billion. 2015 Enterprise Value = $250 – 85 + 302 = $467 billion. The change over the period is: $467 – $506.2 = –$39.2 billion.
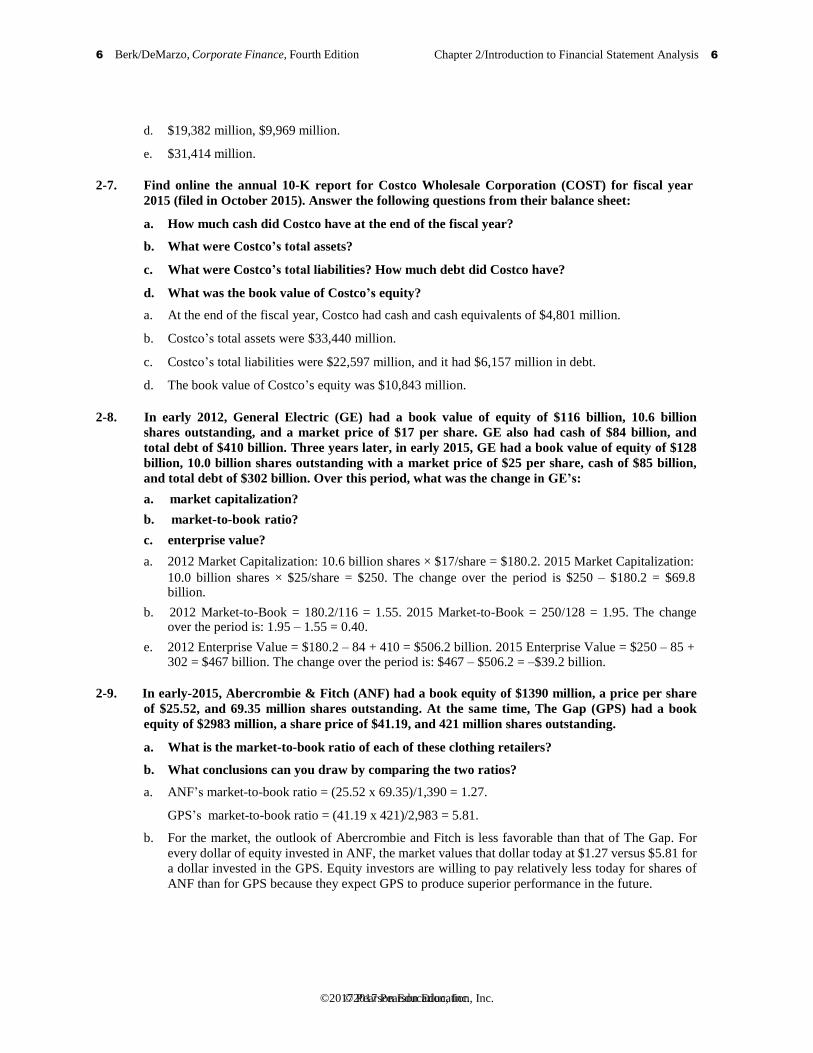
2-9. In early-2015, Abercrombie & Fitch (ANF) had a book equity of $1390 million, a price per share
of $25.52, and 69.35 million shares outstanding. At the same time, The Gap (GPS) had a book
equity of $2983 million, a share price of $41.19, and 421 million shares outstanding.
a. What is the market-to-book ratio of each of these clothing retailers?
b. What conclusions can you draw by comparing the two ratios?
a. ANF’s market-to-book ratio = (25.52 x 69.35)/1,390 = 1.27.
GPS’s market-to-book ratio = (41.19 x 421)/2,983 = 5.81.
b. For the market, the outlook of Abercrombie and Fitch is less favorable than that of The Gap. For
every dollar of equity invested in ANF, the market values that dollar today at $1.27 versus $5.81 for
a dollar invested in the GPS. Equity investors are willing to pay relatively less today for shares of
ANF than for GPS because they expect GPS to produce superior performance in the future.
©2017 Pearson Education, Inc. ©2017 Pearson Education, Inc.
Chapter 2/Introduction to Financial Statement Analysis 7 7 Berk/DeMarzo, Corporate Finance, Fourth Edition
Earnings per share $0.33 $0.05 $0.11 $0.23 $0.39
Assets
Cash
48.8
68.9
86.3
77.5
85.0
Total Current Assets 171.1 169.6 184.5 186.1 206.4
Net Property, Plant & Equip. 245.3 243.3 309.0 345.6 347.0
Total Assets 778.1 774.6 855.2 893.4 915.1
Liabilities & Stockholders' Equity
Accounts Payable
18.7
17.9
22.0
26.8
31.7
Total Current Liabilities 25.4 24.3 29.0 34.9 41.4
Long-term Debt 500.0 500.0 575.0 600.0 600.0
Total Liabilities 525.4 524.3 604.0 634.9 641.4
Stockholders' Equity 252.7 250.3 251.2 258.5 273.7
Total Liabilities & Stockholders' Equity
778.1 774.6 855.2 893.4 915.1
Cash from Operations 48.5 50.5 47.8 46.6 54.0
Capital Expenditures (25.0) (25.0) (100.0) (75.0) (40.0)
Cash from Investing Activities (25.0) 25.0) (100.0) (75.0) (40.0)
Dividends Paid (5.4) (5.4) (5.4) (5.4) (6.5)
Cash from Financing Activities (5.4) (5.4) 69.6 19.6 (6.5)
Mydeco Stock Price $7.92 $3.30 $5.25 $8.71 $10.89
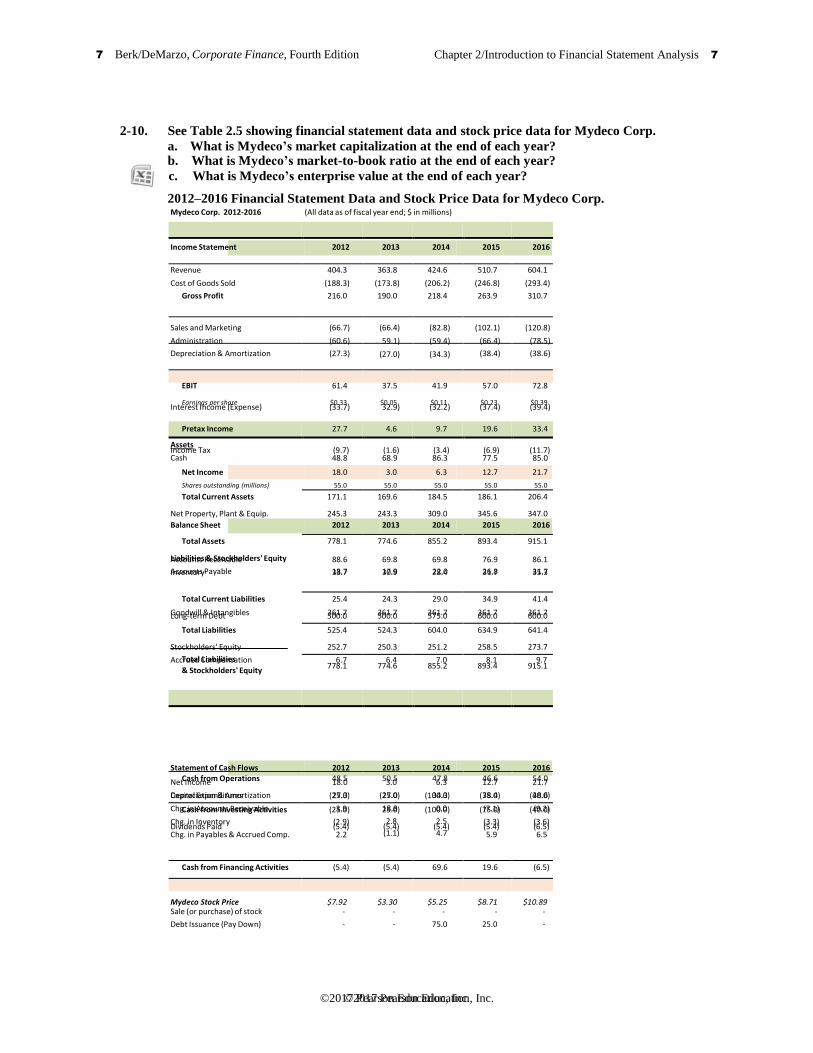
2-10. See Table 2.5 showing financial statement data and stock price data for Mydeco Corp.
a. What is Mydeco’s market capitalization at the end of each year? b. What is Mydeco’s market-to-book ratio at the end of each year?
c. What is Mydeco’s enterprise value at the end of each year?
2012–2016 Financial Statement Data and Stock Price Data for Mydeco Corp. Mydeco Corp. 2012-2016 (All data as of fiscal year end; $ in millions)
Income Statement 2012 2013 2014 2015 2016
Revenue
Cost of Goods Sold
Gross Profit
404.3 363.8 424.6
(188.3) (173.8) (206.2)
216.0 190.0 218.4
510.7 604.1
(246.8) (293.4)
263.9 310.7
Sales and Marketing
Administration
Depreciation & Amortization
(66.7)
(60.6)
(27.3)
(66.4) (82.8)
59.1) (59.4)
(27.0) (34.3)
(102.1) (120.8)
(66.4) (78.5)
(38.4) (38.6)
EBIT 61.4 37.5 41.9 57.0 72.8
Interest Income (Expense) (33.7) 32.9) (32.2) (37.4) (39.4)
Pretax Income 27.7 4.6 9.7 19.6 33.4
Income Tax (9.7) (1.6) (3.4) (6.9) (11.7)
Net Income
Shares outstanding (millions)
18.0
55.0
3.0 6.3
55.0 55.0
12.7
55.0
21.7
55.0
Balance Sheet 2012 2013 2014 2015 2016
Accounts Receivable
Inventory
88.6
33.7
69.8 69.8
30.9 28.4
76.9
31.7
86.1
35.3
Goodwill & Intangibles 361.7 361.7 361.7 361.7 361.7
Accrued Compensation 6.7 6.4 7.0 8.1 9.7
Statement of Cash Flows
Net Income
Depreciation & Amortization
Chg. in Accounts Receivable
Chg. in Inventory
Chg. in Payables & Accrued Comp.
2012
18.0
27.3
3.9
(2.9)
2.2
2013 2014
3.0 6.3
27.0 34.3
18.8 0.0
2.8 2.5
(1.1) 4.7
2015
12.7
38.4
(7.1)
(3.3)
5.9
2016
21.7
38.6
(9.2)
(3.6)
6.5
Sale (or purchase) of stock
Debt Issuance (Pay Down)
-
-
- -
- 75.0
-
25.0
-
-
©2017 Pearson Education, Inc. ©2017 Pearson Education, Inc.
Chapter 2/Introduction to Financial Statement Analysis 8 8 Berk/DeMarzo, Corporate Finance, Fourth Edition
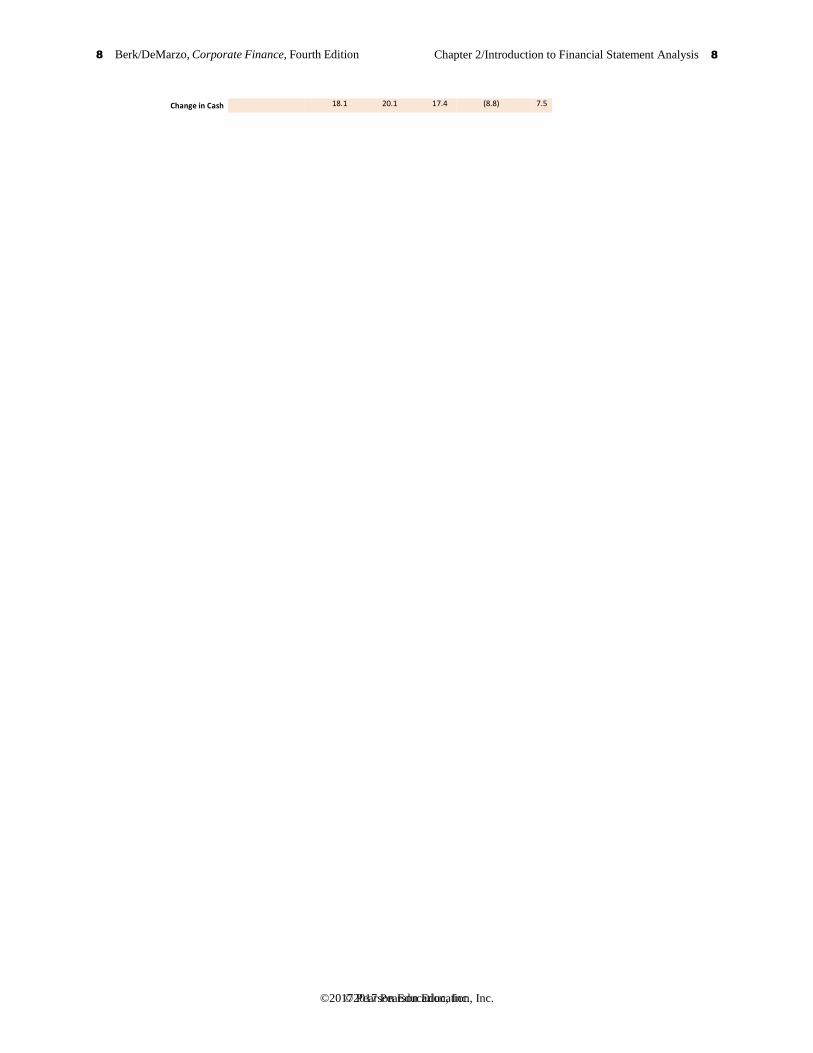
Change in Cash 18.1 20.1 17.4 (8.8) 7.5

©2017 Pearson Education, Inc. ©2017 Pearson Education, Inc.
Chapter 2/Introduction to Financial Statement Analysis 9 9 Berk/DeMarzo, Corporate Finance, Fourth Edition
a. Year
2012
2013
2014
2015
2016
Market Capitalization (millions) $435.60 $181.50 $288.75 $479.05 $598.95
b.
Year
2012
2013
2014
2015
2016
Market-to-book 1.72 0.73 1.15 1.85 2.19
c. Year
2012
2013
2014
2015
2016
Enterprise Value 886.80 612.60 777.45 1,001.55 1,113.95
Shares Outstanding (millions)
Mydeco Stock Price
55.0
$7.92
55.0 55.0
$3.30 $5.25
55.0
$8.71
55.0
$10.89
Market Capitalization (millions)
Stockholders' Equity
$435.60
252.7
$181.50 $288.75 $479.05
250.3 251.2 258.5
$598.95
273.7
Market Capitalization (millions) $435.60 $181.50 $288.75 $479.05 $598.95
Cash 48.8 68.9 86.3 77.5 85.0
Long-term Debt 500.0 500.0 575.0 600.0 600.0
2-11. Suppose that in 2016, Global launches an aggressive marketing campaign that boosts sales by 15%. However, their operating margin falls from 5.57% to 4.50%. Suppose that they have no other income, interest expenses are unchanged, and taxes are the same percentage of pretax
income as in 2015.
a. What is Global’s EBIT in 2016?
b. What is Global’s net income in 2016?
c. If Global’s P/E ratio and number of shares outstanding remains unchanged, what is Global’s
share price in 2016?
a. Revenues in 2016 = 1.15 × 186.7 = $214.705 million.
EBIT = 4.50% × 214.705 = $9.66 million (there is no other income).
b Net Income = EBIT – Interest Expenses – Taxes = (9.66 – 7.7) × (1 – 26%) = $1.45 million.
c. Share price = (P/E Ratio in 20015) x (EPS in 2016) = 25.2 x (1.45/3.6) = $10.15.
Note: Differences from spreadsheet solutions due to rounding.
2-12. Find online the annual 10-K report for Costco Wholesale Corporation (COST) for fiscal year
2015 (filed in October 2015). Answer the following questions from their income statement:
a. What were Costco's revenues for fiscal year 2015? By what percentage did revenues grow from the prior year?
b. What was Costco's operating income for the fiscal year?
c. What was Costco's average tax rate for the year?
d. What were Costco's diluted earnings per share in fiscal year 2015? What number of shares
is this EPS based on?
a. Revenues = $116,199 million. Revenue growth = (116,199/112,640) – 1 = 3.16%.
b. Operating Income = $3,624 million.
c. Average tax rate = 1,195/3,604 = 33.16%.
d The diluted earnings per share in 2015 was $5.37. The number of shares used in this calculation of diluted EPS was 442.72 million.
©2017 Pearson Education, Inc. ©2017 Pearson Education, Inc.
Chapter 2/Introduction to Financial Statement Analysis 9 9 Berk/DeMarzo, Corporate Finance, Fourth Edition
Revenue growth -10.02% 16.71% 20.28% 18.29%
b. Year
2012
2013
2014
2015
2016
Net Income growth -83.33% 110.00% 101.59% 70.87%
Year 2013 2014 2015 2016
New Net Income 3.0 3.7 10.1 19.1
Year 2012 2013 2014 2015 2016
New EPS $0.33 $0.29 $0.34 $0.41 $0.49
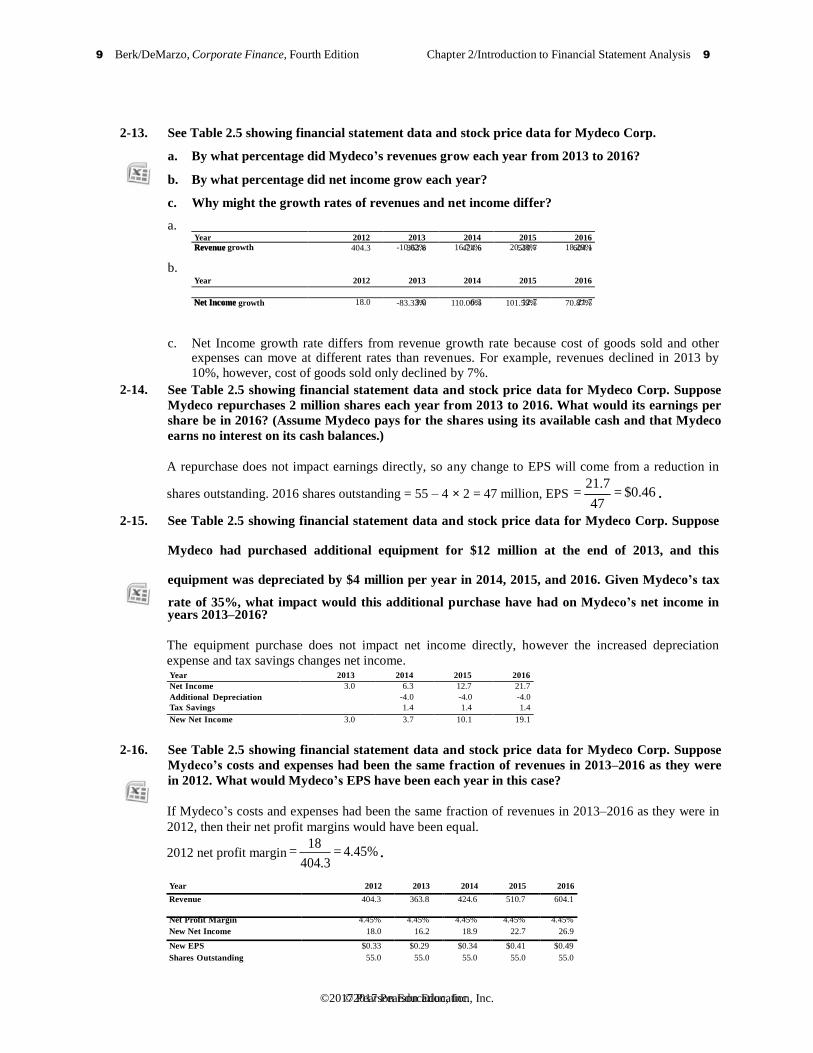
2-13. See Table 2.5 showing financial statement data and stock price data for Mydeco Corp.
a. By what percentage did Mydeco’s revenues grow each year from 2013 to 2016?
b. By what percentage did net income grow each year?
c. Why might the growth rates of revenues and net income differ?
a.Year
Revenue
2012
404.3
2013
363.8
2014 2015 2016
424.6 510.7 604.1
Net Income 18.0 3.0 6.3 12.7 21.7
c. Net Income growth rate differs from revenue growth rate because cost of goods sold and other
expenses can move at different rates than revenues. For example, revenues declined in 2013 by
10%, however, cost of goods sold only declined by 7%.
2-14. See Table 2.5 showing financial statement data and stock price data for Mydeco Corp. Suppose
Mydeco repurchases 2 million shares each year from 2013 to 2016. What would its earnings per
share be in 2016? (Assume Mydeco pays for the shares using its available cash and that Mydeco
earns no interest on its cash balances.)
A repurchase does not impact earnings directly, so any change to EPS will come from a reduction in
shares outstanding. 2016 shares outstanding = 55 – 4 × 2 = 47 million, EPS = 21.7
= $0.46 . 47
2-15. See Table 2.5 showing financial statement data and stock price data for Mydeco Corp. Suppose
Mydeco had purchased additional equipment for $12 million at the end of 2013, and this
equipment was depreciated by $4 million per year in 2014, 2015, and 2016. Given Mydeco’s tax
rate of 35%, what impact would this additional purchase have had on Mydeco’s net income in years 2013–2016?
The equipment purchase does not impact net income directly, however the increased depreciation
expense and tax savings changes net income.
Net Income
Additional Depreciation
Tax Savings
3.0 6.3
-4.0
1.4
12.7 21.7
-4.0 -4.0
1.4 1.4
2-16. See Table 2.5 showing financial statement data and stock price data for Mydeco Corp. Suppose
Mydeco’s costs and expenses had been the same fraction of revenues in 2013–2016 as they were
in 2012. What would Mydeco’s EPS have been each year in this case?
If Mydeco’s costs and expenses had been the same fraction of revenues in 2013–2016 as they were in
2012, then their net profit margins would have been equal.
2012 net profit margin = 18
404.3
= 4.45% .
Revenue 404.3 363.8 424.6 510.7 604.1
Net Profit Margin
New Net Income
4.45% 4.45%
18.0 16.2
4.45% 4.45%
18.9 22.7
4.45%
26.9
Shares Outstanding 55.0 55.0 55.0 55.0 55.0

©2017 Pearson Education, Inc. ©2017 Pearson Education, Inc.
Chapter 2/Introduction to Financial Statement Analysis 10 10 Berk/DeMarzo, Corporate Finance, Fourth Edition
2-17. Suppose a firm’s tax rate is 35%.
a. What effect would a $10 million operating expense have on this year’s earnings? What effect
would it have on next year’s earnings? b. What effect would a $10 million capital expense have on this year’s earnings if the capital is
depreciated at a rate of $2 million per year for five years? What effect would it have on next year’s earnings?
a. A $10 million operating expense would be immediately expensed, increasing operating expenses
by $10 million. This would lead to a reduction in taxes of 35% × $10 million = $3.5 million. Thus,
earnings would decline by 10 – 3.5 = $6.5 million. There would be no effect on next year’s earnings.
b. Capital expenses do not affect earnings directly. However, the depreciation of $2 million would
appear each year as an operating expense. With a reduction in taxes of 2 × 35% = $0.7 million,
earnings would be lower by 2 – 0.7 = $1.3 million for each of the next 5 years.
2-18. Quisco Systems has 6.5 billion shares outstanding and a share price of $18. Quisco is considering
developing a new networking product in house at a cost of $500 million. Alternatively, Quisco
can acquire a firm that already has the technology for $900 million worth (at the current price)
of Quisco stock. Suppose that absent the expense of the new technology, Quisco will have EPS of
$0.80.
a. Suppose Quisco develops the product in house. What impact would the development cost
have on Quisco’s EPS? Assume all costs are incurred this year and are treated as an R&D
expense, Quisco’s tax rate is 35%, and the number of shares outstanding is unchanged.
b. Suppose Quisco does not develop the product in house but instead acquires the technology. What effect would the acquisition have on Quisco’s EPS this year? (Note that acquisition expenses do not appear directly on the income statement. Assume the firm was acquired at the start of the year and has no revenues or expenses of its own, so that the only effect on EPS is due to the change in the number of shares outstanding.)
c. Which method of acquiring the technology has a smaller impact on earnings? Is this method
cheaper? Explain.
a. If Quisco develops the product in-house, its earnings would fall by $500 × (1 – 35%) = $325million. With no change to the number of shares outstanding, its EPS would decrease by
$0.05 = $325 6500
to $0.75. (Assume the new product would not change this year’s revenues.)
b If Quisco acquires the technology for $900 million worth of its stock, it will issue $900/18 = 50 million new shares. Since earnings without this transaction are $0.80 × 6.5 billion = $5.2 billion,
5.2its EPS with the purchase is
6.55 = $0.794 .
c. Acquiring the technology would have a smaller impact on earnings, but this
method is not
cheaper. Developing it in-house is less costly and provides an immediate tax benefit. The earningsimpact is not a good measure of the expense. In addition, note that because the acquisition
permanently increases the number of shares outstanding, it will reduce Quisco’s earnings per share
in future years as well.
2-19. Find online the annual 10-K report for Costco Wholesale Corporation (COST) for fiscal year 2015 (filed in October 2015). Answer the following questions from their cash flow statement:
©2017 Pearson Education, Inc. ©2017 Pearson Education, Inc.
Chapter 2/Introduction to Financial Statement Analysis 11 11 Berk/DeMarzo, Corporate Finance, Fourth Edition
a. How much cash did Costco generate from operating activities in fiscal year 2015?
b. What was Costco depreciation and amortization expense?
c. How much cash was invested in new property and equipment (net of any sales)?

©2017 Pearson Education, Inc. ©2017 Pearson Education, Inc.
Chapter 2/Introduction to Financial Statement Analysis 12 12 Berk/DeMarzo, Corporate Finance, Fourth Edition
d. How much did Costco raise from the sale of shares of its stock (net of any purchases)?
a. Net cash provided by operating activities was $4,285 million in fiscal year 2015.
b. Depreciation and amortization expenses were $1,127 million.
c. Net cash used in capital expenditures for property and equipment was $2,393 million.
d. Costco raised nothing from the sale of shares of its stock, while it spent $481 million on the
purchase of common stock. Costco raised –$481 million from the sale of its shares of stock (net of
any purchases).
2-20.
2-21.
See Table 2.5 showing financial statement data and stock price data for Mydeco Corp.
a. From 2012 to 2016, what was the total cash flow from operations that Mydeco generated?
b. What fraction of the total in (a) was spent on capital expenditures?
c. What fraction of the total in (a) was spent paying dividends to shareholders?
d. What was Mydeco’s total retained earnings for this period?
a. Total cash flow from operations = 48.5 + 50.5 + 47.8 + 46.6 + 54 = $247.4 million.
b. Total fraction spent on capital expenditures = (25 + 25 + 100 + 75 + 40)/247.4 = 107.1%.
c. Total fraction spent on dividends = (5.4 × 4 + 6.5)/247.4 = 11.4%.
d. Retained earnings = Net Income – Dividends = (18 + 3 + 6.3 + 12.7 + 21.7) – (5.4 × 4 + 6.5) = $33.6 million.
See Table 2.5 showing financial statement data and stock price data for Mydeco Corp.
a. In what year was Mydeco’s net income the lowest?
b. In what year did Mydeco need to reduce its cash reserves?
c. Why did Mydeco need to reduce its cash reserves in a year when net income was reasonably
high?
a. In 2013 (net income was $3 million).
b. 2015 (cash was reduced from 86.3 to 77.5).
c. Mydeco needed to reduce cash (it also issued debt) to pay for large capital expenditures in 2014 and 2015. In addition, even though net income was reasonably high, cash from operations was atthe lowest amount inventories.
in the five-year period due to a reduction in accounts receivable and
2-22. See Table 2.5 showing financial statement data and stock price data for Mydeco Corp. Use the
data from the balance sheet and cash flow statement in 2012 to determine the following:
a. How much cash did Mydeco have at the end of 2011?
b. What were Mydeco’s accounts receivable and inventory at the end of 2011?
c. What were Mydeco’s total liabilities at the end of 2011?
d. Assuming goodwill and intangibles were equal in 2011 and 2012, what was Mydeco’s net
property, plant, and equipment at the end of 2011?
a. 2011 Cash = 2012 Cash – 2012 Change in Cash = 48.8 – 18.1 = $30.7 million.
b. 2011 Accounts Receivable = 88.6 + 3.9 = $92.5 million.
2011 Inventory = 33.7 - 2.9 = 30.8 million
c. 2011 Total Liabilities = 525.4 – 2.2 = $523.2 million.
d. 2011
property, plant, and equipment = 2012
property, plant, and equipment – 2012
capital

©2017 Pearson Education, Inc. ©2017 Pearson Education, Inc.
Chapter 2/Introduction to Financial Statement Analysis 13 13 Berk/DeMarzo, Corporate Finance, Fourth Edition
expenditures + 2012 depreciation = 245.3 – 25 + 27.3 = $247.6 million
©2017 Pearson Education, Inc. ©2017 Pearson Education, Inc.
Chapter 2/Introduction to Financial Statement Analysis 14 14 Berk/DeMarzo, Corporate Finance, Fourth Edition
Year 2012 2013 2014 2015 2016
Retained Earnings 12.6 -2.4 0.9 7.3 15.2
2-23. Can a firm with positive net income run out of cash? Explain.
A firm can have positive net income but still run out of cash. For example, to expand its current
production, a profitable company may spend more on investment activities than it generates from
operating activities and financing activities. Net cash flow for that period would be negative, although
its net income is positive. It could also run out of cash if it spends a lot on financing activities, perhaps
by paying off other maturing long-term debt, repurchasing shares, or paying dividends.
2-24. Suppose your firm receives a $5 million order on the last day of the year. You fill the order with
$2 million worth of inventory. The customer picks up the entire order the same day and pays $1
million upfront in cash; you also issue a bill for the customer to pay the remaining balance of $4
million in 30 days. Suppose your firm’s tax rate is 0% (i.e., ignore taxes). Determine the
consequences of this transaction for each of the following:
a. Revenues
b. Earnings
c. Receivables
d. Inventory
e. Cash
a. Revenues: increase by $5 million
b. Earnings: increase by $3 million
c. Receivables: increase by $4 million
d. Inventory: decrease by $2 million
e. Cash: increase by $3 million (earnings) – $4 million (receivables) + $2 million (inventory) = $1 million (cash).
2-25. Nokela Industries purchases a $40 million cyclo-converter. The cyclo-converter will be
depreciated by $10 million per year over four years, starting this year. Suppose Nokela’s tax rate
is 40%.
a. What impact will the cost of the purchase have on earnings for each of the next four years?
b. What impact will the cost of the purchase have on the firm’s cash flow for the next four years?
a. Earnings for the next four years would have to deduct the depreciation expense. After taxes, this
would lead to a decline of 10 × (1 – 40%) = $6 million each year for the next four years.
b. Cash flow for the next four years: less $36 million (–6 + 10 – 40) this year, and add $4 million
(–6 +10) for the three following years.
2-26. See Table 2.5 showing financial statement data and stock price data for Mydeco Corp.
a. What were Mydeco’s retained earnings each year?
b. Using the data from 2012, what was Mydeco’s total stockholders’ equity in 2011?
a. Retained earnings = Net Income – Dividends Paid
Net Income 18.0 3.0 6.3 12.7 21.7
Dividends Paid 5.4 5.4 5.4 5.4 6.5
b. 2011 stockholders’ equity = 2012 stockholders’ equity – 2012 retained earnings = 252.7 – 12.6 =
$240.1 million.

©2017 Pearson Education, Inc. ©2017 Pearson Education, Inc.
Chapter 2/Introduction to Financial Statement Analysis 15 15 Berk/DeMarzo, Corporate Finance, Fourth Edition
a.
Year 2012 2013 2014 2015 2016
Gross Margin 53.43% 52.23% 51.44% 51.67% 51.43%
Year 2012 2016
Net Profit Margin 4.45% 3.59%
2-27. Find online the annual 10-K report for Costco Wholesale Corporation (COST) for fiscal year
2015 (filed in October 2015). Answer the following questions from the notes to their financial statements:
a. How many stores did Costco open outside of the U.S. in 2015?
b. What property does Costco lease? What are the minimum lease payments due in 2016?
c. What was Costco’s worldwide member renewal rate for 2015? What proportion of Costco
cardholders had Gold Star memberships in 2015?
d. What fraction of Costco’s 2015 sales came from gas stations, pharmacy, food court, and optical? What fraction came from apparel and small appliances?
a. Costco opened 11 stores outside of the U.S. in 2015.
b. Costco leases land and/or buildings at warehouses and certain other office and distribution facilities. The minimum lease payments due in 2016 are $211 million.
c. Costco had a worldwide member renewal rate of 88% for 2015. 34,000/81,300 = 42% of Costco cardholders had Gold Star memberships in 2015.
d. 16% of Costco’s 2015 sales came from gas stations, pharmacy, food court, and optical. 11% of
Costco’s 2015 sales came from apparel and small appliances.
2-28. See Table 2.5 showing financial statement data and stock price data for Mydeco Corp.
a. What were Mydeco’s gross margins each year?
b. Comparing Mydeco’s gross margin, EBIT margin, and net profit margin in 2012 and 2016, which margins improved?
Revenue 404.3 363.8 424.6 510.7 604.1 Gross Profit 216.0 190.0 218.4 263.9 310.7
b. None of the margins improved from 2012 to 2016
Revenue 404.3 604.1
Gross Profit 216.0 310.7
EBIT 61.4 72.8
Net Income 18.0 21.7
Gross Margin 53.43% 51.43%
EBIT Margin 15.19% 12.05%
2-29. For fiscal year end 2015, Walmart Stores, Inc. (WMT) had revenue of $485.65 billion, gross
profit of $120.57 billion, and net income of $16.36 billion. Costco Wholesale Corporation (COST)
had revenue of $116.20 billion, gross profit of $15.13 billion, and net income of $2.38 billion.
a. Compare the gross margins for Walmart and Costco.
b. Compare the net profit margins for Walmart and Costco.
c. Which firm was more profitable in 2015?
a. Walmart’s gross margin = 120.57/485.65 = 24.83%; Costco’s gross margin = 15.13/116.20 =
13.02%.
b. Walmart’s net margin = 16.36/485.65 = 3.37%; Costco’s net margin = 2.38/116.20 = 2.05%.
c. Walmart was more profitable in 2015.
©2017 Pearson Education, Inc. ©2017 Pearson Education, Inc.
Chapter 2/Introduction to Financial Statement Analysis 16 16 Berk/DeMarzo, Corporate Finance, Fourth Edition
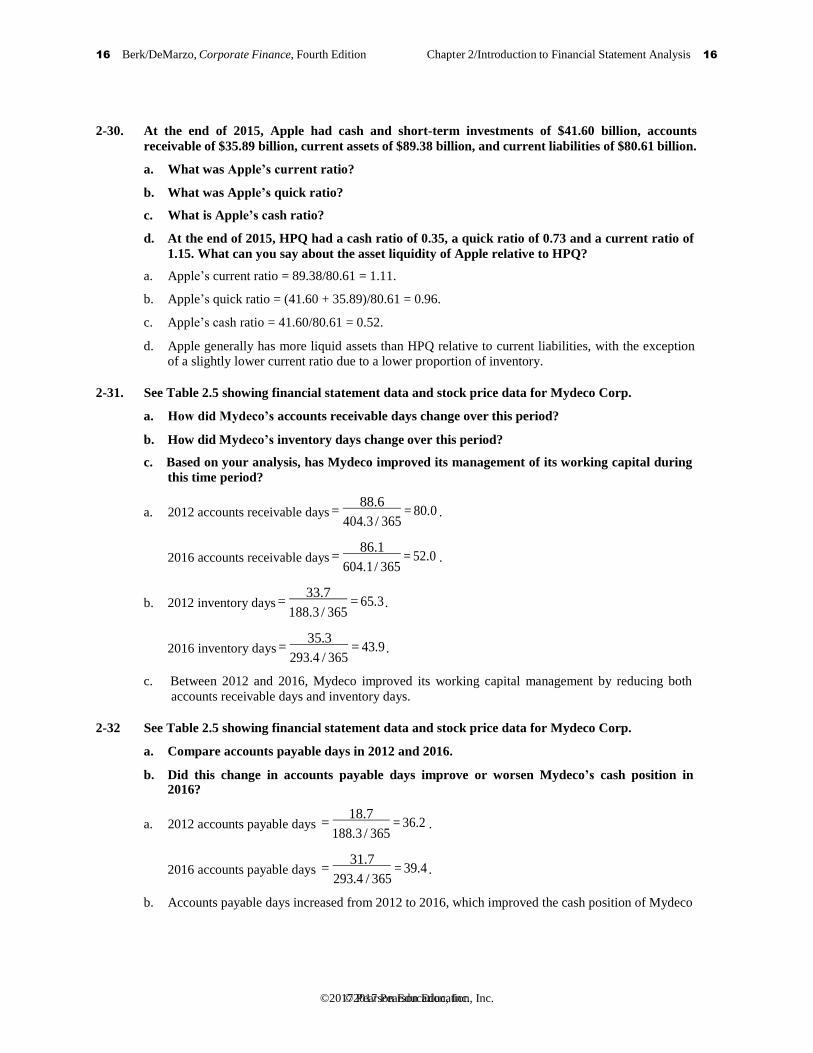
2-30. At the end of 2015, Apple had cash and short-term investments of $41.60 billion, accounts
receivable of $35.89 billion, current assets of $89.38 billion, and current liabilities of $80.61 billion.
a. What was Apple’s current ratio?
b. What was Apple’s quick ratio?
c. What is Apple’s cash ratio?
d. At the end of 2015, HPQ had a cash ratio of 0.35, a quick ratio of 0.73 and a current ratio of
1.15. What can you say about the asset liquidity of Apple relative to HPQ?
a. Apple’s current ratio = 89.38/80.61 = 1.11.
b. Apple’s quick ratio = (41.60 + 35.89)/80.61 = 0.96.
c. Apple’s cash ratio = 41.60/80.61 = 0.52.
d. Apple generally has more liquid assets than HPQ relative to current liabilities, with the exception
of a slightly lower current ratio due to a lower proportion of inventory.
2-31. See Table 2.5 showing financial statement data and stock price data for Mydeco Corp.
a. How did Mydeco’s accounts receivable days change over this period?
b. How did Mydeco’s inventory days change over this period?
c. Based on your analysis, has Mydeco improved its management of its working capital during
this time period?
a. 2012 accounts receivable days = 88.6
= 80.0 . 404.3 / 365
2016 accounts receivable days = 86.1
= 52.0 . 604.1 / 365
b. 2012 inventory days = 33.7
= 65.3 . 188.3 / 365
2016 inventory days = 35.3
= 43.9 . 293.4 / 365
c. Between 2012 and 2016, Mydeco improved its working capital management by reducing both
accounts receivable days and inventory days.
2-32 See Table 2.5 showing financial statement data and stock price data for Mydeco Corp.
a. Compare accounts payable days in 2012 and 2016.
b. Did this change in accounts payable days improve or worsen Mydeco’s cash position in 2016?
a. 2012 accounts payable days = 18.7
= 36.2 . 188.3 / 365
2016 accounts payable days = 31.7
= 39.4 . 293.4 / 365
b. Accounts payable days increased from 2012 to 2016, which improved the cash position of Mydeco

©2017 Pearson Education, Inc. ©2017 Pearson Education, Inc.
Chapter 2/Introduction to Financial Statement Analysis 17 17 Berk/DeMarzo, Corporate Finance, Fourth Edition
2-33. See Table 2.5 showing financial statement data and stock price data for Mydeco Corp.
a. By how much did Mydeco increase its debt from 2012 to 2016?
b. What was Mydeco’s EBITDA/Interest coverage ratio in 2012 and 2016? Did its coverage
ratio ever fall below 2?
c. Overall, did Mydeco’s ability to meet its interest payments improve or decline over this period?
a. Mydeco increased its debt from $500 million in 2012 to $600 million in 2016 (by $100 million).
b. 2012 EBITDA/Interest coverage ratio = 61.4 + 27.3
= 2.6 . 33.7
2016 EBITDA/Interest coverage ratio = 72.8 + 38.6
= 2.8 . 39.4
Mydeco’s coverage ratio fell below 2 in 2013, where it was 1.96.
c. Overall Mydeco’s ability to meet its interest payments improved over this period, although it
experienced a slight dip in 2013.
2-34. See Table 2.5 showing financial statement data and stock price data for Mydeco Corp.
a. How did Mydeco’s book debt-equity ratio change from 2012 to 2016?
b. How did Mydeco’s market debt-equity ratio change from 2012 to 2016?
c. Compute Mydeco’s debt-to-enterprise value ratio to assess how the fraction of its business
that is debt financed has changed over the period.
a. 2012 book debt-equity ratio = 500
= 1.98 . 252.7
2016 book debt-equity ratio = 600
= 2.19 . 273.7
b. 2012 market debt-equity ratio = 500
= 1.15 . 435.6
2016 market debt-equity ratio = 600
= 1.00 . 599.0
c. 2012 debt-enterprise value ratio = 500
= 0.56 . 886.8
2016 debt-enterprise value ratio = 600
= 0.54 . 1113
2-35. Use the data in Problem 8 to determine the change, from 2012 to 2015, in GE’s
a. book debt-equity ratio?
b. market debt-equity ratio?
a. 2012 book debt-equity ratio = 410/116 = 3.53.
2015 book debt-equity ratio = 302/128 = 2.36
b. 2012 market debt-equity ratio = 410/(17 x 10.6) = 2.28.

©2017 Pearson Education, Inc. ©2017 Pearson Education, Inc.
Chapter 2/Introduction to Financial Statement Analysis 18 18 Berk/DeMarzo, Corporate Finance, Fourth Edition
2015 market debt-equity ratio = 302/(25 x 10) = 1.21.
©2017 Pearson Education, Inc. ©2017 Pearson Education, Inc.
Chapter 2/Introduction to Financial Statement Analysis 19 19 Berk/DeMarzo, Corporate Finance, Fourth Edition
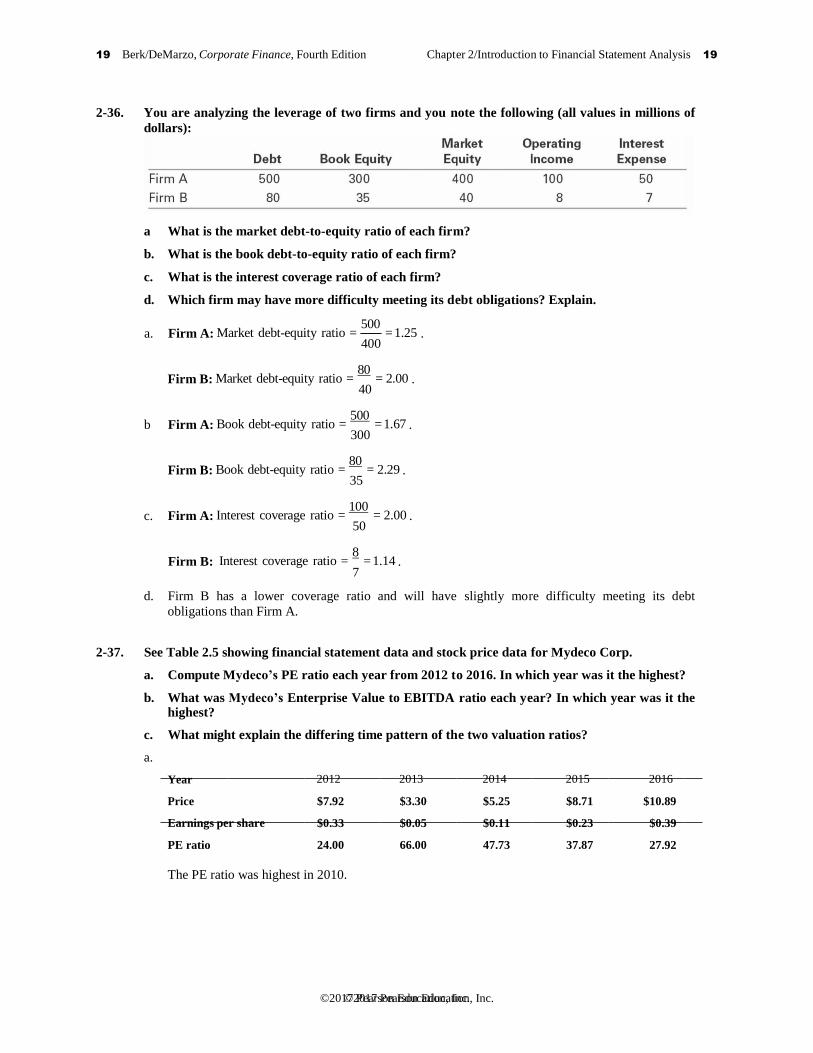
2-36. You are analyzing the leverage of two firms and you note the following (all values in millions of
dollars):
a What is the market debt-to-equity ratio of each firm?
b. What is the book debt-to-equity ratio of each firm?
c. What is the interest coverage ratio of each firm?
d. Which firm may have more difficulty meeting its debt obligations? Explain.
a. Firm A: Market debt-equity ratio = 500
= 1.25 . 400
Firm B: Market debt-equity ratio = 80
= 2.00 . 40
b Firm A: Book debt-equity ratio = 500
= 1.67 . 300
Firm B: Book debt-equity ratio = 80
= 2.29 . 35
c. Firm A: Interest coverage ratio = 100
= 2.00 . 50
Firm B: Interest coverage ratio = 8
= 1.14 . 7
d. Firm B has a lower coverage ratio
obligations than Firm A.
and will have
slightly more difficulty
meeting its debt
2-37. See Table 2.5 showing financial statement data and stock price data for Mydeco Corp.
a. Compute Mydeco’s PE ratio each year from 2012 to 2016. In which year was it the highest?
b. What was Mydeco’s Enterprise Value to EBITDA ratio each year? In which year was it the highest?
c. What might explain the differing time pattern of the two valuation ratios?
a.
Year
Price
Earnings per share
PE ratio
2012
$7.92
$0.33
24.00
2013
$3.30
$0.05
66.00
2014
$5.25
$0.11
47.73
2015
$8.71
$0.23
37.87
2016
$10.89
$0.39
27.92
The PE ratio was highest in 2010.

©2017 Pearson Education, Inc. ©2017 Pearson Education, Inc.
Chapter 2/Introduction to Financial Statement Analysis 20 20 Berk/DeMarzo, Corporate Finance, Fourth Edition
b.
Year 2012 2013 2014 2015 2016
Enterprise value 886.80 612.60 777.45 1,001.55 1,113.95
Enterprise value/EBITDA 10.00 9.50 10.20 10.50 10.00
Year 2012 2013 2014 2015 2016
Net Income 18.0 3.0 6.3 12.7 21.7
ROE 7.12% 1.20% 2.51% 4.91% 7.93%
b.
Year 2012 2013 2014 2015 2016
Net Income+Interest Expense 51.7 35.9 38.5 50.1 61.1
ROA 6.64% 4.63% 4.50% 5.61% 6.68%
EBITDA 88.70 64.50 76.20 95.40 111.40
The enterprise value/EBITDA ratio was the highest in 2015.
c. The different time patterns are caused by increasing debt in 2015 and 2016 that increased the
enterprise value of the Mydeco and reduced the earnings per share due to increased interest expense.
In addition, very small earnings per share in 2013 increased the PE ratio even though the price
decreased as well.
2-38. In early-2015, United Airlines (UAL) had a market capitalization of $24.8 billion, debt of $12.8
billion, and cash of $5.5 billion. United also had annual revenues of $38.9 billion. Southwest
Airlines (LUV) had a market capitalization of $28.8 billion, debt of $2.7 billion, cash of $2.9 billion,
and annual revenues of $18.6 billion.
a. Compare the market capitalization-to-revenue ratio (also called the price-to-sales ratio) for
United Airlines and Southwest Airlines.
b. Compare the enterprise value-to-revenue ratio for United Airlines and Southwest Airlines.
c. Which of these comparisons is more meaningful? Explain.
a. Market capitalization-to-revenue ratio:
= 24.8/38.9 = 0.64 for United Airlines.
= 28.8/18.6 = 1.55 for Southwest Airlines.
b. Enterprise value-to-revenue ratio:
= (24.8 – 5.5 + 12.8)/38.9 = 0.83 for United Airlines.
= (28.8 – 2.9 + 2.7)/18.6 = 1.54 for Southwest Airlines.
c. The market capitalization to revenue ratio cannot be meaningfully compared when the firms have
different amounts of leverage, as market capitalization measures only the value of the firm’s
equity. The enterprise value to revenue ratio is therefore more useful when firm’s leverage is quite
different, as it is here.
2-39. See Table 2.5 showing financial statement data and stock price data for Mydeco Corp.
a. Compute Mydeco’s ROE each year from 2012 to 2016.
b. Compute Mydeco’s ROA each year from 2012 to 2016.
c. Which return is more volatile? Why?
a.
Stockholders' Equity 252.7 250.3 251.2 258.5 273.7
Book Value of Assets 778.1 774.6 855.2 893.4 915.1

©2017 Pearson Education, Inc. ©2017 Pearson Education, Inc.
Chapter 2/Introduction to Financial Statement Analysis 21 21 Berk/DeMarzo, Corporate Finance, Fourth Edition
c. ROE is more volatile. Mydeco’s debt level causes a large portion of EBIT to go to interest
expense. This magnifies the volatility of earnings left over for shareholders through net income.
ROA adjusts net income by the interest expense, and thus is less sensitive to leverage.
Here we have calculated ROA using Net Income + Interest Expense, to reflect the total earnings of
both equity and debt investors in the firm. ROA is sometimes calculated using only Net Income, or Net
Income + After-tax Interest Expense. See fn. 14 in Chapter 2.
2-40. See Table 2.5 showing financial statement data and stock price data for Mydeco Corp. Was
Mydeco able to improve its ROIC in 2016 relative to what it was in 2012?
2012 ROIC = 61.4 × (1 − 0.35)
= 5.67% . 252.7 + 500 − 48.8
2016 ROIC = 72.8 × (1 − 0.35)
= 6.00% . 273.7 + 600 − 85
Mydeco was able to improve its ROIC in 2016 relative to 2012.
2-41. For fiscal year 2015, Costco Wholesale Corporation had a net profit margin of 2.05%, asset
turnover of 3.48, and a book equity multiplier of 3.15.
a. Use this data to compute Costco's ROE using the DuPont Identity.
b. If Costco's managers wanted to increase its ROE by one percentage point, how much higher
would their asset turnover need to be?
c. If Costco's net profit margin fell by one percentage point, by how much would their asset turnover need to increase to maintain their ROE?
a. Costco’s ROE (DuPont) = 2.05% × 3.48 × 3.15 = 22.47%.
b. Costco's new asset turnover = 23.47%/(2.05% × 3.15) = 3.63 or an increase of 3.63 – 3.48 = 0.15.
c. Costco's new asset turnover = 22.47%/(1.05% × 3.15) = 6.79 or an increase of 6.79 – 3.48 = 3.31.
2-42. For fiscal year 2015, Walmart Stores Inc. (WMT) had total revenues of $484.65 billion, net
income of $16.36 billion, total assets of $203.49 billion, and total shareholder’s equity of $81.39
billion.
a. Calculate Wal-Mart’s ROE directly, and using the DuPont Identity.
b. Comparing with the data for Costco in problem 41, use the DuPont Identity to understand
the difference between the two firms’ ROEs.
a. Walmart’s ROE = 16.36/81.39 = 20.10%.
Walmart’s net profit margin = 16.36/484.65 = 3.38%.
Walmart’s asset turnover = 484.65/203.49 = 2.38.
Walmart’s equity multiplier = 203.49/81.39 = 2.50.
Walmart’s ROE (DuPont) = 3.38% × 2.38 × 2.50 = 20.11% (difference due to rounding).
b. Walmart has a superior profit margin, but a lower asset turnover and a lower equity multiplier
(which could represent less leverage). Despite the higher profit margin, it has a smaller ROE that
is driven by it’s lower asset turnover and leverage.
2-43. Consider a retailing firm with a net profit margin of 3.5%, a total asset turnover of 1.8, total
assets of $44 million, and a book value of equity of $18 million.

©2017 Pearson Education, Inc. ©2017 Pearson Education, Inc.
Chapter 2/Introduction to Financial Statement Analysis 22 22 Berk/DeMarzo, Corporate Finance, Fourth Edition
a. What is the firm’s current ROE?
©2017 Pearson Education, Inc. ©2017 Pearson Education, Inc.
Chapter 2/Introduction to Financial Statement Analysis 23 23 Berk/DeMarzo, Corporate Finance, Fourth Edition
b. If the firm increased its net profit margin to 4%, what would be its ROE?
c. If, in addition, the firm increased its revenues by 20% (while maintaining this higher profit margin and without changing its assets or liabilities), what would be its ROE?
a. 3.5 × 1.8 × 44/18 = 15.4%.
b. 4 × 1.8 × 44/18 = 17.6%.
c. 4 × (1.8*1.2) × 44/18 = 21.1%.
2-44. Find online the annual 10-K report for Costco Wholesale Corporation (COST) for fiscal year
2015 (filed in October 2015).
a. Which auditing firm certified these financial statements?
b. Which officers of Costco’s certified the financial statements?
a. KPMG LLP certified Costco’s financial statements.
b. W. Craig Jelinek, President and CEO and Richard A. Galanti, Executive Vice President and CFO
certified Costco’s financial statements.
2-45. WorldCom reclassified $3.85 billion of operating expenses as capital expenditures. Explain the
effect this reclassification would have on WorldCom’s cash flows. (Hint: Consider taxes.)
WorldCom’s actions were illegal and clearly designed to deceive investors. But if a firm could
legitimately choose how to classify an expense for tax purposes, which choice is truly better for
the firm’s investors?
By reclassifying $3.85 billion operating expenses as capital expenditures, WorldCom increased its net
income but lowered its cash flow for that period. If a firm could legitimately choose how to classify an
expense, expensing as much as possible in a profitable period rather than capitalizing them will save
more on taxes, which results in higher cash flows, and thus is better for the firm’s investors.
©2017 Pearson Education, Inc. ©2017 Pearson Education, Inc.
Chapter 2 Introduction to Financial Statement Analysis
I. Chapter Outline
The following chapter outline is correlated to the PowerPoint Lecture Slides. The PowerPoint slides
are referenced in bold. Alternative Examples to selected textbook examples are also available in the
PowerPoint Lecture Slides and are also referenced in bold.
2.1 Firms’ Disclosure of Financial Information (Slide 8)
• Preparation of Financial Statements (Slide 9)
• Interview with Ruth Porat
• Types of Financial Statements (Slide 10)
2.2 The Balance Sheet (Slides 11-12)
• Table 2.1: Global Conglomerate Corporation Balance Sheet for 2012 and 2011 (Slide 15)
• Assets (Slides 13–14)
– Current Assets
– Long-Term Assets
• Liabilities (Slides 16–18)
– Current Liabilities
– Long-Term Liabilities
• Stockholders’ Equity (Slide 20)
– Market Value Versus Book Value (Slide 21–22)
– Enterprise Value (Slide 23)
• Example 2.1 Market Versus Book Value (Slides 24–25)
• PowerPoint Alternative Example 2.1 (Slides 26–27)
2.3 The Income Statement (Slide 28)
• Earnings Calculations (Slides 28–34)
– Gross Profit (Slide 28)
– Operating Expenses (Slide 29)
• Table 2.2: Global Conglomerate Corporation Income Statement for 2015 and 2014
(Slide 33)
– Earnings before Interest and Taxes (Slide 30)
– Pretax and Net Income (Slide 32)
– Earnings per Share (Slide 34)
2.4 The Statement of Cash Flows (Slide 35–36)
• Operating Activity (Slide 37)
• Table 2.3 Global Conglomerate Corporation Statement of Cash Flows for 2015 and 2014 (Slide 39)
©2017 Pearson Education, Inc. ©2017 Pearson Education, Inc.
Berk/DeMarzo • Corporate Finance, Fourth Edition 5
• Investment Activity (Slide 38)
• Financing Activity (Slide 38)
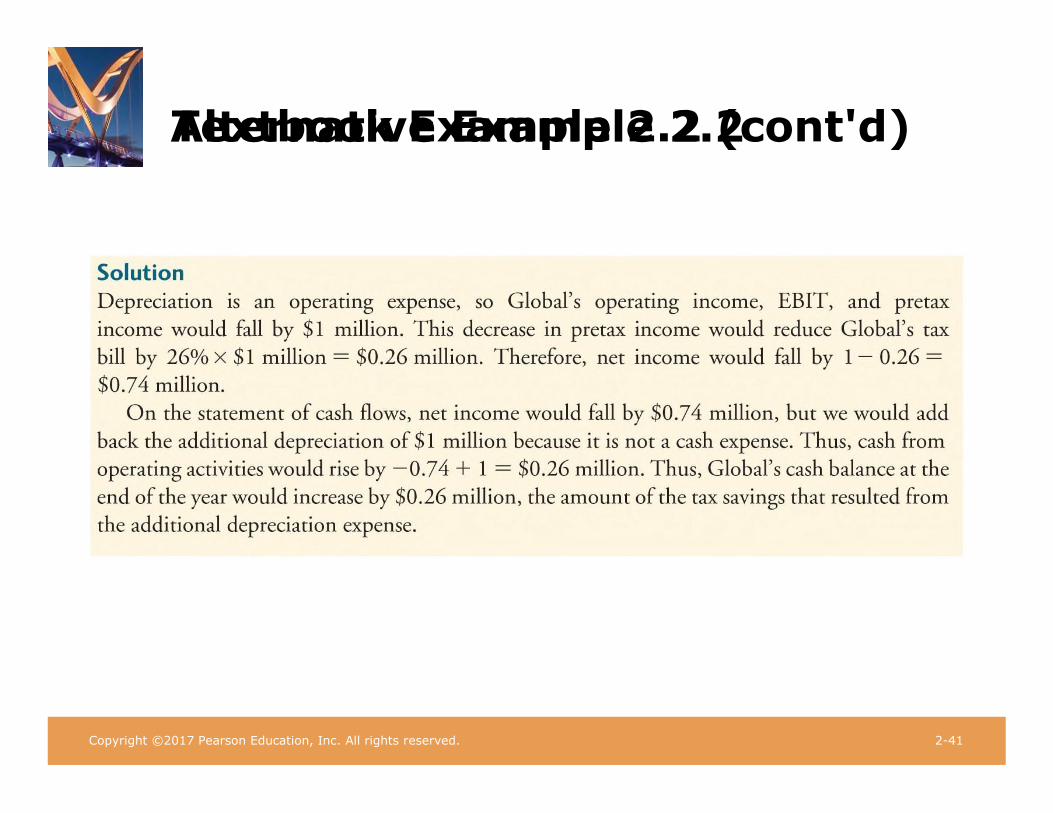
• Example 2.2 The Impact of Depreciation on Cash Flow (Slides 40–41)
• PowerPoint Alternative Example 2.2 (Slides 42–43)
2.5 Other Financial Statement Information (Slide 44)
• Statement of Stockholders’ Equity (Slide 44)
• Management Discussion and Analysis (Slide 45)
• Notes to the Financial Statements (Slide 45)
• Example 2.3 Sales by Product Category (Slides 46–47)
• PowerPoint Alternative Example 2.3 (Slides 48–50)
2.6 Financial Statement Analysis (Slide 51)
• Profitability Ratios (Slide 52–53)
• Figure 2.1 EBIT Margins for Five U.S. Airlines (Slide 54)
• Liquidity Ratios (Slide 55)
• Example 2.4 Computing Liquidity Ratios (Slides 56–57)
• PowerPoint Alternative Example 2.4 (Slides 58–60)
• Working Capital Ratios (Slide 61–62)
• Interest Coverage Ratios (Slide 63)
• Example 2.5 Computing Interest Coverage Ratios (Slides 64–65)
• PowerPoint Alternative Example 2.5 (Slides 66–67)
• Leverage Ratios (Slides 68–69)
• Valuation Ratios (Slide 70)
• Common Mistake: Mismatched Ratios
• Example 2.6 Computing Profitability and Valuation Ratios (Slides 71–72)
• PowerPoint Alternative Example 2.6 (Slides 73–74)
• Operating Returns (Slide 75)
• Example 2.7 Computing Operating Returns (Slides 76–77)
• PowerPoint Alternative Example 2.7 (Slides 78–79)
• The DuPont Identity (Slide 80)
• Example 2.8 Determinants of ROE (Slides 81–82)
• PowerPoint Alternative Example 2.8 (Slides 83–84)
• Table 2.4 A Summary of Key Financial Ratios (Slide 85)
2.7 Financial Reporting in Practice (Slide 86)
• Enron (Slide 86)
• WorldCom (Slide 86)
• Sarbanes-Oxley Act (Slide 86)
• Dodd-Frank Act (Slide 86)
• Global Financial Crisis: Bernie Madoff’s Ponzi Scheme
II. Learning Objectives
2-1 List the four major financial statements required by the SEC for publicly traded firms, define each of the four statements, and explain why each of these financial statements is valuable.
©2017 Pearson Education, Inc. ©2017 Pearson Education, Inc.
6 Berk/DeMarzo • Corporate Finance, Fourth Edition
2-2 Discuss the difference between book value and market value of stockholders’ equity; explain
why the two numbers are almost never the same.
2-3 Compute the following measures, and describe their usefulness in assessing firm performance:
debt-equity ratio, enterprise value, earnings per share, operating margin, net profit margin,
accounts receivable days, accounts payable days, inventory days, interest coverage ratio, return
on equity, return on assets, price-earnings ratio, and market-to-book ratio.
2-4 Discuss the uses of the DuPont Identity in disaggregating ROE, and assess the impact of
increases and decreases in the components of the identity on ROE.
2-5 Describe the importance of ensuring that valuation ratios are consistent with one another in terms of the inclusion of debt in the numerator and the denominator.
2-6 Distinguish between cash flow, as reported on the statement of cash flows, and accrual-based
income, as reported on the income statement; discuss the importance of cash flows to investors,
relative to accrual-based income.
2-7 Explain what is included in the management discussion and analysis section of the financial statements that cannot be found elsewhere in the financial statements.
2-8 Explain the importance of the notes to the financial statements.
2-9 List and describe the financial scandals described in the text, along with the new legislation
designed to reduce those types of fraud.
III. Chapter Overview
This chapter reviews the four main financial statements and discusses some useful financial ratios.
The chapter closes with a look at some recent financial scandals.
2.1 Firms’ Disclosure of Financial Information
The four statements that are required by the U.S. Securities and Exchange Commission (SEC) are the
balance sheet, the income statement, the statement of cash flows, and the statement of stockholders’
equity.
The section includes a summary of steps taken toward standardizing financial statements across
countries using International Financial Reporting Standards.
2.2 The Balance Sheet
The balance sheet lists the firm’s assets and liabilities. This section describes current assets, long-term
assets, current liabilities and long-term liabilities, with examples of the major components of each.
The authors emphasize the difference between market value and book value of equity and give some
specific reasons why the two are seldom the same. Example 2.1 illustrates a case in which they are
different.
Book value of equity is sometimes used as an estimate of the liquidation value of the firm.
Important tools for analyzing the firm’s value, leverage, and short-term cash needs from information
found on the balance sheet include the following:
a. The market-to-book ratio, which is often used to classify firms as value stocks or growth stocks
b. Enterprise value, which assesses the value of underlying business assets, not including cash
2.3 The Income Statement
The income statement lists the firm’s revenues and expenses over a period. This section of the text
discusses the calculation of earnings from the components of the income statement. Earnings per
Berk/DeMarzo • Corporate Finance, Fourth Edition 7
©2017 Pearson Education, Inc.
share (and diluted earnings per share) are often calculated to assess the size of net income relative to
that of similar firms.
2.4 The Statement of Cash Flows
The statement of cash flows converts accrual-based income into cash flow. Cash flows are separated
into operating activities, investment activities, and financing activities. Example 2.2 shows the impact
of depreciation on cash flows.
2.5 Other Financial Statement Information
The statement of stockholders’ equity provides detailed information about additions to, or reductions
in, the stockholders’ equity accounts. The management discussion and analysis provides
management’s interpretation of the planned activities of the firm. Notes to the financial statements are
an integral part of the statements, as they show detail about stock-based compensation plans, leases,
principal payments on debt, and many other items. Example 2.3 uses a note to the financial statement
reporting sales by product category to find the sales unit with the highest growth.
2.6 Financial Statement Analysis
Profitability ratios, such as operating margin and net profit margin, are often used to measure the
fraction of revenues that is available to common shareholders. Liquidity ratios are often used by
creditors to assess financial solvency. Example 2.4 illustrates computation of some liquidity ratios.
Some examples of ratios that use both income statement and balance sheet items are working capital
ratios, such as accounts receivable days (or average collection period), or inventory and accounts
payable turnovers. Leverage is often assessed using ratios such as interest coverage, which is also a
mixed ratio. Example 2.5 illustrates calculation of interest coverage ratios. Leverage ratios are also
used to assess leverage. Profitability and valuation ratios are shown in Example 2.6. Operating returns
are measured by return on equity or return on assets (illustrated by Example 2.7), although these
measures are both flawed in their use of book value measures. The DuPont Identity allows the analyst
to break down the determinants of a firm’s ROE. Example 2.8 illustrates this decomposition for
Walmart and Target.
Table 2.4 summarizes the financial ratios discussed throughout the chapter.
2.7 Financial Reporting in Practice
There have been several recent abuses of financial rules, including Enron and WorldCom. Enron sold
assets at inflated prices to other firms, together with a promise to buy back assets at an even higher
future price. WorldCom reclassified $3.85 billion in expenses as long-term investment. In response,
in 2002 the Sarbanes-Oxley Act was passed to improve accuracy of information provided to boards
and shareholders. It attempts to achieve this goal by (1) overhauling incentives and the independence
in the auditing process, (2) stiffening penalties for providing false information, and (3) forcing
companies to validate their internal financial control processes. The Act holds CFOs and CEOs
accountable for the firm’s financial statements. The Dodd-Frank Wall Street Reform and Consumer
Protection Act exempts small firms from some provisions of Sarbanes-Oxley and also broadens
whistle-blower provisions of that Act. A call-out box describes Madoff’s Ponzi scheme.
IV. Spreadsheet Solutions in Excel
The following problems for Chapter 2 have spreadsheet versions available: 10, 11, 13, 15, 16, 17, and
20.
These spreadsheets can be downloaded from the Instructor’s Resource Center at:
www.pearsonhighered.com/berk_demarzo. If you do not have a login and password for this Web site,
contact your Pearson sales representative.

Copyright ©2017 Pearson Education, Inc. All rights reserved. 2-1
Chapter 2
Introduction to Financial
Statement Analysis
Chapter Outline Learning Objectives
Copyright ©2017 Pearson Education, Inc. All rights reserved. 2-2 Copyright ©2017 Pearson Education, Inc. All rights reserved. 2-2
2.1 Firms’ Disclosure of Financial Information
2.2 The Balance Sheet
2.3 The Income Statement
2.4 The Statement of Cash Flows
2.5 Other Financial Statement Information
2.6 Financial Statement Analysis
2.7 Financial Reporting in Practice
Chapter Outline Learning Objectives
Copyright ©2017 Pearson Education, Inc. All rights reserved. 2-3 Copyright ©2017 Pearson Education, Inc. All rights reserved. 2-3
1. List the four major financial statements required by the SEC for publicly traded firms, define each of the four statements, and explain why each of these financial statements is valuable.
2. Discuss the difference between book value of stockholders’ equity and market value of stockholders’ equity; explain why the two numbers are almost never the same.
Copyright ©2017 Pearson Education, Inc. All rights reserved. 2-4 Copyright ©2017 Pearson Education, Inc. All rights reserved. 2-4
Learning Objectives Learning Objectives
3. Compute the following measures, and describe their usefulness in assessing firm performance: the debt-equity ratio, the enterprise value, earnings per share, operating margin, net profit margin, accounts receivable days, accounts payable days, inventory days, interest coverage ratio, return on equity, return on assets, price-earnings ratio, and market- to-book ratio.

Copyright ©2017 Pearson Education, Inc. All rights reserved. 2-5 Copyright ©2017 Pearson Education, Inc. All rights reserved. 2-5
Learning Objectives Learning Objectives
4. Discuss the uses of the DuPont identity in disaggregating ROE, and assess the impact of increases and decreases in the components of the identity on ROE.
5. Describe the importance of ensuring that valuation ratios are consistent with one another in terms of the inclusion of debt in the numerator and the denominator.
Copyright ©2017 Pearson Education, Inc. All rights reserved. 2-6 Copyright ©2017 Pearson Education, Inc. All rights reserved. 2-6
Learning Objectives Learning Objectives
6. Distinguish between cash flow, as reported on the statement of cash flows, and accrual-based income, as reported on the income statement; discuss the importance of cash flows to investors, relative to accrual-based income.
7. Explain what is included in the management discussion and analysis section of the financial statements that

Copyright ©2017 Pearson Education, Inc. All rights reserved. 2-7 Copyright ©2017 Pearson Education, Inc. All rights reserved. 2-7
Learning Objectives Learning Objectives
cannot be found elsewhere in the financial statements.

Copyright ©2017 Pearson Education, Inc. All rights reserved. 2-8 Copyright ©2017 Pearson Education, Inc. All rights reserved. 2-8
Learning Objectives Learning Objectives
8. Explain the importance of the notes to the financial statements.
9. List and describe the financial scandals described in the text, along with the new legislation designed to reduce that type of fraud.
Copyright ©2017 Pearson Education, Inc. All rights reserved. 2-9 Copyright ©2017 Pearson Education, Inc. All rights reserved. 2-9
2.1 Firms’ Disclosure of Financial Information
• Financial Statements
– Firm-issued accounting reports with past performance information
– Filed with the SEC
• 10Q
– Quarterly
• 10K
– Annual
– Must also send an annual report with financial statements to shareholders

Copyright ©2017 Pearson Education, Inc. All rights reserved. 2-10
Copyright ©2017 Pearson Education, Inc. All rights reserved. 2-10
2.1 Firms’ Disclosure of Financial Information (cont'd)
• Preparation of Financial Statements
– Generally Accepted Accounting Principles (GAAP)
– Auditor
• Neutral third party that checks a firm’s financial statements
2.1 Firms’ Disclosure of Financial Information (cont'd) 2.2 Balance Sheet
Copyright ©2017 Pearson Education, Inc. All rights reserved. 2-10 Copyright ©2017 Pearson Education, Inc. All rights reserved. 2-10
• Types of Financial Statements
– Balance Sheet
– Income Statement
– Statement of Cash Flows
– Statement of Stockholders’ Equity

2.1 Firms’ Disclosure of Financial Information (cont'd) 2.2 Balance Sheet
Copyright ©2017 Pearson Education, Inc. All rights reserved. 2-11 Copyright ©2017 Pearson Education, Inc. All rights reserved. 2-11
• A snapshot in time of the firm’s financial position
• The Balance Sheet Identity:
Assets Liabilities Stockholders' Equity

Copyright ©2017 Pearson Education, Inc. All rights reserved. 2-12 Copyright ©2017 Pearson Education, Inc. All rights reserved. 2-12
2.2 Balance Sheet (cont'd) 2.2 Balance Sheet (cont'd)
• Assets
– What the company owns
• Liabilities
– What the company owes
• Stockholder’s Equity
– The difference between the value of the firm’s assets and liabilities
Copyright ©2017 Pearson Education, Inc. All rights reserved. 2-13 Copyright ©2017 Pearson Education, Inc. All rights reserved. 2-13
2.2 Balance Sheet (cont'd) 2.2 Balance Sheet (cont'd)
• Assets
– Current Assets: Cash or expected to be turned into cash in the next year
• Cash
• Marketable Securities
• Accounts Receivable
• Inventories
• Other Current Assets
– Example: Pre-paid expenses
Copyright ©2017 Pearson Education, Inc. All rights reserved. 2-14 Copyright ©2017 Pearson Education, Inc. All rights reserved. 2-14
2.2 Balance Sheet (cont'd) 2.2 Balance Sheet (cont'd)
• Assets
– Long-Term Assets
• Net Property, Plant, & Equipment
– Depreciation (and Accumulated Depreciation)
– Book Value = Acquisition cost – Accumulated depreciation
• Goodwill and intangible assets
– Amortization
• Other long-term assets
– Example: Investments in Long-term Securities
Copyright ©2017 Pearson Education, Inc. All rights reserved. 2-15 Copyright ©2017 Pearson Education, Inc. All rights reserved. 2-15
2.2 Balance Sheet (cont'd)
Table 2.1 Global Conglomerate Corporation Balance Sheet
Copyright ©2017 Pearson Education, Inc. All rights reserved. 2-16 Copyright ©2017 Pearson Education, Inc. All rights reserved. 2-16
2.2 Balance Sheet (cont'd)
Copyright ©2017 Pearson Education, Inc. All rights reserved. 2-17 Copyright ©2017 Pearson Education, Inc. All rights reserved. 2-17
2.2 Balance Sheet (cont'd)
• Liabilities
– Current Liabilities: Due to be paid within the next year
• Accounts Payable
• Short-Term Debt/Notes Payable
• Current Maturities of Long-Term Debt
• Other Current Liabilities
– Taxes Payable
– Wages Payable

Copyright ©2017 Pearson Education, Inc. All rights reserved. 2-18 Copyright ©2017 Pearson Education, Inc. All rights reserved. 2-18
2.2 Balance Sheet (cont'd)
2.2 Balance Sheet (cont'd)
• Net Working Capital
– Current Assets – Current Liabilities

Copyright ©2017 Pearson Education, Inc. All rights reserved. 2-19 Copyright ©2017 Pearson Education, Inc. All rights reserved. 2-19
2.2 Balance Sheet (cont'd)
• Liabilities
– Long-Term Liabilities
• Long-Term Debt
• Capital Leases
• Deferred Taxes
Copyright ©2017 Pearson Education, Inc. All rights reserved. 2-20 Copyright ©2017 Pearson Education, Inc. All rights reserved. 2-20
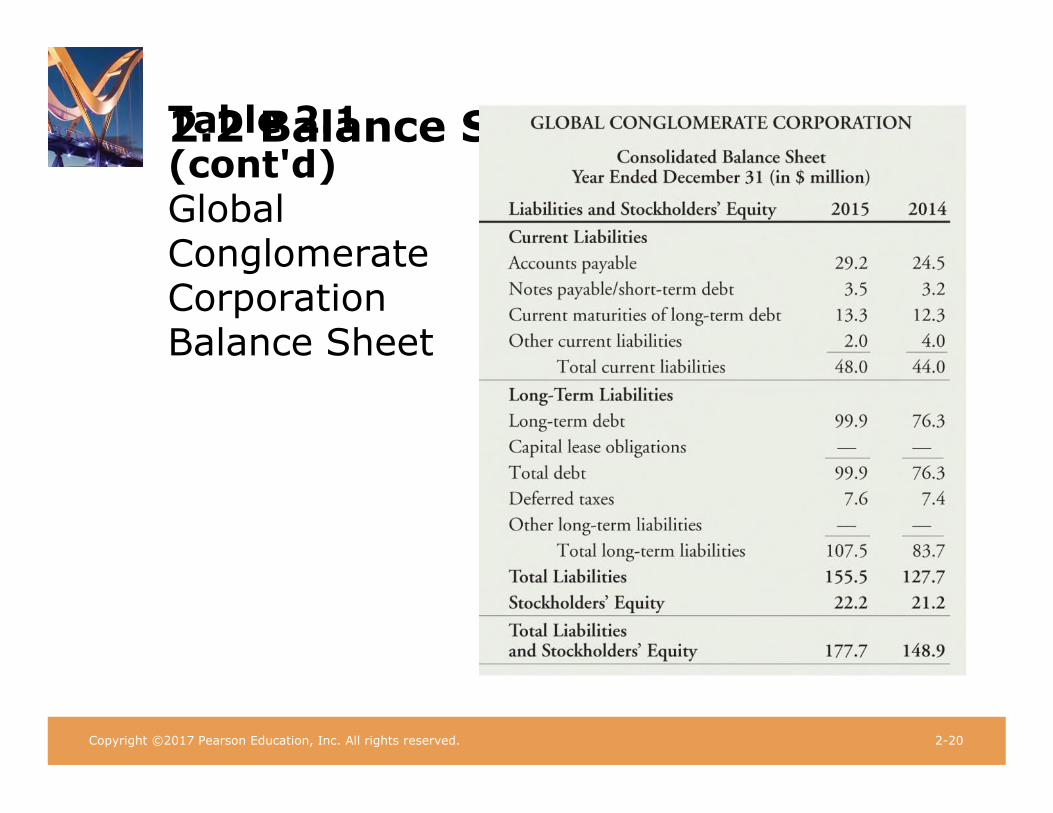
2.2 Balance Sheet (cont'd)
Table 2.1 (cont'd) Global Conglomerate Corporation Balance Sheet

2.2 Balance Sheet (cont'd)
Copyright ©2017 Pearson Education, Inc. All rights reserved. 2-20 Copyright ©2017 Pearson Education, Inc. All rights reserved. 2-20
• Stockholder’s Equity
– Book Value of Equity
• Book Value of Assets – Book Value of Liabilities
– Could possibly be negative
– Many of the firm’s valuable assets may not be captured on the balance sheet
Copyright ©2017 Pearson Education, Inc. All rights reserved. 2-21 Copyright ©2017 Pearson Education, Inc. All rights reserved. 2-21
2.2 Balance Sheet (cont'd) 2.2 Balance Sheet (cont'd)
• Market Value Versus Book Value
– Market Value of Equity (Market Capitalization)
• Market Price per Share x Number of Shares Outstanding
– Cannot be negative
– Often differs substantially from book value

Copyright ©2017 Pearson Education, Inc. All rights reserved. 2-22 Copyright ©2017 Pearson Education, Inc. All rights reserved. 2-22
2.2 Balance Sheet (cont'd) 2.2 Balance Sheet (cont'd)
• Market Value Versus Book Value
– Market-to-Book Ratio
• aka Price-to-Book Ratio
Market-to-Book Ratio
• Value Stocks
Market Value of Equity
Book Value of Equity
– Low M/B ratios
• Growth stocks
– High M/B ratios

Copyright ©2017 Pearson Education, Inc. All rights reserved. 2-23 Copyright ©2017 Pearson Education, Inc. All rights reserved. 2-23
2.2 Balance Sheet (cont'd) 2.2 Balance Sheet (cont'd)
• Enterprise Value
– aka Total Enterprise Value (TEV)
Enterprise Value Market Value of Equity Debt Cash
Textbook Example 2.1 Textbook Example 2.1 (cont'd)
Copyright ©2017 Pearson Education, Inc. All rights reserved. 2-24 Copyright ©2017 Pearson Education, Inc. All rights reserved. 2-24

Textbook Example 2.1 Textbook Example 2.1 (cont'd)
Copyright ©2017 Pearson Education, Inc. All rights reserved. 2-25 Copyright ©2017 Pearson Education, Inc. All rights reserved. 2-25

Copyright ©2017 Pearson Education, Inc. All rights reserved. 2-26 Copyright ©2017 Pearson Education, Inc. All rights reserved. 2-26
Alternative Example 2.1 Alternative Example 2.1
• Problem
– Rylan Enterprises has 5 million shares outstanding.
– The market price per share is $108.
– The firm’s book value of equity is $50 million.
– What is Rylan’s market capitalization?
– What is Rylan’s Market-to-Book ratio?

Copyright ©2017 Pearson Education, Inc. All rights reserved. 2-27 Copyright ©2017 Pearson Education, Inc. All rights reserved. 2-27
Alternative Example 2.1 Alternative Example 2.1
• Solution
– Rylan’s market capitalization is $490 million
• 5 million shares × $98 share = $490 million.
• The Market-to-Book ratio is $490/$50 = 9.80.

2.3 Income Statement 2.3 Income Statement (cont'd)
Copyright ©2017 Pearson Education, Inc. All rights reserved. 2-28 Copyright ©2017 Pearson Education, Inc. All rights reserved. 2-28
• Total Sales/Revenues
– minus
• Cost of Sales
– equals
• Gross Profit
2.3 Income Statement 2.3 Income Statement (cont'd)
Copyright ©2017 Pearson Education, Inc. All rights reserved. 2-29 Copyright ©2017 Pearson Education, Inc. All rights reserved. 2-29
• Gross Profit
– minus
• Operating Expenses • Selling, General, and Administrative Expenses
• R&D
• Depreciation & Amortization
– equals
• Operating Income
2.3 Income Statement (cont'd) 2.3 Income Statement (cont'd)
Copyright ©2017 Pearson Education, Inc. All rights reserved. 2-30 Copyright ©2017 Pearson Education, Inc. All rights reserved. 2-30
• Operating Income
– plus/minus
• Other Income/Other Expenses
– equals
• Earnings Before Interest and Taxes (EBIT)
2.3 Income Statement (cont'd) 2.3 Income Statement (cont'd)
Copyright ©2017 Pearson Education, Inc. All rights reserved. 2-31 Copyright ©2017 Pearson Education, Inc. All rights reserved. 2-31
• Earnings Before Interest and Taxes (EBIT)
– plus/minus
• Interest Income/Interest Expense
– equals
• Pre-Tax Income

2.3 Income Statement (cont'd) 2.3 Income Statement (cont'd)
Copyright ©2017 Pearson Education, Inc. All rights reserved. 2-32 Copyright ©2017 Pearson Education, Inc. All rights reserved. 2-32
• Pre-Tax Income
– minus
• Taxes
– equals
• Net Income

Copyright ©2017 Pearson Education, Inc. All rights reserved. 2-33 Copyright ©2017 Pearson Education, Inc. All rights reserved. 2-33
2.3 Income Statement (cont'd)
Table 2.2 Global Conglomerate Corporation Income Statement Sheet

Copyright ©2017 Pearson Education, Inc. All rights reserved. 2-34 Copyright ©2017 Pearson Education, Inc. All rights reserved. 2-34
2.3 Income Statement (cont'd)
Copyright ©2017 Pearson Education, Inc. All rights reserved. 2-35 Copyright ©2017 Pearson Education, Inc. All rights reserved. 2-35
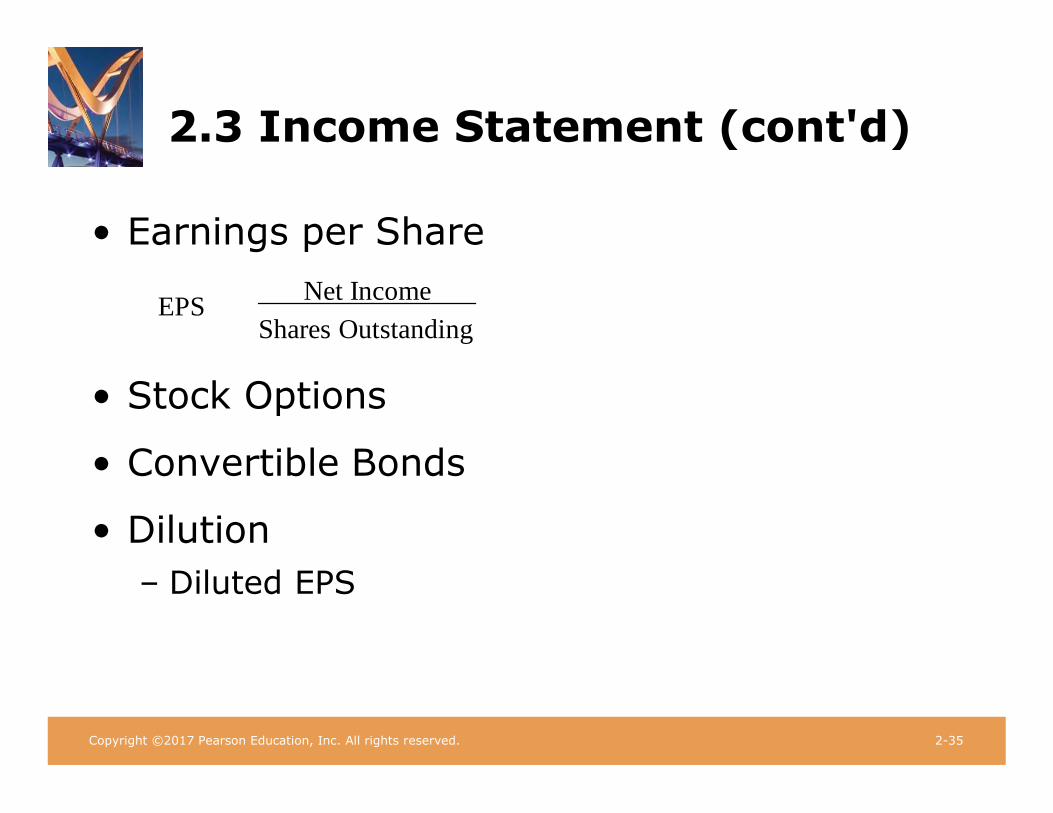
2.3 Income Statement (cont'd)
• Earnings per Share
EPS Net Income
Shares Outstanding
• Stock Options
• Convertible Bonds
• Dilution
– Diluted EPS

Copyright ©2017 Pearson Education, Inc. All rights reserved. 2-36 Copyright ©2017 Pearson Education, Inc. All rights reserved. 2-36
2.4 Statement of Cash Flows 2.4 Statement of Cash Flows (cont'd)
• Net Income typically does NOT equal the amount of cash the firm has earned.
– Non-Cash Expenses
• Depreciation and Amortization
– Uses of Cash not on the Income Statement
• Investment in Property, Plant, and Equipment

Copyright ©2017 Pearson Education, Inc. All rights reserved. 2-37 Copyright ©2017 Pearson Education, Inc. All rights reserved. 2-37
2.4 Statement of Cash Flows 2.4 Statement of Cash Flows (cont'd)
• Three Sections
– Operating Activity
– Investment Activity
– Financing Activity
Copyright ©2017 Pearson Education, Inc. All rights reserved. 2-38 Copyright ©2017 Pearson Education, Inc. All rights reserved. 2-38
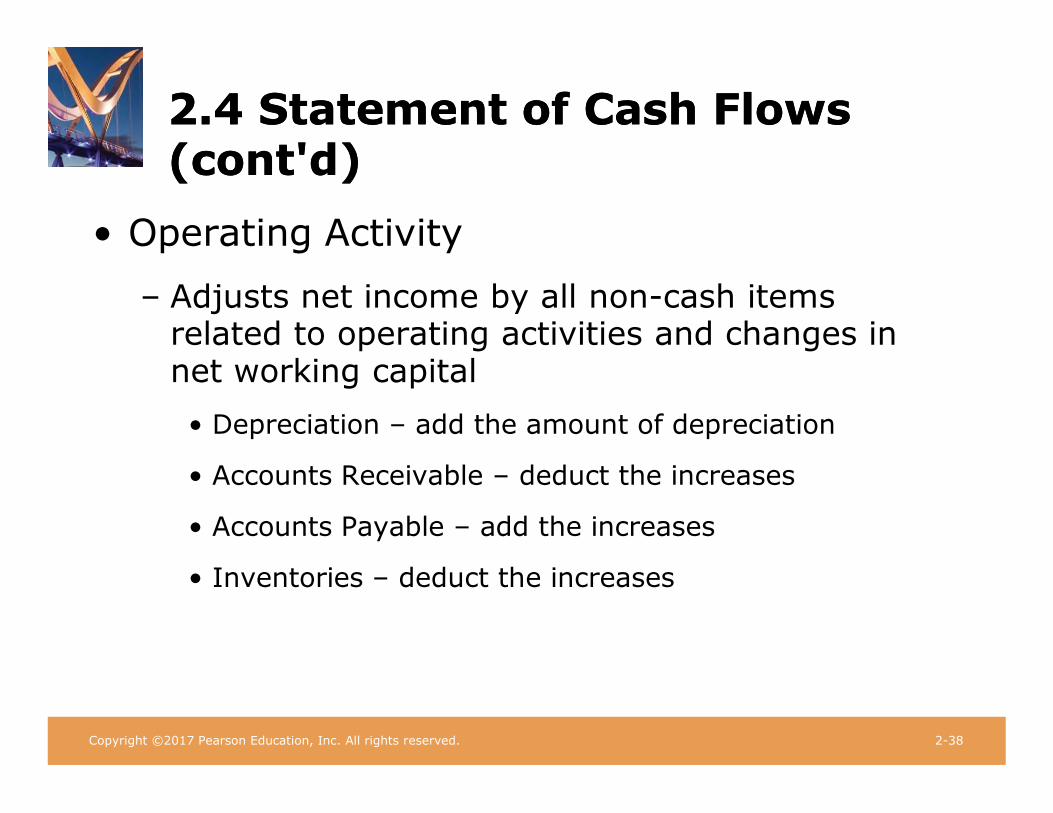
2.4 Statement of Cash Flows (cont'd) 2.4 Statement of Cash Flows (cont'd)
• Operating Activity
– Adjusts net income by all non-cash items related to operating activities and changes in net working capital
• Depreciation – add the amount of depreciation
• Accounts Receivable – deduct the increases
• Accounts Payable – add the increases
• Inventories – deduct the increases
Copyright ©2017 Pearson Education, Inc. All rights reserved. 2-39 Copyright ©2017 Pearson Education, Inc. All rights reserved. 2-39
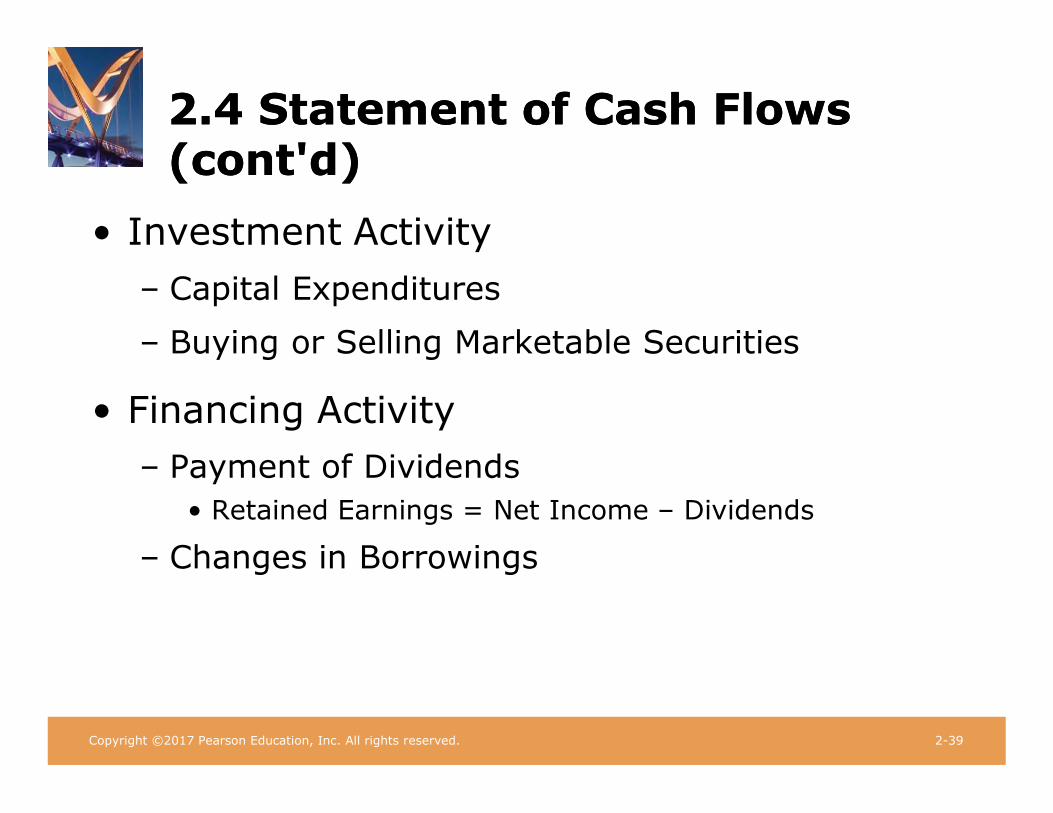
2.4 Statement of Cash Flows (cont'd) 2.4 Statement of Cash Flows (cont'd)
• Investment Activity
– Capital Expenditures
– Buying or Selling Marketable Securities
• Financing Activity
– Payment of Dividends
• Retained Earnings = Net Income – Dividends
– Changes in Borrowings

Copyright ©2017 Pearson Education, Inc. All rights reserved. 2-40 Copyright ©2017 Pearson Education, Inc. All rights reserved. 2-40
Table 2.3 Global Conglomerate Corporation
Textbook Example 2.2
Statement of Cash Flows

Copyright ©2017 Pearson Education, Inc. All rights reserved. 2-41 Copyright ©2017 Pearson Education, Inc. All rights reserved. 2-41
Table 2.3 Global Conglomerate Corporation
Textbook Example 2.2

Table 2.3 Global Conglomerate Corporation
Textbook Example 2.2
Copyright ©2017 Pearson Education, Inc. All rights reserved. 2-40 Copyright ©2017 Pearson Education, Inc. All rights reserved. 2-40
Copyright ©2017 Pearson Education, Inc. All rights reserved. 2-41 Copyright ©2017 Pearson Education, Inc. All rights reserved. 2-41
Textbook Example 2.2 (cont'd) Alternative Example 2.2

Copyright ©2017 Pearson Education, Inc. All rights reserved. 2-42 Copyright ©2017 Pearson Education, Inc. All rights reserved. 2-42
Textbook Example 2.2 (cont'd) Alternative Example 2.2
• Problem
– In 2016, Rylan Enterprises net income increased by $1.5 million while its depreciation expense decreased by $750,000, accounts receivable increased by $5,000,000 and accounts payable increased by $3,000,000. Rylan’s total corporate tax rate is 40%.
– How did the decline in Rylan’s depreciation expense impact its end-of-year cash balance?
Copyright ©2017 Pearson Education, Inc. All rights reserved. 2-43 Copyright ©2017 Pearson Education, Inc. All rights reserved. 2-43
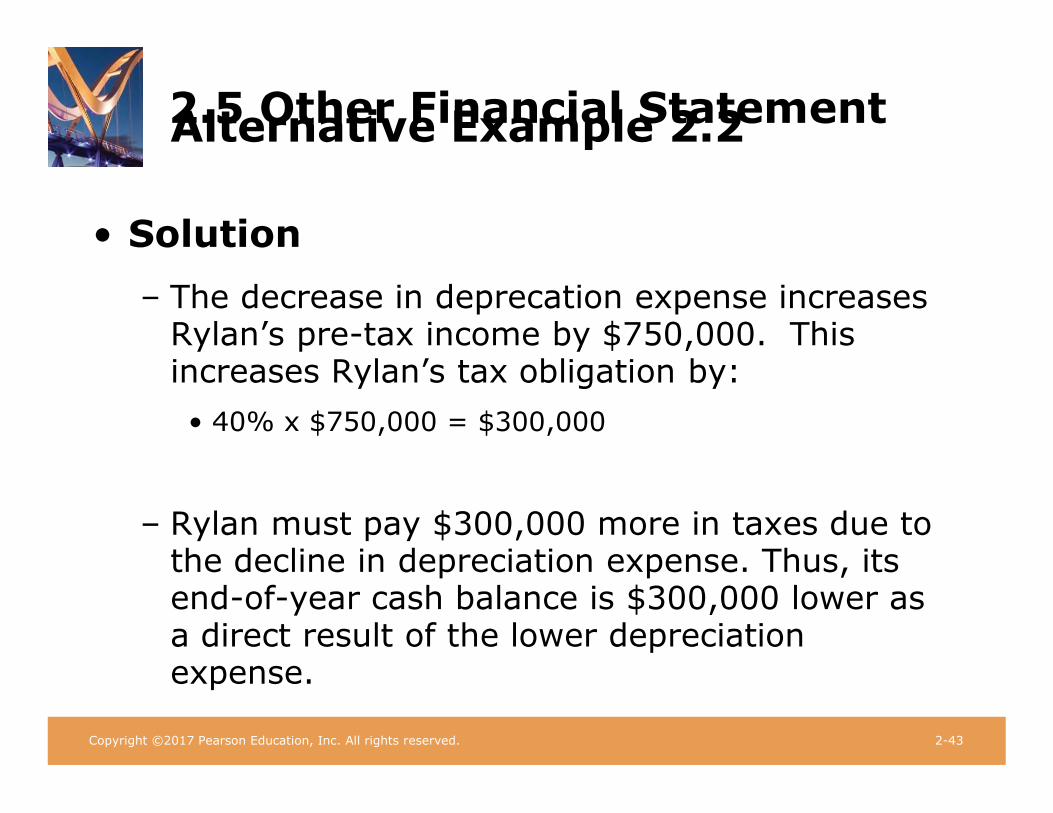
Alternative Example 2.2 2.5 Other Financial Statement
• Solution
– The decrease in deprecation expense increases Rylan’s pre-tax income by $750,000. This increases Rylan’s tax obligation by:
• 40% x $750,000 = $300,000
– Rylan must pay $300,000 more in taxes due to the decline in depreciation expense. Thus, its end-of-year cash balance is $300,000 lower as a direct result of the lower depreciation expense.
Alternative Example 2.2 2.5 Other Financial Statement
Copyright ©2017 Pearson Education, Inc. All rights reserved. 2-44 Copyright ©2017 Pearson Education, Inc. All rights reserved. 2-45
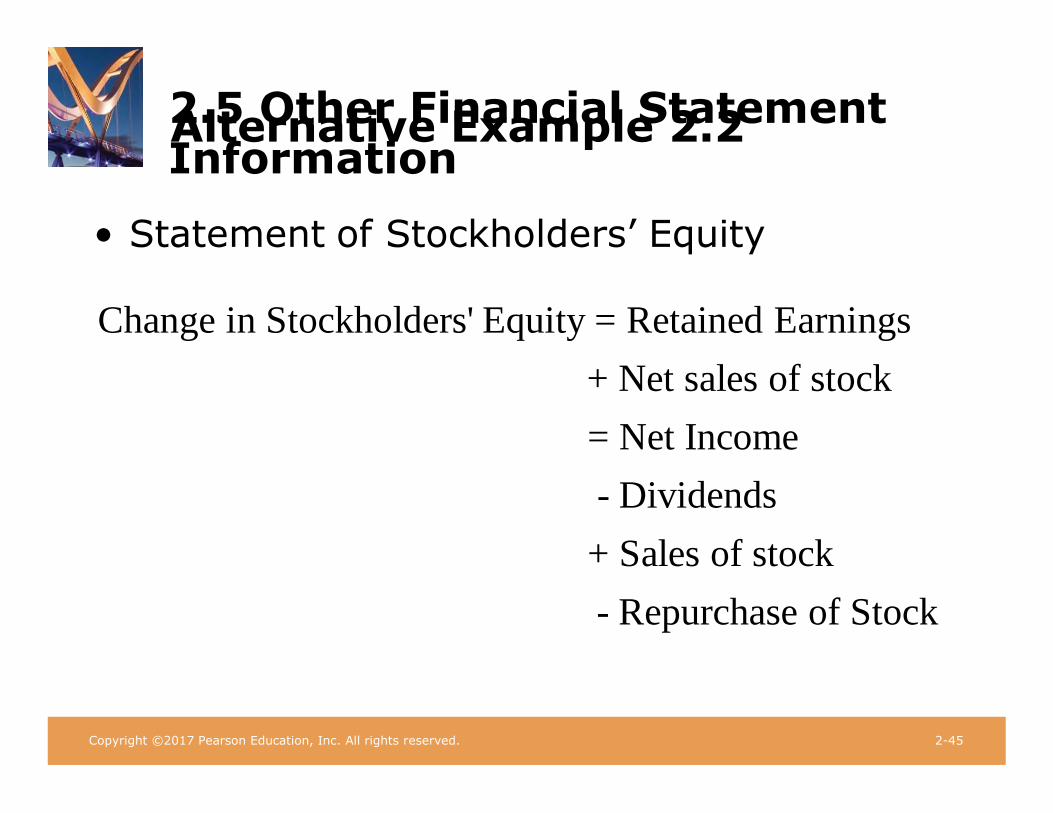
Information
• Statement of Stockholders’ Equity
Change in Stockholders' Equity = Retained Earnings
+ Net sales of stock
= Net Income
- Dividends
+ Sales of stock
- Repurchase of Stock

Copyright ©2017 Pearson Education, Inc. All rights reserved. 2-44 Copyright ©2017 Pearson Education, Inc. All rights reserved. 2-45
2.5 Other Financial Statement Textbook Example 2.3
Information
• Management Discussion and Analysis
– Off-Balance Sheet Transactions
• Notes to the Financial Statements

2.5 Other Financial Statement Textbook Example 2.3
Copyright ©2017 Pearson Education, Inc. All rights reserved. 2-46 Copyright ©2017 Pearson Education, Inc. All rights reserved. 2-46
Copyright ©2017 Pearson Education, Inc. All rights reserved. 2-47 Copyright ©2017 Pearson Education, Inc. All rights reserved. 2-47
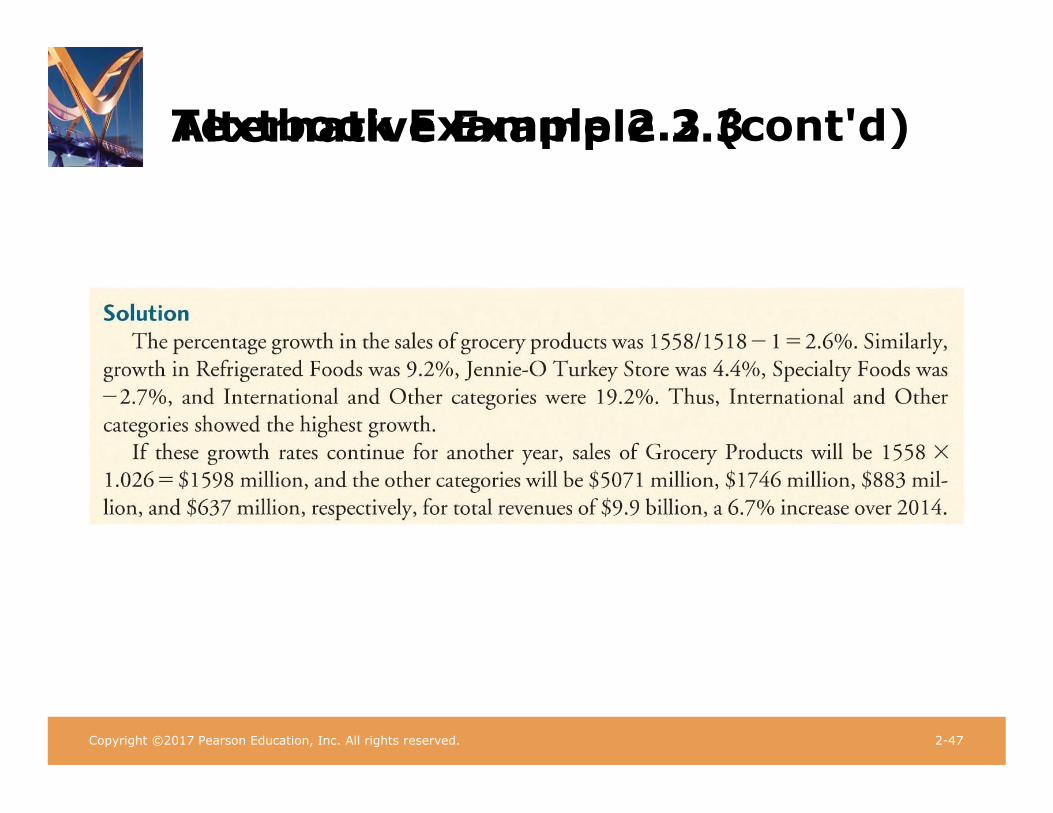
Textbook Example 2.3 (cont'd) Alternative Example 2.3

Copyright ©2017 Pearson Education, Inc. All rights reserved. 2-48 Copyright ©2017 Pearson Education, Inc. All rights reserved. 2-48
Textbook Example 2.3 (cont'd) Alternative Example 2.3
• Problem
– Apple reported the following net sales (in millions) by operating segment:
2015 2014
Americas $ 93,864 $ 80,095
Europe $ 50,337 $ 44,285
Greater China $ 58,715 $ 31,853
Japan $ 15,706 $ 15,314
Rest of Asia Pacific $ 15,093 $ 11,248
Total $ 233,715 $ 182,795
– Which operating segment had the greatest dollar change in net sales? The largest percent change?
Copyright ©2017 Pearson Education, Inc. All rights reserved. 2-49 Copyright ©2017 Pearson Education, Inc. All rights reserved. 2-49
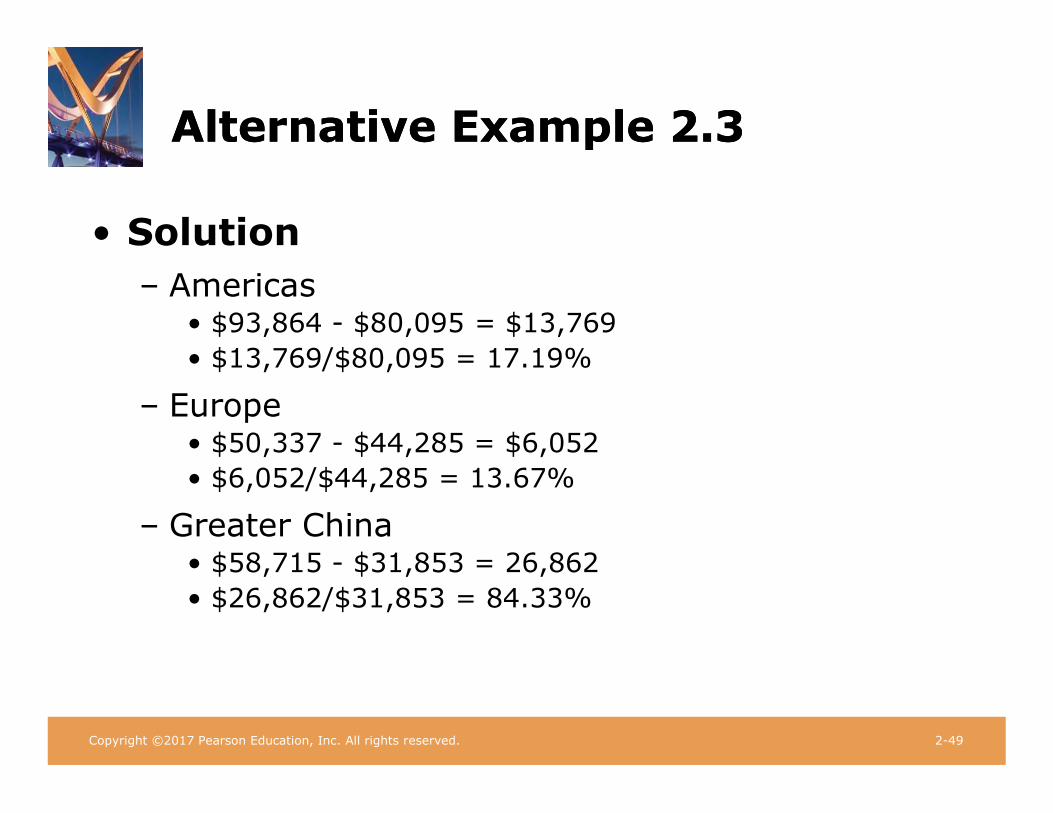
Alternative Example 2.3 Alternative Example 2.3
• Solution
– Americas • $93,864 - $80,095 = $13,769
• $13,769/$80,095 = 17.19%
– Europe • $50,337 - $44,285 = $6,052
• $6,052/$44,285 = 13.67%
– Greater China • $58,715 - $31,853 = 26,862
• $26,862/$31,853 = 84.33%

Alternative Example 2.3 Alternative Example 2.3
Copyright ©2017 Pearson Education, Inc. All rights reserved. 2-50 Copyright ©2017 Pearson Education, Inc. All rights reserved. 2-50
• Solution (cont'd)
– Japan • $15,706 - $15,314 = $392
• $392/$15,314 = 2.56%
– Rest of Asia Pacific • $15,093 - $11,248 = $3,845
• $3,845/$11,248= 34.18%
– Greater China had the largest dollar change with a $26.9 billion increase and the largest percent change with a 84.33% increase,
Copyright ©2017 Pearson Education, Inc. All rights reserved. 2-51 Copyright ©2017 Pearson Education, Inc. All rights reserved. 2-51
2.6 Financial Statement Analysis
• Used to:
– Compare the firm with itself over time
– Compare the firm to other similar firms

Copyright ©2017 Pearson Education, Inc. All rights reserved. 2-52 Copyright ©2017 Pearson Education, Inc. All rights reserved. 2-52
2.6 Financial Statement Analysis (cont'd)
• Profitability Ratios
– Gross Margin
Gross Margin= Gross Profit
Sales
– Operating Margin
Operating Margin= Operating Income
Sales

2.6 Financial Statement Analysis (cont'd) Figure 2.1 EBIT Margins for Five
Copyright ©2017 Pearson Education, Inc. All rights reserved. 2-53 Copyright ©2017 Pearson Education, Inc. All rights reserved. 2-53
• Profitability Ratios
– EBIT Margin
EBIT EBIT
Sales
– Net Profit Margin
Net Profit Margin Net Income
Total Sales
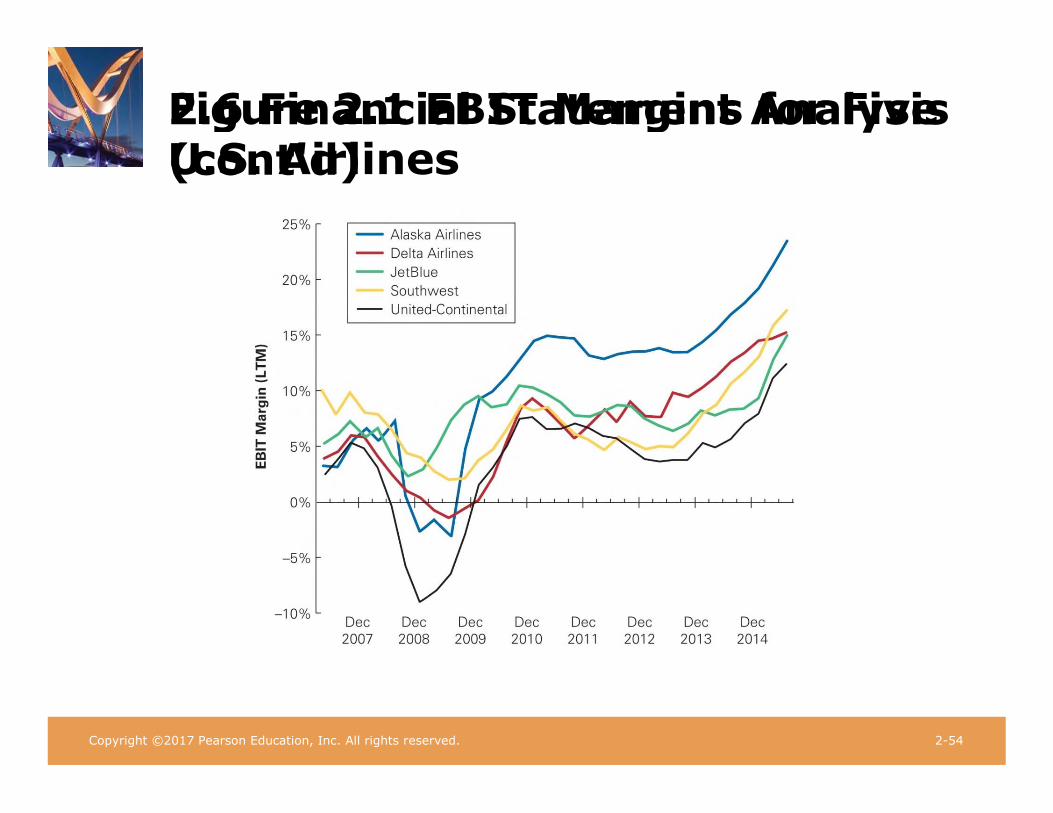
2.6 Financial Statement Analysis (cont'd) Figure 2.1 EBIT Margins for Five
Copyright ©2017 Pearson Education, Inc. All rights reserved. 2-54 Copyright ©2017 Pearson Education, Inc. All rights reserved. 2-54
U.S. Airlines

2.6 Financial Statement Analysis (cont'd) Figure 2.1 EBIT Margins for Five
Copyright ©2017 Pearson Education, Inc. All rights reserved. 2-55 Copyright ©2017 Pearson Education, Inc. All rights reserved. 2-55
Source: Capital IQ

2.6 Financial Statement Analysis (cont'd) Figure 2.1 EBIT Margins for Five
Copyright ©2017 Pearson Education, Inc. All rights reserved. 2-56 Copyright ©2017 Pearson Education, Inc. All rights reserved. 2-56
• Liquidity Ratios
– Current Ratio
• Current Assets / Current Liabilities
– Quick Ratio • (Cash + Short-Term Investments + A/R) /
Current Liabilities
– Cash Ratio
• Cash / Current Liabilities
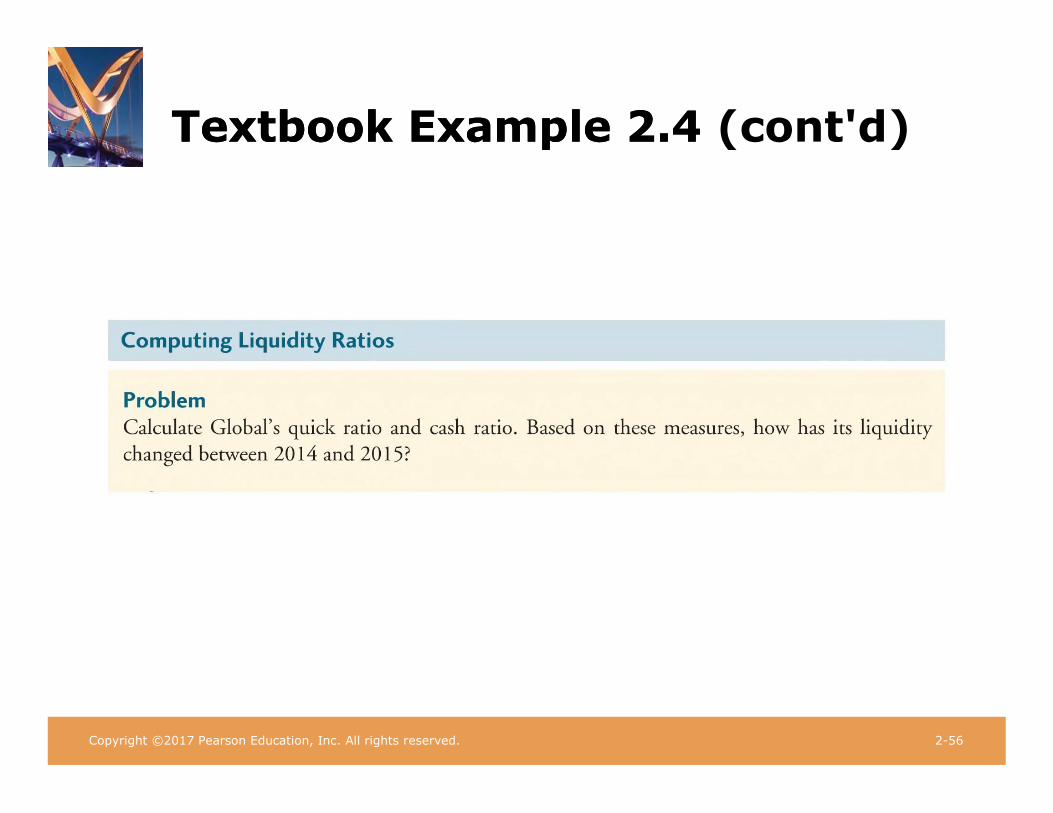
Textbook Example 2.4 Textbook Example 2.4 (cont'd)
Copyright ©2017 Pearson Education, Inc. All rights reserved. 2-56 Copyright ©2017 Pearson Education, Inc. All rights reserved. 2-56
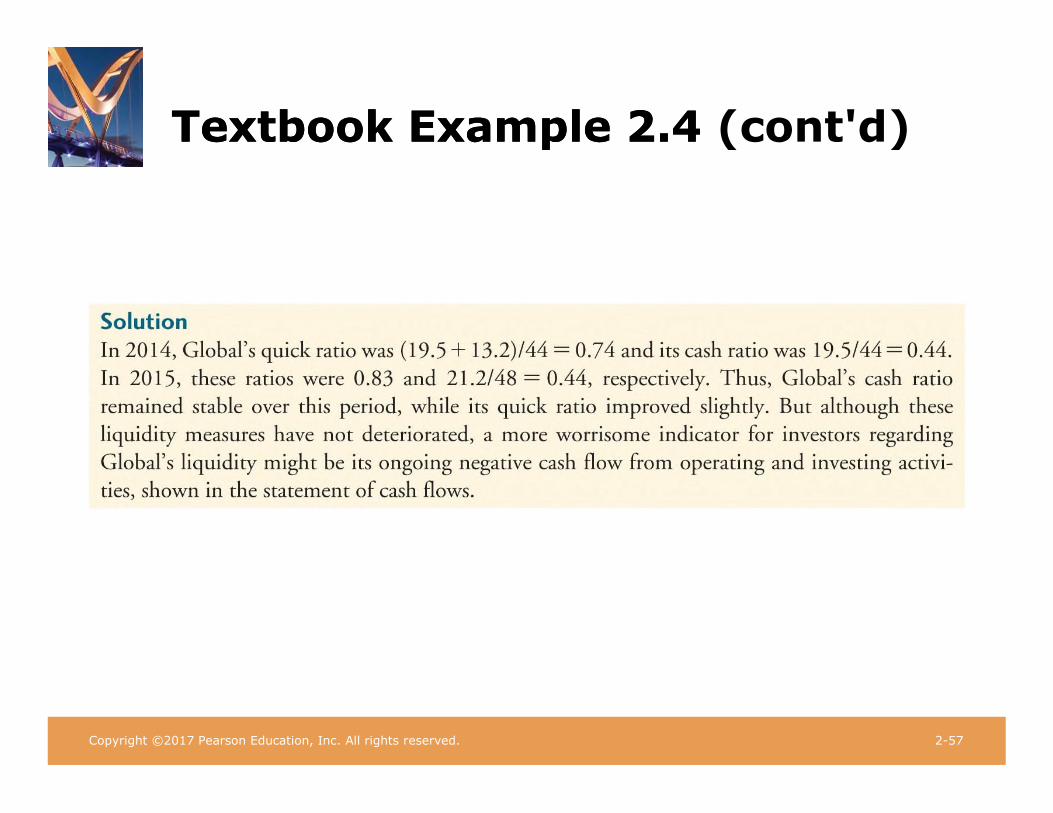
Textbook Example 2.4 Textbook Example 2.4 (cont'd)
Copyright ©2017 Pearson Education, Inc. All rights reserved. 2-57 Copyright ©2017 Pearson Education, Inc. All rights reserved. 2-57

Copyright ©2017 Pearson Education, Inc. All rights reserved. 2-58 Copyright ©2017 Pearson Education, Inc. All rights reserved. 2-58
Alternative Example 2.4 Alternative Example 2.4 (cont'd)
• Problem
– Based on the data on the following slide, calculate Rylan Corporation’s quick ratio and cash ratio. Based on these measures, how has its liquidity changed between the 2015 and the 2016?
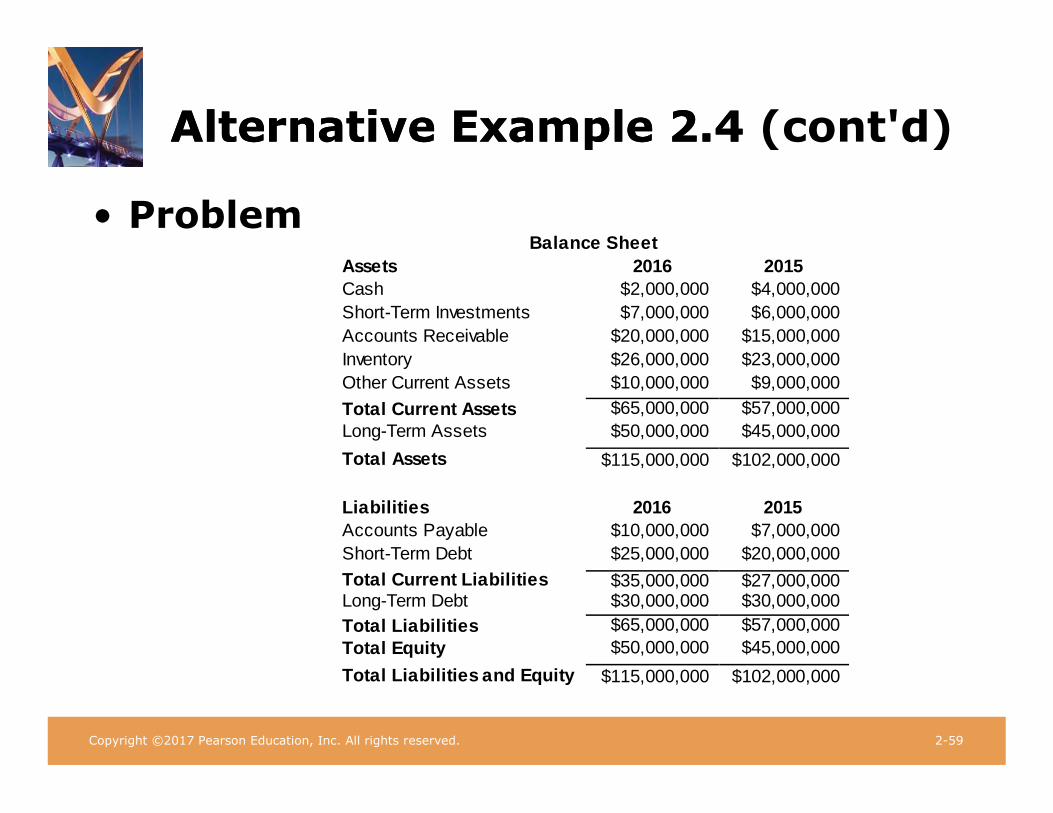
Copyright ©2017 Pearson Education, Inc. All rights reserved. 2-59 Copyright ©2017 Pearson Education, Inc. All rights reserved. 2-59
Alternative Example 2.4 Alternative Example 2.4 (cont'd)
Cash $2,000,000 $4,000,000
Short-Term Investments $7,000,000 $6,000,000
Accounts Receivable $20,000,000 $15,000,000
Inventory $26,000,000 $23,000,000
Other Current Assets $10,000,000 $9,000,000
Total Current Assets $65,000,000 $57,000,000
Long-Term Assets $50,000,000 $45,000,000
Total Assets $115,000,000 $102,000,000
Liabilities
2016
2015
Accounts Payable $10,000,000 $7,000,000
Short-Term Debt $25,000,000 $20,000,000
Total Current Liabilities $35,000,000 $27,000,000 Long-Term Debt $30,000,000 $30,000,000
Total Liabilities $65,000,000 $57,000,000
Total Equity $50,000,000 $45,000,000
Total Liabilities and Equity $115,000,000 $102,000,000
• Problem
Balance Sheet
Assets 2016 2015
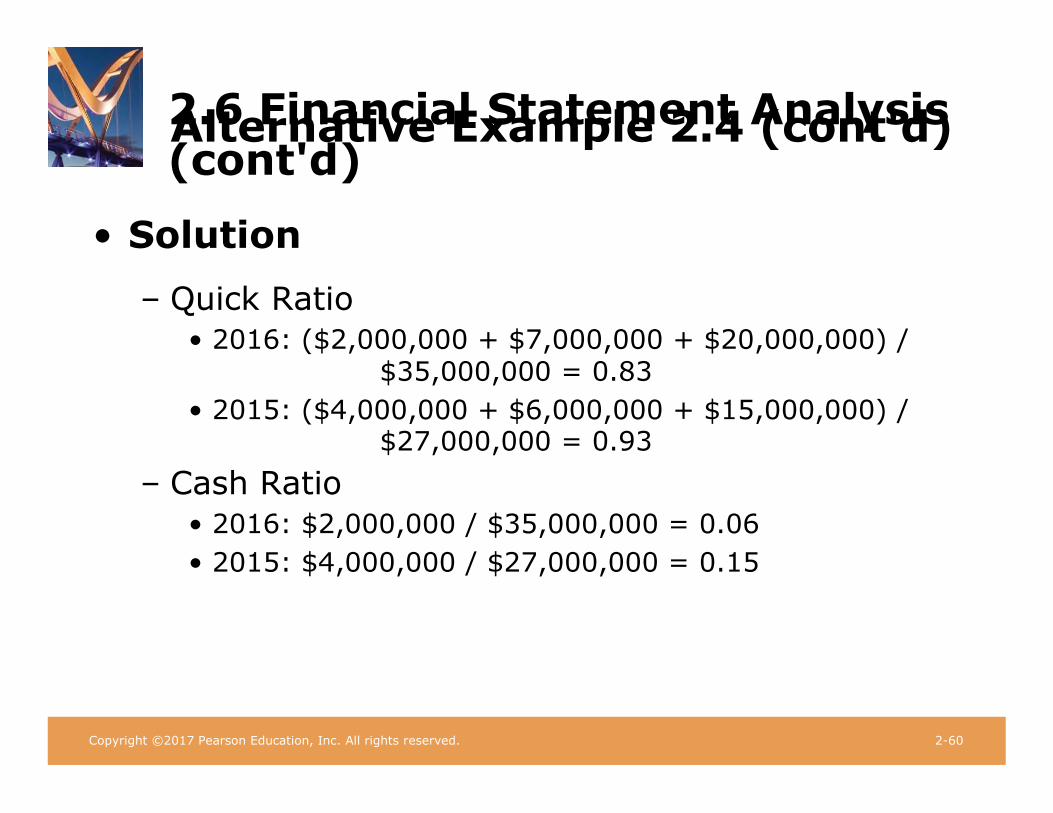
Alternative Example 2.4 (cont'd) 2.6 Financial Statement Analysis (cont'd)
Copyright ©2017 Pearson Education, Inc. All rights reserved. 2-60 Copyright ©2017 Pearson Education, Inc. All rights reserved. 2-60
• Solution
– Quick Ratio
• 2016: ($2,000,000 + $7,000,000 + $20,000,000) / $35,000,000 = 0.83
• 2015: ($4,000,000 + $6,000,000 + $15,000,000) / $27,000,000 = 0.93
– Cash Ratio
• 2016: $2,000,000 / $35,000,000 = 0.06
• 2015: $4,000,000 / $27,000,000 = 0.15
Alternative Example 2.4 (cont'd) 2.6 Financial Statement Analysis (cont'd)
Copyright ©2017 Pearson Education, Inc. All rights reserved. 2-61 Copyright ©2017 Pearson Education, Inc. All rights reserved. 2-61
– Using either measure, Rylan’s liquidity has deteriorated.
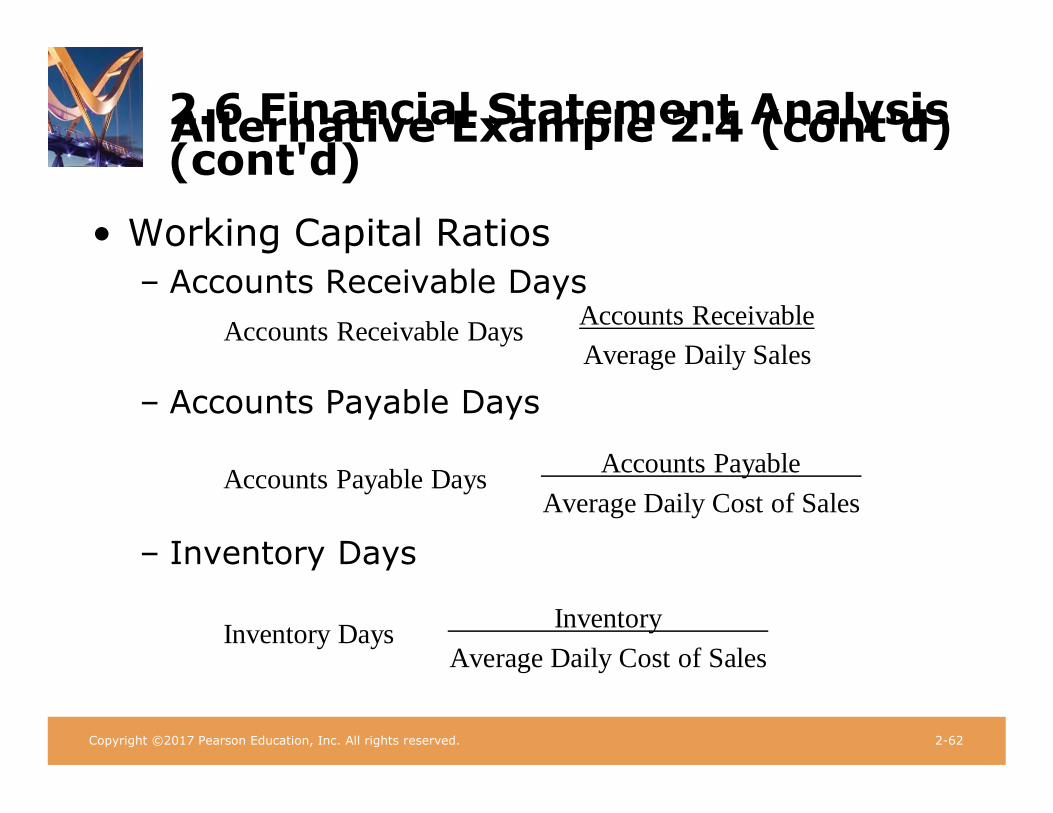
Alternative Example 2.4 (cont'd) 2.6 Financial Statement Analysis (cont'd)
Copyright ©2017 Pearson Education, Inc. All rights reserved. 2-62 Copyright ©2017 Pearson Education, Inc. All rights reserved. 2-62
• Working Capital Ratios
– Accounts Receivable Days
Accounts Receivable Days
– Accounts Payable Days
Accounts Receivable
Average Daily Sales
Accounts Payable Days
– Inventory Days
Accounts Payable
Average Daily Cost of Sales
Inventory Days Inventory
Average Daily Cost of Sales
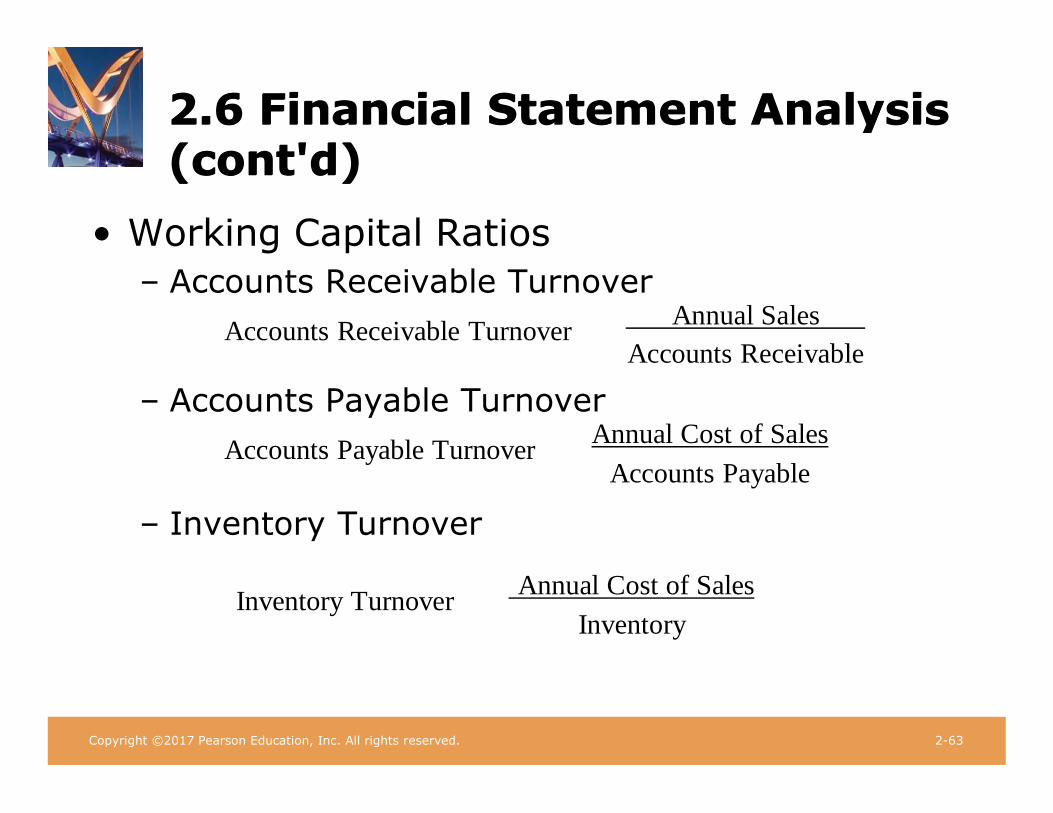
Copyright ©2017 Pearson Education, Inc. All rights reserved. 2-63 Copyright ©2017 Pearson Education, Inc. All rights reserved. 2-63
2.6 Financial Statement Analysis 2.6 Financial Statement Analysis (cont'd)
(cont'd)
• Working Capital Ratios
– Accounts Receivable Turnover
Accounts Receivable Turnover Annual Sales
Accounts Receivable
– Accounts Payable Turnover
Accounts Payable Turnover
– Inventory Turnover
Annual Cost of Sales
Accounts Payable
Inventory Turnover Annual Cost of Sales
Inventory

Copyright ©2017 Pearson Education, Inc. All rights reserved. 2-64 Copyright ©2017 Pearson Education, Inc. All rights reserved. 2-64
2.6 Financial Statement Analysis 2.6 Financial Statement Analysis (cont'd)
• Interest Coverage Ratios
– EBIT/Interest
– EBITDA/Interest
• EBITDA = EBIT + Depreciation and Amortization

Textbook Example 2.5 Textbook Example 2.5 (cont'd)
Copyright ©2017 Pearson Education, Inc. All rights reserved. 2-64 Copyright ©2017 Pearson Education, Inc. All rights reserved. 2-64
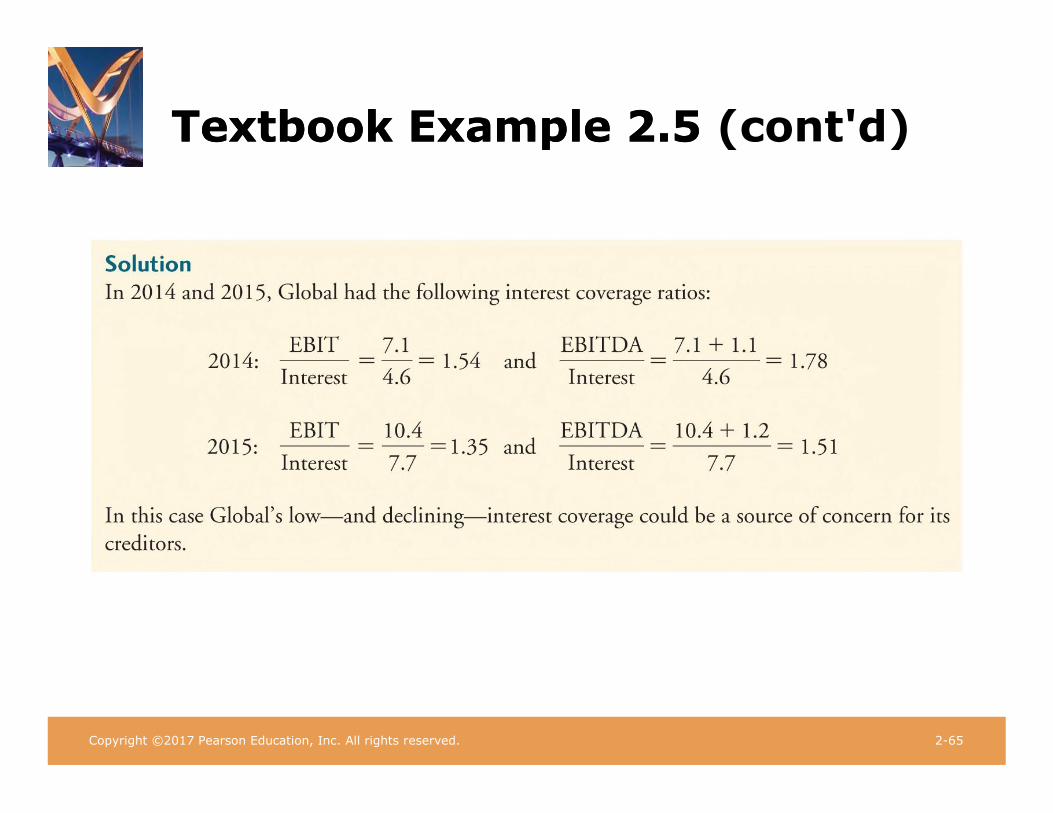
Textbook Example 2.5 Textbook Example 2.5 (cont'd)
Copyright ©2017 Pearson Education, Inc. All rights reserved. 2-65 Copyright ©2017 Pearson Education, Inc. All rights reserved. 2-65

Copyright ©2017 Pearson Education, Inc. All rights reserved. 2-66 Copyright ©2017 Pearson Education, Inc. All rights reserved. 2-66
Alternative Example 2.5 Alternative Example 2.5 (cont'd)
2016 2015
$500,000,000 $450,000,000
$225,000,000 $200,000,000
$275,000,000 $250,000,000
$150,000,000 $140,000,000
$125,000,000 $110,000,000
$25,000,000 $22,500,000
$100,000,000 $87,500,000
$10,000,000 $9,000,000
$90,000,000 $78,500,000
$36,000,000 $31,400,000
$54,000,000 $47,100,000
• Problem
– Assess Rylan’s ability to meet its interest obligations by calculating interest coverage ratios using both EBIT and EBITDA.
Income Statement
Revenues
Less: Cost of Goods Sold
Gross Profit
Less: Operating Expenses
EBITDA
Less: Depreciation
EBIT
Less: Interest Expense
EBT
Less: Taxes (40%)
Net Income
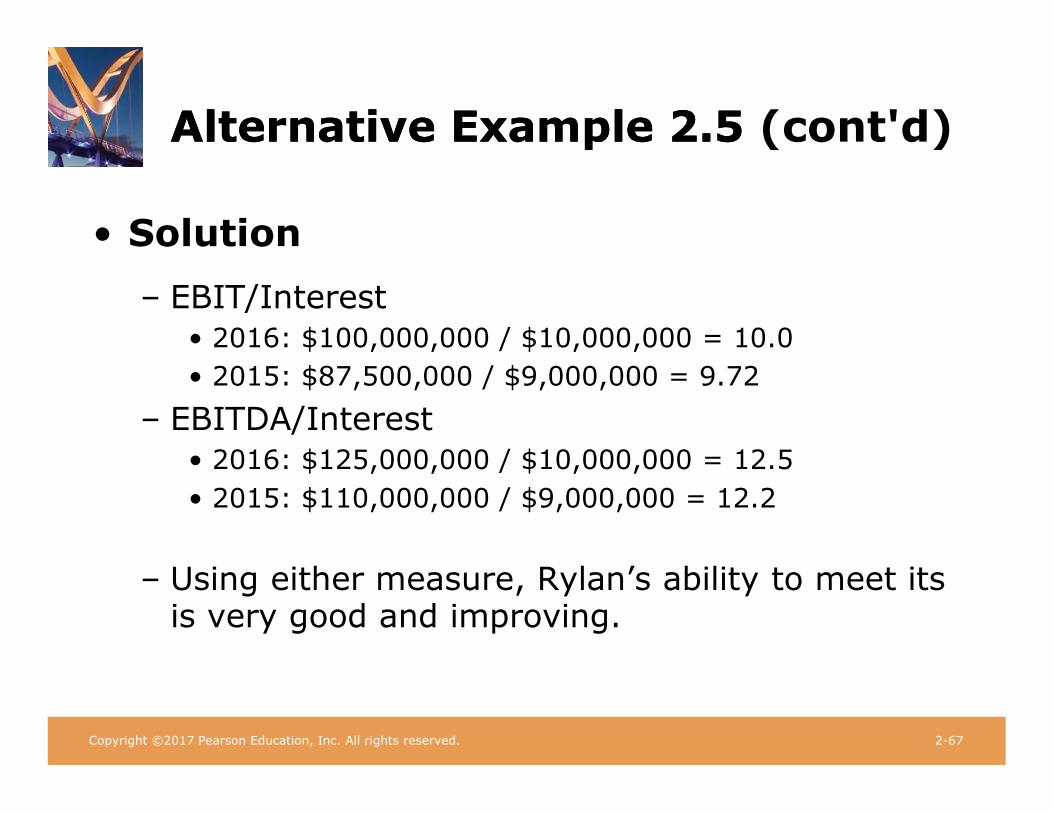
Copyright ©2017 Pearson Education, Inc. All rights reserved. 2-67 Copyright ©2017 Pearson Education, Inc. All rights reserved. 2-67
Alternative Example 2.5 Alternative Example 2.5 (cont'd)
• Solution
– EBIT/Interest
• 2016: $100,000,000 / $10,000,000 = 10.0
• 2015: $87,500,000 / $9,000,000 = 9.72
– EBITDA/Interest
• 2016: $125,000,000 / $10,000,000 = 12.5
• 2015: $110,000,000 / $9,000,000 = 12.2
– Using either measure, Rylan’s ability to meet its is very good and improving.

2.6 Financial Statement Analysis (cont'd) 2.6 Financial Statement Analysis
Copyright ©2017 Pearson Education, Inc. All rights reserved. 2-68 Copyright ©2017 Pearson Education, Inc. All rights reserved. 2-69
• Leverage Ratios
– Debt-Equity Ratio
Debt-Equity Ratio Total Debt
Total Equity
– Debt-to-Capital Ratio
Debt-to-Capital Ratio Total Debt
Total Equity + Total Debt

2.6 Financial Statement Analysis (cont'd) 2.6 Financial Statement Analysis
Copyright ©2017 Pearson Education, Inc. All rights reserved. 2-69 Copyright ©2017 Pearson Education, Inc. All rights reserved. 2-69
(cont'd)
• Leverage Ratios
– Net Debt
• Total Debt + Excess Cash & Short-Term Investments
– Debt-to-Enterprise Value
Debt-to-Enterprise Value Ratio
– Equity Multiplier
Net Debt
Market Value of Equity + Net Debt
• Total Assets / Book Value of Equity
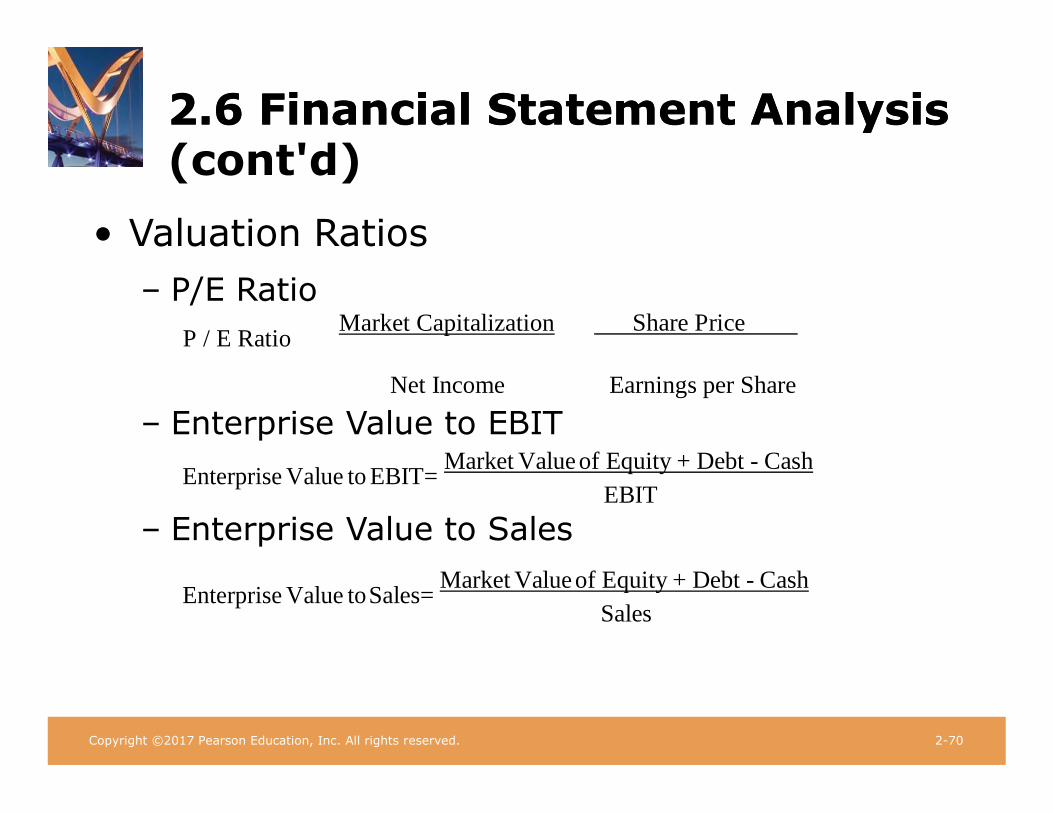
2.6 Financial Statement Analysis (cont'd) 2.6 Financial Statement Analysis
Copyright ©2017 Pearson Education, Inc. All rights reserved. 2-70 Copyright ©2017 Pearson Education, Inc. All rights reserved. 2-70
• Valuation Ratios
– P/E Ratio
P / E Ratio Market Capitalization
Share Price
Net Income Earnings per Share
– Enterprise Value to EBIT
Enterprise Value to EBIT= Market Value of Equity + Debt - Cash
EBIT
– Enterprise Value to Sales
Enterprise Value to Sales= Market Value of Equity + Debt - Cash
Sales
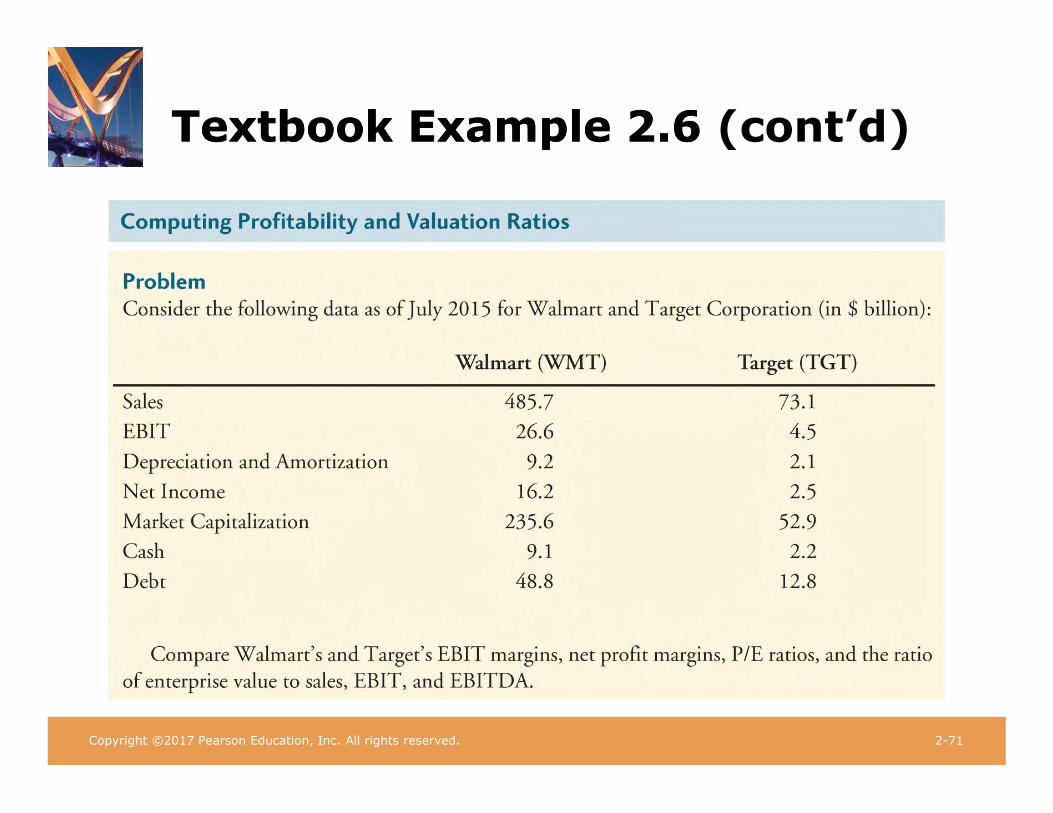
Copyright ©2017 Pearson Education, Inc. All rights reserved. 2-71 Copyright ©2017 Pearson Education, Inc. All rights reserved. 2-71
Textbook Example 2.6 Textbook Example 2.6 (cont’d)
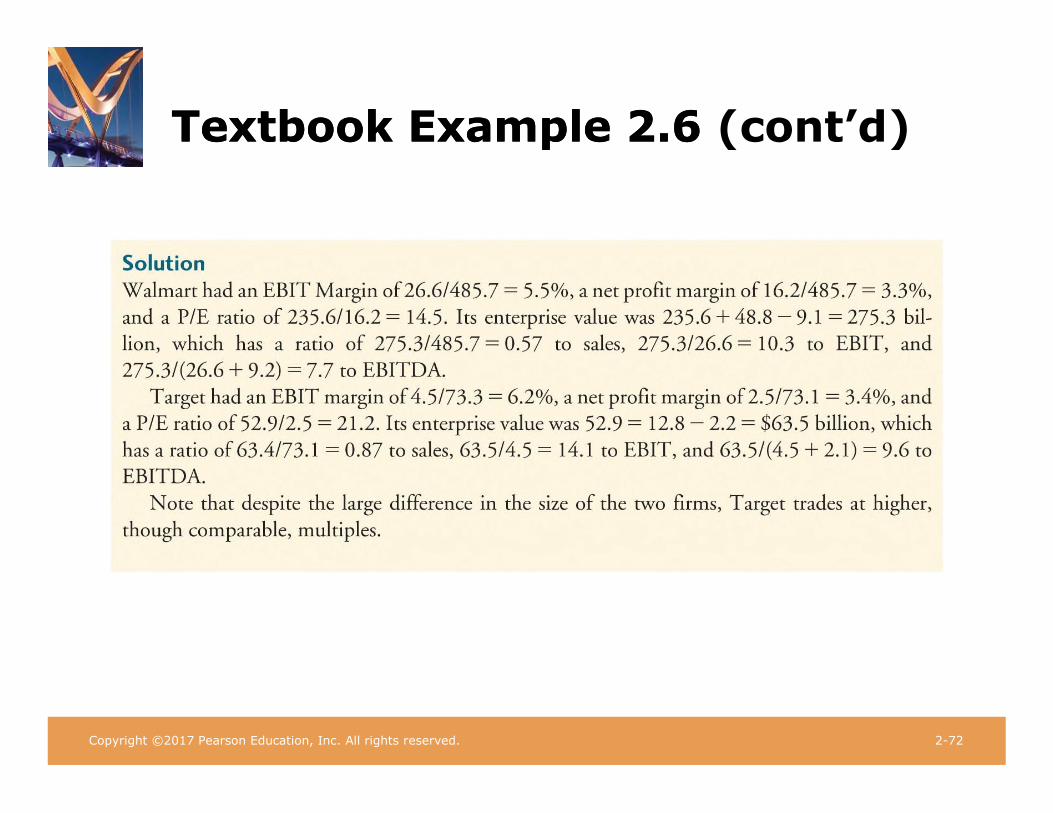
Textbook Example 2.6 Textbook Example 2.6 (cont’d)
Copyright ©2017 Pearson Education, Inc. All rights reserved. 2-72 Copyright ©2017 Pearson Education, Inc. All rights reserved. 2-72
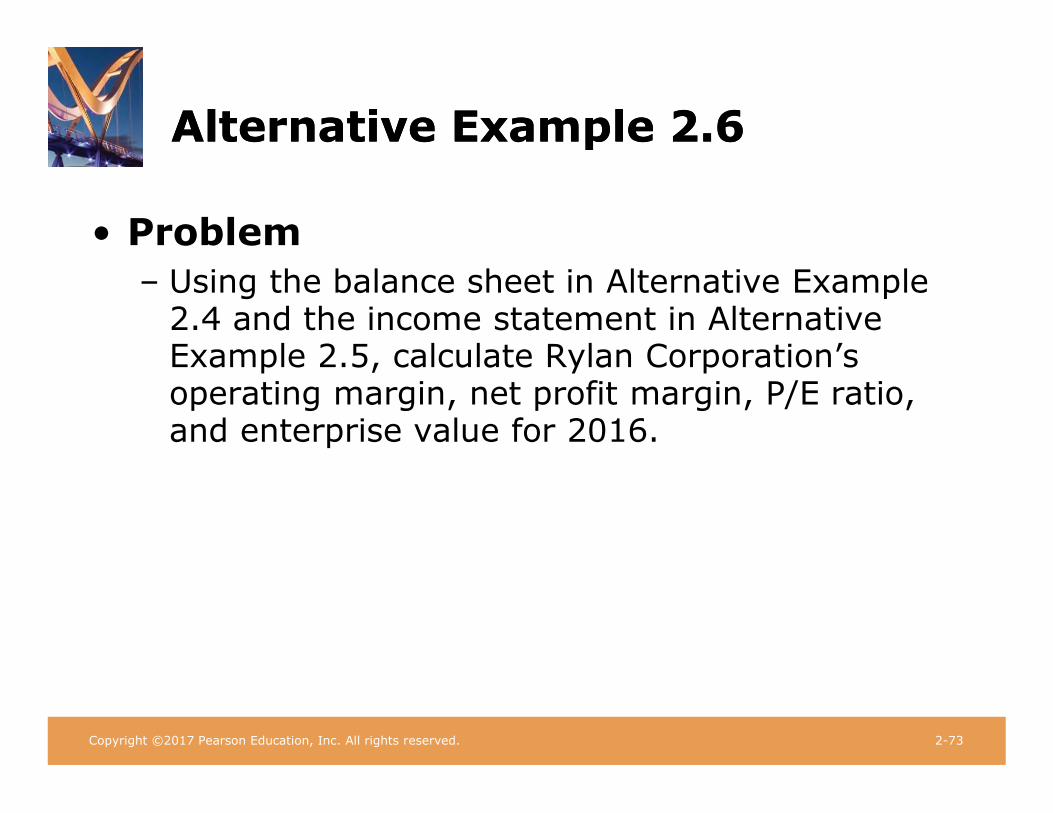
Copyright ©2017 Pearson Education, Inc. All rights reserved. 2-73 Copyright ©2017 Pearson Education, Inc. All rights reserved. 2-73
Alternative Example 2.6 Alternative Example 2.6
• Problem
– Using the balance sheet in Alternative Example 2.4 and the income statement in Alternative Example 2.5, calculate Rylan Corporation’s operating margin, net profit margin, P/E ratio, and enterprise value for 2016.

Copyright ©2017 Pearson Education, Inc. All rights reserved. 2-74 Copyright ©2017 Pearson Education, Inc. All rights reserved. 2-74
Alternative Example 2.6 Alternative Example 2.6
• Solution
– EBIT Margin = $100/$500 = 20.00%
– Net Profit Margin = $54/$500 = 10.80%
– P/E Ratio = $54/$490 = 11.02
• Recall, Rylan’s market capitalization was previously calculated to be $490 million
– Enterprise Value = $490 + $55 - $2 = $543

2.6 Financial Statement Analysis Textbook Example 2.7
Copyright ©2017 Pearson Education, Inc. All rights reserved. 2-75 Copyright ©2017 Pearson Education, Inc. All rights reserved. 2-75
(cont'd)
• Operating Returns
– Return on Equity
Return on Equity Net Income
Book Value of Equity
– Return on Assets
– Return on Invested Capital
Return on Invested Capital EBIT ( 1 - Tax Rate)
Book Value of Equity + Net Debt

2.6 Financial Statement Analysis Textbook Example 2.7
Copyright ©2017 Pearson Education, Inc. All rights reserved. 2-75 Copyright ©2017 Pearson Education, Inc. All rights reserved. 2-76
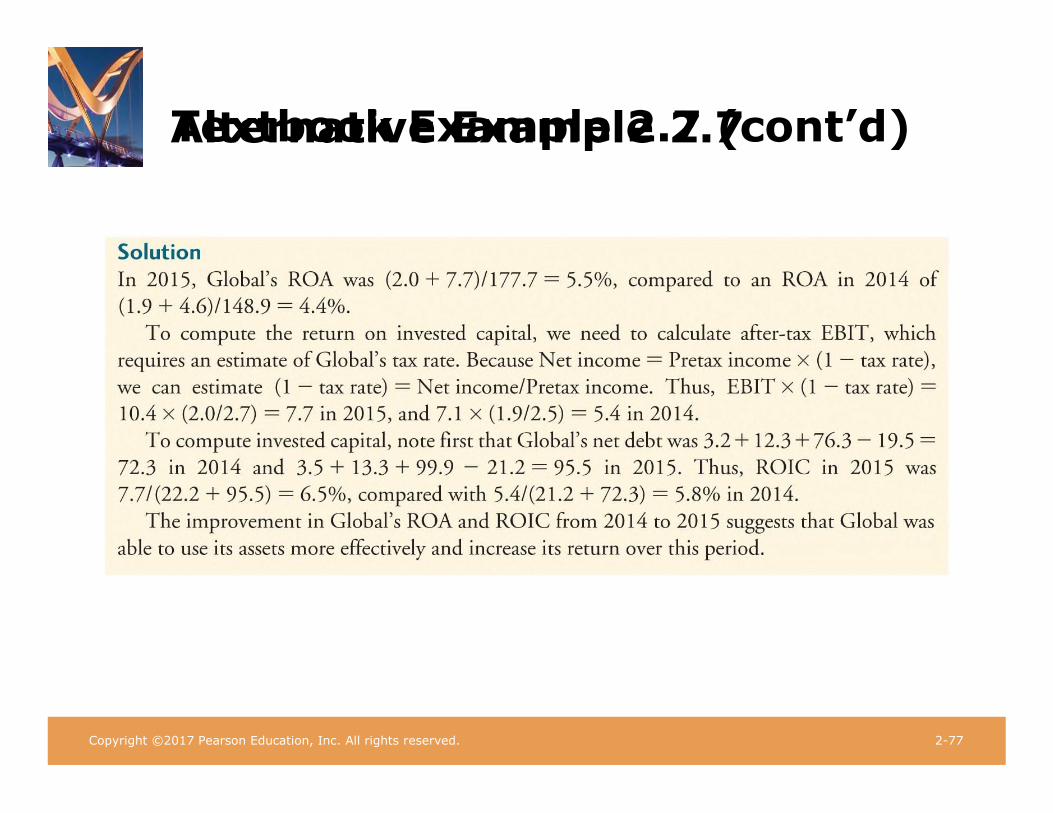
Textbook Example 2.7 (cont’d) Alternative Example 2.7
Copyright ©2017 Pearson Education, Inc. All rights reserved. 2-77 Copyright ©2017 Pearson Education, Inc. All rights reserved. 2-77

Textbook Example 2.7 (cont’d) Alternative Example 2.7
Copyright ©2017 Pearson Education, Inc. All rights reserved. 2-78 Copyright ©2017 Pearson Education, Inc. All rights reserved. 2-78
• Problem
– Using the balance sheet in Alternative Example 2.4 and the income statement in Alternative Example 2.5, assess how Rylan’s ability to use its assets effectively has changed in the last year by computing its return on assets and return on invested capital.
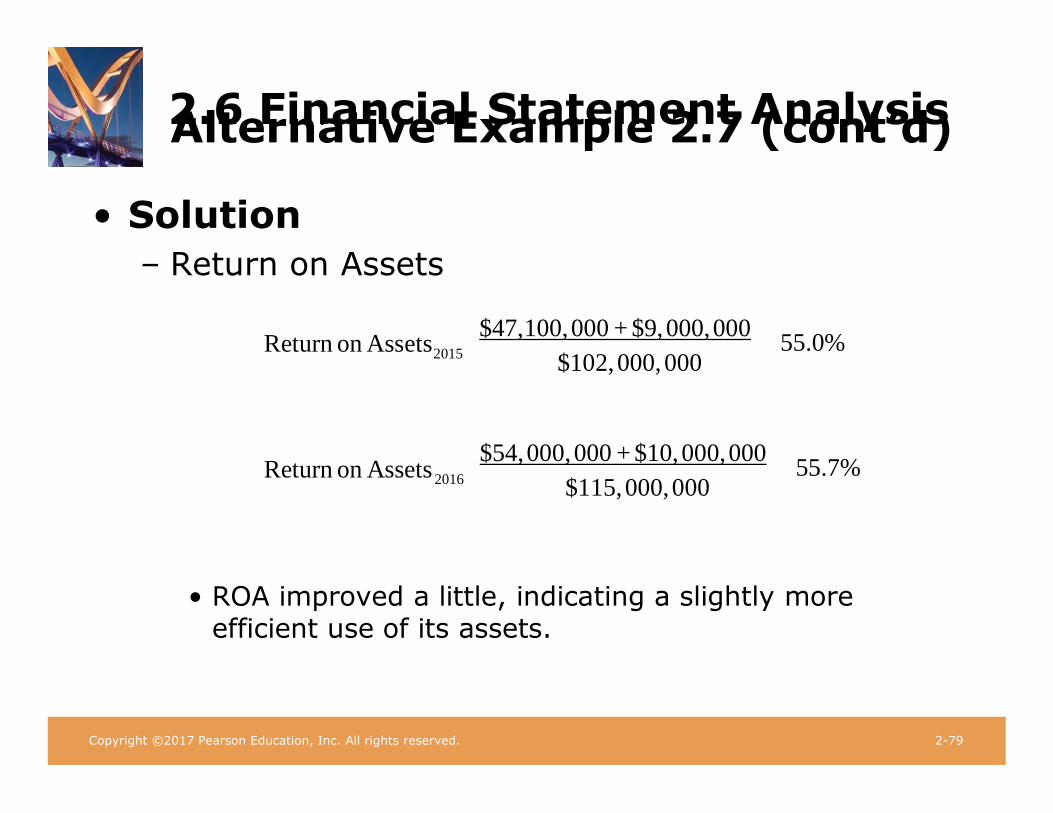
Copyright ©2017 Pearson Education, Inc. All rights reserved. 2-79 Copyright ©2017 Pearson Education, Inc. All rights reserved. 2-79
Alternative Example 2.7 (cont’d) 2.6 Financial Statement Analysis
• Solution
– Return on Assets
Return on Assets2015
$47,100, 000 + $9, 000, 000
$102, 000, 000
55.0%
Return on Assets
2016 $54, 000, 000 + $10, 000, 000
$115, 000, 000
55.7%
• ROA improved a little, indicating a slightly more efficient use of its assets.
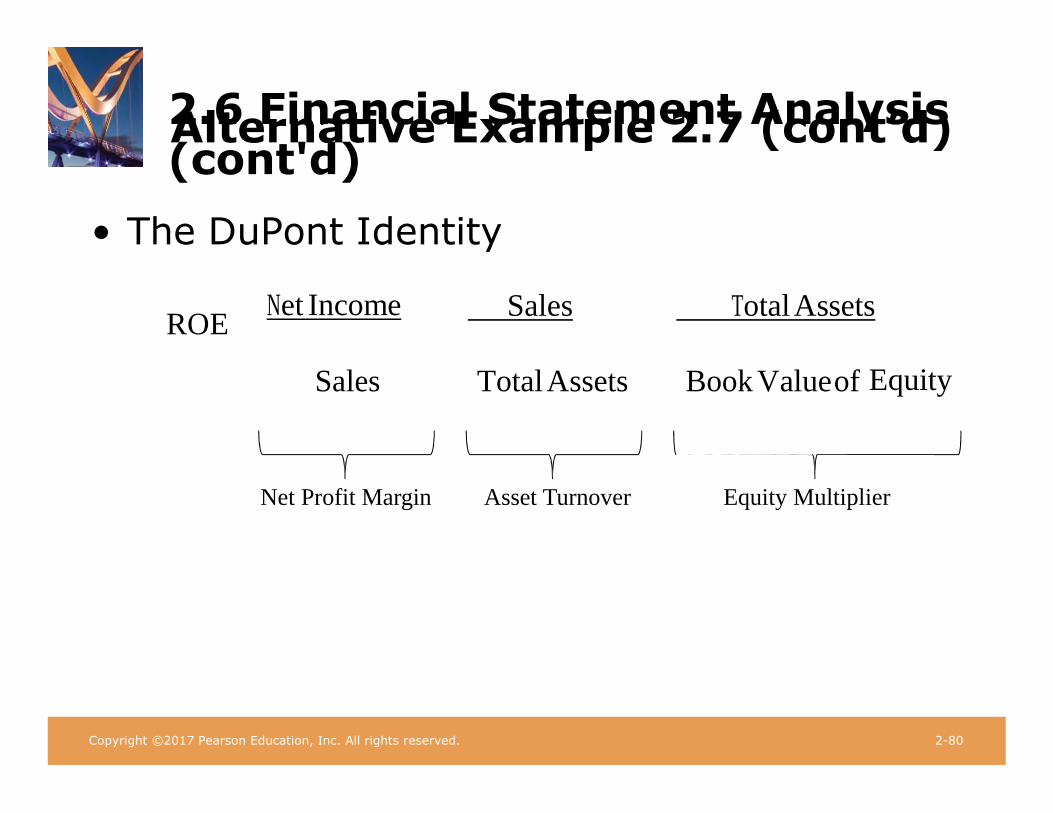
Alternative Example 2.7 (cont’d) 2.6 Financial Statement Analysis
Copyright ©2017 Pearson Education, Inc. All rights reserved. 2-80 Copyright ©2017 Pearson Education, Inc. All rights reserved. 2-80
(cont'd)
• The DuPont Identity
ROE Net Income Sales Total Assets
Sales
Total Assets Book Value of
Equity
Net Profit Margin Asset Turnover Equity Multiplier

Copyright ©2017 Pearson Education, Inc. All rights reserved. 2-80 Copyright ©2017 Pearson Education, Inc. All rights reserved. 2-81
Textbook Example 2.8 Textbook Example 2.8 (cont'd)
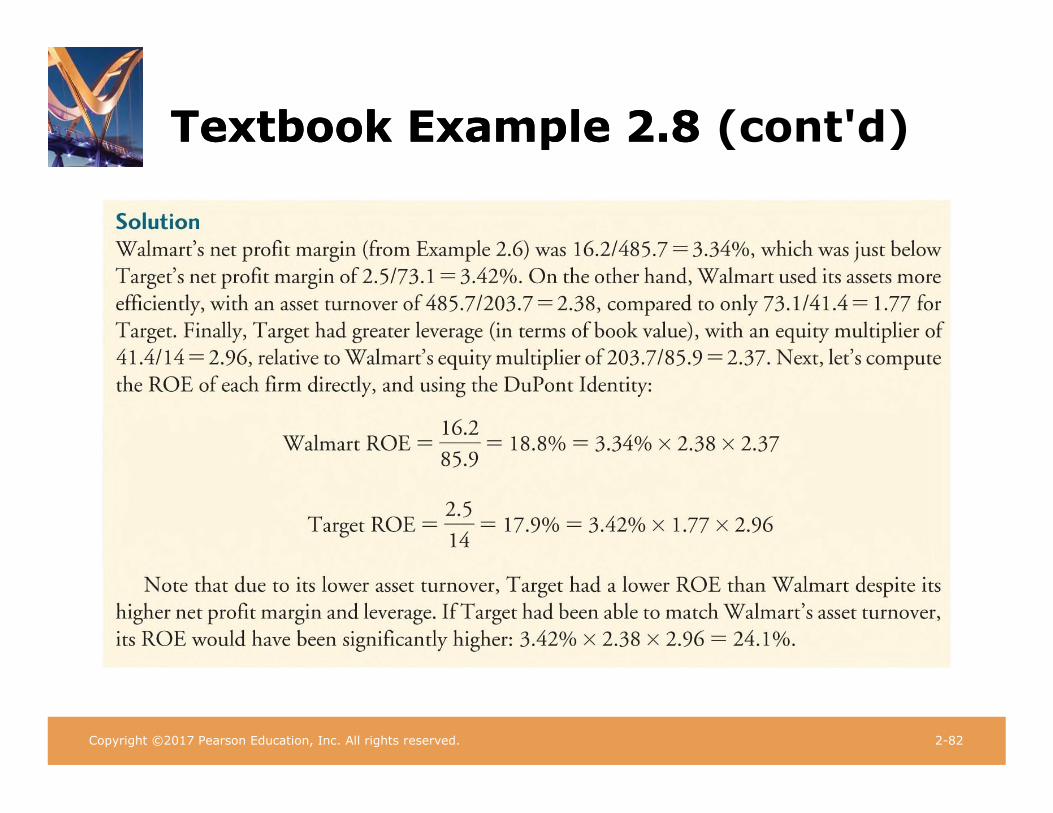
Textbook Example 2.8 Textbook Example 2.8 (cont'd)
Copyright ©2017 Pearson Education, Inc. All rights reserved. 2-82 Copyright ©2017 Pearson Education, Inc. All rights reserved. 2-82

Copyright ©2017 Pearson Education, Inc. All rights reserved. 2-83 Copyright ©2017 Pearson Education, Inc. All rights reserved. 2-83
Alternative Example 2.8 Alternative Example 2.8 (cont’d)
• Problem
– Using the balance sheet in Alternative Example 2.4 and the income statement in Alternative Example 2.5, assess Rylan’s profitability, asset turnover, equity multiplier, and return on equity in 2016.
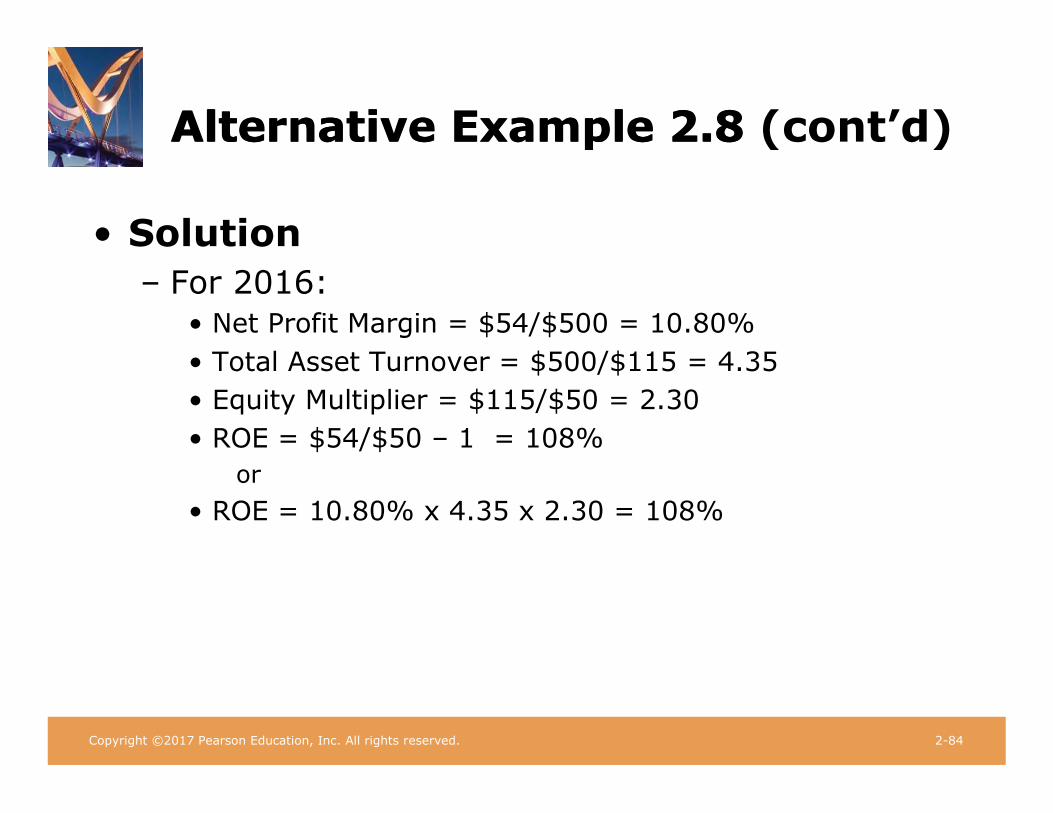
Copyright ©2017 Pearson Education, Inc. All rights reserved. 2-84 Copyright ©2017 Pearson Education, Inc. All rights reserved. 2-84
Alternative Example 2.8 Alternative Example 2.8 (cont’d)
• Solution
– For 2016:
• Net Profit Margin = $54/$500 = 10.80%
• Total Asset Turnover = $500/$115 = 4.35
• Equity Multiplier = $115/$50 = 2.30
• ROE = $54/$50 – 1 = 108%
or
• ROE = 10.80% x 4.35 x 2.30 = 108%

Table 2.4
Key Financial Ratios for Large U.S. Firms, Fall 2015

2.7 Financial Reporting in Practice
• Even with safeguards, reporting abuses still happen:
– Enron
– WorldCom
– Sarbanes-Oxley Act (SOX)
– Dodd-Frank Act
1. The book value of a company’s assets usually does
not equal the market value of those assets. What are
some reasons for this difference?
2. What is a firm’s enterprise value?
3. What is the difference between a firm’s gross profit
and its net income?
4. What is the DuPont identity?
5. What are the components of the statement of cash
flows?
6. What information do the notes to the financial
statements provide?
Corporate Finance The Core 4th Edition Berk SOLUTIONS MANUAL
Full download at:
https://testbankreal.com/download/corporate-finance-the-core-4th-edition-berk-solutions-manual/
Corporate Finance The Core 4th Edition Berk TEST BANK
Full download at:
https://testbankreal.com/download/corporate-finance-the-core-4th-edition-berk-test-bank/ corporate finance the core 4th edition pdf
corporate finance the core 4th edition ebook
corporate finance the core pdf
corporate finance berk demarzo 4th edition pdf
corporate finance, 4rd edition, by jonathan berk and peter demarzo pdf
corporate finance berk demarzo 4th edition solutions
corporate finance 4th edition berk
corporate finance 4th edition pdf