introduction - investorideas.com · final outcome of the runoff election in brazil is highly...
TRANSCRIPT


IntroductionDear client,
It has been a year since we published the first edition of our Andean Equities Guide. Overthe last year the world seems to have successfully evaded another recession, althoughglobal economic growth remains fragile and uncertain. In this international context, ourregional economies have been affected by a combination of decreasing commodity pricesand rising interest rates, raising the challenge for the companies that operate in theAndean space to create and add value for their shareholders. We have chosen this themeto be the main focus of this report, as investors we talk to increasingly seem to look forcompanies that have the ability to deliver returns above their cost of capital and to identifypositive trends with regards to this measure. Investing in the region is no longer just aboutfinding growth at the expense of accretive returns, but rather about finding a healthybalance between the two.
The Andean region witnessed two presidential elections over the last 12 months while thefinal outcome of the runoff election in Brazil is highly awaited. In Chile and Colombia, theinauguration of new governments have brought along sizable tax reforms, which areadding yet another layer of challenges to Andean corporations. After a couple of seeminglyquiet years, Peru will enter into “election mode” in 2015. A rising middle class, aware of itsrights and less tolerant on inequality, is adding new challenges to the region’s traditionalpoverty problems. Governments are challenged to explore new strategies to cope withthese novel demands and the risk of populist short sightedness, disputing power andinfluence with market supporters should be closely monitored. We believe that ourextensive local presence, including analysts who are also voters in the region, helps us tobetter understand these local processes while anticipating their outcomes.
Over the last year we gained a lot of positive notoriety as investors supported us in themost relevant surveys conducted in the local markets we cover. Our team in Colombia wasnamed the “Best Research House in Equities, Fixed Income and Economics” in a surveyconducted by the Colombian Exchange (BVC), and by Portafolio, the renowned financialnewspaper. Likewise, investors ranked our team in Peru as the 2nd best Brokerage Housein a survey by the financial newspaper, Gestion, and the consulting firm Deloitte. Finally inChile, our monthly stock picking strategy was independently tested by the newspaper, ElMercurio, as the most profitable over the first half of the year, out of a universe of 26 sell-side local equity strategies.
We highly appreciate the support our clients focused on the region are showing for ourwork. As we continue to expand our international distribution capabilities, we hope to startexperiencing a similar level of attraction among international investors.
A year ago, this report covered 71 equity issuers. Our 2015 edition includes 78 names. Ourcommitment to help our clients understand all facets of the Andean Region remains ourpriority. We look forward to investing with you in 2015!
Best regards,
Christian Laub Heinrich LessauCEO Director of ResearchCredicorp Capital Credicorp Capital
1Andean Equities Guide, 2015

ContentsAndean Equities Guide
The Andes at a glance 3Who is adding value? 4Changes in Recommendations 7
Chile: Chile Equity Strategy - Summary 8Mediocrity is in our near future 9
11Corporate Earnings reacceleration in 2015 13Decelerating profitability ratios… slight improvement in 2015 14Market Valuations and Upside Estimate 15Investment Flows 17ECM activity charging a toll 18Stocks we like in Chile 19
Colombia: Colombia Equity Strategy - Summary 20Macro: the Colombian economy continues to be the outperformer in the region 21Infrastructure: the economy’s long term engine is finally taking off 24Corporate Earnings: positive but far from homogeneous 25Market Valuations and Upside Estimation 26Investment Flows 28Recent and upcoming ECM activity 29Strategy and Top Picks 30
Peru: Peru Equity Strategy - Summary 31Macro: waiting for the rebound 32Modest growth in corporate earnings / Market valuations and IGBVL upside 33Public-Private Partnerships in 2015-16 36A word on 2016 Presidential Elections 37ECM Activity / Investment Flows and ETF volatility 38Strategy and Top picks 39
Andean: Economic Forecasts 40
Sector Overview 43 Quantitative Summary 72
Company Snapshot 80Aceros Arequipa Peru 81 Edelnor Peru 155AESGener Chile 83 EEB Colombia 157Aguas-A Chile 85 Embonor-B Chile 159AIH Peru 87 Endesa Chile 161Alicorp Peru 89 Enersis Chile 163Almacenes Éxito Colombia 91 Enersur Peru 165Andina-B Chile 93 Entel Chile 167Austral Peru 95 ETB Colombia 169Avianca Colombia 97 Falabella Chile 171Banco de Bogota Colombia 99 Ferreycorp Peru 173Banco de Chile Chile 101 Forus Chile 175Bancolombia Colombia 103 Graña y Montero Peru 177Banmedica Chile 105 Grupo Argos Colombia 179Besalco Chile 107 Grupo Aval Colombia 181Buenaventura Peru 109 Grupo Sura Colombia 183BVC Colombia 111 InRetail Peru 185Canacol Colombia 113 ISA Colombia 187CAP Chile 115 Isagen Colombia 189Casa Grande Peru 117 Latam Chile 191CCU Chile 119 Luz del Sur Peru 193Celsia Colombia 121 Milpo Peru 195Cemargos Colombia 123 Minsur Peru 197Cementos Pacasmayo Peru 125 Nutresa Colombia 199Cemex Latam Holdings Colombia 127 Pacific Rubiales Colombia 201Cencosud Chile 129 Parauco Chile 203Cerro Verde Peru 131 Quiñenco Chile 205CMPC Chile 133 Ripley Chile 207Colbun Chile 135 Salfacorp Chile 209Concha y Toro Chile 137 Santander Chile 211Copec Chile 139 Siderperú Peru 213Corficolombiana Colombia 141 SK Chile 215Corpbanca Chile 143 SM-ChileB Chile 217Cruz Blanca Chile 145 Sonda Chile 219Davivienda Colombia 147 SQM-B Chile 221E-CL Chile 149 Terpel Colombia 223Ecopetrol Colombia 151 Unacem Peru 225Edegel Peru 153 Volcan Peru 227
Politics: Bachelet returning to a moderated path?

The Andes at a glance
We are slightly optimistic on Colombia and more cautious on Peru. Chile is somewhere in between.
Understanding politics in Chile has become very relevant to investors.
Economic slowdown hit cyclical names in Peru.
SummaryAfter updating the valuation models of all corporates under our coverage and plugging innew sets of macro forecasts, over the next 12 to 18 months we are looking for rathermodest lower, double-digit upside to regional markets. We are slightly more optimistic inColombia, where we expect an upside of 13% for the Colcap though Dec 2015; upsidehere should be essentially sustained by a compelling macro story and because we believethe impact of the tax reform has already largely been priced in. The performance of the Oil& Gas sector remains a major source of uncertainty and its weight in the local index iscertainly pulling down potential upside. In Chile (upside of 13%) we maintain a neutralposition as we see tighter valuations (zero to minimum multiple expansion), an uncertainpath of economic recovery, and risk of more market unfriendly reform. Finally, we are morecautious in Peru (14% upside) where the reliance of an economic turnaround on, yet again,uncertain metal prices and infrastructure spending remains high.
For good or for bad, over the last year investors have been forced to understand and followChilean politics, which for Latin American standards had been surprisingly irrelevant to themarket over previous decades. Long standing and iconic components of the “Chileanmodel” such as a small state, low taxation, private sector involvement in regulatedindustries such as health care, education or pensions, among others, have been put underreview. Local sentiment has been particularly hit by the recent tax reform and upcomingregulatory changes, such as the announced labor reform, which will likely sustain theuncertainty.
A positive on Chile is that it is the market where we anticipate the highest corporateearnings growth in 2015 (+15%). To be fair, however, it is also the market where previousexpectations for 2014 have and will likely disappoint the most. As regulatory uncertaintysets the tone in Chile, we highlight electric utilities as a sector in which regulation will likelyunleash positive sentiment, as the government’s agenda tackles existing bottlenecks andregulatory uncertainties to approve and build new generation capacity. Consistently, ourpicks in Chile concentrate on this sector (Colbun, Enersis), in addition to banks (Santander)as well as companies with tangible earnings growth visibility (CMPC).
In Peru, over the last twelve months we have seen how investors’ concerns haveexpanded from the mining sector to names exposed to the domestic cycle. This has meantthe end of the decoupling of the mining sector from the rest of the market, unfortunatelythrough a generalized de-rating in market multiples. Consensus and our expectationssignal a re-acceleration of GDP growth in 2015; however, risks remain high, as metalprices and execution of infrastructure projects remain somewhat in the air.
3Andean Equities Guide, 2015
Andean Picks
Price Target Mkt. 12-18 Monthoct-21 Price b Upside (USD mn) 2013 2014E 2015E 2013 2014E 2015E P/BV Div Yield Tot. Upside Sector
CMPC 1,388 1,680 21% 5,946 29.7 18.9 15.9 9.0 8.8 7.7 0.7 1.9% 23% Pulp & PaperColbun 150 180 20% 4,516 63.5 17.3 15.8 15.5 10.3 9.2 1.2 1.7% 22% UtilitiesDavivienda 28,700 35,300 23% 6,238 12.3 12.6 11.2 nm nm nm 1.9 2.4% 25% BanksEnersis 182 215 18% 15,338 11.7 16.9 13.6 4.8 6.4 6.0 1.4 3.0% 21% UtilitiesInRetail 18.50 24.30 31% 1,902 81.9 27.0 23.1 12.7 12.3 10.3 1.8 0.0% 31% RetailMilpo 2.50 3.25 30% 1,145 12.8 8.1 6.1 3.6 3.9 3.2 1.9 0.4% 30% MiningMinsur 1.75 2.20 26% 1,738 6.0 8.2 8.2 2.3 4.2 4.5 0.8 2.5% 28% MiningNutresa 27,000 32,000 19% 6,017 31.9 43.5 42.0 16.5 13.2 12.6 1.6 1.7% 20% Food & BeveragesSantander 31.6 40.0 27% 10,204 13.0 11.3 11.4 nm nm nm 2.5 5.3% 32% BanksAndean Picks a 24% 53,045 29.2 18.2 16.4 9.2 8.4 7.6 1.5 2.1% 26%a Simple average, excluding Market Capitalization / b Prices in local currencies Source: Company Reports, Bloomberg and Credicorp Capital
P/E FV/EBITDA
Colombia’s GDP growth has decoupled from the region.
In this context, it is difficult to approach the Peruvian market by sectors. Mining companieswill remain subject to unpredictable metal prices while cost controls have had varyingdegrees of success (Milpo, our top pick in the sector, has excelled in terms of this metric).We also like Inretail, as its recent restructuring is allowing for earnings visibility despitemacro headwinds. Luz del Sur remains a defensive play with an interesting growth story.
Colombia’s GDP trajectory has decoupled from the region on the back of continued fiscalspending, both at the central and regional levels; robust private consumption has also beenstrong, fueled by record-low unemployment levels. This stellar position, however, will nottranslate into robust earnings growth in 2015 as declining oil prices may hit the everprevalent Oil &Gas sector and, more importantly, because the government will collect thebulk of earnings growth on the back of the ongoing tax reform. All investors will be left withis a meager 2% growth (compared to our estimated 7% no-tax reform growth).
A note must be said on the tax reforms in Chile and Colombia. Although their simultaneityraises the temptation to look for similarities, it is important to draw important differencesbetween the two. In Chile, the inspiration has been a larger state that takes over moreresponsibilities and partly or totally replaces the private sector in industries such aseducation, health care, and pensions. In Colombia, the driver of the reform has beenprimarily a commitment to fiscal rule coupled with growing fiscal needs and potentiallydeclining oil revenues. While in Chile the current center left government never faced aserious challenger in the elections, in Colombia the runoff elections was held between twomarket friendly candidates. This distinction is important.
We continue to like exposure to Colombia’s sound internal demand cycle through thebanking industry. Following a successful rotation in this sector, we now favor Davivienda.Also, we like Nutresa for its dominant market position and the uniqueness of its exposureto consumption. Finally, in a more speculative note, we are favoring Pacific Rubiales onhigher earnings visibility in the sector and probable M&A activity.
Who is adding value?Slowing economies, declining export prices and rising interest rates all mean importantchallenges for companies and their ability to add value. As it happens, put all together thechallenge amounts to an even more difficult task. Not surprisingly, investors areincreasingly looking beyond traditional growth and value approaches, privilegingcompanies with ability to deliver returns above their cost of capital in their stock selectionprocesses.
To come up with some useful metrics, we measured all our companies according to theirability to add value (ROIC – WACC and ROAE – Ke), and tried to identify companies withinteresting trends of improvements in these metrics.
The matrices below summarize our findings. Either on a ROIC or a ROAE basis, the x-axisscores companies by value creation and the y-axis scores according to their momentum(2015E returns – 2013 returns) in an attempt to identify interesting recovery (anddeterioration) trends.
4Andean Equities Guide, 2015

In the case of Chile, 53% of companies under our coverage are currently generatingnegative value for shareholders and a showing negative trends looking forward (bottom leftof tables) In the opposite case, companies located in the upper right quadrants are postingreturns above their cost of capital and equity, respectively. Moreover, these firms (47% ofcoverage) are also showing improvements in these metrics looking forward. Differencesbetween the two charts basically reflect the impact of each company’s capital structure.
In Colombia, we highlight the case of Canacol as a stock experiencing a huge recovery inROIC (placed to the right of the ROIC chart – left chart) although its absolute ROICremains below its cost of capital (negative value on the y-axis – right chart). Meanwhile, acompany, such as ETB ranks low on ROIC and ROAE, but also in terms of momentum,reflecting the capex intensive stage of its business plan.
AES Gener
Aguas-A
Andina-B
Banco de Chile
Banmedica
BesalcoCAP
CCU
Cencosud
CMPC
Colbun
Concha y Toro
CopecCorpbanca
Cruz BlancaE-CL
Embonor-B
EndesaEnersis
Entel
Falabella
Forus
Latam Airlines
Parque Arauco
RipleySalfacorp
Santander
SK
SM Chile-B
Sonda
SQM-B
-0.16
-0.12
-0.08
-0.04
0.00
0.04
0.08
0.12
-0.08 -0.06 -0.04 -0.02 0.00 0.02 0.04 0.06 0.08 0.10
ROAE
201
5E -
Ke(B
p)
ROAE 2015E - ROAE 2013 (Bp)
Sustained value added
AES Gener
Aguas-A
Andina-B
Banco de ChileBanmedica
Besalco
CAP
CCU
Cencosud
CMPC
Colbun
Concha y Toro
CopecCorpbanca
Cruz Blanca
E-CL
Embonor-B
Endesa
Enersis Entel
Falabella
Forus
Latam Airlines
Parque Arauco
RipleySalfacorp Santander
SK
SondaSQM-B
-0.11
-0.05
0.01
-0.13 -0.08 -0.03 0.02 0.07 0.12 0.17
ROIC
2015
E -W
ACC
(Bp)
ROIC 2015E - ROIC 2013 (Bp)
Chile – Value added analysis; returns and momentum
Colombia – Value added analysis; returns and momentum
Recovery
Sustained value added
Recovery
5Andean Equities Guide, 2015
Avianca
BVC
Canacol
Celsia
Cemargos
CLH
Ecopetrol EEB
ETB
Éxito
Grupo Argos
ISA
Isagen
NutresaPacific Rubiales
Terpel
-0.08
-0.05
-0.02
0.01
0.04
0.07
-0.05 0.00 0.05 0.10 0.15 0.20
ROIC
2015
E -W
ACC
(Bp)
ROIC 2015E - ROIC 2013 (Bp)
Recovery
Contraction Sustained value added
Avianca
Banco de BogotáBancolombia
Celsia
Cemargos
Cemex Latam Holdings
Ecopetrol EEB
ETB
Éxito Grupo Argos
Grupo Aval
Grupo Sura
ISA
Isagen
NutresaPacific Rubiales
Terpel
-0.13
-0.09
-0.05
-0.01
0.03
0.07
-0.07 -0.03 0.01 0.05
ROAE
2015
E -K
e (B
p)
ROAE 2015E - ROAE 2013 (Bp)
Recovery
Contraction Sustained value added

Most companies that rank well on both ROIC and ROAE metrics in Peru are in the utilitiessector, reflecting their defensive nature. Consistently, they cluster around zero in the x-axis, reflecting stability in ROIC and ROAE. In this context, we highlight our top pick, Luzdel Sur. Milpo, also a top pick, ranks high in value addition and is placed on the far right ofthe charts, reflecting rapidly recovering ROIC and ROAE levels since 2013.
Aceros Arequipa
AIH
Alicorp
Austral
Buenaventura
C. Pacasmayo
Casa Grande
Edegel
EdelnorEnersur
Ferreycorp
Graña y Montero
In Retail
Luz del Sur
Milpo
MinsurSiderperu
UnacemVolcan
-0.12
-0.08
-0.04
0.00
0.04
0.08
0.12
-0.10 -0.04 0.02 0.08
ROIC
2015
E -W
ACC
(Bp)
ROIC 2015E - ROIC 2013 (Bp)
Recovery
Contraction
Sustained value added
Aceros Arequipa
Alicorp
Austral
Buenaventura
C. Pacasmayo
Casa Grande
Cerro Verde
Edegel
Edelnor
Enersur
Ferreycorp
Graña y Montero
In Retail
Luz del SurMilpo
Minsur
UnacemVolcan
-0.11
-0.07
-0.03
0.01
0.05
0.09
0.13
-0.10 -0.06 -0.02 0.02 0.06 0.10RO
AE 20
15E
-Ke
(Bp)
ROAE 2015E - ROAE 2013 (Bp)
Recovery
Contraction Sustained value added
Peru – Value added analysis; returns and momentum
6Andean Equities Guide, 2015

Changes to recommendations in this report
Company Country Rating Target Price Rating Target PriceAndina Chile Uperf 1,990 Hold 2,500*Austral Peru Hold 2.40 Buy 3.00 *Bancolombia Colombia Hold 33,200 Buy 35,000Celsia Colombia Hold 7,020 Buy 7,120*Cemargos Colombia Hold 11,300 Uperf 9,950*Cencosud Chile Uperf 1,765 Hold 1,950CLH Colombia Hold 20,100 Uperf 20,100Copec Chile Hold 8,000 Buy 8,500*Cruz Blanca Chile Hold 564 Uperf 430*Davivienda Colombia Buy 35,300 Hold 36,600EEB Colombia Buy 1,930 Hold 1,800*Embonor Chile Hold 1,090 Buy 1,510*Éxito Colombia Hold 32,800 Uperf 33,000Isagen Colombia Buy 3,280 Hold 3,060*Latam Airlines Chile Uperf 7,250 Hold 8,000*Luz del Sur Peru Buy 10.97 Hold 10.07 *Milpo Peru Buy 3.25 Hold 2.90 *Ripley Corp. Chile Uperf 347 Hold 370SiderPeru Peru Hold 0.35 Uperf 0.35 *SQM Chile Hold 15,000 Uperf 15,000*
New Old
Andean Equities Guide, 2015
* 2014YE Target Price
7
Chile Equity Strategy
Our 2015YE IPSA target implies an upside of 13%.
Our Top Picks in Chile include: CMPC, Colbun, Enersis and Santander.
GDP to recover in 2015, driven by exports and public spending.
Corporate earnings reacceleration in 2015 – downside risk remains.
Valuations mostly in line with historical averages; pressure by uncertainty in macro and political environment.
SummaryWe remain neutral on Chile in the context of the Andean Region. Short term macroheadwinds and uncertainty regarding future reforms pose a downward risk to our otherwisepositive view on corporate earnings growth. In this sense, we continue to expect highvolatility in Chile’s equity market as long as political/regulatory risks remain. Also, there isvery limited room for market-multiples expansion, in our view. We are introducing a YE2015 target for the IPSA index of 4,300 points, implying an upside of 13%. Our top-picksfor Chile are mostly defensive plays and companies where we see higher earnings visibility(financials, utilities and forestry) over the next twelve months.
Our strategy in Chile is summarized in the points below:
Weak macro picture. Consensus GDP growth figures for Chile have been reviseddownward multiple times during the year, now in the range of 2% for 2014. For 2015we expect a slight recovery in economic activity (3.3%), driven by the positiveimpact of currency depreciation on exports and an increase in public spending.Inflation is likely to remain above the Central Bank target during 1H15; however,lower domestic demand, FX appreciation, and lower oil prices should drive inflationto 3.2% by 2015YE.
Accelerating corporate earnings. Despite a weak expected 2H14 in terms of profitgrowth, corporate earnings in Chile should reaccelerate in 2015. We expect resultsto be driven by electric utilities, retail, and forestry. Although an important part ofearnings growth in 2015, will likely be driven by non-operational effects, we are stillexpecting a 9% growth in EBITDA of our universe. We are looking for an aggregatecorporate earnings growth of 8% and 15% in 2014 and 2015, respectively.
Fair valuations. According to our corporate sample (95% of the IPSA), the marketis trading at 15.8x and 8.7x 2015E P/E and 2015E FV/EBITDA, respectively. Thesemultiples are mostly in line with the IPSA’s historical averages (since 2000) and alsoimply a moderation of the premium with respect to Latam, which in our view is fair,considering the weak macro scenario and ongoing regulation and politicaluncertainty. This picture results in limited room for multiple expansion as implied byour 2015YE target.
Regulatory uncertainties stemming from a number of potential reforms.President Bachelet’s second term has been characterized by structural, politicalreforms. The tax reform has already been approved, and in her agenda there arenow plans to introduce new regulation on the labor market and in sectors such as,health insurance and in pension funds; however, given her low popularity in recentpolls, we believe there are incentives for the government to seek higher levels ofbilateral support in upcoming reforms.
Negative flows. Low traded volumes in Chilean equities continue, reflecting in partweak domestic demand—AFPs, Mutual Funds have accumulated net divestmentsover the last 12 months—while foreign investors have driven flows during the year.
ECM activity. Although lower than in 2013, ~US$5.7bn in equity offerings haveoccurred during 2014 YTD. Looking forward (through year end and into 2015), themarket is expected to face close to USD 4.0bn in announced capital increases andtender offers.
Andean Equities Guide, 2015 8

Chilean economy slowdown has been deeper and larger than initially expected.
The Central Bank has adopted a dovish policy, cutting the reference rate by 200 bps.
Mediocrity is in our near futureThe slowdown in the Chilean economy has been deeper and larger than initially expected;growth forecasts have consistently corrected downwards by more than 2.0% thus far in2014. Investment contraction has been the trigger for lower economic dynamism, leadingto a slowdown in the labor market and in private consumption. Although we expect betterfigures in the coming quarters, a recovery towards higher growth rates should take time.
Chile – GDP (y/y %) Chile – Investment (y/y %)
Sources: Central Bank of Chile and Credicorp Capital
Chile’s economy grew 2.2% (real) during 1H2014, mainly driven by consumption (3.1%)and exports (1.6%), offset by a meltdown in investment (-6.8%). Although the leadingactivity indicator has shown a downward trend through August (0.3% y/y), we forecast2.0% growth for 2014, implying a slight recovery in private investment and the positiveimpact of a depreciated currency on exports.
Investment is the main drag on current and future Chilean growth. After three years ofgrowth over 10% y/y, investment started to weaken during 2013 and has continued to fallshowing negative figures in the last four quarters. There are several factors behind thischange: (1) the end of the mining “cycle”, affecting global mining investments, (2) the endof infrastructure reconstruction due to capital destruction from the 2010 earthquake, (3)rising energy costs that affected the competitiveness of various economic sectors, and (4)the negative impact from the tax reform, due to higher corporate tax and uncertainties thatarise from the discussion of a wide range of reforms. We forecast that investment willrecover over the following quarters, due to a lower base of comparison, the end of politicaluncertainties after the tax reform approval, the significant increase in public investment(according to 2015 budget), and the effect of lower interest rates.
The logical consequence has been a deceleration in private consumption. Lowerinvestment has gradually transformed into higher unemployment and lower growth in realwages, affecting consumer expectations. We expect that this situation should continue tounwind in the coming months and we do not anticipate a recovery in householdconsumption until 2H15.
To fight this fragile situation, the Central Bank has adopted an expansive policy, cutting thereference rate by 200 bps over the last twelve months, reaching 3.0%. We do not expectfurther TPM cuts, due to elevated inflation and due to the fact that, according to ourjudgment, more policy rate cuts would have had a limited effect on economic activity (realinterest rate is already negative). Therefore, we expect that the policy rate will likely remainat 3% for the majority of 2015.
2.03.3
-2-101234567
-2-101234567
2006 2007 2008 2009 2010 2011 2012 2013 2014 2015
-6.1
3.8
-15
-10
-5
0
5
10
15
20
-15
-10
-5
0
5
10
15
20
2006 2007 2008 2009 2010 2011 2012 2013 2014 2015
Andean Equities Guide, 2015 9

The expansionary monetary policy has caused a large depreciation over the Chilean peso.
For 2015 we expect a recovery in economic activity (3.3%).
Chile - Consumption (y/y%) Chile – Unemployment (%) .
Sources: Central Bank of Chile, National Institute of Statistics and Credicorp Capital
There has also been an effort on the fiscal front to spur growth. In October, the governmentannounced a 2015 fiscal budget 9.8% higher than 2014, implying an estimated deficit of1.9%. Most of this expansionary spending will be supported by new tax revenues (US$2.3bn). The main surprise includes public investment increasing 27.5% y/y, likelytranslating into139,000 new jobs during 2015 albeit 30,000 more public jobs versus 2014.
The expansionary monetary policy and a stronger dollar has driven depreciation in theChilean peso (11% YTD). We expect than the CLP/USD will appreciate over the next 12months due to the current level of the real exchange rate and expectations of highergrowth.
FX depreciation has been the main cause of a higher inflation during the year, rising from1.5% y/y to 4.9% y/y in the last 12 months, including an increase in tradable inflation by4.8%. We forecast that inflation will remain above the Central Bank’s target range (2% -4%) during 1H2015 due to rising exchange rate and the tax reform effect; however slowingdomestic demand, lower exchange rates, and weaker oil prices should generate lesspressure on prices during 2015 (2015YE estimate of 3.2%).
For 2015, we expect a slight recovery in economic activity (3.3%) driven by the positiveeffect from FX depreciation over exports and more public spending. Private investmentshould follow the lead. We expect private consumption to exhibit a lag in its recoveryrelative to the other GDP components.
Chile – Inflation (y/y %) Chile - Exchange Rate
Sources: Central Bank of Chile, National Institute of Statistics and Credicorp Capital
2.7 3.0
-2
0
2
4
6
8
10
-2
0
2
4
6
8
10
2006 2007 2008 2009 2010 2011 2012 2013 2014 2015
6.87.5
5
6
7
8
9
10
11
12
5
6
7
8
9
10
11
12
2006 2007 2008 2009 2010 2011 2012 2013 2014 2015
4.53.2
-2
0
2
4
6
8
10
-2
0
2
4
6
8
10
2006 2007 2008 2009 2010 2011 2012 2013 2014 2015
580565
450470490510530550570590610630650
450470490510530550570590610630650
2006 2007 2008 2009 2010 2011 2012 2013 2014 2015
Andean Equities Guide, 2015 10

The government’s reform proposals have triggered a heated debate.
Service related sectors to be impacted by labor reform.
Politics: Bachelet returning to a moderated path?
Michelle Bachelet started her second term in presidency claiming she would push forradical transformations. Thus far, her first year of the presidency has been rocky. Politicaltremors have been strong as the government’s tax and other political reform proposalshave produced strong opposition in business circles, as well as in the president’s coalition,where the moderate sector of the coalition has questioned the proposals. The wide rangingreforms have triggered a heated debate, particularly in the private sector and right-wingpoliticians, who have argued that the new proposals would continue to generateuncertainty and would be a further drag on the economy, potentially increasingunemployment. All this political noise has generated uncertainty and volatility in the shortterm, but could end up being positive in the medium-long term as long as the governmentlooks to maintain higher approval ratings. This could in turn lead to more moderatereforms, as was the case of the recently approved tax reform.
Tax reform as major success of the presidency. The reform expects to collect a total ofUSD 8.3bn or roughly 3% of total, estimated GDP. As previously disclosed, the reform willincrease corporate tax rates from 20% to 25% or 27%, depending on which taxing schemethe companies adopt. An important immediate effect of this reform is the impact ofdeferred taxes, which for most companies will likely be reflected in 3Q14 numbers. In 2012,when taxes were adjusted from 17% to 20%, companies recognized this onetime non-cashloss/gain as an addition to their tax expense during 3Q12. In contrast, this time, the impactof deferred taxes will not be recognized on the income statement, but only on the balancesheet, through an adjustment in equity. This effect is non-cash and therefore will not affectthe cash flow of companies under our coverage. For a detailed analysis on the impact ofthe tax reform, please see our report Tax Reform – Measuring its impact on the IPSA,published on July 14th, 2014.
Still, Ms. Bachelet faces important challenges in order to fulfill other promises. There are anumber of other reforms in the government’s agenda, which haven proven trickier thanwhat the government originally expected. Some have to be sent to Congress, while othersare still entangled in doubts and discussions.
Service related sectors, such as construction, financials and health, which are highly laborintensive, could be some of the most exposed sectors to new regulation. The governmentplans to make a substantial transformation of labor laws, which would empower unions andaffect productivity. Main topics currently being discussed include the end of replacementduring strikes and stronger unions. These measures, together with the multi-rut bill and thepension fund reform (which could establish that the employer should contribute to workerssavings) will most likely imply cost pressures for Chilean companies in the following years.In 2013, labor costs of publicly listed Chilean companies represented around 15% of totalrevenues, with service related companies averaging 27.5%. Thus, we should expect amore pronounced effect in these particular sectors if the reform is passed. However, afterpolitical confrontation resulted from the tax reform (and its toll on government’s approval), itseems likely that the government will somehow moderate its positions. We believe amoderation of position could limit the potentially damaging labor agenda. The degree ofsuch an increase is subject to the level of consensus that may be reached in thenegotiations. For a more detailed analysis on the labor reform, please see our report LaborReform is next on the agenda, published on October14th, 2014.
Andean Equities Guide, 2015 11

Potential new regulation on health insurance and provision.
Government’s explicit support to the energy sector.
President Bachelet’sapproval rating reached its lowest level in September.
In addition, the health sector could be further impacted by sector specific regulations, asthe government plans to introduce changes to the private health sector. Most recentproposals involve dividing the 7% individual wage contribution in three: i) a unique socialsecurity plan (PPS), ii) a unique fund to manage and pay medical leaves, and iii) a jointfund between private and public health systems to finance drugs, which could also financeorphan diseases. The most important change, would be the implementation of the PPS,which involves a similar coverage between Isapre and Fonasa financed with the 7% wagecontribution. If private health members want to extend coverage, they would have to pay afixed premium for a complementary insurance offered by private health companies. Theproposal has been already presented to President Bachelet , which together with theMinistry of Health, should now draft a law, which will need to be voted in the Congress. Webelieve share prices in the sector are already reflecting this potential new regulation.
In contrast, private companies in the energy sector, have received the government’sexplicit support, and we believe will be benefited form new regulation. Unlike Piñera’sadministration, President Bachelet’s government has clearly stated that it has concretemeasures to deal with the country’s challenging, energy situation, as was affirmed in thegovernment’s energy agenda. Furthermore, Ms. Bachelet has continued to reaffirm hervision with the industry’s primary participants, stating that the state will take a pro-investment role, aiming to support private initiatives while also ensuring that potentialexternalities affecting local communities are taken into consideration (source of delays).For a detailed analysis on the government’s agenda, please see our report Bacheletpresents Energy Agenda, published on May 15h, 2014.
In the context of all these political debates, the highly confrontational discussion of the taxreform, the ongoing economic slowdown and evidence of frictions within the rulingcoalition, have been turning opinion against the President and her reforms. In fact,President Bachelet’s net approval levels (approval minus disapproval) have beenconstantly declining ever since she took office in March 2014. In September, approvalreached its lowest level while disapproval peaked at 45%. At the same time, confidence inthe government’s economic management has taken a similar path.
Chile – Michelle Bachelet’s approval
Source: Adimark
Following these weaker support levels, Ms Bachelet is showing signs of returning to amoderated, political path. The more radical scenario we thought we would have whenPresident Bachelet was elected, has been reflected more on her speeches than in theactual reforms. Thus we believe the government will now seek higher levels of bilateralsupport to upcoming reforms. This would be a return to the consensus-driven style that Ms.Bachelet very successfully deployed during her previous term, allowing her to leave officewith 70% popularity.
54 53 56 5854
49 47
2032 31 32 36
41 45
10203040506070
Mar-14 Apr-14 May-14 Jun-14 Jul-14 Aug-14 Sep-14
% Approval% Disapproval
Andean Equities Guide, 2015 12

Weak 2H14 earnings; earnings reaccelerating in 2015.
Corporate Earnings reacceleration in 2015After four quarters of positive growth in corporate earnings, our sample of companies (95%of the IPSA), should show weak EPS growth during 2H14. Positive results during pastquarters were primarily driven by a weak comparison base and the positive impact ofinflation on financial sector results. In line with this, results during 2H14 should likely beaffected by tougher comps and a normalization in inflation. During 2014, after disappointingmacro figures and potential impact of political reforms, we have constantly reviseddownwards our earnings estimates for the year. We are now expecting corporate earningsin our sample to grow by 8% for the full year.
For 2015, we are expecting earnings growth to accelerate to a pace of 15% (in CLP);however, an important part of this growth will be non-operational. In operational terms, weare estimating EBITDA growth of 9% y/y. However, there is downside risk to our corporateearnings estimates, based on the macro uncertainty in the region.
Earnings growth in 2015 should be led by electric utilities (better hydrology, absence of nonoperational negative one timers, and Bocamina II resuming operations in 2H15), retail(capex growth driving moderate sales growth and absence of certain non-operationallosses) and forestry, mainly CMPC (start of operations of Guaiba II).
Chile – Quarterly Corporate Earnings (YoY%)
Source: Company Reports and Credicorp Capital
25%
-9%-19%
-5% -5%
-29%-33%
-12% -12%
1%
55%
19%8%
26%
-1%
1%
17%10%
19%14%
-40%-30%-20%-10%
0%10%20%30%40%50%60%
1Q11 2Q11 3Q11 4Q11 1Q12 2Q12 3Q12 4Q12 1Q13 2Q13 3Q13 4Q13 1Q14 2Q14 3Q14 4Q14 1Q15 2Q15 3Q15 4Q15
Andean Equities Guide, 2015 13
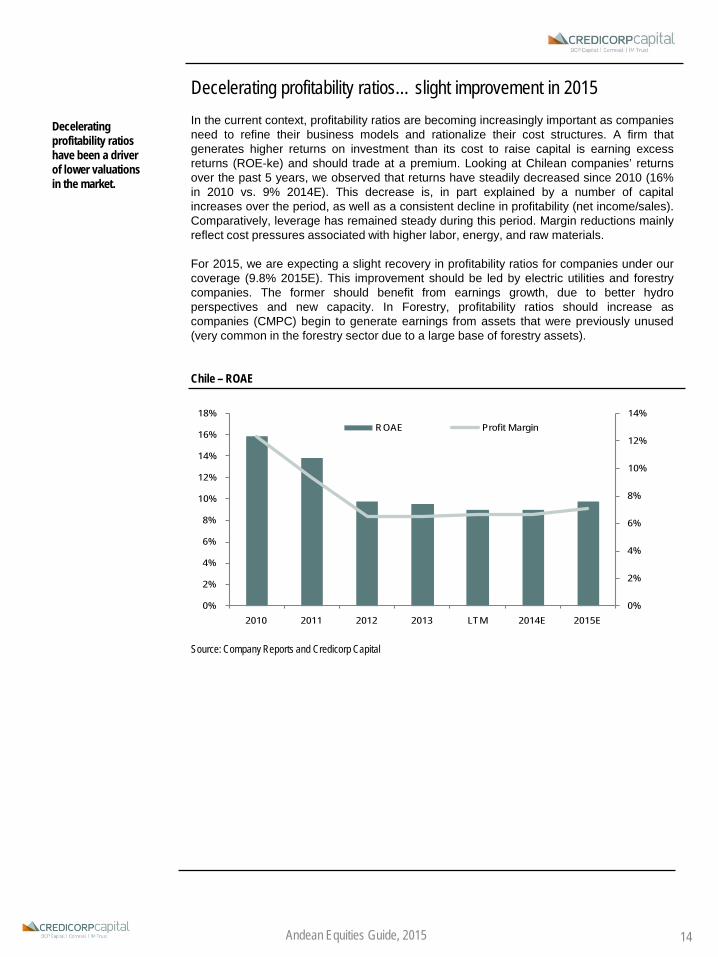
Decelerating profitability ratios have been a driver of lower valuations in the market.
Decelerating profitability ratios… slight improvement in 2015In the current context, profitability ratios are becoming increasingly important as companiesneed to refine their business models and rationalize their cost structures. A firm thatgenerates higher returns on investment than its cost to raise capital is earning excessreturns (ROE-ke) and should trade at a premium. Looking at Chilean companies’ returnsover the past 5 years, we observed that returns have steadily decreased since 2010 (16%in 2010 vs. 9% 2014E). This decrease is, in part explained by a number of capitalincreases over the period, as well as a consistent decline in profitability (net income/sales).Comparatively, leverage has remained steady during this period. Margin reductions mainlyreflect cost pressures associated with higher labor, energy, and raw materials.
For 2015, we are expecting a slight recovery in profitability ratios for companies under ourcoverage (9.8% 2015E). This improvement should be led by electric utilities and forestrycompanies. The former should benefit from earnings growth, due to better hydroperspectives and new capacity. In Forestry, profitability ratios should increase ascompanies (CMPC) begin to generate earnings from assets that were previously unused(very common in the forestry sector due to a large base of forestry assets).
Chile – ROAE
Source: Company Reports and Credicorp Capital
0%
2%
4%
6%
8%
10%
12%
14%
0%
2%
4%
6%
8%
10%
12%
14%
16%
18%
2010 2011 2012 2013 LTM 2014E 2015E
ROAE Profit Margin
Andean Equities Guide, 2015 14

We are setting a YE 2015 target for the IPSA of 4,300 points.
Valuations offer limited room for multiple expansion.
Market Valuations and Upside EstimateWe have determined a 2015E year-end target for the IPSA index of 4,300 points, whichimplies a 13% upside from current levels. Our target combines a bottom-up approach,resulting from weighting the upside potentials for the companies under our coverage,mixed with a top-down approach (FED-model), which checks for consistency betweenattractiveness between the fixed income and the equity markets.
The IPSA is trading at a 15.9x 12 month FWD P/E and 9.1x 12 month FWD FV/EBITDA,both in line with historical averages (see below). With limited room for multiple expansion,valuations suggest that the acceleration in earnings expected in 2015 should be largelypriced in. With respect to the region, the IPSA is trading at a 10% premium on a LTM P/Ebasis, down from a 5-year historical average of 40%. We believe reduced premiums arejustified due to weak economic growth, ongoing regulatory concerns and downside risk toearnings estimates.
Chile – P/E 12 M Forward
Chile – FV/EBITDA 12 M Forward
Our bottom-up, IPSA-weighted market upside calculation suggests 13% upside for themarket through December 2015. This implies a target 2015 P/E and FV/EBITDA multiplesfor the market within historical levels .
15.9x
5
10
15
20
25
30
Dec-99 Dec-01 Dec-03 Dec-05 Dec-07 Dec-09 Dec-11 Dec-13
9.1x
4
6
8
10
12
14
Dec-99 Dec-01 Dec-03 Dec-05 Dec-07 Dec-09 Dec-11 Dec-13
Source: Bloomberg & Company Reports
Andean Equities Guide, 2015 15
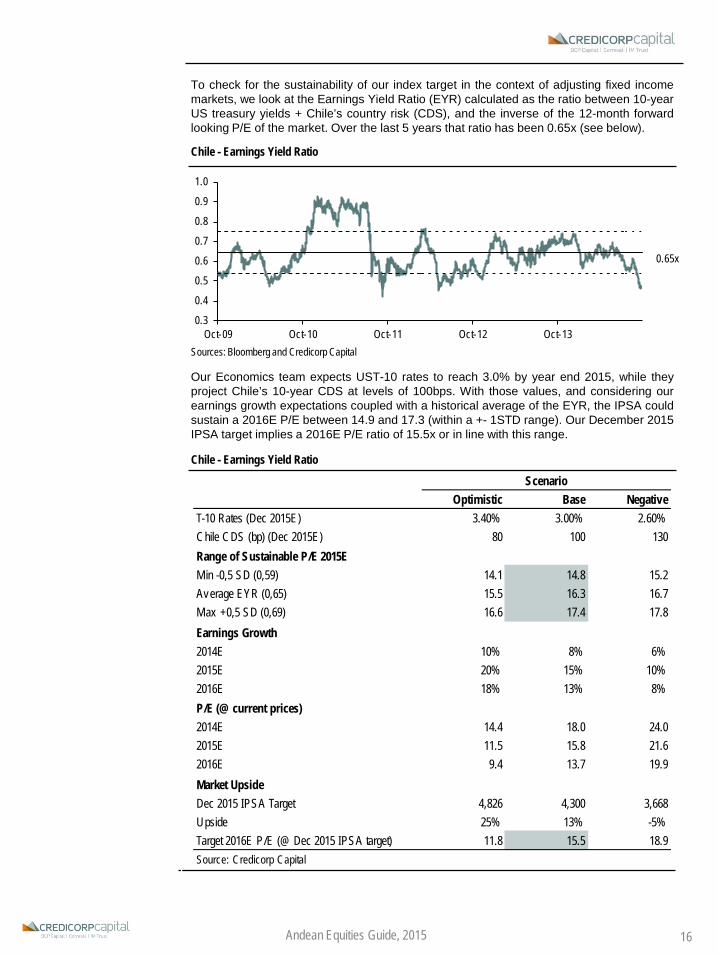
To check for the sustainability of our index target in the context of adjusting fixed incomemarkets, we look at the Earnings Yield Ratio (EYR) calculated as the ratio between 10-yearUS treasury yields + Chile’s country risk (CDS), and the inverse of the 12-month forwardlooking P/E of the market. Over the last 5 years that ratio has been 0.65x (see below).
Chile - Earnings Yield Ratio
Sources: Bloomberg and Credicorp Capital
Our Economics team expects UST-10 rates to reach 3.0% by year end 2015, while theyproject Chile’s 10-year CDS at levels of 100bps. With those values, and considering ourearnings growth expectations coupled with a historical average of the EYR, the IPSA couldsustain a 2016E P/E between 14.9 and 17.3 (within a +- 1STD range). Our December 2015IPSA target implies a 2016E P/E ratio of 15.5x or in line with this range.
Chile - Earnings Yield Ratio
Optimistic Base NegativeT-10 Rates (Dec 2015E) 3.40% 3.00% 2.60%Chile CDS (bp) (Dec 2015E) 80 100 130Range of Sustainable P/E 2015EMin -0,5 SD (0,59) 14.1 14.8 15.2Average EYR (0,65) 15.5 16.3 16.7Max +0,5 SD (0,69) 16.6 17.4 17.8Earnings Growth2014E 10% 8% 6%2015E 20% 15% 10%2016E 18% 13% 8%P/E (@ current prices)2014E 14.4 18.0 24.02015E 11.5 15.8 21.62016E 9.4 13.7 19.9Market UpsideDec 2015 IPSA Target 4,826 4,300 3,668Upside 25% 13% -5%Target 2016E P/E (@ Dec 2015 IPSA target) 11.8 15.5 18.9Source: Credicorp Capital
Scenario
0.3
0.4
0.5
0.6
0.7
0.8
0.9
1.0
Oct-09 Oct-10 Oct-11 Oct-12 Oct-13
0.65x
Andean Equities Guide, 2015 16

Investment FlowsDuring 2014, the Chilean market has suffered from a sharp decrease in traded volumes.Average daily traded volumes reached approx. USD 100mn (YTD) versus USD 200mnaverage during previous years. Foreign investors have continued to lead flows in the localmarket (rebalancing indices and some stock picking), helping to compensate lower tradingactivity from local investors (mainly AFPs), who continue to remain underweight versushistorical activity. Positive flows from foreign investors can be depicted by the evolution ofthe size of the ECH (i-shares Chile), which has seen net inflows of US$10.1mn over thelast 12 months.
ECH Net Flows
Source: Bloomberg and Credicorp Capital
Pension Funds Movements in Local Stocks
Source: Bloomberg and Credicorp Capital
-80-60-40-20
020406080
100
Jan-11 May-11 Sep-11 Jan-12 May-12 Sep-12 Jan-13 May-13 Sep-13 Jan-14 May-14 Sep-14
USD
mn
-400
-200
0
200
400
600
800
1,000
1,200
1,400
Sep-11 Jan-12 May-12 Sep-12 Jan-13 May-13 Sep-13 Jan-14 May-14 Sep-14
USD
mn
Andean Equities Guide, 2015 17

Pension funds and domestic mutual funds have been net sellers of Chilean equities.Despite AFPs current room of US$1,663 million to buy equities, they have beensystematically divesting from the local market, with the exception of January, March andApril 2013, when they participated in the block sales and capital increases of Banco deChile, Parque Arauco, and AES Gener. Exposure of Pension Funds to local equities is atits lowest levels since 2003 (8.7% versus a 14% 10-year average).
ECM activity taking its tollThe Chilean market has swallowed substantial equity offerings since 2012, when thecombined amount of primary and secondary offerings reached US$5.4bn. During 2013, wesaw a sharp increase in ECM activity, amounting to USD 14.5bn. The size of this activityhas certainly been a negative factor, in our opinion, along with generally poor corporatedelivery of earnings, in part explaining the negative performance of the market since 2012.
So far in 2014 equity offerings have exceeded US$5 billion (US$2.9 billion in CFR’s tenderoffer) and the pipeline that has been already announced reaches close to US$4.0 billion(mainly CGE’s tender offer, which amounts to USD 3.3bn). This significant figure will likelyhave an impact as the transactions are executed in the upcoming months.
Chile - Equity Offerings 2012 to date
Source: Credicorp Capital
2012 2013 2014 YTDSize Size Size
Issuer (US$ mn) Type Issuer (US$ mn) Type Issuer (US$ mn) TypeCencosud 1,767 Follow On Andrómaco 286 Tender Offer AESGener 150 Follow OnCorpbanca 578 Follow On Australis 50 Follow On Aquachile / Invermar 30 Tender OfferCuprum 1500 Tender Offer Bco de Chile 530 Follow On Bco de Chile 821 SecondaryEISA 88 IPO CCU 660 Follow On CEM 90 Tender OfferHortifrut 67 IPO Cencosud 1,635 Follow On CFR 2,900 Tender OfferILC 470 IPO CMPC 434 Follow On CGE(*) 3,300 Tender OfferIngevec 26 IPO Corpbanca 624 Follow On CMPC 233 Follow OnNuevapolar 281 Follow On CSAV 330 Follow On CMPC 14 SecondarySK 440 Follow On Enersis 6,019 Follow On Copec 85 SecondarySonda 157 Follow On Enjoy 136 Follow On Corpbanca 59 Secondary
Latam 785 Follow On Cruz Blanca 344 Tender OfferMasisa 79 Follow On CSAV 202 Follow OnMoller 89 IPO Falabella 140 SecondaryProvida 2,000 Tender Offer Habitat 15 SecondaryQuiñenco 670 Follow On LATAM 156 Follow OnSalfacorp 15 Follow On Molymet 97 Follow OnSecurity 114 Follow On Norte Grande 89 Follow OnSonda 141 Follow On Oro Blanco 97 Follow On
Parauco 182 Follow OnSecurity 15 Follow OnTechpak(*) 150 Follow On
AnnouncedBCI 400 Follow On
5,374 14,597 9,569(*) In process
Andean Equities Guide, 2015 18
Our Chilean picks are: CMPC, Colbun, Enersis and Santander.
Stocks we like in ChileWe maintain our neutral view towards Chile within the Andean region. Despite an expecteddouble digit growth in corporate earnings during 2015, short-term, macro headwinds andpolitical risk should continue to weigh on forward multiples (12 month FWD P/E tradingwithin 1 standard deviation below its 5 year average).
We are updating our top picks for Chile on the back of model updates, changes in targetprices, and the latest changes to our macro forecasts. Our top picks include: CMPC,Colbun, Enersis and Santander. We are favoring earnings visibility and/or unique growthopportunities at attractive valuations.
We maintain a constructive view towards Chilean utilities. Although stocks in the sectorhave rallied during 2014 (+18% YTD), we continue to like the sector’s inherently lowexposure to the macroeconomic slowdown, the positive hydro perspectives for 2H14, andthe commitment by the government to private companies in the sector. Moreover,valuations are still attractive considering future earnings growth and recent corrections. Weare including Colbun based on its solid cash generation and, consequently, possibleannouncement of new projects (likely Santa María II). We are also including Enersis, asthe recent price correction creates an attractive entry point for an asset with defensivecharacteristics and potential M&A upside.
Finally, we continue to be positive on banks as we expect the sector will continue to benefitfrom a positive trend in NIMs and improving efficiency levels. Our favorite stock in thesector is Banco Santander Chile. We believe that the bank is currently trading atattractive valuations and should continue to average a ROE of 20% over the next twelvemonths.
Chilean Picks
Andean Equities Guide, 2015 19
Last Target Mkt. 12-18 MonthPrice Price (CLP) Upside (USD mn) 2013 2014E 2015E 2013 2014E 2015E P/BV Div Yield Tot. Upside Sector
CMPC 1,388 1,680 21% 5,946 29.7 18.9 15.9 9.0 8.8 7.7 0.7 1.9% 23% Pulp & PaperColbun 150 180 20% 4,516 63.5 17.3 15.8 15.5 10.3 9.2 1.2 1.7% 22% UtilitiesEnersis 182 215 18% 15,338 11.7 16.9 13.6 4.8 6.4 6.0 1.4 3.0% 21% UtilitiesSantander 32 40 27% 10,204 13.0 11.3 11.4 nm nm nm 2.5 5.3% 32% BanksChilean Picks a 21% 36,004 29.5 16.1 14.2 9.8 8.5 7.6 1.5 3.0% 24%Chile Sample 4,300 16% 162,152 21.1 18.5 16.3 10.3 9.6 8.8 1.6 2.9% 19%a Simple average, excluding Market CapitalizationSource: Company Reports, Bloomberg and Credicorp Capital
P/E FV/EBITDA

Colombia Equity Strategy
The COLCAP offers an upside of 16% to December 2014.
Our Colombian top picks are Davivienda, Nutresa, and Pacific Rubiales.
GDP to continue to be driven by private consumption and investment.
Valuations in line with or slightly below historical averages.
SummaryWe are expecting a return of 16% (including dividends) and we remain slightly positive onColombian equities relative to the Andean Region for 2015. We expect a GDP growth of5.0% for 2014 and 4.7% for 2015 and a robust domestic demand that should keepsupporting earnings growth which, nevertheless, we anticipate to moderate relative to2014. The relevant exception could be seen in Oil & Gas, where (uncertain) oil prices willbe crucial for revenue generation and margins. Also, even though recent marketcorrections have improved relative valuations in Colombian equities, room for multiplesexpansion is somewhat limited as the market-aggregate still lies well above those of Peruand Chile. We are introducing a 2015YE target for the COLCAP index of 1,840 points,representing an upside potential of 13% (16% total return; 17% ex - Ecopetrol). Our top-picks for Colombia are mostly exposed to the domestic and/ or regional economy andinclude Davivienda and Nutresa. Also, we are including Pacific on the belief thatfundamentals suggest room for upside and potential changes in ownership could providefurther support to shares.
Our strategy for Colombia is summarized in the following points, which we further elaborateon the subsequent pages:
Economic activity to remain strong. We expect a mild deceleration in 2015relative to 2014, but GDP growth figures for Colombia should remain positive for themedium term; the economic output is forecasted to grow at healthy 5.0% (2014) -4.7% (2015). Inflation remains under control: we forecast CPI to close 2014 at 3.4%and around 3.2% next year, in line with the BanRep’s target range (2% - 4%).
Oil taking a toll on growth and fiscal figures is the main risk. Nationalproduction targets were cut and oil prices might remain below those used by thegovernment to forecast fiscal figures. This, along with needs for social investment,led the government to finally submit the long-expected tax reform that upholdsinstitutions and government commitments, but hurts corporate earnings. O&G isalso a relevant market risk given the weight of the sector in the index (18%).
Earnings and the impact of the tax reform. We are forecasting a 2% y/y increasein total earnings in 2015 (4.4% Colcap-weighted) in our coverage sample (6% inCOP; 8.6% Colcap-weighted). Our forecasts are impacted by the tax reform bill,which we are assuming will pass basically in line with what the governmentpresented to Congress. Accordingly, the 300bp increase to income tax rate willaffect earnings visibility at least in the next four years.
Room for multiple expansion. According to our coverage universe (100% of theCOLCAP index), the market is trading at 19x 2015E price/earnings. This multipleimplies a 17% discount vs. the COLCAP’s 5-year average; even though the market-aggregate multiples are higher than those of Peru and Chile, this is not true for allnames in our sample, and multiples are low relative to history.
Investment flows. Foreign investors are now more selective and valuation-drivenas massive purchases of local equities over the last five years have significantlyreduced the underweight in Colombia. The dispute between monetary normalizationin the US and liquidity injection (QE) in Europe might keep investment flows toemerging markets relatively balanced. Local pension funds should remain expectantto regulatory changes and relatively away from Colombian equities.
Andean Equities Guide, 2015 20

A strong domestic demand explains the solid pace of economic activity.
We expect economic growth to reach 5.0% this year and 4.7% in 2015.
Macro: the Colombian economy continues to be the outperformer in the region; we expect GDP to grow near potential in 2015The Colombian economy grew 5.4% y/y in 1H14. As a result, GDP expanded 5.5% duringthe last four quarters, which is the highest pace since 2011 and a figure well abovepotential (~4.7% according to our estimates). Thus, Colombia continues to be theoutperformer in the region, showing an opposite trend compared to countries like Chile,Peru, Brazil, Venezuela, and Argentina.
Several factors explain the recent dynamism of the economic activity. First, an increasingspending of royalties by regional governments has been observed since 2H13, which hasbeen mainly reflected in the behavior of civil works (20% y/y since 3Q13 on average).Second, the Central Government has implemented programs to promote housing accessto population in low income brackets over the last two years (e.g. subsidies to mortgagerates and the 100,000 ‘free-houses’ program), which have contributed to boost thebuildings segment. Third, private consumption has posted solid rates of growth since2H13 amid a historical low unemployment rate and a strong creation of formal jobs since1Q13. We consider that the tax reform that came into force last year has played a crucialrole in the recent private consumption trend: the 13.5 pp reduction of non-wage costs forfirms (i.e. parafiscals), lowered the effective costs of hiring; boosting formalization in thelabor market. Last but not least, government spending in social programs has been high inthe last quarters amid an electoral year (presidential elections took place in May 2014).
Colombia – GDP (y/y growth) Colombia – Domestic Demand (y/y growth)
Source: DANE
We expect economic growth to reach 5.0% this year, a higher pace than in 2013 (4.7%).Likewise, we forecast that GDP growth will moderate towards levels more consistent withits potential in coming quarters, so that it would stand at 4.7% next year.
Private consumption will continue exhibiting healthy growth rates in 2015 as we project theunemployment rate to remain near record low levels, while the pace of formal jobscreation should continue to be favorable as a result of the 2012 tax reform. On the otherhand, we expect investment to continue being led by the public sector since regional andlocal governments are likely to maintain a strong pace of royalties spending, while it mustbe considered that 2015 is the last year of these governments’ terms (elections of mayorsand governors in October 2015), which will encourage a higher execution of projects. Interms of private investment, sectors other than construction are expected to show highergrowth rates next year, due to the recent favorable performance of capital goods imports.Although we are optimistic about the execution of the 4G road concessions, we areestimating that their positive effect on GDP will be observed from 2016 onwards.
0%
2%
4%
6%
8%
10%
Jun-06 Jun-08 Jun-10 Jun-12 Jun-
-4%
-2%
0%
2%
4%
6%
8%
10%
12%
Jun-06 Jun-08 Jun-10 Jun-12 Jun-14
Andean Equities Guide, 2015 21

We forecast an inflation rate of 3.2% by December 2015.
We expect the COP to depreciate near 5% in 2015 on average.
On the external front, we expect an improvement of the trade balance in 2015 due to theconsolidation of the US economic activity (Colombia’s main trading partner with ~30% oftotal exports), the expected gradual recovery of South American economies and Europe, amore competitive Fx rate, and the reopening of the Cartagena refinery in 1H15. Regardingthe latter, recall that the Cartagena refinery has been closed most of this year amid aplanned expansion process that will allow it to double its capacity and increase itsconversion factor, which has implied a strong increase of oil derivatives imports.
Inflation currently stands at 2.9%, below the mid point of the BanRep’s target range (3%+/- 1%). Food and electricity explain most of the trend expected for CPI in 2015 due to aforecast of relative drier weather between Nov-14 and Mar-15 and the possibility that thestrong increase in spot power prices in 1H14 may continue being transmitted to the finalconsumer. The recent and expected COP depreciation will impose additional pressuresalong 2015. Thus, we expect an upward trend of inflation to be observed until reaching apeak near 3.5% in 1Q15. Afterwards, the temporary upside pressures coming from foodand managed items would start to fade: inflation would converge towards 3.2% by Dec-15.
We consider a repo rate at 4.50% as the most likely scenario for the next severalmonths due to the expectation of a moderation in economic activity in the upcomingquarters towards levels more consistent with its potential, core inflation measures thatremain below 3.0% (currently at 2.6%), and some risks coming from exogenous factors(e.g. terms of trade and Latam slowdown). Accordingly, we consider that additional ratehikes by BanRep in the future will largely depend on the behavior of inflation expectations.
In terms of the Fx rate, the following factors are likely to drive the COP in 2015: i) a tradebalance improvement according to the aforementioned; ii) FDI inflows that would continueat high levels (~ USD 15 bn), fully financing the current account deficit; and iii) portfolio netflows would be positive amid high levels of liquidity worldwide and an improvement in therelative value of local assets. Overall, we expect an average Fx rate of COP 2,050 in2015, which would imply a depreciation of roughly 5% against the expected average forthis year. In any case, we also expect a high volatility throughout the year.
Colombia – GDP (y/y growth) Colombia - Private Consumption (y/y growth)
Colombia – Investment (y/y growth) Colombia – Inflation (y/y change)
5.0%
4.7%
0%1%2%3%4%5%6%7%8%
2005 2007 2009 2011 2013 2015
5.1%4.6%
0%1%2%3%4%5%6%7%8%
2005 2007 2009 2011 2013 2015
13.5%
7.0%
-10%
-5%
0%
5%
10%
15%
20%
25%
2005 2007 2009 2011 2013 2015
3.4%3.2%
0%
2%
4%
6%
8%
10%
2005 2007 2009 2011 2013 2015
Andean Equities Guide, 2015 22

Terrorist attacks, environmentallicenses and community protests continue affecting the sector.
The uncertainty about the future trend of oil prices is high.
The tax reform tends to strengthen the institutional framework.
The main risk comes from the oil sector. Undoubtedly, the main risk for the Colombianeconomy comes from the oil sector in terms of both prices and production as currently55% of total exports are related to oil and its derivatives, 32% of the FDI is directed to thissector, and roughly 30% of fiscal revenues depend upon oil. As to the latter, theGovernment’s estimates suggest that a drop of USD 1 in the price of oil represents areduction of near USD 210 mn in fiscal revenues while an oil production lower by 10 kbpdimplies a decrease of USD 161 mn.
Regarding production, recall that during the last two years the sector has been affected bythree particular issues: i) terrorist attacks to the oil infrastructure amid the peace talks withthe guerrilla, ii) community protests, and iii) a slow process for granting environmentallicenses. More structurally, the sector has not had a large oil discovery for many years. Asa result, the government cut the expected oil production for the medium term, whichimplied an average reduction of 82 kbpd for the next ten years. These estimates onlyincorporate recoveries from existing fields, in a more conservative stance by theGovernment. Even tough this means that we could see surprises on the upside in thefuture, the challenges ahead are anything but negligible.
Although we consider that some of the specific problems mentioned above might betemporary, solving them will depend on effective measures by the government. Recently,the authorities announced a plan to solve these bottlenecks (e.g. more resources devotedto the security of pipelines and the instruction to simplify the process of granting licenses)but its effective implementation and effects are yet to be seen.
On the other hand, it is worth noting that several studies point towards a relevant potentialof non-conventional resources but the regulation for their development has just beenapproved. Therefore, we do not expect to have results in this front in the next two years, atleast. Overall, the main challenge in the long term is a relevant oil discovery that enablesto increase the average life of oil reserves, currently at 6.6 years.
On the oil prices front, a sharp reduction has been observed recently amid a higherproduction by non-OPEC countries (e.g. US and Russia), lower sale prices by OPECcountries due to a higher apparent competition within the cartel and the recentdisappointing figures in terms of economic activity in Europe and China. Although themarket consensus continues to forecast relatively high oil prices for the upcoming years,the uncertainty is currently high.
Risks from the oil sector have become evident through a new tax reform proposal.The government submitted to the Congress a new tax reform proposal for 1.8% of GDP tocover the gap of COP 12.5 tn (~ USD 6.3 bn) between the revenues and expenditures thatwould arise should a new reform not occur. No doubt this is the result of higher spendingneeds, particularly in terms of social programs, and lower expected oil production for thenext ten years. The main points of the proposal are: i) the extension until 2018 of thewealth tax applicable to firms and individuals with equity over USD 500,000 (overall, thetax rates remain unaltered); ii) the extension of the financial transaction tax (4x1,000) until2018; and iii) the increase of the income tax for firms by 3pp for the next four years so thatthe effective rate would go from 34% to near 37%.
In general, we think the new tax reform tends to strengthen the institutional framework asit is a signal of a strong commitment to the fiscal rule, which limits the ability of increasinggovernment indebtedness. Likewise, the final proposal was clearly less negative than thatannounced initially, which included a strong increase in the rates of the wealth tax, whichwould have had a stronger negative effect on investment. In any case, we do expect somedeceleration in the private sector’s dynamics next year as a result of the reform.
Andean Equities Guide, 2015 23

The infrastructure story is taking off, with the 7 projects awarded in 2014
Infrastructure: the economy’s long term engine is finally taking offGiven that we have mentioned infrastructure as one of the main growth drivers for theColombian economy going forward and we are including a whole section on this topic inour 2014’s Andean Equities Guide, we believe an update on the latest developments in thisfront might be useful to our readers.
A year ago, in line with announcements by the government, we were expecting thisprocess to take off in 4Q13. However, discussions within the government and complaintsby potential bidders postponed the tenders. Recently, after some government actions tosolve issues related to conditions for the consortia and operating bottlenecks, the pace haspicked up. According with our conversations with the ANI (National Infrastructure Agency)and other parties involved, the official timetable now assumes that waves 2 and 3 will beawarded by June 2015. Nevertheless, we expect the impact on economic growth in 2016.
The government (finally) launched the first wave of 4G concessions, and 7 projects havebeen awarded so far, with a capex of COP 8.6 tn (USD 4.3 bn). We have seen a change inthe winners of such projects, from local players in the first 5 road projects, to foreigncompanies in the last two. We also highlight the activity of locally listed companies:Corficolombia, was awarded with the Conexión Pacífico 1 project, while Odinsa and ElCóndor, along with other Colombian companies and Portuguese Mota Engil, were awardedwith Conexión Pacífico 2. There are still two road concessions from this first wave to betendered, with a capex of COP 2.7 tn (USD 1.3 bn).
Waves 2 and 3 will be launched in 2015, with an expected capex of COP 25 bn (USD 12bn). This, jointly with concessions in non-road projects such as ports and airports, andprivate initiative projects such as Odinsa’s project in Barranquilla and Corficolombiana’sfinal section of the Bogotá-Villavicencio highway, should drive the construction sector incoming years. However, we highlight that so far the ANI has tendered relatively simplerprojects in terms of environmental issues and potential problems with communities. Hence,the economic feasibility of some of the future projects to be tendered is uncertain.
Colombia – First wave of 4G road infrastructure projects
Source: Colombia National Infrastructure Agency – ANI
ConcessionCAPEX USD
MN Bids Winning ConsortiumPuerto Salgar - Girardot 480 2 Local (leader) + ForeignPacifico 1 895 2 Episol (Corficolombioana) (60%)Pacifico 2 455 1 ODINSA (25%); El Cóndor (21.5%)Pacifico 3 650 2 Local (leader) + ForeignCartagena - Barranquilla 710 3 Local (leader) + ForeignPerimetral Oriente 605 4 Foreign (leader) + LocalAutopista Conex ión Norte 490 2 Foreign (leader) + LocalAutopista Rio Magdalena 2 685 2 n.a.Mulaló . Loboguerrero 655 nov -14 n.a. All Concessions 5,625Awarded Concessions 4,285
Andean Equities Guide, 2015 24

Corporate Earnings: positive but far from homogeneousWe are expecting total earnings in our coverage sample to increase by 6% (COP) nextyear; 8.6% on a COLCAP-weighted basis. However, the behavior across sectors will be farfrom homogenous as fundamentals vary significantly and oil & gas companies, still with arelevant 18% weight in the Colcap index, should post flattish net results in 2015 due tolower oil realization prices. We are anticipating a major effect coming from the devaluationof the COP (total earnings in USD terms are forecasted to grow 2%; 4.4% Colcap-weighted), as we now expect the average exchange rate in 2015 will be around COP2,050, relative to ~1,970 in 2014. The impact of the tax reform will be substantial and takea toll on profitability as we have incorporated the 3% increase in income tax from 2015onwards, assuming it won’t be temporary as our base-case scenario.
Banks should keep supporting earnings growth, as the only sector that will be able to postdouble-digit figures in 2015. Organic growth of the loan book in Colombia (14%-15%)driven by commercial lending and to a lesser extent, mortgages, along with net interestmargin expansion (transmission of less expansionary monetary policy), should allow banksto outperform in our sample. Bancolombia and Grupo Aval should drive the performance ofthe banking sector, with earnings growing +20% y/y.
Oil & Gas will have a mixed performance as Canacol and Pacific are expected to postdouble-digit earnings growth, but flat Ecopetrol should drag down the entire sector. Wehighlight that should oil prices recover, earnings from this sector could be significantlyhigher than expected and accordingly, Brent prices constitute the main (mostly upward)risk to our forecasts.
Cement companies are expected to post relevant increases as demand for materials willkeep performing well and operations outside Colombia (especially in the US forCemargos), by widening operating margins, will contribute to the consolidated figures.Finally, after a very strong 2014, earnings for power generation companies and utilities ingeneral, with the noticeable exception of EEB, should moderate in 2015.
Colombia – Evolution total of corporate earnings (in USD) .
Source: company reports, Credicorp Capital
-6%
-20%
17%
-11%-15%
16%
-4%
10%
-4%
6%
-1%
6%
-25%
-20%
-15%
-10%
-5%
0%
5%
10%
15%
20%
1Q13 2Q13 3Q13 4Q13 1Q14 2Q14 3Q14E 4Q14E 1Q15E 2Q15E 3Q15E 4Q15E
Andean Equities Guide, 2015 25

We are setting a YE 2014 target for the COLCAP of 1,840 points.
Valuations offer limited room for multiple expansions.
Market Valuations and Upside EstimationWe are setting a YE 2015 target for the COLCAP index of 1,840 points, which implies a13.4% upside (virtually the same in USD terms as we expect the exchange rate to close2015 near current levels), from current levels. We arrive at this target combining a bottom-up approach, resulting from weighting the upside potentials for the companies we cover inthe Colombian market, and a top-down, FED-model type of approach to check forconsistency between the fixed income and the equity markets.
After the significant corrections observed over the last two months, the COLCAP is tradingat 19.2x 12M forward earnings, below its historical average of 21.3x (see below). Eventhough the current level is significantly lower than a couple of year ago (31x as of October2012), today’s figure leaves little room for generalized multiple expansions. In terms ofFV/EBITDA, the discount seems more appealing as the current 8.6x lies below onestandard deviation of historic average 10.1x.
Colombia – P/E 12 M Forward Colombia – FV/EBITDA 12M Forward
Source: Credicorp Capital
Our bottom-up COLCAP-weighted market upside calculation suggests 16% upside for themarket through December 2015. This implies valuation multiples largely in line with currenthistorical levels. The Colombian market usually trades at higher multiples than the region, arecurrent phenomenon over the last five years. This is partly explained by the fact thatinvestors have a small set of investment opportunities and in many cases, there is only onename per economic sector, making it difficult to perform proper relative valuation analyses.Also, due to the nature of their businesses and the way they account for earnings fromportfolio holdings, shares of conglomerates tend to push upwards market-aggregatefigures, particularly considering this sector currently represents 28% of the Colcap index.Nevertheless, multiples in Colombia should remain relatively high in the medium term.
To check for the sustainability of our index target in the context of adjusting fixed incomemarkets, we look at the Earnings Yield Ratio (EYR) calculated as the ratio between 10-yearUS treasuries yields + Colombia’s country risk (CDS), and the inverse of the 12-monthforward looking P/E of the market. Over the last 10 years that ratio has been 0.99x.
19.2x
5
10
15
20
25
30
35
40
Oct/08 Oct/09 Oct/10 Oct/11 Oct/12 Oct/13 Oct/1
8.6x
5
10
15
Oct/08 Oct/09 Oct/10 Oct/11 Oct/12 Oct/13 Oct/1
Andean Equities Guide, 2015 26
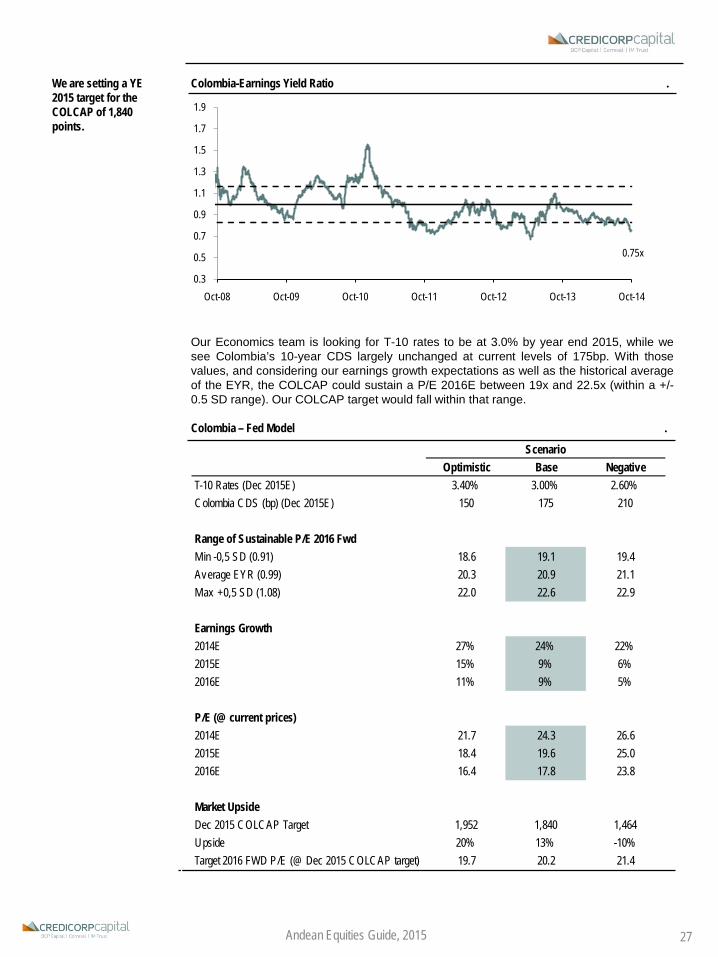
We are setting a YE 2015 target for the COLCAP of 1,840 points.
Colombia-Earnings Yield Ratio .
Our Economics team is looking for T-10 rates to be at 3.0% by year end 2015, while wesee Colombia’s 10-year CDS largely unchanged at current levels of 175bp. With thosevalues, and considering our earnings growth expectations as well as the historical averageof the EYR, the COLCAP could sustain a P/E 2016E between 19x and 22.5x (within a +/-0.5 SD range). Our COLCAP target would fall within that range.
Colombia – Fed Model .
0.3
0.5
0.7
0.9
1.1
1.3
1.5
1.7
1.9
Oct-08 Oct-09 Oct-10 Oct-11 Oct-12 Oct-13 Oct-14
0.75x
Andean Equities Guide, 2015 27
Optimistic Base NegativeT-10 Rates (Dec 2015E) 3.40% 3.00% 2.60%Colombia CDS (bp) (Dec 2015E) 150 175 210
Range of Sustainable P/E 2016 FwdMin -0,5 SD (0.91) 18.6 19.1 19.4Average EYR (0.99) 20.3 20.9 21.1Max +0,5 SD (1.08) 22.0 22.6 22.9
Earnings Growth2014E 27% 24% 22%2015E 15% 9% 6%2016E 11% 9% 5%
P/E (@ current prices)2014E 21.7 24.3 26.62015E 18.4 19.6 25.02016E 16.4 17.8 23.8
Market UpsideDec 2015 COLCAP Target 1,952 1,840 1,464Upside 20% 13% -10%Target 2016 FWD P/E (@ Dec 2015 COLCAP target) 19.7 20.2 21.4
Scenario

Investment FlowsForeign investors remain as the top buyers of Colombian equities in 2014. So far in 2014(at the end of September), foreign investors have accumulated net buying positions of USD962.1 mn. More importantly, the participation in total traded volume in the equity market ofthese players has increased from 20% in 2013 to 26% so far in 2014. Despite the positivetrend seen over the last years, we highlight that in September 2014, foreign investorsrecorded the largest outflow in a single month since 2011 (USD 120 mn). This could beexplained by several factors such as a possible profit taking (the Colombian market rallied+20% in local currency from February to August) and uncertainty coming from the localO&G sector as well as the new tax reform proposed by the Government. We expect theseagents to maintain or slightly increase its share on total traded volume. The solidmacroeconomic picture expected for 2015 supports our view. That said, drastic policychanges by the FED or any local economic disruption could alter our base-case scenario.
Colombia – Foreign investors net buys (monthly) .
Source: BVC
The picture for local pension funds (AFP) is widely different. At the end of September 2014,these agents recorded the second largest net selling position in the local market during thecurrent year (USD 580 mn) as local retail remained in the first place. The ongoing newregulation for mandatory pension funds may be causing a negative effect towards the localmarket; a first draft of the new proposal did not go through local lawmakers. As a result, theuncertainty surrounding this topic along with a reconstitution of AFP’s portfolios towardsforeign markets have limited purchases of local equities. Given the recent trend in flows,uncertainty upon new regulation, and current market conditions, we don’t expect pensionfunds to be among the top buyers in the local market in upcoming months.
Colombia – Pension funds net buys (monthly) .
Source: BVC
(200)
(100)
-
100
200
300
400
Jan-11 Jan-12 Jan-13 Jan-14
USD
mn
(200)
(100)
-
100
200
300
Jan-11 Jan-12 Jan-13 Jan-14
USD
mn
Andean Equities Guide, 2015 28

The Colombian market has absorbed USD 16 bnof capital increases in the last four years
Recent and upcoming ECM activityThe Colombian market has absorbed equity issuances of USD 3.9 bn so far in 2014, whichcould increase to USD 4.6 bn if Banco de Bogotá launches its capital increase before yearend. The vast majority of the ECM activity has been concentrated in banking names,following aggressive M&A activity prior to 2013, and the change in capital regulation. TheECM activity in 2014 is materially higher than in the previous two years, but the amountissued is just 64% of the historical high of 2011 (10 companies went to the market to raisecapital for USD 7.2 bn). In the last 4 years, the market has absorbed total capital increasesfor USD 16.1 bn.
Two additional milestones during 2014. First, Grupo Aval raised capital through itsLevel-3 ADR in the NYSE, which not only increased the free-float of the preferred (non-voting) shares, but also improved the visibility of the financial conglomerate among foreigninvestors. In addition, Organización Terpel, with a market cap of USD 1.6bn, was listed in3Q14 and has recorded an ADTV of USD 2.4 mn since the listing; this is an essentialmilestone on a market eager for more names in new sectors and more liquidity.
Now, in terms of future equity issuances, banks and construction companies will probablymark the pace. Regarding banks, Banco de Bogotá already announced the issuance ofCOP 1.5 tn (~USD 700 mn), following Grupo Aval’s capital increase in late 3Q14. Recallingprevious ECM activity of Banco de Bogotá, we expect the company to launch this capitalincrease during 4Q14. No further offerings are expected in the market, but there is alikelihood of Davivienda going to the market towards the end of 2015 or 2016, probablythrough an ADR in the NYSE. According to our analysis, Davivienda could need betweenUSD 400-700 mn in equity to increase its Tier 1ratio to a comfort zone of 8%-9%. As forconstruction companies, the probability of capital increases derives from the pipeline ofroad concessions to be tendered by the government in 2014-2015. The awarding of roadconcessions could trigger ECM activity in this sector.
Finally, a word on sale processes that are on the pipeline. The government decided todelay the sale process of Isagen for a year and thus, this transaction will probably beeffective some time before Aug-15. This transaction could reach up to COP 5.3 tn (USD2.6 bn). Also, Ecopetrol has announced the divesture of its stockholdings in EEB (~7%ownership, or USD 495 mn) and ISA (~5% ownership, or USD 230 mn).
Colombia – Equity offerings 2012 to date
Source: BVC; Company Reports
2012 2013 2014 YTD
Issuer Size (USD mn) Type Issuer Size
(USD mn) Type Issuer Size (USD mn) Type
Bancolombia (Pf) 935 Follow-On Cemargos (Pf) 880 Follow-On Grupo Aval 1,228 Follow-OnEl Cóndor 91 IPO Avianca (ADS) 231 Follow-On Bancolombia (Pf) 1,296 Follow-OnCarpak (Pf) 109 IPO Banco de Bogotá 669 Follow-On Canacol 115 Bought DealCLH 1,150 IPO Grupo Aval (ADR) 1,265 Follow-OnConconcreto 136 Follow-On
Announced
Banco de Bogotá 727 Follow-On
Total 2,421 Total 1,780 Total 4,630
Andean Equities Guide, 2015 29

Strategy and Top PicksOur recommendation of linking investment strategy to the sound fundamentals of theColombian economy and the strong expected performance of local demand, we arebenefitting sector related to local consumption, such as banks and food & beverages. Also,despite headwinds affecting the sector, recent falls in share prices and potential corporategame changers lead us to take a closer look at oil & gas. Accordingly, we are includingDavivienda, Nutresa, and Pacific Rubiales as our Top Picks.
We think that the strategy and management of Davivienda is solid, and will allow it tolever on the growth opportunities of the Colombian banking industry. Davivienda iscurrently outperforming its Colombian peers in ROAE despite its lower market share as aresult of efficiency efforts and risk management, and the share looks just too discounted tolet go, even including the potential effects of the tax reform; the main risk is a potentialcapital increase towards the end of 2015 or 2016.
Nutresa is a play on Colombian local demand, which we expect to remain robust(5.1% in 2014 and 4.6% in 2015). The Latin American middle class continues supportingrevenue growth and sound cash generation; we are conservative in the short term as weexpect lower economic growth outside Colombia. The relative stability on commodity pricesin the coming quarters should not bring pressure to EBITDA margins, which we expect tocontinue in the upper limit of the management’s 12%-14% guidance range.
Last but not least, our top pick in the oil & gas sector is Pacific. Despite the significantrisk of the potential loss of the Rubiales field, we believe that there is higher visibility interms of growth relative to Ecopetrol and Canacol. In addition, the entrance to Mexicocould be a game changer in upcoming years, particularly after having signed an agreementwith Pemex. Also related to Mexico, the potential effect of the relation with Alfa, eitherthrough a JV or an increase of its stake in the E&P company, could drive share prices up inthe shorter term.
Even though we are not including Isagen in our portfolio of Top Picks for theAndean Region, we highlight this might be an interesting alternative at currentvaluations. After the suspension to the sale process of the Government’s stake n thecompany, shares dropped sharply and began to trade way below our estimated fair value(2015E fair value: COP 3,150/share), and below the likely sale price, according to thecurrent terms of the process (estimated at COP 3,400/share, if the process closes betweenAugust and December 2015). We expect the selling process to be the main driver of thestock price and further information towards a materialization of the sale will result in upwardpressures.
Colombian Picks
Andean Equities Guide, 2015 30
Last Target Mkt. 12-18 MonthPrice Price (COP) Upside (USD mn) 2013 2014E 2015E 2013 2014E 2015E P/BV Div Yield Tot. Upside Sector
Davivienda 28,700 35,300 23% 6,238 12.3 12.6 11.2 nm nm nm 1.9 2.4% 25% BanksNutresa 27,000 32,000 19% 6,017 31.9 43.5 42.0 16.5 13.2 12.6 1.6 1.7% 20% Food & BeveragesColombian Picks a 21% 12,255 22.1 28.1 26.6 16.5 13.2 12.6 1.7 2.0% 23%Colombia Sample 1,857 14% 178,314 14.0 14.1 13.2 1.6 6.0 5.5 1.7 3.8% 18%a Simple average, excluding Market CapitalizationSource: Company Reports, Bloomberg and Credicorp Capital
P/E FV/EBITDA
Peru Equity Strategy
The IGBVL targetimplies upside of 14% through December 2015.
Our Peruvian top picks include: Milpo, Luz del Sur, and InRetail.
GDP rebound in 2015 after a tepid 2014
Valuations mostly in line with historical averages.’
No new mining or PPPs mega- projects for 2015
SummaryWe remain UW in Peru within the context of the Andean Region, given the external andinternal headwinds, such as lower commodity prices (gold, copper), higher interest rates,the strong El Niño Phenomenon, and deceleration of private and public investment flows.In a base case scenario, the economy should rebound in 2015 thanks to higher miningproduction (Copper) and the government’s effort to cut red tape; however, negative risksshould not be underestimated as has been apparent in 2014 GDP deceleration. We areintroducing a 2015YE target for the IGBVL index of 17,770 points, implying upside potentialof 14%.
Our top-picks in this context include Milpo (mining), Luz del Sur (utilities), and InRetail(retail); companies, which we believe offer credible growth stories in what looks to be abumpy 2015.
We summarize our strategy on Peru in the following points:
Economic rebound expected for 2015. Mining production deferments (dealyed until2015) and a moderate El Niño phenomenon (fishing industry) help explain lower GDPgrowth in 2014. In spite of government efforts to cut red tape (supply measures) andgrant concessions (+USD 11bn), the fiscal role in the economy was weak due tolower investment on sub-national levels. Negative spillover effects coming from lowercommodity prices and higher interest rates in 2015 should be mitigated with fiscal andliquidity buffers, new Central Bank FX instruments, and a lower degree of dollarizationin the economy.
Modest growth of corporate earnings. After an earnings rebound of 9% in 2014, weexpect a modest 13% growth in earnings amongst our coverage universe in 2015(70% of the IGBVL), led by the mining sector (52% of total earnings), which shouldbenefit from better margins and lower Capex.
Fair historic valuations. According to our corporate sample, the Peruvian market istrading at 14.9x 2015E Price/Earnings. The multiple is slightly above the +/- 1 SDrange of the IGBVL 10-year average.
Investment sentiment and new PPPs. After October’s regional elections, we do notexpect a change in the pipeline of mining projects during the medium term since anti-mining candidates were elected in the most sensitive areas such as Cajamarca. Thedepressed commodity price environment is not helping to foster new mining projectsin Peru, in turn potential hurting mining related stocks such as, Graña y Montero andFerreycorp. On the other hand, Proinversion should continue to grant PPPs to theprivate sector, especially hydro projects; however, the two most importantinfrastructure PPPs (Line 3 and Line 4 of the Metro of Lima- Capex of USD 10bn)should not be granted before the beginning of 2016.
Negative flows from foreign investors and Pension funds. In 2014 YTD, net salesfrom foreign investors have accumulated USD 393mn compared to net purchasesregistered in 2013 (USD 128mn). This follows lackluster performance of the Peruvianequity market. We expect Pension Funds to continue to reduce their domestic equityexposure during 2015 after the foreign investment limit dictated by the Central Bank(42% since January 1st) has been expanded.
Andean Equities Guide, 2015 31

GDP growth to accelerate in 2015, fueled by copper exports.
Fiscal impulse to spur domesticdemand; drop of mining investment in 2015.
Macro: waiting for the reboundAfter a sharp decline in GDP estimates for 2014 (to 2.8% from 6%) explained by lowermining exports (reduced copper output and delays of the Toromocho mine) and publicinvestment (harsh contraction of sub-national government expenditures which nowexplains two-thirds of public investment), GDP growth should rebound in 2015 (C.Ce of4.8%) based on mining activity (copper, gold) and a greater fiscal impulse (á la 2009). For2016, when Peru increases its copper production by 70% thanks to Southern’s Toquepalaexpansion and Hudbay’s Constancia (2015), Cerro Verde’s expansion and Southern’s TiaMaria (2016), economic growth should again reach its potential rate (6%).
Peru – GDP (YoY%) Peru – Domestic Demand (YoY%)
Sources: BCRP and Credicorp Capital
Our Economic team estimates a GDP growth of 4.8% for 2015 supported by a reboundin primary sectors, especially in mining and fishing that were negatively affected in 2014 bydelays in mining construction and a moderate El Niño, respectively. We are positive thatPeru’s GDP growth rate of +5% will return in 2016 as expansions of Toromocho,Toquepala and Cerro Verde (Copper mines) get up and running.
As to be expected, Peru’s current account deficit increased from 3.6% in 2012 to 5.4% in2014E, driven by lower commodity prices. While we see the deficit staying above 4.9%over 2015, it should be largely financed by FDI. In 2016, the Central Bank estimates areduction of the current account deficit to 3.5% thanks to higher mining exports.
Peru is well-positioned to cope with possible external shocks (slowdown in China andincrease in US interest rates). Public debt is at 18.2% of GDP (net debt is 8% of GDP).International reserves held by the Central Bank amount to 32% of GDP (among the highestin Latin America) and the dollarization ratio of credit of the financial system to the privatesector (families and corporations) has compressed to 41%, from 72% ten years ago.
The government has launched an aggressive fiscal impulse through higher expenditures(public servants salaries) and national investments to spur domestic demand. The fiscaldeficit for 2015 (-0.3% of GDP) is only comparable to that of 2010. As it was the case in2014, the government’s goals are to reduce the infrastructure gap launching new PPPs(USD 10bn) and to cut red tape to foster private investment. We believe that thefragmented political map that emerged from regional elections in October 5th could be ahindrance to increase public expenditures at the sub-national levels, especially in thoseanti-mining regions such as, Cajamarca (gold, copper projects), Puno (tin), and Ancash(copper, zinc, lead), where important mining projects are located. Considering this negativeoutlook, the Central Bank has estimated that mining investment will drop in 2015 for asecond consecutive year by 8% (-6.4% in 2014).
0
2
4
6
8
10
Mar-11 Oct-11 May-12 Dec-12 Jul-13 Feb-14 3Q-140
2
4
6
8
10
12
14
Mar-11
Aug-11
Jan-12
Jun-12
Nov-12
Apr-13
Sep-13
Feb-14
Jul-14 2Q-15
Andean Equities Guide, 2015 32

First gear: mining.Second gear: infrastructure.
We are setting a 2015 YE target for the IGBVL of 17,700 points.
Modest growth in corporate earningsWe expect corporate earnings to increase by 9% in 2014 in USD terms, based on oursample of companies (~70% of IGBVL), after two second consecutive years of negativecorporate performance.
For 2015, we expect a modest 13% growth in corporate earnings based on a recovery inthe mining sector (52% of total earnings; 19% earnings growth), due to better operatingmargins. Infrastructure companies (17% of total earnings) will also post a 13% earningsgrowth increase.
The large increase in 2016 revenues is mainly explained by the startup of operations ofCerro Verde expansion (doubling its Copper production), which will increase its revenuesby 156%, lifting total revenues by 42% (mining companies revenues will explain 64% oftotal revenues). Removing this one-time effect, total earnings should grow by 13% in 2016.
Peru– Evolution of Corporate Earnings
Market valuations and IGBVL upsideWe are setting a YE 2015 target for the IGBVL index of 17,700 points, which implies a 14%upside from current levels. We arrive at this target combining a bottom-up approach,resulting from weighting the upside potentials for the companies under coverage in Peru,and a top-down, Fed-model type of approach to check for consistency between the fixedincome and the equity markets. Our corporate sample (70% of the IGBVL) is trading at14.9x 2015 earnings, which is slightly outside its +/- 1 SD line with its 10-year historicalaverage (see below).
-21%
-41%
-3%
-19%
-37% -38%
-17%
-49%
-15%
45%
-21%
68%
26%
-2%
18% 12%
-60%
-40%
-20%
0%
20%
40%
60%
80%
1Q12 2Q12 3Q12 4Q12 1Q13 2Q13 3Q13 4Q13 1Q14 2Q14 3Q14E 4Q14E 1Q15E 2Q15E 3Q15E 4Q15E
Andean Equities Guide, 2015 33

Peru– P/E 12M Forward
Sources: Bloomberg, Company Reports, Credicorp Capital
Our base case scenario, bottom-up IGBVL-weighted market upside calculation suggests a14% upside for the market through December 2015, including dividends.
To check for the sustainability of our index target in the context of adjusting fixed incomemarkets, we look at the Earnings Yield Ratio (EYR) calculated as the ratio between 10-yearUS treasuries yields + Peru’s country risk (CDS), and the inverse of the 12-month forwardlooking P/E of the market. Over the last 10 years that ratio has been 0.81x (see below).
Peru- Earnings Yield Ratio
Sources: Bloomberg, Company Reports, Credicorp Capital
Our Economics team is looking for T-10 rates to be at 3% by year end 2015, while we seePeru’s 10-year CDS at 140 bps With those values, and considering our earnings growthexpectations as well as the historical average of the EYR, the IGBVL could sustain a 12-month forward P/E between 12.5x and 24.3x (within a +/- 0.5 SD range). Our IGBVL targetfalls within that range.
4.0
6.0
8.0
10.0
12.0
14.0
16.0
18.0
Jan/03 Nov/03 Sep/04 Jul/05 May/06 Mar/07 Jan/08 Nov/08 Sep/09 Jul/10 May/11 Mar/12 Jan/13 Nov/13 Sep/14
11.0
0.2
0.4
0.6
0.8
1.0
1.2
1.4
1.6
1.8
2.0
Jan/03 Jan/04 Jan/05 Jan/06 Jan/07 Jan/08 Jan/09 Jan/10 Jan/11 Jan/12 Jan/13 Jan/14
0.81x
Andean Equities Guide, 2015 34

Peru - FED - Type Model
Optimistic Base NegativeT-10 Rates (Dec 2015E) 3.4% 3.0% 2.6%Perú CDS (bp) (Dec 2015E) 125 140 170
Range of Sustainable P/E 2016 FwdMin -0,5 SD (0.55) 11.8 12.5 12.8Average EYR (0.81) 17.4 18.4 18.8Max +0,5 SD (1.07) 23.0 24.3 24.9
Earnings Growth2014E 13% 9% 7%2015E 16% 13% 6%2016E 17% 13% 10%
P/E (@ current prices)2014E 11.9 16.3 22.02015E 10.0 14.9 20.72016E 8.3 13.0 18.6
Market UpsideDec 2015 IGBVL Target 20,960 17,700 16,302Upside 35% 14% 5%Target 2016 FWD P/E (@ Dec 2015 IGBVL target) 11.2 14.8 19.6Source: Credicorp Capital
Scenario
Andean Equities Guide, 2015 35

Target PPPs for 2015 is USD 10bn according to Proinversion
Most important projects for 2015 would be hydroelectric plants (USD 2.7 bn).
Lines 3 and 4 (USD 5 bn each) of Metro of Lim would be granted in 2016.
Public-Private Partnerships in 2015-16
Proinversion is expected to grant 15 PPPs by the end of 2014, totaling USD 11.6bn. Thisfigure is 1.4 and 3 times the amounts granted in 2013 and 2012, respectively. During theyear, the Line 2 of Lima’s Metro (USD 5.5bn), the Southern Natural Gas Pipeline (USD3.6bn) and the Chinchero-Cusco International Airport (USD 600mn) were the mostimportant PPPs delivered.
In order to reduce the infrastructure gap of USD 79bn (Association for the Promotion ofNational Infrastructure-AFIN), the Government has targeted more than USD 10bn in PPPsfor 2015: 1,200 MW hydro-electrical plants (USD 2.7bn), the Lima-Central Highway ring-road (USD 1.2bn), the sections 4 and 5 of the Longitudinal of the Sierra Highway (USD720mn approx), conduction for drinking water supply to Lima (USD 400mn), the 200-MWQuillabamba thermal power station in Cusco (USD200mn), the section Ica-Quilca of thePanamericana Sur Highway and the monorail mass transportation system in Arequipa(southern Peru), among others.
We expect that Proinversion will grant Lines 3 (North-South) and 4 (East-West) of theLima’s Metro by 1H2016 (President Humala’s administration ends in July 2016), since thepre-investment studies developed by the consulting consortium will take at least 15 months(estimate from the Line 2 bidding process). These two bidding processes could sum up toUSD 10bn.
In addition to PPPs launched by the Government, we expect new projects to come fromPrivate Initiatives (PI]) thanks to legal changes that foster self-financed and co-financed PI.Finally, we also believe that monitoring granted concessions will be key for theGovernment in the coming months in order to change the general perception that the goalis to sign contracts, rather than to monitor subsequent project steps, such as expropriationsand construction works.
Peru- PPPs 2015-2016
Sector ProjectEstimated
Investment (USD mn)
Estimated Auction Date
Financing Source
Transport infrastructure Lines 3, 4 of Metro of Lima (35 ys concession) 10,000 1H16 Co-financedElectricity Hydroelectric power plants (1,200 MW) 2,700 2Q15 Self-sustainedTransport infrastructure Lima-Central Highway ring road 1,200 2Q15 Co-financedTransport infrastructure Sections 4 and 5 of Longitudinal de la Sierra highway 720 2H15 Co-financedTransport infrastructure Monorail in Arequipa (southern Peru) 700 3Q15 Co-financedWater and Sewage Conduction of drinking water for Lima 400 1Q15 Self-sustainedElectricity Quillabamba (Cusco) thermal power plant (200 MW) 200 2Q15 Self-sustainedElectricity Corpac transmission lines 150 2Q15 Self-sustainedWater and Sewage Regulation works of the Chillón river 70 2Q15 Self-sustainedTourism Choquequirao cableway (Apurimac) 52 1Q15 Co-financedElectricity Carapongo substation and links to associated lines 32 2Q15 Self-sustained
Sources: Proinversion, local newspapers, Credicorp Capital
Andean Equities Guide, 2015 36

An October 2014 poll showed Keiko Fujimori is the front-runner followed by Pedro Pablo Kuczynski
A word on 2016 Presidential ElectionsNext year, we will start seeing the first announcements from candidates for the 2016Presidential Elections. First round elections will be held during April 2016 while the runoffround will be held in June 2016, if none of the candidates garners 50% +1 of the validvotes.
National polls from October show that the two runners-up will be Keiko Fujimori (39 y.o.Fuerza Popular; daughter of the jailed, former president Alberto Fujimori 1990-2000) andMr. Pedro Pablo Kuczunski (76 y.o. Peru +, former Prime Minister 2005-2006), followed byMr. Alan García (65 y.o. former President of Peru 1985-90 and 2006-2011). Other possiblecandidates will be Mr. Cesar Acuña (62 y.o. Alianza para el Progreso, educationentrepreneur and current Mayor of Trujillo, northern Peru and Mr Gaston Acurio (46 y.o.renowned Chef and entrepreneur).
Although the political campaign has not begun yet, we do not expect any importantchanges in the economic policy (tax and labor regime, independence of the Central Bank,concession of infrastructure projects) since all possible candidates come from center-rightpolitical parties or independent movements; however, we do expect major changes in thede-centralization process (sub-national government role), considering the negative resultsduring previous years (corruption from regional governments); as well as a more active roleof the government to increase spending in education through PPPs. The need to reduceurban crimes rate (extortion) in the most important cities of Peru will also be part of theelection agenda, which could favor Ms. Fujimori since her father was successfully indeterring terrorism during the early 90s.
A couple of interesting facts can be deducted from past Presidential elections. First, thelosing, runoff candidate has won following elections in 2001 (Mr. Toledo vs. Mr. Garcia),2006 (Mr. Garcia vs. Mr. Humala) and 2011 (Mr. Humala vs. Ms. Fujimori). Second, neverhas a first-round winner in the capital of Lima (one-third of total population) been electedPresident (Ms. Lourdes Flores in 2006 and Mr. Kuczynski in 2011).
Andean Equities Guide, 2015 37
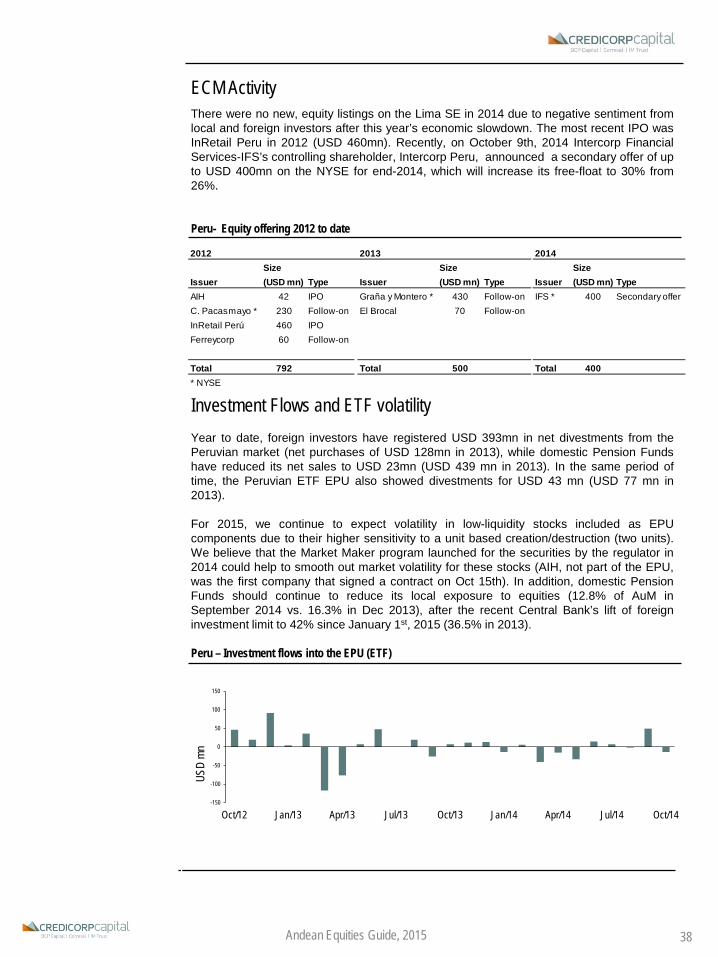
ECM ActivityThere were no new, equity listings on the Lima SE in 2014 due to negative sentiment fromlocal and foreign investors after this year’s economic slowdown. The most recent IPO wasInRetail Peru in 2012 (USD 460mn). Recently, on October 9th, 2014 Intercorp FinancialServices-IFS’s controlling shareholder, Intercorp Peru, announced a secondary offer of upto USD 400mn on the NYSE for end-2014, which will increase its free-float to 30% from26%.
Peru- Equity offering 2012 to date
Investment Flows and ETF volatilityYear to date, foreign investors have registered USD 393mn in net divestments from thePeruvian market (net purchases of USD 128mn in 2013), while domestic Pension Fundshave reduced its net sales to USD 23mn (USD 439 mn in 2013). In the same period oftime, the Peruvian ETF EPU also showed divestments for USD 43 mn (USD 77 mn in2013).
For 2015, we continue to expect volatility in low-liquidity stocks included as EPUcomponents due to their higher sensitivity to a unit based creation/destruction (two units).We believe that the Market Maker program launched for the securities by the regulator in2014 could help to smooth out market volatility for these stocks (AIH, not part of the EPU,was the first company that signed a contract on Oct 15th). In addition, domestic PensionFunds should continue to reduce its local exposure to equities (12.8% of AuM inSeptember 2014 vs. 16.3% in Dec 2013), after the recent Central Bank’s lift of foreigninvestment limit to 42% since January 1st, 2015 (36.5% in 2013).
Peru – Investment flows into the EPU (ETF)
Sources: Bloomberg and Credicorp Capital
2012 2013 2014Size Size Size
Issuer (USD mn) Type Issuer (USD mn) Type Issuer (USD mn) TypeAIH 42 IPO Graña y Montero * 430 Follow-on IFS * 400 Secondary offerC. Pacasmayo * 230 Follow-on El Brocal 70 Follow-onInRetail Perú 460 IPOFerreycorp 60 Follow-on
Total 792 Total 500 Total 400* NYSE
-150
-100
-50
0
50
100
150
Oct/12 Jan/13 Apr/13 Jul/13 Oct/13 Jan/14 Apr/14 Jul/14 Oct/14
USD
mn
Andean Equities Guide, 2015 38
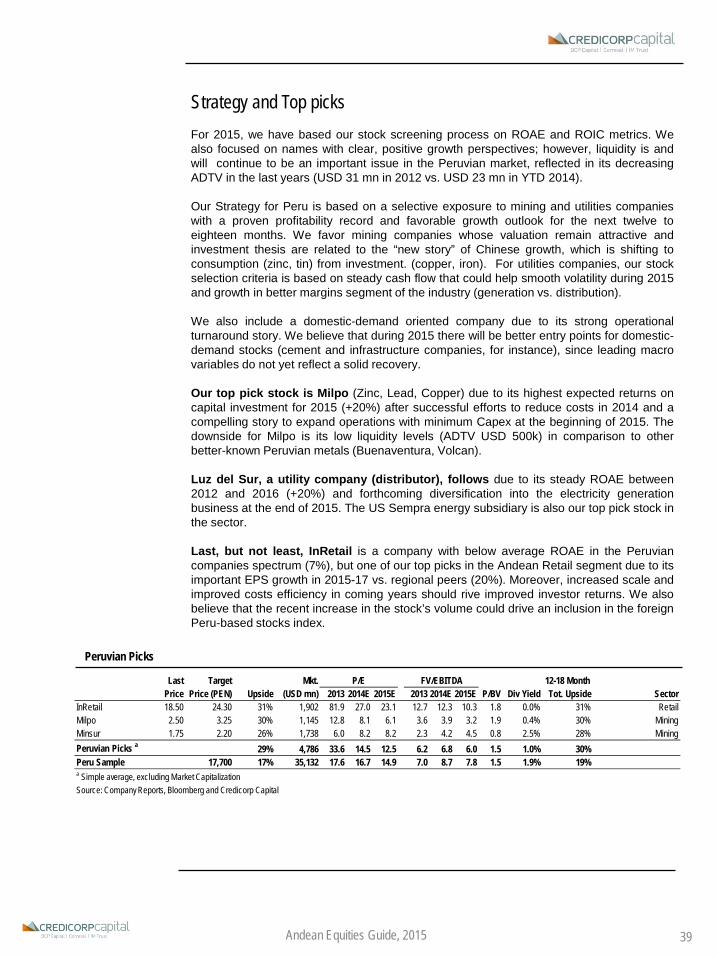
Strategy and Top picksFor 2015, we have based our stock screening process on ROAE and ROIC metrics. Wealso focused on names with clear, positive growth perspectives; however, liquidity is andwill continue to be an important issue in the Peruvian market, reflected in its decreasingADTV in the last years (USD 31 mn in 2012 vs. USD 23 mn in YTD 2014).
Our Strategy for Peru is based on a selective exposure to mining and utilities companieswith a proven profitability record and favorable growth outlook for the next twelve toeighteen months. We favor mining companies whose valuation remain attractive andinvestment thesis are related to the “new story” of Chinese growth, which is shifting toconsumption (zinc, tin) from investment. (copper, iron). For utilities companies, our stockselection criteria is based on steady cash flow that could help smooth volatility during 2015and growth in better margins segment of the industry (generation vs. distribution).
We also include a domestic-demand oriented company due to its strong operationalturnaround story. We believe that during 2015 there will be better entry points for domestic-demand stocks (cement and infrastructure companies, for instance), since leading macrovariables do not yet reflect a solid recovery.
Our top pick stock is Milpo (Zinc, Lead, Copper) due to its highest expected returns oncapital investment for 2015 (+20%) after successful efforts to reduce costs in 2014 and acompelling story to expand operations with minimum Capex at the beginning of 2015. Thedownside for Milpo is its low liquidity levels (ADTV USD 500k) in comparison to otherbetter-known Peruvian metals (Buenaventura, Volcan).
Luz del Sur, a utility company (distributor), follows due to its steady ROAE between2012 and 2016 (+20%) and forthcoming diversification into the electricity generationbusiness at the end of 2015. The US Sempra energy subsidiary is also our top pick stock inthe sector.
Last, but not least, InRetail is a company with below average ROAE in the Peruviancompanies spectrum (7%), but one of our top picks in the Andean Retail segment due to itsimportant EPS growth in 2015-17 vs. regional peers (20%). Moreover, increased scale andimproved costs efficiency in coming years should rive improved investor returns. We alsobelieve that the recent increase in the stock’s volume could drive an inclusion in the foreignPeru-based stocks index.
Peruvian Picks
Andean Equities Guide, 2015 39
Last Target Mkt. 12-18 MonthPrice Price (PEN) Upside (USD mn) 2013 2014E 2015E 2013 2014E 2015E P/BV Div Yield Tot. Upside Sector
InRetail 18.50 24.30 31% 1,902 81.9 27.0 23.1 12.7 12.3 10.3 1.8 0.0% 31% RetailMilpo 2.50 3.25 30% 1,145 12.8 8.1 6.1 3.6 3.9 3.2 1.9 0.4% 30% MiningMinsur 1.75 2.20 26% 1,738 6.0 8.2 8.2 2.3 4.2 4.5 0.8 2.5% 28% MiningPeruvian Picks a 29% 4,786 33.6 14.5 12.5 6.2 6.8 6.0 1.5 1.0% 30%Peru Sample 17,700 17% 35,132 17.6 16.7 14.9 7.0 8.7 7.8 1.5 1.9% 19%a Simple average, excluding Market CapitalizationSource: Company Reports, Bloomberg and Credicorp Capital
P/E FV/EBITDA

EconomicForecasts

Economic Forecasts
Chile
Colombia
2011 2012 2013 2014/E 2015/PGDP (USD MM) 250,978 266,484 277,238 258,400 272,341Real GDP (y/y) 2.8 5.4 4.1 2.0 3.3Domestic Demand (y/y) 9.3 6.9 3.4 0.5 3.2
Total Consumption (y/y) 7.8 5.6 5.4 2.7 3.0Fixed Investment / GDP 23.7 25.1 23.9 22.0 22.1Inflation Rate 4.4 1.5 3.0 4.5 3.2Reference Rate (eop) 5.25 5.00 4.50 3.00 3.25Exchange Rate (eop) 520 479 525 580 565Exchange Rate (average) 484 487 495 566 573Fiscal Balance of the CPS (% GDP) 1/ 1.3 0.5 -0.6 -2.0 -1.8Trade Balance (USD MM) 11,040 2,507 2,116 5,437 5,747
Exports 81,438 77,965 76,684 78,141 80,720Imports 70,398 75,458 74,568 72,704 74,972
Current Account Balance (USD MM) -3,068 -9,081 -9,485 -4,910 -4,085(as %GDP) -1.2 -3.4 -3.4 -1.9 -1.5
International Reserves 41,979.0 41,640.0 41,094.0 42,080.3 43,090.2
Source: INE, BCCh, Dipres, BCP/Credicorp Capital Estimates
2011 2012 2013 2014/E 2015/PGDP (USD MM) 335,410 370,053 378,170 394,115 420,704Real GDP (y/y) 6.6 4.0 4.7 5.0 4.7Domestic Demand (y/y) 8.4 4.6 4.7 7.5 5.5
Total Consumption (y/y) 5.5 4.7 4.4 5.4 4.7Fixed Investment / GDP 27.4 27.5 27.6 29.8 30.7Inflation Rate 3.7 2.4 1.9 3.4 3.2Reference Rate (eop) 4.75 4.25 3.25 4.50 4.75Exchange Rate (eop) 1,938 1,767 1,932 1,970 2,050Exchange Rate (average) 1,848 1,797 1,869 1,955 2,050Fiscal Balance of the CPS (% GDP) 1/ -2.0 0.3 -0.9 -1.4 -1.4Trade Balance (USD MM) 5,359 4,023 2,202 -1,218 1,584
Exports 56,915 60,125 58,822 58,234 66,386Imports 51,556 56,102 56,620 59,451 64,802
Current Account Balance (USD MM) -9,854 -11,834 -12,722 -15,765 -15,145(as %GDP) -2.9 -3.2 -3.4 -4 -3.6
International Reserves 32,302.9 37,474.1 43,625.0 48,370.0 51,500.0
Source: DANE, BanRep, Bloomberg, Credicorp Capital Estimates 1/ Consolidated Public Sector (CPS): Corresponds to the fiscal balance of the government, including Non Financial Public Sector (Centralized and Non-Centralized), the BanRep, and Fogafín.
Andean Equities Guide, 2015 41

Economic Forecasts
Peru
2011 2012 2013 2014/E 2015/PGDP (USD MM) 170,759 192,933 202,319 202,955 208,444Real GDP (y/y) 6.5 6.0 5.8 2.8 4.8Domestic Demand (y/y) 7.7 8.0 7.0 3.1 4.2
Total Consumption (y/y) 6.0 6.1 5.4 4.3 4.4Fixed Investment / GDP 24.0 25.8 26.6 25.7 25.0Inflation Rate 4.7 2.6 2.9 3.0 2.0Reference Rate (eop) 4.25 4.25 4.00 3.25 3.25Exchange Rate (eop) 2.70 2.55 2.80 2.92 3.05Exchange Rate (average) 2.75 2.63 2.70 2.86 2.99Fiscal Balance (% GDP) 2.0 2.3 0.9 0.2 -0.3Trade Balance (USD MM) 9,224 5,232 -40 -2,981 -2,396
Exports 46,376 46,367 42,177 37,229 38,114Imports 37,152 41,135 42,217 40,209 40,510
Current Account Balance (USD MM) -3,177 -6,281 -9,126 -10,913 -10,194(as %GDP) -1.9 -3.3 -4.5 -5.4 -4.9
International Reserves 48,816.0 63,991.0 65,663.0 64,830.0 63,460.0
Source: INEI, Central Bank, Ministry of Finance, Credicorp Capital Estimates
Andean Equities Guide, 2015 42

SectorOverview

BanksTax reforms impacting profitability trends
SummaryA sector with divergent trends in Colombia and Chile. Colombianbanks will record attractive loan growth as there is ample room forfinancial products penetration in the country, and considering that thebooming infrastructure sector will require funding in the next 6-8 years.However, even though the ROAE should expand on increasing scale,Chilean banks will remain materially more profitable than theirColombian peers. In Chile, the moderation of the economy is weighingon credit demand and could affect asset quality, but the franchises willmaintain their high profitability (among the most attractive vs globalstandards), despite such downward trend. Both trends will benegatively affected by tax reforms.
Our regional favorites are Davivienda and Santander Chile. We thinkthat the strategy and management of both banks are solid. Davivienda iscurrently outperforming its Colombian peers in ROAE despite its lowermarket share. As well, the shares look just too discounted to let go, evenincluding the potential effects of the tax reform; the main risk is apotential capital increase towards the end of 2015 or 2016. Santandershines as the most efficient franchise under our coverage, and forwardmultiples look attractive enough to take a constructive view despite thechallenges facing Chile’s economy. Nonetheless, we highlight that weremain moderately positive in the entire banking spectrum: inColombia due to long-term growth opportunities; in Chile due todepressed valuation metrics and high profitability.
In Chile, the outlook of the economy is still the main risk. So far, the NPLratio has not been materially affected, but is a variable to monitor. Otherrisks include regulatory changes, especially the adoption of BIS III, andstronger competition in a more mature industry. In Colombia, the finaloutcome of the tax reform is a main risk. Industry-specific, anythingpreventing Colombian banks from improving their efficiency andprofitability (including -unlikely- M&A activity) is a significant risk.
Juan Dominguez(+571) 339 4400 Ext 1026
Coverage universe
Banks Rec. T.P.bca us BUY 22.8bch us BUY 89.0bci ci RESTRICTEDbogota cb UPERFORM 71,000bsac us BUY 28.0bsan ci BUY 40.0chile ci BUY 86.0cib us HOLD 65.0corpbanc ci BUY 8.80pbcolo cb HOLD 33,200pfaval cb HOLD 1,530pfdavvnd cb BUY 35,300smchileb ci BUY 228
corficol cb HOLD 44,000gruposur cb HOLD 46,400
Financials non-banks
Valuation Summary
2013 2014E 2015E 2016E 2013 2014E 2015E 2013 2014E 2015EBanco de Chile 69.9 11,429 13.8 11.5 11.6 10.9 3.1 2.7 2.5 23.9% 24.4% 23.0%BCI 31,403 5,857 10.4 n.a. n.a. n.a. 2.0 n.a. n.a. 20.0% n.a. n.a.Corpbanca 7.40 4,320 15.9 12.5 13.2 9.9 1.7 1.6 1.3 13.2% 13.5% 12.8%Santander 31.6 10,204 13.0 11.3 11.4 10.6 2.5 2.3 2.1 19.8% 21.5% 19.5%Bancolombia 28,720 13,302 13.2 14.0 11.7 10.4 1.6 1.7 1.5 12.6% 13.7% 13.8%Daviv ienda 28,700 6,238 12.3 12.6 11.2 9.6 1.7 1.9 1.7 14.9% 15.7% 15.8%Grupo Aval 1,325 14,446 15.1 15.2 12.8 11.4 2.2 1.9 1.8 15.4% 13.7% 14.4%Bogota 69,440 10,447 14.9 14.4 12.2 10.7 2.2 2.0 1.8 15.8% 14.4% 15.6%
ROAEP/E P/BPrice (local)
Market Cap (USD mn)
Andean Equities Guide, 2015 44

Loan growth in Colombia should remain in 14%-15% rates, while in Chile, it should rebound to 10%-11% starting in 2015.
Tax reforms are weighing in the expected ROAEs in both Colombia and Chile.
Industry trends
The growth outlook stills favors Colombia over Chile. The GDP trend in Colombialooks appealing for the next 5 years, fueled by domestic demand. Elasticity of loan growthagainst GDP stands at more than 2x as a result of the relative under-penetration of theindustry, with a loan-to-GDP ratio at ~40%. This means that in a scenario of economicgrowth in the 4.5%-5.0% range (our base scenario for coming years), loan growth shouldaverage 14%-15% a year. Moreover, the booming infrastructure sector will require fundingfrom local banks for the next 6-8 years, an additional catalyst for loan growth. Also, eventhough we are cautious on consumer lending due to the observed increases in thehousehold debt burden, this variable still stands below some countries in Latam (i.e.Brazil), and there is still room to grow in this segment as GDP per capita, laborformalization, employment, and the middle class increase. The main risk comes from theoil & gas sector, as pressures on the fiscal front could lead to further increases in taxes,affecting confidence and credit demand, as observed in Chile during 2014.
On the other hand, the Chilean banking industry is a more mature market with ~80% loan-to-GDP ratio, but still has grown at a 1.5x elasticity against GDP in real terms. In this periodof economic moderation, we expect loan growth to close at 9% in 2014, picking up in thefollowing years to rates between 10%-11%, as the economy rebounds. We highlight thatwe are still not expecting a major impact of this moderation on the economy in NPL ratios,as following Ley DICOM, banks adjusted their strategies and focused on more affluentindividuals. As a consequence, the industry is more resilient today to a slowdown.Nonetheless, asset quality is a variable that we are constantly monitoring in Chile, giventhe expectations of a pick-up in unemployment and the deceleration of consumption.
ROAE trends in both Colombia and Chile will be affected by tax reforms. We haveincorporated both the increase of the Chilean corporate tax to 27%, and the increase of theCREE in Colombia to 12%, which drives the total statutory tax rate to 37%. Clearly, thesetax reforms are having a negative effect on the profitability trends in both industries. Wehighlight that in the case of Colombia, the adoption of IFRS could translate into furtherimpacts on profits, as under ColGAAP, companies have the option to not cause the equitytax via income statement using equity items. However, as the net effect of the adoption ofIFRS is currently unknown, we are only incorporating the increase on CREE.
Elasticity of loans to real GDP in Colombia and Chile
Source: SFC, BanRep
-4x-3x-2x-1x0x1x2x3x4x5x
Dec-03 Jan-06 Jan-08 Jan-10 Jan-12 Jan-14
Chile
-1x
0x
1x
2x
3x
4x
5x
Dec-03 Jan-06 Jan-08 Jan-10 Jan-12 Jan-14
Colombia
Andean Equities Guide, 2015 45
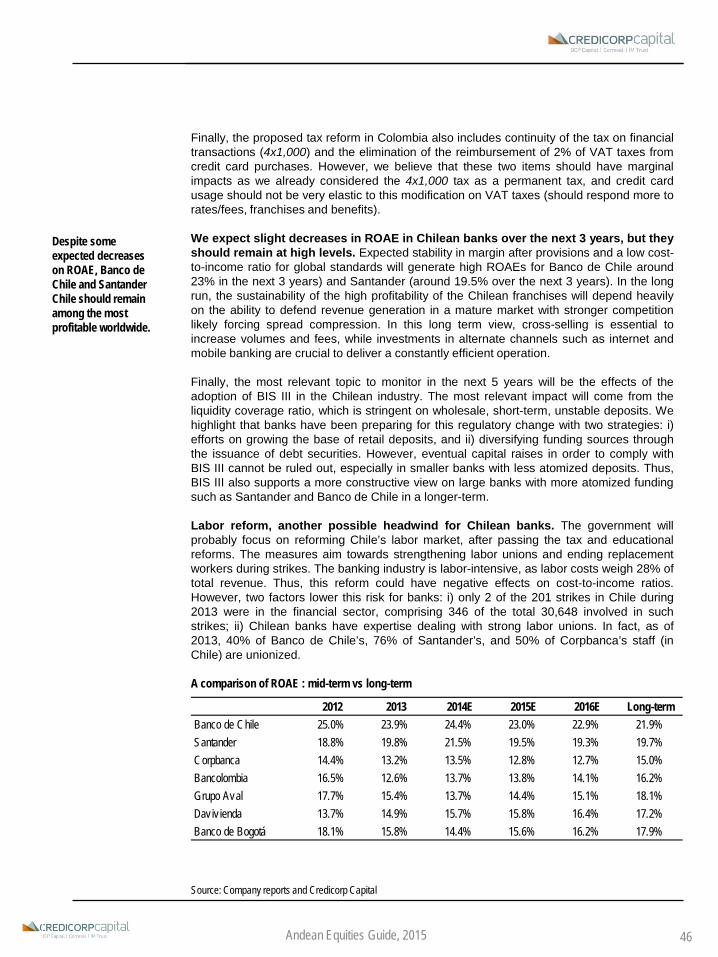
Despite some expected decreases on ROAE, Banco de Chile and Santander Chile should remain among the most profitable worldwide.
Finally, the proposed tax reform in Colombia also includes continuity of the tax on financialtransactions (4x1,000) and the elimination of the reimbursement of 2% of VAT taxes fromcredit card purchases. However, we believe that these two items should have marginalimpacts as we already considered the 4x1,000 tax as a permanent tax, and credit cardusage should not be very elastic to this modification on VAT taxes (should respond more torates/fees, franchises and benefits).
We expect slight decreases in ROAE in Chilean banks over the next 3 years, but theyshould remain at high levels. Expected stability in margin after provisions and a low cost-to-income ratio for global standards will generate high ROAEs for Banco de Chile around23% in the next 3 years) and Santander (around 19.5% over the next 3 years). In the longrun, the sustainability of the high profitability of the Chilean franchises will depend heavilyon the ability to defend revenue generation in a mature market with stronger competitionlikely forcing spread compression. In this long term view, cross-selling is essential toincrease volumes and fees, while investments in alternate channels such as internet andmobile banking are crucial to deliver a constantly efficient operation.
Finally, the most relevant topic to monitor in the next 5 years will be the effects of theadoption of BIS III in the Chilean industry. The most relevant impact will come from theliquidity coverage ratio, which is stringent on wholesale, short-term, unstable deposits. Wehighlight that banks have been preparing for this regulatory change with two strategies: i)efforts on growing the base of retail deposits, and ii) diversifying funding sources throughthe issuance of debt securities. However, eventual capital raises in order to comply withBIS III cannot be ruled out, especially in smaller banks with less atomized deposits. Thus,BIS III also supports a more constructive view on large banks with more atomized fundingsuch as Santander and Banco de Chile in a longer-term.
Labor reform, another possible headwind for Chilean banks. The government willprobably focus on reforming Chile’s labor market, after passing the tax and educationalreforms. The measures aim towards strengthening labor unions and ending replacementworkers during strikes. The banking industry is labor-intensive, as labor costs weigh 28% oftotal revenue. Thus, this reform could have negative effects on cost-to-income ratios.However, two factors lower this risk for banks: i) only 2 of the 201 strikes in Chile during2013 were in the financial sector, comprising 346 of the total 30,648 involved in suchstrikes; ii) Chilean banks have expertise dealing with strong labor unions. In fact, as of2013, 40% of Banco de Chile’s, 76% of Santander’s, and 50% of Corpbanca’s staff (inChile) are unionized.
A comparison of ROAE : mid-term vs long-term
Source: Company reports and Credicorp Capital
2012 2013 2014E 2015E 2016E Long-termBanco de Chile 25.0% 23.9% 24.4% 23.0% 22.9% 21.9%Santander 18.8% 19.8% 21.5% 19.5% 19.3% 19.7%Corpbanca 14.4% 13.2% 13.5% 12.8% 12.7% 15.0%Bancolombia 16.5% 12.6% 13.7% 13.8% 14.1% 16.2%Grupo Aval 17.7% 15.4% 13.7% 14.4% 15.1% 18.1%Daviv ienda 13.7% 14.9% 15.7% 15.8% 16.4% 17.2%Banco de Bogotá 18.1% 15.8% 14.4% 15.6% 16.2% 17.9%
Andean Equities Guide, 2015 46

In Colombia, the catalyst for ROAE expansion will be the ability of each bank to improve efficiency ratios.
In Colombia, ROAE should increase as a result of a change in strategy from growingaggressively to improving profitability. The period of high M&A activity has (probably)paused for a while, as banks must now deliver in terms of profitability, and the costs ofinorganic growth strategy have surged as a result of a more stringent regulatory capitalframework. Moreover, management has generally changed their strategies towardsimproving the profitability of their operations. We consider that the Colombian banks willvery likely be able to deliver in terms of efficiency on operating scale, given the expectationof a stable headcount and branch network. In fact, Colombian banks are starting to migratefrom growth in the brick-and-mortar network, to investments in alternate channels such asinternet and mobile banking. Growing efforts on efficiency, jointly with slight upsidepressures on NIM as a result of the hikes in the CB policy rate during 2014 should reflecton ROAE expansion in Colombia.
However, given the recent change in the solvency requirement and the competitiveenvironment in Colombia, management’s ability to deliver in terms of cost-to-income ratiowill determine how important this expansion will ultimately be on profitability. In this contextwe like Davivienda, as higher spreads, conservative risk management, a strategy towardsproviding packages of product to families (which allows for cross-selling) and growingefficiency efforts should drive outperformance in terms of profitability (in the absence of alarge capital injection) in the following 5 years. Nonetheless, due to its effectiveness incost-control strategies, Grupo Aval should be the outperformer in terms of efficiency andthus, in ROAE, over the long-run.
Besides taxes, the most relevant risk in terms of profitability is dilution for Davivienda andespecially for Banco de Bogotá, as the Tier 1 ratios of these institutions are below what wethink is the comfort zone in Colombia (8%-9%). Central America is also a challenge, assome of the recently acquired operations are still requiring opex (IT platforms, brands,etc.), and the loan growth in that region is forecasted to be lower than in Colombia. Finally,an eventual law on financial conglomerates could have an impact, especially for GrupoAval, which must not comply to capital adequacy requirements at a consolidated levelunder current regulation.
P/E 12M Forward (vs 5-year average): Supporting a cross-sector positive stance
Source: Bloomberg, Credicorp Capital
Andean Equities Guide, 2015 47

Relative ValuationCredicorp Capital Coverage Universe
Latam Relative Valuation
Source: Bloomberg, Company Reports, Credicorp Capital; * Credicorp Capital earnings models; As of October 21st, 2014
BancoMacro
GFGalicia
Banco doBrasil
BradescoItaú
SantanderBrasil
Banrisul
Banco de Chile*
SantanderChile*
Corpbanca*
BCIBancolombia*Davivienda*
Grupo Aval*
Banco deBogotá*
Bladex
CredicorpIFS
GrupoBanorte
GrupoInbursa
SantanderMéxico
Compartamos
CréditoReal
Banregio
y = 13.998x + 1.334R² = 0.7241
0.0
0.5
1.0
1.5
2.0
2.5
3.0
3.5
4.0
4.5
5.0
-6% -4% -2% 0% 2% 4% 6% 8% 10% 12% 14% 16%
Last
Px /
B 20
14E
[ ROAE - Ke ] 2015E
Market Cap CC(USD mn) Rating 2013 2014E 2015E 2016E 2013 2014E 2015E 2013 2014E 2015E 2013 2014E 2015E
Credicorp Capital Coverage UniverseBanco de Chile 11,349 BUY 13.8 11.5 11.6 10.9 3.1 2.7 2.5 4.5% 4.9% 5.4% 23.9% 24.4% 23.0%BCI 5,857 RESTRICTED 10.4 n.a. n.a. n.a. 2.0 n.a. n.a. 3.0% n.a. n.a. 20.0% n.a. n.a.Corpbanca 4,320 BUY 15.9 12.5 13.2 9.9 1.7 1.6 1.3 2.4% 3.5% 2.7% 13.2% 13.5% 12.8%Santander 10,204 BUY 13.0 11.3 11.4 10.6 2.5 2.3 2.1 4.1% 4.5% 5.3% 19.8% 21.5% 19.5%Chile Median 8,030 13.4 11.5 11.6 10.6 2.2 2.3 2.1 3.5% 4.5% 5.3% 19.9% 21.5% 19.5%Bancolombia 13,302 HOLD 13.2 14.0 11.7 10.4 1.6 1.7 1.5 3.2% 2.7% 2.9% 12.6% 13.7% 13.8%Dav iv ienda 6,238 BUY 12.3 12.6 11.2 9.6 1.7 1.9 1.7 2.4% 2.2% 2.4% 14.9% 15.7% 15.8%Grupo Av al 14,446 HOLD 15.1 15.2 12.8 11.4 2.2 1.9 1.8 4.0% 4.0% 4.4% 15.4% 13.7% 14.4%Bogota 10,447 UPERF 14.9 14.4 12.2 10.7 2.2 2.0 1.8 3.2% 3.5% 3.6% 15.8% 14.4% 15.6%Colombian Median 11,875 14.0 14.2 11.9 10.6 2.0 1.9 1.7 3.2% 3.1% 3.2% 15.2% 14.1% 15.0%
ROAEP/E P/B Dividend Yield
Andean Equities Guide, 2015 48
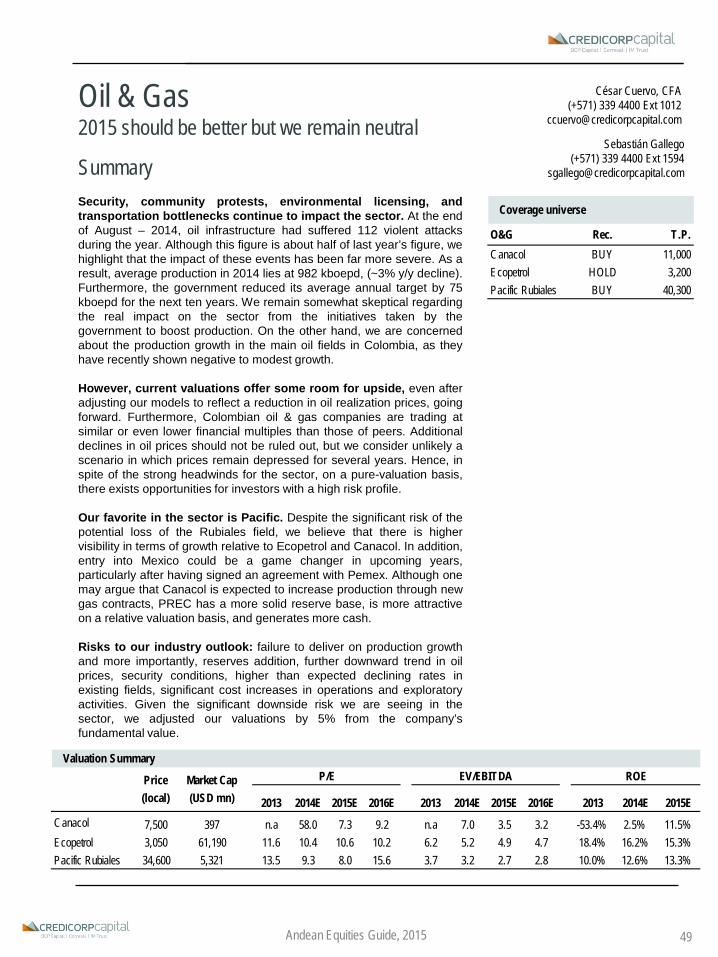
Oil & Gas2015 should be better but we remain neutral
SummarySecurity, community protests, environmental licensing, andtransportation bottlenecks continue to impact the sector. At the endof August – 2014, oil infrastructure had suffered 112 violent attacksduring the year. Although this figure is about half of last year’s figure, wehighlight that the impact of these events has been far more severe. As aresult, average production in 2014 lies at 982 kboepd, (~3% y/y decline).Furthermore, the government reduced its average annual target by 75kboepd for the next ten years. We remain somewhat skeptical regardingthe real impact on the sector from the initiatives taken by thegovernment to boost production. On the other hand, we are concernedabout the production growth in the main oil fields in Colombia, as theyhave recently shown negative to modest growth.
However, current valuations offer some room for upside, even afteradjusting our models to reflect a reduction in oil realization prices, goingforward. Furthermore, Colombian oil & gas companies are trading atsimilar or even lower financial multiples than those of peers. Additionaldeclines in oil prices should not be ruled out, but we consider unlikely ascenario in which prices remain depressed for several years. Hence, inspite of the strong headwinds for the sector, on a pure-valuation basis,there exists opportunities for investors with a high risk profile.
Our favorite in the sector is Pacific. Despite the significant risk of thepotential loss of the Rubiales field, we believe that there is highervisibility in terms of growth relative to Ecopetrol and Canacol. In addition,entry into Mexico could be a game changer in upcoming years,particularly after having signed an agreement with Pemex. Although onemay argue that Canacol is expected to increase production through newgas contracts, PREC has a more solid reserve base, is more attractiveon a relative valuation basis, and generates more cash.
Risks to our industry outlook: failure to deliver on production growthand more importantly, reserves addition, further downward trend in oilprices, security conditions, higher than expected declining rates inexisting fields, significant cost increases in operations and exploratoryactivities. Given the significant downside risk we are seeing in thesector, we adjusted our valuations by 5% from the company’sfundamental value.
Coverage universe
O&G Rec. T.P.Canacol BUY 11,000Ecopetrol HOLD 3,200Pacific Rubiales BUY 40,300
Sebastián Gallego(+571) 339 4400 Ext 1594
César Cuervo, CFA(+571) 339 4400 Ext 1012
Valuation Summary
2013 2014E 2015E 2016E 2013 2014E 2015E 2016E 2013 2014E 2015ECanacol 7,500 397 n.a 58.0 7.3 9.2 n.a 7.0 3.5 3.2 -53.4% 2.5% 11.5%Ecopetrol 3,050 61,190 11.6 10.4 10.6 10.2 6.2 5.2 4.9 4.7 18.4% 16.2% 15.3%Pacific Rubiales 34,600 5,321 13.5 9.3 8.0 15.6 3.7 3.2 2.7 2.8 10.0% 12.6% 13.3%
ROEP/E EV/EBITDAPrice (local)
Market Cap (USD mn)
Andean Equities Guide, 2015 49

2015 should be better in terms of production relative to 2014; however, we are cautious until we see ramp up on key fields.
Lower oil prices for a sustained period of time may add downside risk to valuations.
Industry trends
Production growth has been disappointing and thus we are taking a“seeing-is-believing” approach. The top ten producing fields have declined 6.4% y/yrelative to 2013 (YTD as of August). Higher declining rates as well as operating restrictionshave weighed on production. Furthermore, the announcements made by theGovernment in mid June – 2014, cutting crude production estimates, has made uscautious enough to be neutral-negative towards the O&G sector in Colombia. Wehave talked to different local agents related to the sector and we continue to receive anegative, yet a slightly more optimistic perception due to current conditions and moreimportantly to the lack of new oil discoveries. Thus, we highlight that the Government’sbase-case scenario on average production between 2014 and 2023 is placed at 1,072.This contrasts with a more pessimistic view by other agencies, such as ACP and ANIF,which forecast an average of 830 and 947 kboepd for the next 10 years, respectively.
By digging into the previous production figures, we conclude the following: i) we questiononce again Ecopetrol and its production targets as the timing simply seems unrealistic inthe absence of inorganic growth; ii) the process to increase recovery factors need to speedup and deliver real results on production; iii) should the companies fail to announce newsignificant discoveries, the sustainability of the sector may be at risk; and iv) last but notleast, we do not expect shale oil to have a material impact on production in the short tomedium term. In fact, recent comments made by local players point to a 7 year time spanbefore we see relevant production figures from unconventional plays.
Lower oil prices add more downside risk to O&G players. A recent, major disruption inthe oil market has placed WTI and Brent at the lowest levels of the last two years.Currently, those references are quoted at USD 80-85 and USD 85-90, respectively which isequivalent to a ~10% and ~15% decline during 2014. Key aspects may explain this priceperformance: i) the increased production from unconventional reservoirs in the US hasreduced oil imports from that country, still the world’s largest consumer of energy; ii) Libyahas more than doubled production since June-2014, while Saudi Arabia refuses to cutcurrent levels of production, unleashing what seems to be an internal crisis within OPEC;and iii) lower demand from Europe and China as economic growth fades (differentsituations, but placing lower demand for crude in both cases). As crude prices dip belowUSD 90/bl, we highlight that oil realization prices for the local companies may be underpressure. Our models contemplate a range between USD 85 and USD 95 per barrel.Should oil prices sustain this negative trend, valuations may be at additional risk.
Colombian crude production and oil benchmark prices
Source: ANH, Bloomberg, Credicorp Capital
Andean Equities Guide, 2015
0
200
400
600
800
1,000
1,200
-10%-5%0%5%
10%15%20%25%30%
Jan-07 Jan-09 Jan-11 Jan-13
Thousands of barrels per day
Annu
al ch
ange
Production Annual change
859095
100105110115120
ene-13 jun-13 nov-13 abr-14 sep-14
USD
per b
arre
l
WTI Brent
50

The industry requires further investments in exploratory activities, particularly from Ecopetrol.
Given lower oil price assumptions, profitability should decrease or at least remainunchanged. Although lower oil prices should have a negative impact on profitability, weforecast a different impact across local O&G players based on each company’s strategy.First, Ecopetrol should partially mitigate this impact as the Cartagena refinery is expectedto resume operations in 2015. Nevertheless, we see downside risk for operating marginsgiven higher than expected exploration costs associated with disappointing results on thisfront. We forecast an EBITDA margin close to 40% for both 2014 and 2015, distant fromthe levels seen in 2011 and 2012 (46.9% and 42.6%, respectively). On the other hand, weestimate a 7.1% and 5.1% decline in operating netbacks for Pacific Rubiales for 2015 and2016 relative to 2014E. Lower realization oil prices explain our forecast. Finally, lower oilprices should weigh on Canacol’s netback while a more gas-oriented production mixbeyond 2015 may place additional downward pressure on the company’s operatingnetback. Thus, we forecast a netback of USD 37.05 barrel in fiscal 2016 relative to USD44.71 barrel for fiscal 2015. Despite this trend, we highlight that Pacific Rubialesshould maintain higher EBITDA margins relative to peers, at least in 2015.
CAPEX deployment always at question. We urge Ecopetrol to be more aggressive interms of capital investments. Presidential elections in June and the electoral guarantylaw restricted investments made by Ecopetrol in 1H14. Despite these events, we highlightthat CAPEX deployed over the last years by the state-controlled company has been belowinitial guidance. This continues to be worrisome as the O&G industry requires furtherinvestment in exploration to extend the reserves/production ratio. The ACP (Colombian OilAssociation) estimates that there is a need to drill between 130 and 340 wells per year (vs.to 115 observed in 2013) in order to close the gap between reserves and the productionforecast made by the government (new fiscal framework released in mid June- 2014). Weare particularly worried on Ecopetrol as it represents over ~65% of local crude production.
Heavy rains in key areas of fields operated by Pacific Rubiales delayed the construction offacilities and production growth from CPE-6 and Rio Ariari. Thus, we do not expect thecompany to deploy capital for 2014 as it was initially planned.
The recent equity issuance and an increase of debt by Canacol should support capitalrequirements for at least the 2015 fiscal year. Nevertheless, we continue to project highercapital investment needs relative to the company’s guidance; this explained by a potentiallysignificant ramp up of production.
* 2014 CAPEX deployment of local O&G companies in our coverage universe (as of June)
*Canacol figures at the end of fiscal 2014; Ecopetrol and Pacific at the end of 1H14Source: Company Reports, Credicorp Capital
Andean Equities Guide, 2015
150
10,595
2,500188
3,468
992
125.4%
32.7%
39.7%
0%
20%
40%
60%
80%
100%
120%
140%
0
2,000
4,000
6,000
8,000
10,000
12,000
Canacol Ecopetrol Pacific Rubiales
USD
mill
ion
Guidance CAPEX deployed % completion
51

Mexico could represent a threat towards FDI to the O&G industry.
Mexico could be a game changer for some companies, but higher competition forthe local industry as a whole. Foreign direct investment towards the local O&G sector in2013 declined 6.6% y/y, while the same figure at the end of 1H14 decreased 5.1% relativeto the same period of 2013. A reversal in security and market conditions has weighedagainst further investment in the industry. Needless to say, lower expectations by thegovernment may be preventing new investments as it was the case in the latest biddinground conducted by the ANH (National Hydrocarbons Agency). The Ronda Colombia 2014only received bids for 28% of the areas, well below expectations and lower than +40%assigned in the previous round.
As conditions of the local O&G sector deteriorate, the energy reform proposed in Mexico isexpected to have a negative impact on FDI in Colombia. With 11,100 mmboe of provenreserves, Mexico has 4.6x bigger reserves than Colombia. In addition, prospectivity andnew rules for foreign players could change Mexico’s recent negative trend in terms ofproduction. Although this could represent a major game changer for the local O&G sectorand the companies listed, we believe that key concerns remain on the air. First, weacknowledge that the energy reform has been on schedule so far; however, the initialareas will be only auctioned until late 2015. Thus, this initiative is expected to take a whilebefore we see some benefits. Beyond timing, additional questions come from theregulatory front and we expect to gain further insight in upcoming quarters.
In terms of local O&G players, we favor once again Pacific Rubiales as we see thecompany taking the necessary steps to take advantage of this opportunity.
We do not expect (or at least hope!) that new events such as Caño Limon occurs butongoing concerns regarding the sector remain. The Presidential elections in Junedefinitely had a negative effect in terms of violent attacks. We do expect that these eventsdecrease as we go forward (new results coming from the peace talks could change thisview). Nevertheless, we are not so confident about the social communities andenvironmental licensing issues. A redistribution of oil royalties among the country in orderto benefit other non-producing areas has resulted in disputes by local communities inproducing areas. In addition, some of these communities are constantly debating againstoil drilling campaigns to preserve the ecosystem. On the other hand, the government hasannounced additional efforts to speed up the licensing process. Nevertheless, local playershave expressed their concerns as obtaining licenses continues to take between 12 and 18months. Last, but not least, we believe that further improvements in the oil infrastructureare needed so that the industry becomes more competitive relative to other countries.
Total violent attacks and average length per *blockade
Source: Minister of Defense, ACP, Credicorp Capital*Blockades up to July 31st – 2014. A total of 239 blockades took place up to this date. These are the most relevant.
Andean Equities Guide, 2015
215
261
86
184
98
155
106
5332 32 31
84
151
225
112
0
50
100
150
200
250
300
2000 2002 2004 2006 2008 2010 2012 2014
Tota
l atta
cks
910
9
2
4
2 21
5
1 1 1 1 1 1 1
0
2
4
6
8
10
12
1 2 3 4 5 6 7 8 10 12 13 14 15 20 22 35
Days
52

Relative Valuation
Worldwide vertical integrate O&G players - relative valuation
E&P players- relative valuation
Source: Bloomberg, Company Reports, Credicorp Capital; * Credicorp Capital earnings models; As of October 3rd, 2014
Petrobras
Petrochina
HuskyTotal
Lukoil
Ecopetrol
BP
Chev ron
Ex x on
Shell
579
11131517192123
0x 10x 20x 30x 40x
1P R
eser
ves /
Pro
ducti
on (y
ears)
EV/1P Reserves
Petrobras
Ex x on
PetrochinaShell
Total
Repsol
Hess
Conoco Chev ron
Ecopetrol
YPF
4x
6x
8x
10x
12x
14x
16x
18x
20x
3.5x 4.0x 4.5x 5.0x 5.5x 6.0x 6.5xP/
E 20
15E
EV EBITDA 2015E
Canadian Natural
Resources
Bankers
Bay texCanada Oil Sands
Tourmaline
Bonav ista Energy
Gran Tierra
ParexCanacol Pacific Rubiales
0x
2x
4x
6x
8x
10x
12x
0x 5x 10x 15x 20x 25x 30x
EV/E
BITD
A 20
14E
EV/2P
Canadial Oil
Encana Canadian Natural
Bay tex
Bankers Petro.
Rosetta Resources
Pacific Rubiales Canacol
Parex
4x5x6x7x8x9x
10x11x12x13x14x
2x 3x 4x 5x 6x 7x 8x
P/E
2015
E
EV/EBITDA 2015E
Andean Equities Guide, 2015 53

MinersAfter the fall, just a few continue to bounce back
SummaryMetallic miners follow different paths to recovery. Not all metals facethe same future. Industrial metals related to construction showunsupportive price outlooks. Precious metals correction might have notended. But the underlying silver lining of China’s consumption growththat favors zinc, lead and tin, couple with operational soundness -andeven near term profitable growth- to pick the winners.
Our regional favorite in the sector is Milpo. We like the fact that it isthe miner with the closest catalysts in sight (with easy and cheapexpansions). Milpo has outperformed its peers and the IGBVL as itfound itself operationally sound and ready to ride the zinc price surge.Both trends should continue in 2015. Another important point to mentionis that its new CEO has succeeded in improving Milpo’s project deliverytrack record. The risk to near term growth comes from long delayedgreen fields and operational integrations that could be hard to execute.
Minsur also stood out thanks to its cost control and stable productionin a changing metal market such as that of tin, which happens to beanother metal with a favorable supply-demand balance. It was alsoencouraging that Minsur’s Brazilian operations started to yield positiveresults. However, despite recent exploration success, life of mine inreserves continue to be limited and the Chilean operations remainchallenging.
Cost contention seems to have been overcome, but cost reductions maywell be the next challenge for the miners. It will not be an easy task asmines age and head grades start to dwindle while miners avoid highgrading that may shorten the life of their mines. On the growth front, longtime worked on expansions are about to finish and even a new phase ofgrowth projects is being tailored to face the new price setting and costenvironment (notably on Buenaventura and Volcan). We do not givethem the full benefit of the doubt yet and have chosen our top picksbased on proven cost control and non-complicated near termexpansions instead of new operations. The new growth projects couldbe transformational, but it is still too early to tell.
Hector Collantes(+511) 416 3333 Ext 33052
Metal prices used (USD/MT or USD/oz)
2014 2015 2016 2017 LT
Zinc 2,128 2,275 2,450 2,500 2,000
Lead 2,174 2,249 2,250 2,231 2,000
Copper 7,025 6,899 6,620 6,514 6,000
Silv er 20.4 20.6 20.2 20.0 19.0
Gold 1,279 1,221 1,200 1,200 1,100
Tin 22,985 23,558 23,277 23,168 19,000
Coverage universe
Mining Rec. T.P.bvn us HOLD 12.90cverdec1 pe UPERF 21.00milpoc1 pe BUY 3.25minsuri1 pe BUY 2.20volcabc1 pe HOLD 1.10
Andean Equities Guide, 2015
Valuation Summary
2013 2014E 2015E 2016E 2013 2014E 2015E 2013 2014E 2015EBuenaventura 11.16 3,076 nm 25.1 24.6 17.6 4.2 7.0 6.7 nm 3.1% 3.1%Cerro Verde 24.30 8,506 14.0 18.2 17.6 6.9 7.3 9.4 8.6 16.3% 10.9% 10.1%Volcan 0.94 1,742 11.7 20.7 8.6 7.8 7.0 12.4 7.5 12.3% 5.5% 12.2%Milpo 2.50 1,145 12.8 8.1 6.1 4.6 3.6 3.9 3.2 12.6% 22.6% 23.9%Minsur 1.75 1,738 6.0 8.2 8.2 8.5 2.3 4.2 4.5 10.7% 7.6% 6.5%
ROAEPrice (USD/PEN)
Market Cap (USD mn)
P/E FV/EBITDA
54

The commodities super-cycle has decelerated but a Chinese hard landing seems unlikely.
China’s consumption growth is keen on supply stressed commodities, some of which are found in South America among established producers.
Industry trends
China’s slowdown has brought each metal’s underlying supply-demand balanceback to the fore. Not all of metals have underperformed equity indexes in 2014. Thestories of bulk metals (iron ore, coal) are firmly intertwined with the woes of the largestglobal miners that rushed to develop ample supplies for the seemingly endless Chineseglut for construction materials (specially steel) that faced a sudden stop among billiondollars write-downs and CEO removals. Precious metals (gold, silver) priced the overallfinancial risk as major economies embarked on one of the largest monetary experiments ofall time, whereas their miners went to ever riskier projects to find gold or silver on secludedplaces, mixed with copper only to discover themselves crashed and burned when theperceived financial risk receded in the midst of growth in the US. Base metals (copper,aluminum, zinc, tin) were sold together in the same basket after China’s 2Q13 growth trendchanged only to be cherry picked throughout 2014 when market imbalances bit in.
Latin American miners are important actors in those three areas. In the metallic nonferroussphere, Peruvian miners are a case in point with their long tradition and relativelyinexpensive operations backed by cheap energy. Albeit copper and gold still make thelargest contribution to export revenues, zinc, lead or tin are also largely produced in Peru.
Zinc, lead and tin rank firmly among the winners, and we think that they will continueto outperform in 2015. Iron ore and copper have been pricing the looming excess supplycoming to those markets and the demise of construction led growth in China. However,zinc or tin prices rose as their limited supply (8% of global zinc will be gone with largemines closing in Canada and Australia, while 30% of global tin is constrained in Indonesia)hardly meets China’s consumption demand growth (car/per capita is 0.11x that of the US).
Commodities have started to regain notoriety as an asset class while their correlations startto differentiate again from those of general equity markets. Their investment case is not ablind bet on Chinese growth anymore. Shares capable of capitalizing the difference, suchas Milpo or Minsur, have started to outperform.
Sources: Bloomberg, Credicorp Capital
Cu and Fe prices (left), China industrial production growth (right) Zn, Pb and Sn prices (left), China manufacturing PMI (right)
Andean Equities Guide, 2015
6.5%
7.5%
8.5%
9.5%
10.5%
11.5%
12.5%
13.5%
50
60
70
80
90
100
110
120
D-2011 J-2012 D-2012 J-2013 D-2013 J-2014
Copper Iron ore China Industrial Production
46
47
48
49
50
51
52
53
54
90
95
100
105
110
115
120
125
130
135
D-2011 J-2012 D-2012 J-2013 D-2013 J-2014Zinc Lead
Tin China manufacturing PMI
55

Cost control has been the main focus to date. But margins are still not at previous levels.
After the 2013 metal price slump, 2014 wound licking spurred cost structurereengineering. Streamlining seems to have settled among the Peruvian miners, followingthe new downward trends now expected for metal prices since the 2013 change in Chinesegrowth. Costly mines had to be discarded, such as Buenaventura did by disposing of foursmall assets (Antapite, Poracota, Shila-Paula and Recuperada), Milpo had to deactivate itssmall copper mines (Iván and Chapi) while Volcan faced the partial closure of its largestopen pit (Pasco) in the middle of a fragile situation for metal prices. Buenaventura andMilpo have capped those losses to a minimum, while Volcan is still working in the area toprove the feasibility of other growth projects.
Moreover, sustaining capex was initially cut, negotiations with suppliers ensued and, as wehighlighted throughout 2013 and 2014, cost control was the top discerning factor to securea good top pick. Milpo, Volcan and Minsur initially stood out, Cerro Verde andBuenaventura have started to fare better. Notwithstanding, when adding current reducedmetal prices into consideration, gross margins are still not at 2012 levels.
The differentiated metal price rebound of 2014 found stronger miners, and thosebetter surefooted were rewarded dearly outperforming metals themselves. Peruvianmining shares started to outperform metal prices for the first time since the latter days ofthe boom in 2012 as cost inflation stopped eroding margins.
The early outperformers were Minsur (22.4% YTD) and Milpo (41.2% YTD), as Volcan washit by low silver prices (-10.1% YTD). These miners happened to be relatively isolated fromthe large copper mine building in southern and central Peru (Las Bambas, Toromocho,Constancia and Cerro Verde) and did not participate in the buying spree of scarceresources. As a comparison, global mining ETFs such as MSCI’s PICK (-9.9% YTD),SPDR’s XME (-18.6% YTD), or the juniors JUNR (-12.9% YTD) have been clearunderperformers of the S&P500 (+4.5% YTD).
Peruvian miners are also sensitive to political outcomes. Since June 2014 when politicalhindrances seemed to have waned, Buenaventura (-0.5% YTD, +4.4% since June) startedto outperform gold mining peers (+0.3% YTD, -6.2% YTD) and the gold price (+3.2% YTD,-0.34% since June).
Energy cost, CAGR (2011-2032), bubble size: Cu Output 2012 Gross Margin of Selected Peruvian miners (1Q12-2Q14)
Sources: CRU, Company filings, Credicorp Capital
Congo
Zambia
Russia
Canada
United States
Peru MexicoChina
Australia
Chile
0
2
4
6
8
10
12
14
16
18
0 5 10 15 20
Cost
of en
ergy
CAG
R (2
002-
2012
)
USD cent / kWh (2012)
59%50% 53%
44% 44% 39% 45% 43% 38% 38%
0%
20%
40%
60%
80%
100%
120%
140%
160%
180%
200%
0
200,000
400,000
600,000
800,000
1,000,000
1,200,000
1,400,000
1,600,000
1,800,000
1Q12 2Q12 3Q12 4Q12 1Q13 2Q13 3Q13 4Q13 1Q14 2Q14
Gross Margin Revenues COGS
918 641
531
586
677
824
694 644476 529
Andean Equities Guide, 2015 56

Past expansions are being finished.
New expansions are being designed.
Despite Cajamarca, we do not expect a deteriorating outlook stemming from the recent regional elections.
In 2015-2016 long sought after expansions will finish. Many of the Peruvian miners arefinishing expansion projects that started back when the commodities boom was in fullthrottle. Volcan finished two new silver mines, in 2014; Milpo completed the expansion ofits largest mine in 2013 and set the base for another 20% capacity expansion that ispartially completed in its largest mine (Cerro Lindo, 60% of EBITDA) as of today. The pathwas not easy to all of the miners. Buenaventura’s El Brocal had to refinance to surpass acapex overrun in 2013 that helped them finish its expansion towards 4Q14 while CerroVerde’s new USD4.6bn capex tag is 31% higher than originally expected. These projectsshow little execution risk and are fully included as operating mines in our numbers.
New expansion projects are gaining traction. Notably in Buenaventura and Volcan,perhaps because they felt the precious metals price pressure earlier than other miners witha larger base metal component, new projects are being designed to withstand the currentscenario. Buenaventura is looking for high profile mid-tier operations such as Tambomayo(150,000 oz Au with USD200mn capex as soon as 2Q16) or Chucapaca (200,000 oz Auwith USD400mn capex looking for a 2018 start) and is advancing strongly in the studiesrequired while doing some mine development as long as their permits allow. Volcan istrying to make a partial old Pasco comeback (zinc, lead, copper and silver) with ametallurgical leg to capitalize new developments such as the oxides plant. In themeanwhile, Milpo is looking to develop a Cerro Lindo style approach to their long delayedgreen field projects to start small but scalable 5,000 tpd plants instead of betting the houseon.40,000 tpd plants as they were considering in the not so distant old booming days.
Social license has been hard to get. The most glaring case has been that of Conga,which we are now taking out of our numbers. But an improving situation allowed theapproval of the Environmental Impact Assessment of Southern Copper’s Tia Maria, andmarked a better sentiment towards political risk in Peru until the regional elections came.Political risk has not risen significantly after regional elections in Peru, but itcertainly did not decline. Some concern persist in particular places. The largest, mostpopulated and richer regions of Lima, Arequipa and La Libertad chose pro-investmentauthorities, the situation did not materially change in the South of Peru but the election ofGregorio Santos in Cajamarca did alter the mining development expected in that Northernregion.
18%33%
67%
21%13%
28%13%
20%
16%
12%
10%
33%
15%28%
9%
8%6%
16%
8%
13% 7%
24%20%
19%
89%
7% 8%
28%
11%
0%
10%
20%
30%
40%
50%
60%
70%
80%
90%
100%
Alumina Copper Zinc Nickel Tin Lead
Others
Batteries
Packaging
Machinery
Consumer goods
Electric goods
Transportation
Construction and Infrastructure
Revenues breakdown per metal in miners under coverage Uses breakdown per metal
Sources: Company filings, DB, USGS, Credicorp Capital
59%
1%17%
18%
41%
13%
19%
2%
31%
95%
3%
46%49%
1%11% 6% 5% 8%
75%
0%
10%
20%
30%
40%
50%
60%
70%
80%
90%
100%
Buenaventura Volcan Milpo Cerro Verde Minsur
Gold Silver Copper Zinc Lead Tin Moly Niobium/Tantalum
Andean Equities Guide, 2015 57
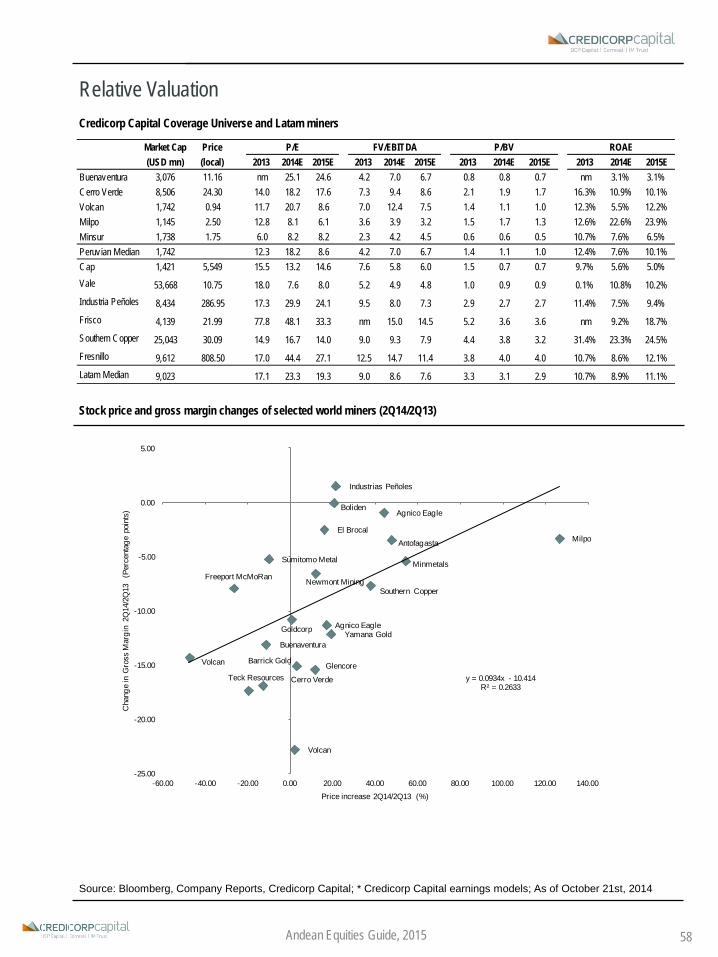
Relative ValuationCredicorp Capital Coverage Universe and Latam miners
Stock price and gross margin changes of selected world miners (2Q14/2Q13)
Source: Bloomberg, Company Reports, Credicorp Capital; * Credicorp Capital earnings models; As of October 21st, 2014
Milpo
Volcan
Volcan
El Brocal
Boliden
MinmetalsSumitomo Metal
Industrias Peñoles
GlencoreTeck Resources
Buenaventura
Agnico Eagle
Yamana GoldAgnico Eagle
Barrick Gold
Goldcorp
Newmont Mining
Cerro Verde
Southern Copper
Antofagasta
Freeport McMoRan
y = 0.0934x - 10.414R² = 0.2633
-25.00
-20.00
-15.00
-10.00
-5.00
0.00
5.00
-60.00 -40.00 -20.00 0.00 20.00 40.00 60.00 80.00 100.00 120.00 140.00
Cha
nge
in G
ross
Mar
gin
2Q
14/2
Q13
(P
erce
ntag
e po
ints
)
Price increase 2Q14/2Q13 (%)
2013 2014E 2015E 2013 2014E 2015E 2013 2014E 2015E 2013 2014E 2015EBuenaventura 3,076 11.16 nm 25.1 24.6 4.2 7.0 6.7 0.8 0.8 0.7 nm 3.1% 3.1%Cerro Verde 8,506 24.30 14.0 18.2 17.6 7.3 9.4 8.6 2.1 1.9 1.7 16.3% 10.9% 10.1%Volcan 1,742 0.94 11.7 20.7 8.6 7.0 12.4 7.5 1.4 1.1 1.0 12.3% 5.5% 12.2%Milpo 1,145 2.50 12.8 8.1 6.1 3.6 3.9 3.2 1.5 1.7 1.3 12.6% 22.6% 23.9%Minsur 1,738 1.75 6.0 8.2 8.2 2.3 4.2 4.5 0.6 0.6 0.5 10.7% 7.6% 6.5%Peruv ian Median 1,742 12.3 18.2 8.6 4.2 7.0 6.7 1.4 1.1 1.0 12.4% 7.6% 10.1%Cap 1,421 5,549 15.5 13.2 14.6 7.6 5.8 6.0 1.5 0.7 0.7 9.7% 5.6% 5.0%Vale 53,668 10.75 18.0 7.6 8.0 5.2 4.9 4.8 1.0 0.9 0.9 0.1% 10.8% 10.2%Industria Peñoles 8,434 286.95 17.3 29.9 24.1 9.5 8.0 7.3 2.9 2.7 2.7 11.4% 7.5% 9.4%Frisco 4,139 21.99 77.8 48.1 33.3 nm 15.0 14.5 5.2 3.6 3.6 nm 9.2% 18.7%Southern Copper 25,043 30.09 14.9 16.7 14.0 9.0 9.3 7.9 4.4 3.8 3.2 31.4% 23.3% 24.5%Fresnillo 9,612 808.50 17.0 44.4 27.1 12.5 14.7 11.4 3.8 4.0 4.0 10.7% 8.6% 12.1%Latam Median 9,023 17.1 23.3 19.3 9.0 8.6 7.6 3.3 3.1 2.9 10.7% 8.9% 11.1%
ROAEPrice (local)
Market Cap (USD mn)
P/E FV/EBITDA P/BV
Andean Equities Guide, 2015 58

Andean RetailShopping for growth and profitability
SummaryMacro economic uncertainty making stock picking in the sectordifficult. In the near term, Andean retail remains a mixed bag andshould continue to be negatively affected by slowing macro trends,particularly in Chile where real salary growth continues to moderatem/m. Of course, we cannot discount the structural growth opportunitiesfor the sector, particularly outside of Chile where formal retailpenetration still remains low compared to global averages; however,transitory effects in many names under our coverage will likely continueto blur near term return perspectives, making it difficult to beconstructive towards the sector as a whole.
An industry in transition. Though the Andean region maintains astructurally positive consumption story looking forward (controlledinflation levels, low fiscal debt, young demographics), increasedcompetition and shifting consumer habits will challenge well establishedoperators. Furthermore, profitability of our universe has not kept pacewith sales growth, a concern compounding pressure on currentmultiples.
Within this context, we maintain Falabella (Buy) and InRetail (Buy)as our favorites heading into 2015. In the case of Falabella, webelieve negative macro sentiment has fully priced into Fwd multiples,which are now trading at a 23% discount versus 5 year averages and inline with its regional peer group, despite greater diversity and leadershipin operations. In the case of InRetail Peru, we continue to likeoperational improvements stemming from increased scale andstreamlined efficiency in all business segments. Coupled with lowerfinancing, EPS growth should outpace our food retail coverage universeby 11x 2014 - 2016.
We also like the Real Estate sector (Parque Arauco) due to itsdefensive qualities in a slower consumption scenario. Moreover, a lowerinterest rate in environment in Chile, coupled with new project growthshould drive upward re-ratings in valuation over the next twelve months.
Christopher DiSalvatore(+56) 2446 1724
Coverage universe
Retail Rec. T.P.cencosud ci UPERF 1,765éxito cb HOLD 32,800falab ci BUY 5,140forus ci HOLD 2,800inretc1 pe BUY 24.3ripley ci UPERF 347Real Estateparauco ci BUY 1,280
Andean Equities Guide, 2015
Valuation Summary
ltm 2014E 2015E 2016E ltm 2014E 2015E 2016E ltm 2014ECencosud 1,627 7,891 18.6 26.0 19.3 17.5 9.9 10.5 10.4 9.6 1.3% 1.5%Falabella 4,224 17,427 22.4 22.4 18.8 16.5 13.6 12.7 11.2 9.9 0.8% 1.7%Forus 2,525 1,119 17.0 17.5 16.1 14.7 12.6 12.4 11.1 10.0 2.0% 2.4%Ripley 320 1,062 14.7 14.9 13.3 10.3 12.3 12.4 11.1 9.5 2.7% 2.2%Éxito 29,800 6,537 29.8 29.1 26.5 23.6 11.7 11.3 10.2 9.3 0.9% 1.6%InRetail 19 1,902 97.8 27.0 23.1 17.7 16.9 12.3 10.3 8.9 0.0% 0.0%Parque Arauco 1,099 1,540 17.9 18.8 16.3 15.2 17.4 16.3 14.8 13.8 2.6% 3.1%
Div. YieldP/EPrice (local)
Market Cap (USD mn)
EV/EBITDA
59

Sector generally underperforming local indices due to slowing consumption environment in Chile; InRetail is the major outperformer ytd (+16%).
Sector is not particularly cheap when compared to global averages; premiums are justified in some cases.
Industry trends
Andean retail has generally underperformed regional and Emerging Market peersytd, reflecting in many cases uncertain macro economic outlook and lofty valuationsafter outperforming in 2013. Furthermore, declining capital returns ltm related toconstricted margins has likely compounded the underperformance (we estimate that theaverage Operating ROAE of our coverage will fall 130 bps in 2014, driven by increasedlabor costs and store cannibalization). Looking into 2015, we expect an average USD EPSgrowth of 16% for our food retail coverage and 15% for our discretionary retail coverage,both of which to be mostly driven by capex and some margin improvement, despite highertax rates in Chile. Our growth estimates for food retail are in line with regional peers (2014– 2016) ex. InRetail (including, EPS growth should average 33% versus 10% Latam ex.Andean average).
We have argued in the past that market potential reflecting low formal penetrationand young demographics should not be considered alone. As Andean retailers focuson consolidating their presence in the region, differentiation in product offering will becomemore difficult. Coupled with an increase in international competition, local players will needto focus on efficient capital allocation in order to respond to shifting consumer behavior andshorter economic cycles. Based on our analysis, Andean Retailers generally underperformglobal peers in terms of ROIC and ROE, reflecting a heavier asset model (ex. Forus)generated from integral real estate businesses.
Growth multiples have fallen over ltm versus Global and Emerging peers. In terms ofPEG, which measures what investors are willing to pay for each expected dollar of growth,Andean Retail is trading on both ends of global and emerging averages. In the case ofInRetail, a strong earnings rebound expected in 2014 makes the stock the most attractiveunder our coverage in terms of this metric, while Ripley’s discount reflects investoruncertainty over the long term growth perspective of the company, despite an expectedpick up in EPS growth in 2016. Forus trades on the higher end, likely reflecting its uniqueretail model within the region and strong growth perspectives, particularly in Colombia andPeru. Falabella trades at a discount versus EM peers, primarily reflecting the slowdown ineconomic activity in the region; however, in a positive, consumption scenario we wouldexpect the latter to return to premium levels based on historical delivery and accretivereturns.
Sales growth vs. ROAE of coverage (lft graph) & Leas Adj. ROIC (2015E) minus WACC of retail coverage (rght graph)
Source: Credicorp Capital, Company Reports
Andean Equities Guide, 2015
14.3%
13.0%12.7%
13.0%13.2%
10%
11%
12%
13%
14%
15%
0%
2%
4%
6%
8%
10%
12%
2013 2014e 2015e 2016e 2017e
Avg. Op. ROAE (rght) Total Sales growth (y/y) (lft)
-15%-10%-5%0%5%
10%15%20%25%30%35%
Cencosud Falabella Ripley Forus Exito InRetail Parauco
ROIC 2015e Nominal WACC Difference
60
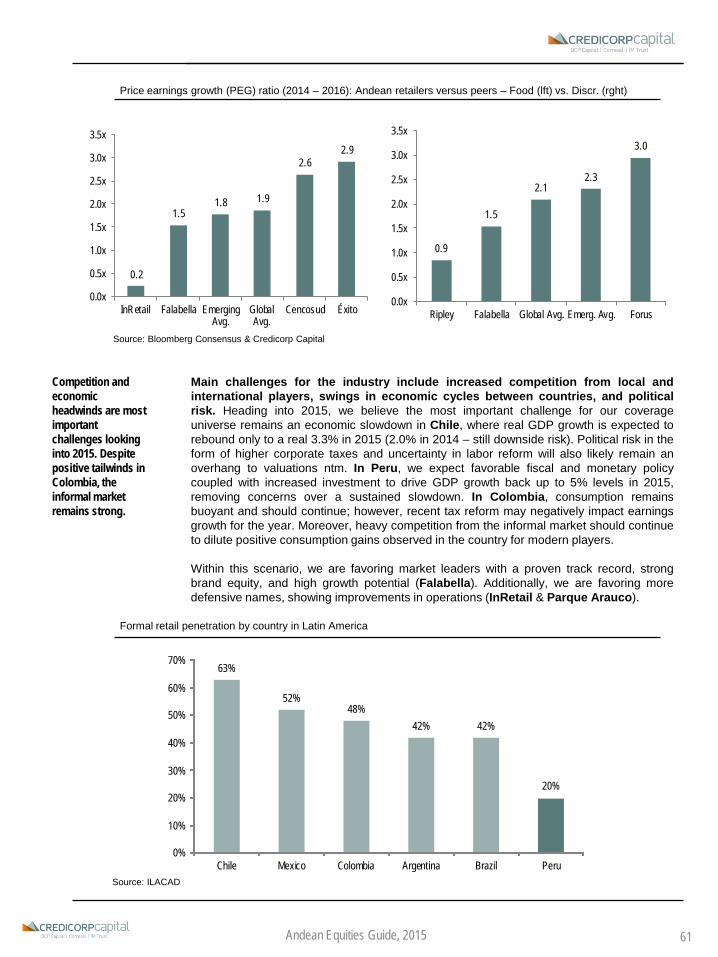
Competition and economic headwinds are most important challenges looking into 2015. Despite positive tailwinds in Colombia, the informal market remains strong.
Main challenges for the industry include increased competition from local andinternational players, swings in economic cycles between countries, and politicalrisk. Heading into 2015, we believe the most important challenge for our coverageuniverse remains an economic slowdown in Chile, where real GDP growth is expected torebound only to a real 3.3% in 2015 (2.0% in 2014 – still downside risk). Political risk in theform of higher corporate taxes and uncertainty in labor reform will also likely remain anoverhang to valuations ntm. In Peru, we expect favorable fiscal and monetary policycoupled with increased investment to drive GDP growth back up to 5% levels in 2015,removing concerns over a sustained slowdown. In Colombia, consumption remainsbuoyant and should continue; however, recent tax reform may negatively impact earningsgrowth for the year. Moreover, heavy competition from the informal market should continueto dilute positive consumption gains observed in the country for modern players.
Within this scenario, we are favoring market leaders with a proven track record, strongbrand equity, and high growth potential (Falabella). Additionally, we are favoring moredefensive names, showing improvements in operations (InRetail & Parque Arauco).
0.2
1.51.8 1.9
2.62.9
0.0x
0.5x
1.0x
1.5x
2.0x
2.5x
3.0x
3.5x
InRetail Falabella EmergingAvg.
GlobalAvg.
Cencosud Éxito
0.9
1.5
2.12.3
3.0
0.0x
0.5x
1.0x
1.5x
2.0x
2.5x
3.0x
3.5x
Ripley Falabella Global Avg. Emerg. Avg. Forus
Price earnings growth (PEG) ratio (2014 – 2016): Andean retailers versus peers – Food (lft) vs. Discr. (rght)
Source: Bloomberg Consensus & Credicorp Capital
Formal retail penetration by country in Latin America
Source: ILACAD
Andean Equities Guide, 2015
63%
52%48%
42% 42%
20%
0%
10%
20%
30%
40%
50%
60%
70%
Chile Mexico Colombia Argentina Brazil Peru
61

Andean consumer by the numbersChile: retail sales growth; no sign of inflection Chile: Consumer/Business expectations
Peru: Economic activity (y/y %) Peru: Consumer/Business expectations
Colombia: retail sales growth; still buoyant Colombia: Consumer/Credit growth y/y
Source: INESource: Central Bank of Chile
Source: Central Bank of PeruSource: Central Bank of Peru
Source: DANE Source: DANE
4446485052545658
0
10
20
30
40
50
jul-13 sep-13 nov-13 ene-14 mar-14 may-14 jul-14
Confidence to investConfidence to hireConsumer confidence (rhs)
-15-10
-505
101520
2Q11
3Q11
4Q11
1Q12
2Q12
3Q12
4Q12
1Q13
2Q13
3Q13
4Q13
1Q14
2Q14
Internal demand Private investmentGDP Exports
3035404550556065
Dec-08 Jan-10 Jan-11 Jan-12 Jan-13 Jan-14
IPEC (Consumer) IMCE (Business)Neutral
-10%
0%
10%
20%
30%
40%
50%
60%
Jan/10 Jan/11 Jan/12 Jan/13 Jan/14
Retail Sales (y/y ) Non-durable (y/y %)Durables (y/y %)
Andean Equities Guide, 2015
-10
0
10
20
30
40
50
60
-30-20-10
01020304050
Dec-01 Jan-04 Jan-06 Jan-08 Jan-10 Jan-12 Jan-14
Consumer credit rhs (y/y %)
Consumer confidence
-10-505
10152025
Jan-04 Jan-06 Jan-08 Jan-10 Jan-12 Jan-14
Total Ex-vehicles
62

Andean Electric UtilitiesAndean region demands capacity expansionsSummaryCapacity increasing by hand with GDP. As long term growth trendsremain strong in the Andean region, energy demand will continuegrowing at a steady pace. Capacity expansions are mandatory tocontinue satisfying the requirements of energy that growth implies. Inthis context, we believe Colombia and Peru present the highest growthpotential. Chile, in spite of its weaker short term growth, should offerrelevant opportunities too: energy prices will continue increasing if newcapacity is not developed, a key concern of the current government.
Favorite Names: i) Colbun, due to its strong momentum, based onpositive results, which we anticipate will continue posting growth figuresduring the rest of 2014 and throughout 2015. We also like Colbun’sgrowth potential, as we estimate the announcement of Santa María IIcould come during 2015; ii) Isagen, as we expect the Government’sstake selling process (likely sale price COP 3,400) and the start inoperation of Sogamoso project (37% increase in installed capacity) todrive share outperformance; iii) Luz del Sur, which is actively seekinggrowth in the energy generation segment through the development ofnew projects (hydro and/or thermal generation); while maintaining itssustainable growth policy in the distribution business, which focuses onmanaging effectively its operational risk.
Andrés Ossa Jaime Pedroza
Fernando Pereda
Coverage universe
Electric Utilities Rec. T.P. (local)aesgener ci BUY 350celsia cb HOLD 7,020colbun ci BUY 180ecl ci BUY 995edegelc1 pe HOLD 3.45edelnoc1 pe HOLD 5.74eeb cb BUY 1,930endesa ci / eoc us HOLD 950 / 50.4enersis ci/ eni us BUY 215 / 19.0enersuc1 pe BUY 12.71isa cb UPERF 8,910isagen cb BUY 3,280lusurc1 pe BUY 10.97
Andean Equities Guide, 2015
Valuation Summary
Div. Yield EBITDA Mg.2013 2014E 2015E 2016E 2013 2014E 2015E 2016E 2015E 2015E
AES Gener 311 4,479 22.2 25.2 20.9 19.1 10.8 11.0 10.4 9.4 4.0% 30.2%Colbun 150 4,516 63.5 17.3 15.8 14.5 15.5 10.3 9.2 8.6 1.7% 41.0%E-CL 841 1,518 34.4 18.7 16.1 13.8 8.1 7.0 6.7 6.4 2.7% 24.4%Endesa 851 11,964 18.1 23.2 16.6 14.6 10.5 10.8 9.8 8.9 2.9% 47.5%Enersis 182 15,338 11.7 16.9 13.6 12.1 4.8 6.4 6.0 5.6 3.0% 33.6%
30.0 20.2 16.6 14.8 10.0 9.1 8.4 7.8 2.9% 35.3%Isagen 2,705 3,597 20.4 14.6 16.6 13.2 16.5 12.6 9.9 8.7 3.4% 39.4%Celsia 5,980 2,099 10.9 12.2 18.8 19.3 7.8 6.2 8.1 8.2 2.0% 2.2%EEB 1,605 7,188 18.0 13.0 12.3 11.1 10.7 10.2 9.5 8.7 4.6% 93.2%ISA 8,230 4,447 23.3 15.6 17.9 20.6 11.4 10.0 10.1 10.5 3.5% 58.4%
18.2 13.9 16.4 16.1 11.6 9.7 9.4 9.0 3.4% 48.3%Edegel 3.25 2,568 13.3 19.1 22.2 22.4 8.8 11.5 12.1 11.6 4.6% 43.9%Enersur 9.55 1,979 15.7 14.6 14.7 14.3 10.0 9.6 9.0 8.6 2.1% 50.4%Luz del Sur 9.82 1,668 14.2 14.3 13.3 12.5 10.2 10.0 9.0 8.4 5.0% 27.0%Edelnor 5.56 1,223 11.4 12.0 12.7 12.0 6.7 7.5 7.0 6.5 4.6% 24.0%
13.7 15.0 15.7 15.3 8.9 9.6 9.3 8.8 4.1% 36.3%
Average Andean Utilities 21.3 16.7 16.3 15.4 10.2 9.5 9.0 8.5 3.4% 39.6%
FV/EBITDA
Average Chilean Utilities
Average Colombian Utilities
Average Peruvian Utilities
P/EPrice (local)
Market Cap (USD mn)
63
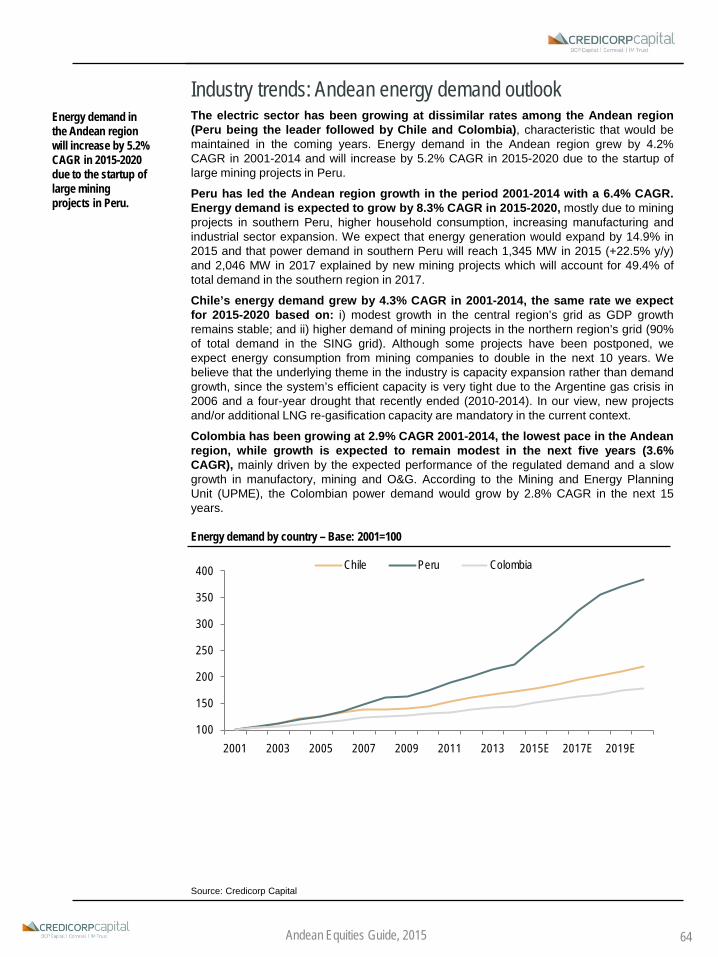
Energy demand in the Andean region will increase by 5.2% CAGR in 2015-2020 due to the startup of large mining projects in Peru.
Industry trends: Andean energy demand outlookThe electric sector has been growing at dissimilar rates among the Andean region(Peru being the leader followed by Chile and Colombia), characteristic that would bemaintained in the coming years. Energy demand in the Andean region grew by 4.2%CAGR in 2001-2014 and will increase by 5.2% CAGR in 2015-2020 due to the startup oflarge mining projects in Peru.
Peru has led the Andean region growth in the period 2001-2014 with a 6.4% CAGR.Energy demand is expected to grow by 8.3% CAGR in 2015-2020, mostly due to miningprojects in southern Peru, higher household consumption, increasing manufacturing andindustrial sector expansion. We expect that energy generation would expand by 14.9% in2015 and that power demand in southern Peru will reach 1,345 MW in 2015 (+22.5% y/y)and 2,046 MW in 2017 explained by new mining projects which will account for 49.4% oftotal demand in the southern region in 2017.
Chile’s energy demand grew by 4.3% CAGR in 2001-2014, the same rate we expectfor 2015-2020 based on: i) modest growth in the central region’s grid as GDP growthremains stable; and ii) higher demand of mining projects in the northern region’s grid (90%of total demand in the SING grid). Although some projects have been postponed, weexpect energy consumption from mining companies to double in the next 10 years. Webelieve that the underlying theme in the industry is capacity expansion rather than demandgrowth, since the system’s efficient capacity is very tight due to the Argentine gas crisis in2006 and a four-year drought that recently ended (2010-2014). In our view, new projectsand/or additional LNG re-gasification capacity are mandatory in the current context.
Colombia has been growing at 2.9% CAGR 2001-2014, the lowest pace in the Andeanregion, while growth is expected to remain modest in the next five years (3.6%CAGR), mainly driven by the expected performance of the regulated demand and a slowgrowth in manufactory, mining and O&G. According to the Mining and Energy PlanningUnit (UPME), the Colombian power demand would grow by 2.8% CAGR in the next 15years.
Energy demand by country – Base: 2001=100
Source: Credicorp Capital
100
150
200
250
300
350
400
2001 2003 2005 2007 2009 2011 2013 2015E 2017E 2019E
Chile Peru Colombia
Andean Equities Guide, 2015 64
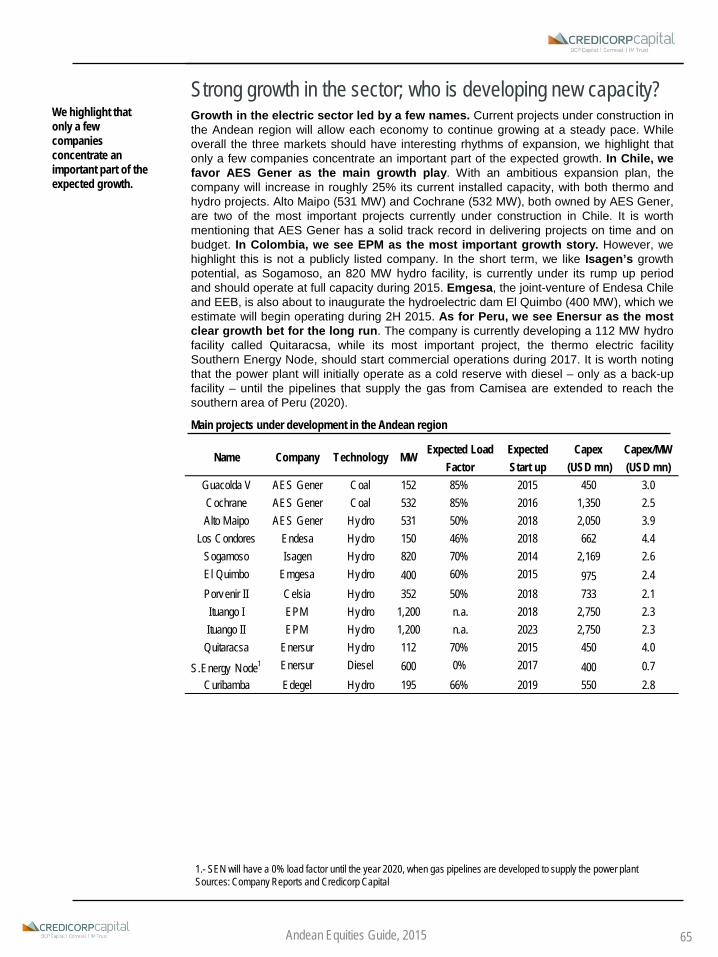
We highlight that only a few companies concentrate an important part of the expected growth.
Strong growth in the sector; who is developing new capacity?Growth in the electric sector led by a few names. Current projects under construction inthe Andean region will allow each economy to continue growing at a steady pace. Whileoverall the three markets should have interesting rhythms of expansion, we highlight thatonly a few companies concentrate an important part of the expected growth. In Chile, wefavor AES Gener as the main growth play. With an ambitious expansion plan, thecompany will increase in roughly 25% its current installed capacity, with both thermo andhydro projects. Alto Maipo (531 MW) and Cochrane (532 MW), both owned by AES Gener,are two of the most important projects currently under construction in Chile. It is worthmentioning that AES Gener has a solid track record in delivering projects on time and onbudget. In Colombia, we see EPM as the most important growth story. However, wehighlight this is not a publicly listed company. In the short term, we like Isagen’s growthpotential, as Sogamoso, an 820 MW hydro facility, is currently under its rump up periodand should operate at full capacity during 2015. Emgesa, the joint-venture of Endesa Chileand EEB, is also about to inaugurate the hydroelectric dam El Quimbo (400 MW), which weestimate will begin operating during 2H 2015. As for Peru, we see Enersur as the mostclear growth bet for the long run. The company is currently developing a 112 MW hydrofacility called Quitaracsa, while its most important project, the thermo electric facilitySouthern Energy Node, should start commercial operations during 2017. It is worth notingthat the power plant will initially operate as a cold reserve with diesel – only as a back-upfacility – until the pipelines that supply the gas from Camisea are extended to reach thesouthern area of Peru (2020).
Main projects under development in the Andean region
152 3.0532 2.5531 3.9150 4.4820 2.6400 2.4352 2.1
1,200 2.31,200 2.3112 4.0600 0.7195 2.866% 2019 550
MW
Curibamba
EPM HydroEPM Hydro
Edegel Hydro
450
Capex/MW (USD mn)
Name Company Technology Expected Load Factor
Expected Start up
Capex (USD mn)
Guacolda V AES Gener Coal 85% 2015
2,050Cochrane AES Gener Coal 85% 2016Alto Maipo AES Gener Hydro 50% 2018
1,350
662Sogamoso Isagen Hydro 70% 2014 2,169
Los Condores Endesa Hydro 46% 2018
2,750Ituango I n.a. 2018
975Porvenir II Celsia Hydro 50% 2018 733El Quimbo Emgesa Hydro 60% 2015
2,7502023n.a.
S.Energy Node1
QuitaracsaItuango II
0%DieselEnersur450201570%Enersur Hydro
2017 400
Andean Equities Guide, 2015
1.- SEN will have a 0% load factor until the year 2020, when gas pipelines are developed to supply the power plantSources: Company Reports and Credicorp Capital
65

There are significant differences in the ROAE among countries. Peruvian companies should post the stronger figures, followed by Colombia and Chile.
New projects ahead: costs controls to increase profitabilityOver the past years we have seen capex requirements, measured in USD mn perMW, increasing in Chile, Colombia and Peru. We believe this is a consequence ofhigher labor costs and environmental requirements, but is also largely explained by anincreasing opposition to the development of new facilities, from local communities andenvironmentalists. The latter, in our view, has enlarged total spending when constructing apower plant in Chile and Peru, as local and environmental activists have been able todelay projects, causing costs overruns. In Colombia, higher environmental requirementsfrom the government have caused delays in constructing projects and, thus, an increase incapex levels per MW. We highlight that when constructing an infrastructure project,budget control is directly linked to progressing on time. It is worth noting that the costper MW of generation projects vary widely in a range of 0.7 and 4.0 (USD mn/MW). Thesize and complexity of the projects in terms of infrastructure, environmental requirements,land acquisition and relationships with communities explains the latter. We believe costcontrols will be a key challenge for power companies in the Andean region goingforward. If capex levels per MW continue increasing, profitability ratios will be lessattractive for investors.ROAE of the region to remain flat. The average return on equity in the companies withinthe Andean region is expected to remain roughly at 11% in the next 3 years. It is worthnoting that there are significant differences in the ROAE among countries. Peruviancompanies should post the stronger figures (18.9% 2014E average), followed by Colombia(9.5% 2014E average) and Chile (7.6% 2014E average).
Within the Andean context, we expect ROAE in Peru and Colombia to present adecreasing trend, that will be offset by expansions in Chile. Regarding ROIC, weforecast a similar trend: ratios decreasing in Colombia and Peru, while Chile is expected toexpand. As a consequence, profitability should remain flattish for the whole region.
• The decreasing trend in Colombia is explained by higher taxes due to the proposed taxreform, and a lower expected net profit in Isagen and Celsia, due to lower power prices andthe return of the system to normal hydrological conditions. However, we highlight Isagen isexpected to post improvements in ROIC due to the completion of its expansion process,culminating the construction of the Sogamoso project.
• In Peru, profitability ratios have a downward trend, mainly due to lower EBIT marginsas a consequence of i) higher natural gas consumption; ii) higher expenses for pass-through, transmission costs that reduce margins, and iii) higher payments forcompensation to additional generation costs, renewable energies, and cold reserves in thenational grid.
• The expansion in profitability ratios expected in Chile is driven by: i) recovery ofhydro generation in the SIC grid after 4 years of weak rainfalls, ii) replacement of old “pre-Argentine crisis” contracts with new contracts at higher prices, iii) entrance of new efficientcapacity, easing the system’s tight situation and lowering average spot prices. It isimportant to notice that most Chilean companies have low levels of ROAE and ROIC, inpart, due to unoccupied facilities after the Argentine gas crisis. This affects mainlyColbun, E-CL and AES Gener, disrupting profitability ratios of the mentionedcompanies.
Andean Equities Guide, 2015 66

The average return on equity in the companies within the Andean region is expected to remain slightly above 11% in the next 3 years.
A comparison of ROAE and ROICROAE 2012 2013 2014E 2015E 2016EAES Gener 8.2% 8.0% 7.0% 8.3% 8.9%Colbun 1.4% 1.8% 7.1% 7.3% 7.6%E-CL 3.3% 2.4% 4.8% 5.5% 6.1%Endesa Chile 9.2% 13.6% 10.8% 14.0% 14.8%Enersis 9.7% 13.1% 8.4% 10.0% 10.7%Average Chilean Utilities 6.4% 7.8% 7.6% 9.0% 9.6%Isagen 12.7% 11.7% 11.3% 10.8% 10.7%Celsia 7.9% 11.4% 10.6% 8.0% 6.0%EEB 7.7% 7.8% 9.5% 11.1% 11.4%ISA 4.5% 5.2% 6.7% 6.9% 5.9%Average Colombian Utilities 8.2% 9.0% 9.5% 9.2% 8.5%Edegel 12.9% 18.2% 15.9% 13.5% 13.1%Enersur 18.3% 21.4% 20.1% 17.7% 16.1%Luz del Sur 22.3% 21.5% 20.6% 20.6% 19.8%Edelnor 20.1% 23.2% 23.7% 21.3% 19.9%Average Peruvian Utilities 17.8% 20.4% 18.9% 17.3% 16.3%
Average Andean Utilities 9.8% 11.3% 11.1% 11.1% 10.9%
ROIC 2012 2013 2014E 2015E 2016EAES Gener 7.0% 5.9% 5.4% 5.2% 5.1%Colbun 1.3% 2.0% 6.1% 6.8% 7.3%E-CL 3.8% 4.5% 6.4% 6.8% 7.4%Endesa Chile 7.9% 10.9% 9.4% 10.8% 11.8%Enersis 12.5% 14.9% 11.9% 13.0% 12.8%Average Chilean Utilities 6.5% 7.6% 7.8% 8.5% 8.9%Isagen 8.1% 7.4% 7.2% 8.4% 9.8%Celsia 11.0% 13.7% 12.3% 9.6% 9.4%EEB 6.6% 7.3% 7.8% 7.6% 7.8%ISA 8.6% 9.3% 8.9% 8.2% 7.3%Average Colombian Utilities 8.6% 9.4% 9.0% 8.4% 8.6%Edegel 10.8% 12.5% 11.5% 9.6% 9.0%Enersur 9.5% 12.8% 11.7% 10.8% 10.2%Luz del Sur 15.3% 13.8% 12.5% 12.6% 12.7%Edelnor 13.6% 15.8% 14.0% 12.5% 11.9%Average Peruvian Utilities 12.3% 13.7% 12.4% 11.4% 11.0%
Average Andean Utilities 8.9% 10.1% 9.6% 9.4% 9.4%Source: Company Reports, Credicorp Capital; E Estimates Credicorp Capital
Andean Equities Guide, 2015 67

Andean Food & BeveragesRegional macro should impact performance
SummaryMacro perspectives in Chile and Peru should pressure localconsumption, while Colombia remains an exception in the region.Chilean beverage companies are expected to be impacted by theeconomic slowdown and higher tax rates for soft drinks and alcoholicbeverages, resulting in lower volume growth rates (3% 2015 vs. 10%2013). On the other hand, private consumption in Colombia remainsdynamic amid favorable conditions in the labor market and consumerconfidence at relatively high levels (17% vs historical average of 16.2%).We expect private consumption to remain dynamic in the upcomingquarters. The slowdown in the Peruvian economy will like moderatethrough year end, as consumer confidence in August remains positive,but it has been losing steam since 1Q14 (slightly negative for privateconsumption).
In our view, commodities should remain stable for the upcomingquarters. Main commodities related to the sector have shown a slightdownward trend in prices over the last 3 years, except pork and beef.We believe prices of relevant commodities for the sector should remainrelatively stable during the following years. Thus, we do not expectpressures to sustain in margins. Sugar should remain stable at USD420/ton, easing pressures in the beverages industry. In the foodindustry, prices of most of the relevant commodities have declined, afterpeaking in 2011, with the exception of beef.
Our regional favorites are Concha y Toro and Nutresa. On one hand,Concha y Toro operates as a net exporter, thus has benefited from localcurrency depreciation and economic recovery in its main export markets,which we expect will continue, going forward. On the other hand, basedon current macro conditions, we prefer Colombian names in the Andeanfood industry. In this regard, Nutresa is a play on Colombian localdemand, which we expect to remain robust during the coming years(5.1% in 2014 and 4.6% in 2015).
Tomás SanhuezaIván Bogarín
Carlos E. Rodríguez
Valuation Summary
Div. Yield2013 2014E 2015E 2016E 2013 2014E 2015E 2016E 2015E 2013 2014E 2015E
Alicorp 7.7 2,256 21.0 21.3 18.7 15.6 12.7 13.1 11.6 10.1 1.4% 16.4% 12.5% 13.0%Andina 1,887 2,820 22.7 28.2 32.6 28.0 10.5 8.4 8.1 7.9 2.5% 10.3% 6.8% 5.9%CCU 6,079 3,850 18.9 17.7 19.6 20.3 9.4 9.3 9.4 9.0 3.1% 15.4% 12.5% 10.7%Concha y Toro 1,121 1,435 22.2 17.8 16.8 16.3 17.5 13.2 12.5 11.6 2.2% 7.8% 10.6% 10.4%Embonor 1,090 838 19.3 22.6 19.1 12.8 10.5 9.4 9.0 8.5 3.1% 10.1% 7.4% 8.6%Nutresa 27,000 6,017 31.9 43.5 42.0 38.3 16.5 13.2 12.6 11.9 1.7% 5.1% 3.8% 3.8%
ROAEP/E FV/EBITDAPrice (local)
Market Cap (USD mn)
Coverage universe
Beverages Rec. T.P.Andina UPERFORM 1,990CCU HOLD 6,850Concha y Toro BUY 1,320Embonor HOLD 1,090Food Rec. T.P.Alicorp HOLD 9.0Nutresa BUY 32,000
Andean Equities Guide, 2015 68
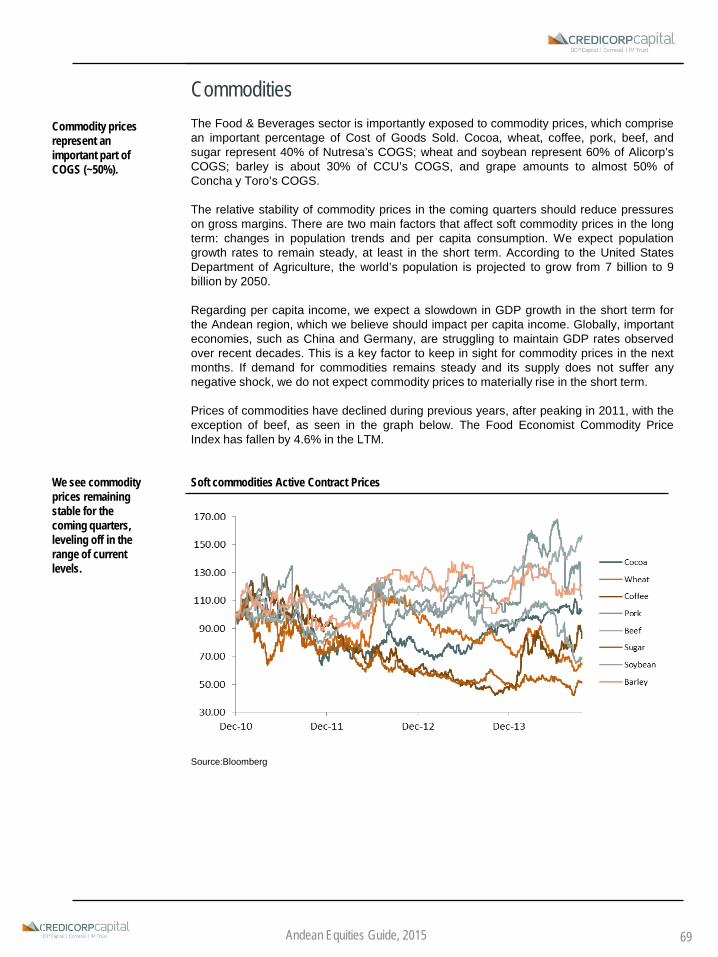
Commodity prices represent an important part of COGS (~50%).
We see commodity prices remaining stable for the coming quarters, leveling off in the range of current levels.
CommoditiesThe Food & Beverages sector is importantly exposed to commodity prices, which comprisean important percentage of Cost of Goods Sold. Cocoa, wheat, coffee, pork, beef, andsugar represent 40% of Nutresa’s COGS; wheat and soybean represent 60% of Alicorp’sCOGS; barley is about 30% of CCU’s COGS, and grape amounts to almost 50% ofConcha y Toro’s COGS.
The relative stability of commodity prices in the coming quarters should reduce pressureson gross margins. There are two main factors that affect soft commodity prices in the longterm: changes in population trends and per capita consumption. We expect populationgrowth rates to remain steady, at least in the short term. According to the United StatesDepartment of Agriculture, the world’s population is projected to grow from 7 billion to 9billion by 2050.
Regarding per capita income, we expect a slowdown in GDP growth in the short term forthe Andean region, which we believe should impact per capita income. Globally, importanteconomies, such as China and Germany, are struggling to maintain GDP rates observedover recent decades. This is a key factor to keep in sight for commodity prices in the nextmonths. If demand for commodities remains steady and its supply does not suffer anynegative shock, we do not expect commodity prices to materially rise in the short term.
Prices of commodities have declined during previous years, after peaking in 2011, with theexception of beef, as seen in the graph below. The Food Economist Commodity PriceIndex has fallen by 4.6% in the LTM.
Soft commodities Active Contract Prices
Source:Bloomberg
Andean Equities Guide, 2015 69

We prefer Colombian names in the Andean food industry.
We expect a tough scenario for Alicorp, due to its exposure to Peru and Argentina.
Nutresa has always traded traded at a premium relative to its Latam peers.
Nutresa or Alicorp?Considering the current macro scenario, we prefer Nutresa over Alicorp. Nutresa is a playon Colombian local demand, which we expect to remain robust (5.1% in 2014 and 4.6% in2015). The Latin American middle class continues supporting revenue growth and soundcash generation, but we are conservative in the short term as we expect lower economicgrowth outside Colombia.
Nutresa ended the first half of 2014 with total sales for USD 1.5 bn, representing a growthof 15% including acquisitions. This performance is mainly due to two aspects; a goodperformance of the Colombian economy and strong distribution network in Colombia fortheir leading brands in frozen, refrigerated and canned products. Its main internationalmarkets are Chile (8.3%) Central America (7.4%) and United States (7.3%) over totalsales. In terms of profitability, EBITDA margin for the first half stayed at 13.9% and 11.1%higher than 1H13. This is mainly explained by Nutresa’s hedging policy, which hasmitigated pressures on margins due to higher prices in certain raw materials.
On the other hand, we believe Alicorp will face a bumpy environment despite its renownedcompetitive advantages: commodity purchases, unique distribution platform, brandmanagement and product development. Although we expect a rebound in 2015, thePeruvian economy is not growing as expected due to external and internal factors, whichrepresent 65% of the company's EBITDA. Regarding its international exposure, thecompany’s revenues are composed by Brazil (9%), Argentina (8%), Ecuador (9%) andChile (8%). We have some concerns about Argentina, in relation to political risks andstrong devaluation of the ARS in 2015. In terms of COGS, a decline in prices of softcommodities will help offset lower margins, as wheat and soybean represent about 60% ofCOGS. Prices of both commodities have decreased YTD (soybean -17.07% and wheat -21.04%). We expect this will improve gross margins in 1H15 due to Alicorp’s active hedgestrategy. Nevertheless, we expect a decrease in EBTIDA margins (2015E 11.5% vshistorical of 13%).
We believe the sale of a high-margin business such as the Animal Nutrition unit and theacquisition of a core business platform abroad Peru is a risk in the short term. This unit hasover performed the Consumer Goods unit and B2B Branded products unit in the lastquarters, with an EBITDA Margin of 14.7% vs 11.1% and 11%, respectively. The decisionto sell Animal Nutrition and purchase a Consumer Goods operation abroad Peru might notbe welcomed by the market, especially as Alicorp has not been able to improve theperformance in their international units.
In terms of valuation, Nutresa trades at 12.2x 2015E FV/EBITDA, in line with Alicorp’sFV/EBITDA of 11.6x 2015E. On the other hand, Nutresa’s P/E 2015E of 40.6x is higherthan the 18.7x P/E 2015E for Alicorp. We believe this premium is explained by Nutresa’sinvestment portfolio, which represents 36% of the firms value. Nutresa has an investmentportfolio valued in 2.1 bn which creates distortions when calculating multiples. Thisinvestment portfolio is composed by Grupo Sura (1.2 bn) and Grupo Argos shares (0.9 bn).
Andean Equities Guide, 2015 70

Macro context and new tax on beverages should pressure volumes, going forward.
FX and salary levels should continue pressuring results, although.
Profitability ratios should decrease for 2015, but recover its high levels in the long term.
Top Pick: Concha y Toro, as it is a net exporter.
Chilean Beverage IndustryLooking closer into the Chilean market, we remain negative in the sector as weexpect unfavorable conditions during 2015. At industry levels, the new tax reform willpressure results, as prices will reflect tax increases on beverages, negatively impactingvolumes. According to our estimates, CCU should have the greatest impact, as it isexposed to soft drinks and alcoholic beverages in Chile. We believe this new price scenariowill trigger a slowdown in volumes in the industry as a whole.
New Excise Tax on Soft Drinks and Alcoholic Beverages: Impact on EBITDA
Source: Credicorp Capital
In addition to the impact of higher taxes in Chile, the current macro scenario shouldimpact volumes even further. According to our projections, Chile’s GDP growth will grow2.0% this year, recovering to a 3.2% growth in 2015. This will be reflected in privateconsumption, which had been very dynamic during the last 4 years. We expect volumes toshow lower growth rates in 2015, increasing 3.0% (vs. 10% in 2013) with CCU showing thegreatest slowdown in volumes (2% growth). This is explained by its higher exposure toChile and to products heavily impacted by the tax reform.
The industry has suffered from cost pressures during the past quarters. In terms ofCOGS, the depreciation of the CLP against USD (+11% YTD) affected the main USDindexed costs. CCU has nearly 60% of its COGS denominated in USD (mainly sugar,concentrate, aluminum and PET resin). Andina and Embonor were also affected by thiscurrency depreciation, as Coca-Cola concentrate is one of the main inputs. In addition,higher salaries and consequently higher distribution costs have impacted SG&A for allbottlers. On average, nearly 60% of the distribution costs are salaries. We believe thesepressures should soften, as FX and salaries should stabilize; however, they will remain athigh levels.
The structural profitability of the bottling industry in Chile is high compared to otherindustries (ex. Concha y Toro). The 5-year average ROAE and ROIC of bottlers (ex.Concha y Toro) are 18.8% and 26.7%, respectively. Looking forward, we believe thesereturns should decrease in 2015, mainly explained by the negative perspectives for thesector. However, we expect the industry to recover its levels of profitability in the long term,regaining its attractiveness for investors.
In general, we are not favoring the beverage industry in Chile. However, Concha yToro is our favorite in the sector, as it is a net exporter, and thus will continue to benefitfrom a weak CLP and perspectives of economic growth in export markets. We believe thesame tailwinds seen in 2014 will remain going forward, allowing the company to be anoutperformer in the industry, with little downside risk.
Soft Drinks Beers Wines SpiritsCCU 26% 44% 8% 4% -2.0%
Andina 35% - - - -1.0%
Embonor 60% - - - -1.5%
Concha y Toro - - 12% - -0.3%
% of Volumes by product Estimated Impact in Volumes (%)
Andean Equities Guide, 2015 71

QuantitativeSummary

Andean Equities Guide, 2015
ChileCompany Sector Px Last Px Target Upside Tot. Ret Rating Mkt. Cap ADTVAESGener Utilities 311 360 16% 20% BUY 4,479 1.9 Aguas-A Utilities 343 390 14% 20% BUY 3,495 2.8 Andina-B Food & Beverages 1,887 1,990 5% 8% UPERF 2,820 1.7 Banco de Chile Banks 70 86 23% 28% BUY 11,349 9.0 Banmedica Health Serv ices 975 1,170 20% 24% BUY 1,345 0.3 BCI Banks 31,403 RESTR RESTR RESTR RESTR 5,857 2.4 Besalco Cement & Construction 395 464 17% 19% HOLD 386 0.4 CAP Mining 5,549 6,200 12% 16% HOLD 1,421 2.6 CCU Food & Beverages 6,079 6,850 13% 16% HOLD 3,850 3.3 Cencosud Retail 1,630 1,765 8% 10% UPERF 7,887 7.0 CMPC Pulp & Paper 1,388 1,680 21% 23% BUY 5,946 3.8 Colbun Utilities 150 180 20% 22% BUY 4,516 2.2 Concha y Toro Food & Beverages 1,121 1320 18% 20% BUY 1,435 1.6 Copec Pulp & Paper 6,889 8,000 16% 19% HOLD 15,347 6.5 Corpbanca Banks 7.40 8.80 19% 22% BUY 4,320 4.7 Cruz Blanca Health Serv ices 490 564 15% 18% HOLD 536 0.6 E-CL Utilities 841 995 18% 21% BUY 1,518 1.9 Embonor-B Food & Beverages 1,000 1,090 9% 12% HOLD 838 0.7 Endesa Utilities 851 950 12% 15% HOLD 11,964 6.7 Enersis Utilities 182 215 18% 21% BUY 15,338 9.1 Entel Telecom, IT & Media 6,235 7,200 15% 19% HOLD 2,527 3.8 Falabella Retail 4,224 5,140 22% 24% BUY 17,419 11.3 Forus Retail 2,525 2,800 11% 13% HOLD 1,119 1.5 Habitat Financial Serv ices 982 RESTR RESTR RESTR RESTR 1,683 1.1 ILC Conglomerates 8,240 RESTR RESTR RESTR RESTR 1,412 1.0 Latam Transport 6,673 7,250 9% 10% UPERF 6,239 12.2 Masisa Materials 23 RESTR RESTR RESTR RESTR 313 0.2 Parauco Retail 1,099 1,285 17% 20% BUY 1,540 1.8 Quinenco Conglomerates 1,236 1,355 10% 14% HOLD 3,521 0.5 Ripley Retail 320 347 8% 10% UPERF 1,062 0.9 Salfacorp Cement & Construction 465 500 8% 11% HOLD 359 0.4 Santander Banks 32 40 27% 32% BUY 10,204 6.1 SM-ChileB Banks 175 228 30% 33% BUY 3,671 1.3 SK Conglomerates 920 1,150 25% 30% BUY 1,695 0.5 Sonda Telecom, IT & Media 1,380 1,550 12% 15% HOLD 2,061 2.5 SQM-B Materials 13,565 15,000 11% 13% HOLD 6,813 4.3 Chile Sample 3,795 4,300 13% 15% 161,805 116.8
73

Andean Equities Guide, 2015
P/BV Div. Chile2013 2014E 2015E 2013 2014E 2015E LTM Yield 2014E 2015E 2014E 2015E Company22.2 25.2 20.9 10.8 11.0 10.4 1.7 4.0% 7.0% 8.3% 2.7% 3.0% AESGener17.3 16.7 16.5 11.7 11.2 11.4 3.4 6.0% 19.8% 19.8% 7.7% 7.5% Aguas-A22.7 28.2 32.6 10.5 8.4 8.1 1.8 2.5% 6.8% 5.9% 2.6% 2.1% Andina-B13.8 11.5 11.6 nm nm nm 2.8 5.4% 24.4% 23.0% 2.2% 2.1% Banco de Chile18.0 16.5 14.8 11.0 10.2 9.3 4.0 4.1% 23.7% 23.9% 6.3% 6.5% Banmedica11.3 RESTR RESTR nm nm nm 2.4 RESTR RESTR RESTR RESTR RESTR BCI25.5 30.4 21.7 17.9 13.4 9.8 1.3 1.4% 4.1% 5.6% 1.3% 1.8% Besalco15.5 13.2 14.6 7.6 5.8 6.0 0.8 3.8% 5.6% 5.0% 1.8% 1.5% CAP18.9 17.7 19.6 9.4 9.3 9.4 2.2 3.1% 12.5% 10.7% 7.0% 5.8% CCU23.3 26.0 19.3 11.1 10.5 10.4 1.1 2.1% 4.1% 5.4% 1.8% 2.4% Cencosud29.7 18.9 15.9 9.0 8.8 7.7 0.7 1.9% 3.7% 4.2% 2.1% 2.3% CMPC63.5 17.3 15.8 15.5 10.3 9.2 1.2 1.7% 7.1% 7.3% 4.2% 4.4% Colbun22.2 17.8 16.8 17.5 13.2 12.5 2.0 2.2% 10.6% 10.4% 5.3% 5.2% Concha y Toro22.1 16.3 20.0 12.2 11.0 10.3 1.5 2.5% 9.0% 7.0% 4.1% 3.2% Copec15.9 12.5 13.2 nm nm nm 1.6 2.7% 13.5% 12.8% 1.1% 1.1% Corpbanca28.4 17.5 18.7 13.3 9.6 8.7 1.7 2.4% 9.5% 8.4% 3.5% 2.8% Cruz Blanca34.4 18.7 16.1 8.1 7.0 6.7 0.9 2.7% 4.8% 5.5% 2.7% 3.1% E-CL19.3 22.6 19.1 10.5 9.4 9.0 1.7 3.1% 7.4% 8.6% 4.1% 4.5% Embonor-B18.1 23.2 16.6 10.5 10.8 9.8 2.5 2.9% 10.8% 14.0% 4.2% 5.6% Endesa11.7 16.9 13.6 4.8 6.4 6.0 1.4 3.0% 8.4% 10.0% 3.4% 4.1% Enersis11.5 16.2 11.7 5.3 5.8 5.1 1.6 3.1% 10.2% 13.4% 3.8% 4.8% Entel25.5 22.4 18.8 17.5 12.7 11.2 2.5 2.1% 13.8% 15.0% 4.4% 4.9% Falabella18.2 17.5 16.1 13.6 12.5 11.2 4.2 2.6% 25.4% 24.1% 21.1% 20.4% Forus
8.8 RESTR RESTR nm nm nm nm RESTR RESTR RESTR RESTR RESTR Habitat11.5 RESTR RESTR 11.2 RESTR RESTR 1.9 RESTR nm nm nm nm ILC
nm nm 26.3 7.8 7.7 7.0 1.2 1.1% nm 4.5% 0.0% 1.0% Latam10.3 RESTR RESTR 5.1 RESTR RESTR 0.2 RESTR RESTR RESTR RESTR RESTR Masisa12.3 18.8 16.3 16.3 16.7 15.2 1.4 2.7% 8.3% 8.3% 3.7% 3.8% Parauco14.1 nm nm nm nm nm 0.8 nm nm 0.0% nm 0.0% Quinenco16.5 14.9 13.3 13.2 12.4 11.1 0.8 2.0% 5.2% 5.6% 2.0% 2.2% Ripley
9.3 11.2 9.6 10.1 10.5 9.9 0.7 3.1% 6.0% 6.7% 2.0% 2.4% Salfacorp13.0 11.3 11.4 nm nm nm 2.5 5.3% 21.5% 19.5% 1.9% 1.7% Santander
nm nm nm nm nm nm nm 3.0% nm nm nm nm SM-ChileB13.5 12.6 11.6 7.5 8.2 7.5 1.4 5.2% 11.0% 11.4% 3.8% 4.2% SK16.8 23.7 20.1 9.0 9.2 7.9 2.3 2.9% 10.4% 11.4% 6.3% 6.3% Sonda16.8 21.6 20.9 10.7 11.2 10.7 2.8 2.3% 13.1% 12.8% 6.9% 7.3% SQM-B21.1 18.0 15.8 10.3 9.4 8.7 1.7 2.9% 9.4% 10.0% 2.6% 2.8% Chile Sample
P/E FV/EBITDA ROAE ROAA
74

Andean Equities Guide, 2015 75
Colombia Company Sector Px Last Px Target Upside Tot. Ret Rating Mkt. Cap ADTVAvianca Transport 3,585 4,300 20% 22% BUY 1,754 2.3 Banco de Bogota Banks 69,440 71,000 2% 6% UPERF 10,447 0.5 Bancolombia Banks 28,720 33,200 16% 18% HOLD 13,302 10.1 BVC Financial 22.4 24.2 8% 15% HOLD 204 0.4 Canacol Oil & Gas 7,500 11,000 47% 47% BUY 397 1.5 Celsia Utilities 5,980 7,020 17% 19% HOLD 2,099 1.6 Cemargos Cement & Construction 10,340 11,300 9% 11% HOLD 6,820 2.5 CLH Cement & Construction 18,100 20,100 11% 11% HOLD 4,919 2.9 Corficolombiana Conglomerates 39,000 44,000 13% 20% HOLD 4,020 1.4 Daviv ienda Banks 28,700 35,300 23% 25% BUY 6,238 2.5 Ecopetrol Oil & Gas 3,050 3,200 5% 12% HOLD 61,190 13.6 EEB Utilities 1,605 1,930 20% 26% BUY 7,188 0.8 ETB Telecom, IT & Media 550 600 9% 14% HOLD 953 0.2 Éx ito Retail 29,800 32,800 10% 12% HOLD 6,528 2.5 Grupo Argos Conglomerates 21,640 23,950 11% 12% HOLD 8,293 2.5 Grupo Aval Banks 1,325 1,530 15% 20% HOLD 14,446 3.3 Grupo Sura Conglomerates 39,680 46,400 17% 18% HOLD 11,171 5.5 ISA Utilities 8,230 8,910 8% 12% UPERF 4,447 1.4 Isagen Utilities 2,705 3,280 21% 25% BUY 3,597 2.0 Nutresa Food & Beverages 27,000 32,000 19% 20% BUY 6,017 2.1 Pacific Rubiales Oil & Gas 34,600 40,300 16% 20% BUY 5,321 9.1 Terpel Fuel retail 17,800 20,000 12% 15% HOLD 1,565 2.2 Colombia Sample 1,626 1,840 13% 16% 178,314 66.7
PeruCompany Sector Px Last Px Target Upside Tot. Ret Rating Mkt. Cap ADTVAceros Arequipa Cement & Construction 0.62 0.79 27% 29% BUY 277 0.1 AIH Transport 2.00 3.30 65% 65% BUY 93 0.0 Alicorp Food & Beverages 7.70 9.00 17% 18% HOLD 2,256 1.1 Austral Fishing 2.25 2.40 7% 11% HOLD 201 0.0 Buenaventura Mining 11.16 12.90 16% 16% HOLD 3,076 23.8 Casa Grande Sugar Mills 8.70 9.00 3% 8% HOLD 252 0.1 Cementos Pacasmayo Cement & Construction 5.16 6.14 19% 22% BUY 1,034 0.4 Cerro Verde Mining 24.30 21.00 -14% -14% UPERF 8,506 0.2 Edegel Utilities 3.25 3.45 6% 11% HOLD 2,568 0.2 Edelnor Utilities 5.56 5.74 3% 8% HOLD 1,223 0.2 Enersur Utilities 9.55 12.71 33% 35% BUY 1,979 0.2 Ferreycorp Cement & Construction 1.55 1.82 17% 20% HOLD 542 0.8 Graña y Montero Cement & Construction 7.75 10.33 33% 35% BUY 1,762 1.0 InRetail Retail 18.50 24.30 31% 31% BUY 1,902 0.7 Luz del Sur Utilities 9.82 10.97 12% 17% BUY 1,668 0.4 Milpo Mining 2.50 3.25 30% 30% BUY 1,145 0.5 Minsur Mining 1.75 2.20 26% 28% BUY 1,738 0.6 Siderperú Cement & Construction 0.31 0.35 13% 13% HOLD 131 0.0 Unacem Cement & Construction 2.83 3.72 31% 33% BUY 1,633 0.3 Volcan Mining 0.94 1.10 17% 18% HOLD 1,742 0.7 Peru Sample 15,773 17,700 12% 14% 34,246 31.5

Andean Equities Guide, 2015 76
P/BV Div. Peru2013 2014E 2015E 2013 2014E 2015E LTM Yield 2014E 2015E 2014E 2015E Company35.4 10.0 7.5 9.3 7.0 6.1 0.5 2.0% 5.1% 6.4% 2.6% 3.4% Aceros Arequipanm 21.0 6.2 7.9 7.7 6.8 0.2 0.0% 1.0% 3.5% 0.6% 2.0% AIH
21.0 21.3 18.7 12.7 13.1 11.6 2.8 1.4% 12.5% 13.0% 4.8% 5.0% Alicorp797 9.0 62.8 12.4 5.7 11.5 1.0 4.4% 11.0% 1.6% 6.1% 0.8% Australnm 25.1 24.6 4.2 7.0 6.7 0.9 0.6% 3.1% 3.1% 2.7% 2.7% Buenaventura
42.9 12.9 11.7 7.3 5.9 5.6 0.6 4.6% 4.6% 4.9% 3.1% 3.4% Casa Grande23.9 18.4 17.5 10.2 9.1 8.3 1.5 2.8% 8.0% 8.2% 5.2% 5.4% Cementos Pacasmayo14.0 18.2 17.6 7.3 9.4 8.6 2.0 0.0% 10.9% 10.1% 8.9% 7.4% Cerro Verde13.3 19.1 22.2 8.8 11.5 12.1 3.1 4.6% 15.9% 13.5% 9.4% 7.5% Edegel11.4 12.0 12.7 6.7 7.5 7.0 3.0 4.6% 23.7% 21.3% 9.2% 8.0% Edelnor15.7 14.6 14.7 10.0 9.6 9.0 3.0 2.1% 20.1% 17.7% 8.6% 7.6% Enersur18.2 9.0 7.8 6.1 6.4 6.0 1.0 2.7% 10.8% 11.4% 4.0% 4.5% Ferreycorp24.6 17.2 16.0 8.6 6.9 6.1 1.8 1.7% 10.4% 10.5% 4.2% 4.0% Graña y Montero81.9 27.0 23.1 12.7 12.3 10.3 1.8 0.0% 6.7% 7.3% 3.0% 3.2% InRetail14.2 14.3 13.3 10.2 10.0 9.0 3.0 5.0% 20.6% 20.6% 9.3% 9.3% Luz del Sur12.8 8.1 6.1 3.6 3.9 3.2 1.9 0.4% 22.6% 23.9% 11.9% 13.9% Milpo6.0 8.2 8.2 2.3 4.2 4.5 0.8 2.5% 7.6% 6.5% 6.5% 5.4% Minsurnm 11.0 13.2 7.3 7.6 8.2 0.3 0.0% 2.7% 2.2% 1.7% 1.4% Siderperú
30.4 16.8 14.2 13.2 10.4 9.2 1.4 1.8% 7.2% 7.1% 3.8% 3.8% Unacem11.7 20.7 8.6 7.0 12.4 7.5 1.2 0.9% 5.5% 12.2% 2.8% 6.6% Volcan17.6 16.3 14.9 7.0 8.7 7.8 1.5 1.9% 8.9% 8.7% 5.5% 5.4% Peru Sample
P/E FV/EBITDA ROAE ROAA
P/BV Div. Colombia 2013 2014E 2015E 2013 2014E 2015E LTM Yield 2014E 2015E 2014E 2015E Company7.6 16.4 6.4 4.2 5.0 3.9 1.3 2.3% 8.5% 19.0% 1.9% 4.5% Avianca
14.9 14.4 12.2 nm nm nm 2.0 3.6% 14.4% 15.6% 1.9% 2.0% Banco de Bogota13.2 14.0 11.7 nm nm nm 1.7 2.9% 13.7% 13.8% 1.5% 1.6% Bancolombia17.9 15.1 15.6 11.3 10.6 10.0 3.8 6.3% 25.3% 24.2% 19.4% 17.7% BVCnm 58.0 7.3 nm 7.0 3.5 1.0 nm 2.5% 11.5% 1.3% 6.9% Canacol
10.9 12.2 18.8 7.8 6.2 8.1 1.2 2.0% 10.6% 8.0% 4.8% 3.7% Celsia72.3 34.1 25.9 16.3 11.9 10.3 1.9 1.7% 5.6% 7.1% 3.4% 4.1% Cemargos18.6 16.2 14.2 9.9 9.5 8.8 3.3 0.0% 19.2% 17.8% 7.4% 7.9% CLH14.6 18.0 16.3 nm nm nm 1.8 1.8% 10.7% 10.6% 4.2% 4.3% Corficolombiana12.3 12.6 11.2 nm nm nm 1.9 2.4% 15.7% 15.8% 1.7% 1.7% Daviv ienda11.6 10.4 10.6 6.2 5.2 4.9 1.7 6.7% 16.2% 15.3% 8.4% 7.8% Ecopetrol18.0 13.0 12.3 10.7 10.2 9.5 1.4 4.6% 9.5% 11.1% 5.4% 6.1% EEB9.2 4.1 n.a. 1.5 1.5 2.3 0.6 4.9% 13.7% -0.5% 8.8% -0.3% ETB
30.6 29.1 26.5 14.4 11.4 10.2 1.6 1.6% 5.7% 6.1% 4.2% 4.4% Éxito46.1 25.4 25.3 14.1 8.5 8.5 1.3 1.2% 5.5% 5.3% 2.5% 2.5% Grupo Argos15.1 15.2 12.8 nm nm nm 1.9 4.4% 13.7% 14.4% 1.7% 1.8% Grupo Aval24.8 30.1 27.6 nm nm nm 1.0 1.1% 3.6% 3.6% 3.4% 3.4% Grupo Sura23.3 15.6 17.9 11.4 10.0 10.1 1.2 3.5% 6.7% 6.9% 2.0% 2.1% ISA20.4 14.6 16.6 16.5 12.6 9.9 1.7 3.4% 11.3% 10.8% 5.7% 5.5% Isagen31.9 43.5 42.0 16.5 13.2 12.6 1.6 1.7% 3.8% 3.8% 2.7% 2.8% Nutresa13.5 9.3 8.0 3.7 3.2 2.7 1.2 3.9% 12.6% 13.3% 4.8% 5.3% Pacific Rubialesnm 17.2 16.7 nm 7.1 6.5 1.8 2.9% 9.6% 10.4% 4.7% 4.7% Terpel
24.6 21.2 19.6 11.5 8.8 8.3 1.6 2.8% 9.9% 9.8% 3.9% 3.9% Colombia Sample
P/E FV/EBITDA ROAE ROAA
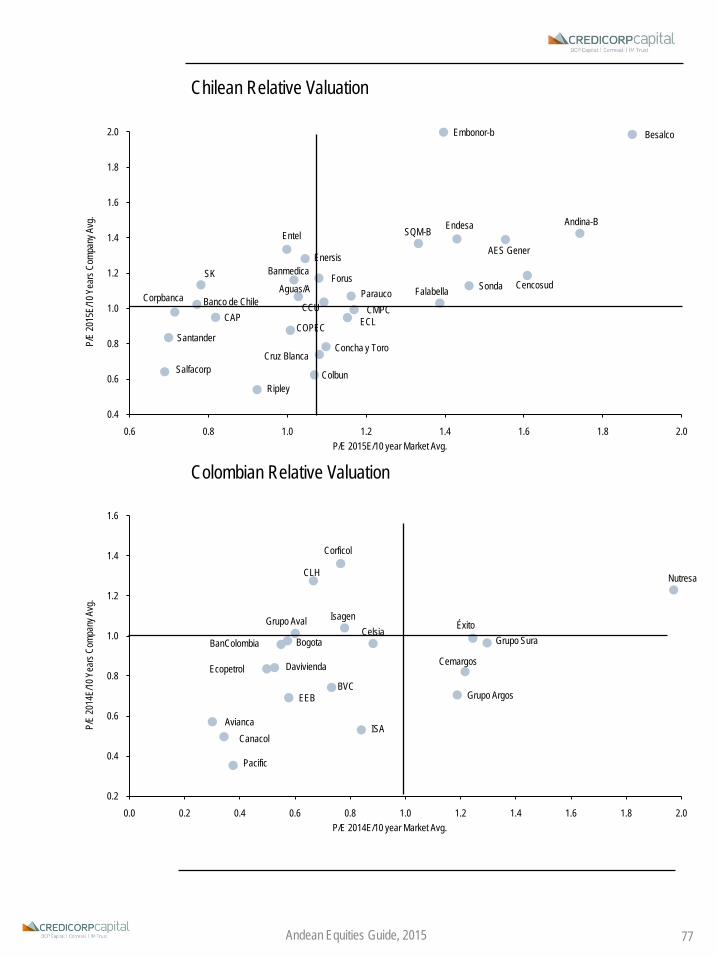
Chilean Relative Valuation
Colombian Relative Valuation
Andean Equities Guide, 2015 77
AES Gener
Aguas/A
Andina-B
Banmedica
Besalco
CAPCCU
CencosudBanco de Chile
CMPC
Colbun
Concha y Toro
COPEC
Corpbanca
Cruz Blanca
ECL
Embonor-b
Endesa
Enersis
Entel
FalabellaForus
Parauco
Ripley
Salfacorp
Santander
SKSonda
SQM-B
0.4
0.6
0.8
1.0
1.2
1.4
1.6
1.8
2.0
0.6 0.8 1.0 1.2 1.4 1.6 1.8 2.0
P/E
2015
E/10
Yea
rs Co
mpan
y Avg
.
P/E 2015E/10 year Market Avg.
Ecopetrol
Pacific
Grupo Sura
Cemargos
Grupo Argos
Nutresa
Celsia
ISA
Isagen
EEB
BanColombia
Davivienda
Grupo Aval
Corficol
CLH
Avianca
Bogota
BVC
Canacol
Éxito
0.2
0.4
0.6
0.8
1.0
1.2
1.4
1.6
0.0 0.2 0.4 0.6 0.8 1.0 1.2 1.4 1.6 1.8 2.0
P/E
2014
E/10
Yea
rs Co
mpan
y Avg
.
P/E 2014E/10 year Market Avg.

Aceros Arequipa
AIH
Alicorp
Buenaventura
Casa Grande
Cementos Pacasmayo
Cerro Verde
EdegelEdelnor
Enersur
Ferreycorp
Graña y Montero
Luz del Sur
Milpo
Minsur
Siderperú
UnacemVolcanInRetail
0.2
0.4
0.6
0.8
1.0
1.2
1.4
1.6
1.8
2.0
2.2
0.2 0.4 0.6 0.8 1.0 1.2 1.4 1.6 1.8 2.0 2.2 2.4
P/E
2014
E/10
Yea
rs Co
mpan
y Avg
.
P/E 2014E/10 year Market Avg.
Peruvian Relative Valuation
Andean Equities Guide, 2015 78

This page has been intentionally left bank
CompanySnapshots

2013 2014E 2015E 2016EFV/EBITDA 9.3 7.0 6.1 6.2P/E 35.4 10.0 7.5 7.2P/CF 13.7 4.2 7.0 3.8P/BV 0.7 0.5 0.5 0.5Div . Yield 0.0% 1.2% 2.0% 4.9%Sources: Company Reports and Credicorp Capital
Peru Industry: Rating:BuyAceros Arequipa
Surfing the steel wavesOmar Avellaneda
+(511) 416 3333 Ext 36065 [email protected]
Investment Thesis Stock Data
• We are introducing a new 2015YE target price for AcerosArequipa of PEN 0.79 (dropping our 2014 T.P of PEN 1.0),reiterating our Buy recommendation on shares. The companyshould benefit from the expected growth in Peru’s public and privateinvestment in the coming years. Attractive valuations, however, aresomewhat offset by low liquidity levels, limiting our recommendationto investors who can live with thinly traded volumes.
• As a component of the EPU and considering the shares’ scarceliquidity, price volatility is high in shares, especially as internationalinvestors become more active.
• Positive impact of new rolling mill in Pisco. This has providedflexibility in its production mix and in the reduction of imports offinished products. Although we expect an annual price decline of 8%in steel products in 2014-16, the company should reach an annualincrease in sales volume of 6% over the same period. Gross marginshould reach 20% in the coming years (17.0% in the long term).
• Risks to our thesis: Slowdown in public and private investment;volatility in inputs (steel scrap, mainly, and billets); highercompetition with imports in the local market (Turkey and China).
Price Chart (PEN) and Volumes (USD mn)
Valuation• We estimated our 2015YE target price based on a 10-year DCF
model. Our valuation for the company implies a 2015YE P/E of 7.5xand a 2015YE FV/EBITDA of 6.1x, which we believe is fair.
• Investments in CELEPSA (hydro-electrical plant), Comercial delAcero (steel products trader) and Transportes Barcino (transport)add PEN 0.16 to our target price.
Valuation Summary
P/E 12M Forward FV/EBITDA 12M Forward Relative Valuation
Gerdau
Cia Siderurgica
Nacional
Aceros Arequipa
Siderperú
Ternium
UsiminasGrupo Simec
0
5
10
15
20
25
2 7 12
P/E
2015
E
FV/EBITDA 2015E
0
5
10
15
20
Oct-05 Oct-08 Oct-11 Oct-140
5
10
15
20
25
30
Oct-05 Oct-08 Oct-11 Oct-14
Andean Equities Guide, 2015
Cement & Construction
0.0
0.5
1.0
80
90
100
110
120
130
140
Oct-13 Feb-14 Jun-14 Oct-14
USD
m
Aceros Arequipa IGBVL
81
Ticker corarei1 pePrice (PEN) 0.62LTM Range 0.56 - 0.80Target 0.79 Total Return 29%Market Cap (USD, mn) 277Shares Outstanding (mn) 201Free Float 53%ADTV (USD, mn) 0.1

Aceros ArequipaCompany Description
Aceros Arequipa is the leading producer of steel products in Peru. Thecompany has a steelmaking capacity of 750,000 MT/year and two steelrolling mills located in Arequipa and Pisco (south of Peru) with a totalcapacity of 1’350,000 MT/year and an estimated market share of 31% inlong steel products.
Ownership Income Statement
Revenue Breakdown by region (2015E) Balance Sheet
Revenues Breakdown by product
Cash Flow
Management
CEO: Ricardo CillónizCFO: Marco Donizettiwww.acerosarequipa.com
Long Steel, 95%
Flat steel, 5%
Local, 88%
Exports, 12%
Cillóniz family, 31.2%
Olesa Investme
nt Corporati
on, 10.4%
Transportes
Barcino, 5.2%
Others, 53.2%
Andean Equities Guide, 2015
PEN mn 2012 2013 2014E 2015E 2016ERevenues 2,166 2,149 2,293 2,261 2,222 EBIT 82 168 166 204 197 EBITDA 97 218 239 275 273 Net Income 46 29 81 107 111 EPS (PEN) 0.04 0.03 0.07 0.09 0.10 EBIT Margin 3.8% 7.8% 7.3% 9.0% 8.8%EBITDA Margin 4.5% 10.1% 10.4% 12.1% 12.3%Net Margin 2.1% 1.3% 3.5% 4.7% 5.0%
PEN mn 2012 2013 2014E 2015E 2016ECash & Equivalents 179 249 169 179 123Total Current Assets 1,357 1,373 1,316 1,361 1,248Total Assets 2,681 3,183 3,120 3,159 3,039Current Liabilities 1,014 902 826 794 688Financial Debt 982 1,260 1,038 997 808Total Liabilities 1,396 1,640 1,506 1,455 1,263Minority Interest 0 0 0 0 0Shareholders Equity 1,285 1,543 1,614 1,704 1,776Total Liabilities + Equity 2,681 3,183 3,120 3,159 3,039EBITDA / Fin. Expenses 3.0 5.7 5.4 5.5 7.2Financial Debt /EBITDA 10.2 5.8 4.3 3.6 3.0Financial Debt /Equity 0.8 0.8 0.6 0.6 0.5ROAE 3.9% 2.0% 5.1% 6.4% 6.4%ROAA 1.8% 1.0% 2.6% 3.4% 3.6%ROIC 2.9% 5.1% 4.6% 5.7% 5.5%
82
PEN mn 2012 2013 2014E 2015E 2016EInitial Cash 160 179 249 169 179Cash from Operations 179 56 244 135 241CAPEX -167 -86 -69 -68 -69Changes in Financial Debt 92 278 -222 -41 -190Div idends (Paid) Received -22 0 -10 -16 -39Other CFI and CFF items -64 -179 -22 0 0Changes in Equity 0 0 0 0 0Final Cash 179 249 169 179 123Change in Cash 18 70 -79 10 -57Sources: Company Reports and Credicorp Capital; E Credicorp Capital Estimates

5
10
15
20
25
30
Oct-09 Oct-10 Oct-11 Oct-12 Oct-13 Oct-144
6
8
10
12
14
Oct-09 Oct-10 Oct-11 Oct-12 Oct-13 Oct-14
Endesa
E-CL
Celsia
IsagenColbun
Edegel
Enersis
AES Gener
Edelnor1012141618202224
3 5 7 9 11 13 15
P/E
2015
E
FV/EBITDA 2015E
2013 2014E 2015E 2016EFV/EBITDA 10.8 11.0 10.4 9.4P/E 22.2 25.2 20.9 19.1P/CF 50.2 n.m. n.m. n.m.P/BV 1.8 1.7 1.7 1.7Div . Yield 4.0% 4.7% 4.0% 4.8%Sources: Company Reports and Credicorp Capital
Chile Industry: Rating:
BuyAES GenerEPS to recover. Bet on growth remains
Andrés Ossa+(562) 2651 9332
Investment Thesis Stock Data
• We are updating our coverage of Gener, maintaining our BUYrating and introducing our new 2015YE TP of CLP 360, implyinga total return of 20%. We continue to like shares due to projectgrowth and a strong track record in execution. We anticipate arebound in EPS during 2H14.
• Operating turnaround at sight. According to our numbers, Gener’searnings should recover during 3Q14. Expected growth will continuethrough at least 2Q15, in our view. A weak comparison base, higherprices in the SIC and SING, and a recovery in hydro generation inColombia will drive these results.
• Growth play in the electric sector. Gener’s expansion plan isprogressing steadily. The construction of Cochrane is ~45%completed and we believe there is a clear line to its start-up in 2016.Alto Maipo remains on schedule (~4% advanced) and we expect itto be completed by mid-2018. We highlight that the governmentpublicly and explicitly supported this project, hence, we do not seerisks of cancellation, despite some opposition from localstakeholders. During 2015, the 5th unit of the Guacolda complex willbegin its commercial operations; however, this will not be reflectedin Gener’s operating figures, as Guacolda is not consolidated.
• Risks to our thesis: i) delays in projects, ii) unforeseen outages inpower facilities, iii) hydrology risk in Colombia.
Price Chart (CLP) and Volumes (USD mn)
Valuation• Our 2015E TP is based on a 10-year DCF valuation, with a WACC
of 8.6% in nominal, USD terms. At our target, Gener should tradeat a 22x P/E and a 10x FV/EBITDA, roughly in line with itscurrent multiples.
• Gener is trading in line with its averages in terms of P/E andFV/EBITDA. In relation to peers, the company trades at a ~25%premium over local comps. Strong growth perspectives largelyexplain the latter: AES Gener is our growth bet in the electric sectorin Chile. It remains a long-term, top pick in the industry.
Valuation Summary
P/E 12M Forward FV/EBITDA 12M Forward Relative Valuation
83Andean Equities Guide, 2015
Utilities
Ticker aesgener ciPrice (CLP) 311LTM Range (CLP) 258 - 322Target (CLP) 360Total Return 20%Market Cap (USD mn) 4,479Shares Outstanding (mn) 8,405Free Float 29%ADTV (USD mn) 1.9
0
2
4
6
8
10
12
70
80
90
100
110
Oct-13 Feb-14 Jun-14 Oct-14
USD
m
AES Gener IPSA
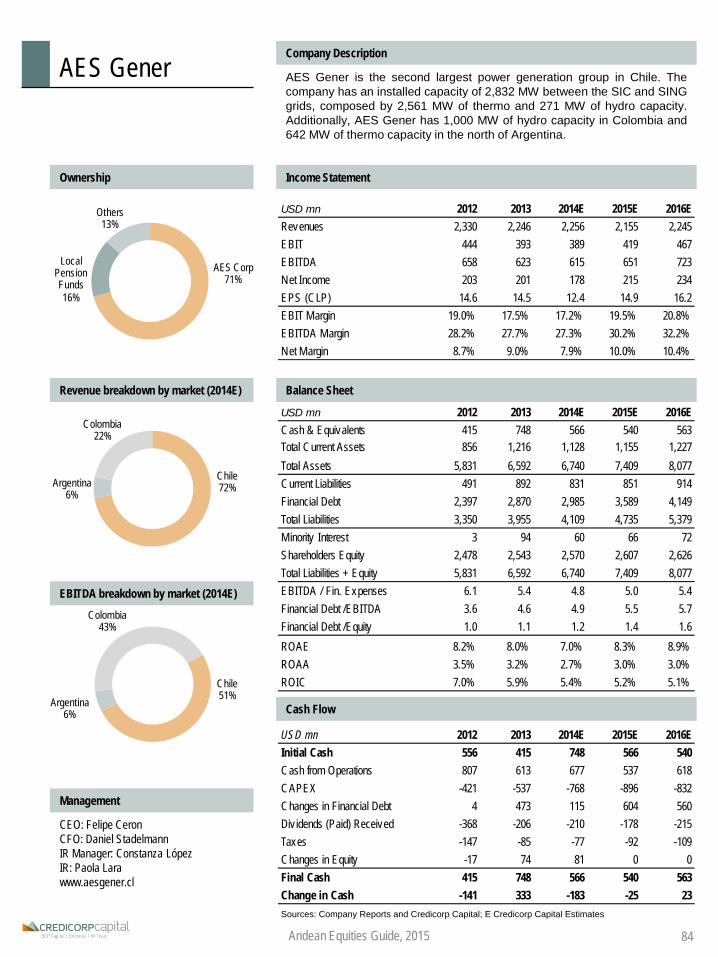
AES GenerCompany Description
AES Gener is the second largest power generation group in Chile. Thecompany has an installed capacity of 2,832 MW between the SIC and SINGgrids, composed by 2,561 MW of thermo and 271 MW of hydro capacity.Additionally, AES Gener has 1,000 MW of hydro capacity in Colombia and642 MW of thermo capacity in the north of Argentina.
Ownership Income Statement
Revenue breakdown by market (2014E) Balance Sheet
EBITDA breakdown by market (2014E)
Cash Flow
Management
CEO: Felipe CeronCFO: Daniel StadelmannIR Manager: Constanza LópezIR: Paola Larawww.aesgener.cl
Andean Equities Guide, 2015
USD mn 2012 2013 2014E 2015E 2016ECash & Equivalents 415 748 566 540 563Total Current Assets 856 1,216 1,128 1,155 1,227Total Assets 5,831 6,592 6,740 7,409 8,077Current Liabilities 491 892 831 851 914Financial Debt 2,397 2,870 2,985 3,589 4,149Total Liabilities 3,350 3,955 4,109 4,735 5,379Minority Interest 3 94 60 66 72Shareholders Equity 2,478 2,543 2,570 2,607 2,626Total Liabilities + Equity 5,831 6,592 6,740 7,409 8,077EBITDA / Fin. Expenses 6.1 5.4 4.8 5.0 5.4Financial Debt /EBITDA 3.6 4.6 4.9 5.5 5.7Financial Debt /Equity 1.0 1.1 1.2 1.4 1.6ROAE 8.2% 8.0% 7.0% 8.3% 8.9%ROAA 3.5% 3.2% 2.7% 3.0% 3.0%ROIC 7.0% 5.9% 5.4% 5.2% 5.1%
USD mn 2012 2013 2014E 2015E 2016EInitial Cash 556 415 748 566 540Cash from Operations 807 613 677 537 618CAPEX -421 -537 -768 -896 -832Changes in Financial Debt 4 473 115 604 560Div idends (Paid) Received -368 -206 -210 -178 -215Taxes -147 -85 -77 -92 -109Changes in Equity -17 74 81 0 0Final Cash 415 748 566 540 563Change in Cash -141 333 -183 -25 23Sources: Company Reports and Credicorp Capital; E Credicorp Capital Estimates
AES Corp71%
Local Pension Funds16%
Others13%
Chile72%Argentina
6%
Colombia22%
Chile51%Argentina
6%
Colombia43%
USD mn 2012 2013 2014E 2015E 2016ERevenues 2,330 2,246 2,256 2,155 2,245EBIT 444 393 389 419 467EBITDA 658 623 615 651 723Net Income 203 201 178 215 234EPS (CLP) 14.6 14.5 12.4 14.9 16.2EBIT Margin 19.0% 17.5% 17.2% 19.5% 20.8%EBITDA Margin 28.2% 27.7% 27.3% 30.2% 32.2%Net Margin 8.7% 9.0% 7.9% 10.0% 10.4%
84

12
14
16
18
20
22
Oct-11 Oct-12 Oct-13 Oct-149
10
11
12
13
14
Oct-11 Oct-12 Oct-13 Oct-14
American Water
Severn Trent
United Utilities
Veolia
Suez
Cia. Saneam. Basico
Aguas/A
47
10131619222528
4 6 8 10 12 14
P/E
2015
E
FV/EBITDA 2015E
Chile Industry: Rating:
BuyAguas AndinasChile’s dividend play; EPS increasing
Andrés Ossa+(562) 2651 9332
Investment Thesis Stock Data
• We maintain our BUY rating on the stock, with our CLP 3902015YE target price. In our view the company’s defensive featuresshould support the shares, in spite of noise related to this year’stariff revision. We see Aguas/A as a safe haven in times ofuncertainty and highlight its 6.0% dividend yield (2015E).
• While we do not see much room for multiple expansion, weanticipate that earnings should pick up due to a lower impacton results of indexation (debt in UF). As we remain cautioustowards the IPSA, we believe Aguas/A should outperform over thenext 12 months.
• New 2015-2019 tariffs to be defined. The regulator and Aguas/Aare currently reviewing the tariffs for the next 5 years. We highlightthat this is normally a friendly process, reducing the risk of seeingextreme variations. While there is no market consensus on what theoutcome could look like, our numbers include a slight decreasein tariffs (-2%), which reduces downside risk to our estimates.
• The company has attractive profitability ratios (ROE of 18-20%),which are supported by the industry’s stable regulatory framework.
• Risks to our thesis: i) higher-than-expected cuts in the tariffrevision, ii) modifications to the sanitary framework (ROA of 7%).
Price Chart (CLP) and Volumes (USD mn)
Valuation• We calculate our 2015YE TP of CLP 390 with a 10yr DCF model.
We discounted the company’s cash flows using a WACC of 8.0% inCLP terms.
• The company is trading at 16.5x P/E 2015E and 11.4x FV/EBITDA2015E, in line with its average and at a premium when compared topeers. We view this premium over peers as justified due to highermargins and profitability. While we do not see much room formultiples expansion, we expect EPS to recover during 2015 and2016, driving share outperformance in the process.
Valuation Summary
P/E 12M Forward FV/EBITDA 12M Forward Relative Valuation
2013 2014E 2015E 2016EFV/EBITDA 11.7 11.2 11.4 10.6P/E 17.3 16.7 16.5 15.5P/CF 18.7 12.3 18.5 15.7P/BV 3.3 3.3 3.3 3.2Div . Yield 6.0% 5.7% 6.0% 6.0%Sources: Company Reports and Credicorp Capital
Andean Equities Guide, 2015
Utilities
Ticker / ADR aguas/a ciPrice (CLP) 343LTM Range (CLP) 321 - 375Target (CLP) 390Total Return 20%Market Cap (USD mn) 3,495Shares Outstanding (mn) 5,811Free Float 50%ADTV (USD mn) 2.8
0
5
10
15
20
25
80
85
90
95
100
105
110
Oct-13 Feb-14 Jun-14 Oct-14
USD
m
Aguas A IPSA
85

Aguas AndinasCompany Description
Aguas Andinas is the leading company in the Chilean sanitary industry andone of the largest in Latin America. It provides sanitation services to over 7million residents within the Metropolitan Region, in both urban and ruralareas. Aguas Andinas has a roughly 43% of market share in Chile.
Ownership Income Statement
Revenue Breakdown (2014E) Balance Sheet
Service Coverage Evolution
Cash Flow
Management
CEO: Jordi VallsCFO: Ivan YarurIR: Stephanie Baierwww.aguasandinas.cl/investors
Andean Equities Guide, 2015
Water41%
Sewage44%
Other Regulated
4%
Other Non-regulated
11%
IAM50.1%
Foreign Investors
24.1%
Local Institutionals
8.4%
CORFO5.0%
Other12.4%
CLP mn 2012 2013 2014E 2015E 2016ECash & Equivalents 37,413 38,891 41,560 41,338 44,181Total Current Assets 121,283 132,972 140,807 145,876 154,496Total Assets 1,546,225 1,577,711 1,607,190 1,661,906 1,731,908Current Liabilities 166,752 220,195 223,884 227,475 236,508Financial Debt 695,653 721,755 735,124 783,333 835,671Total Liabilities 861,973 900,042 916,787 968,343 1,027,225Minority Interest 62,498 61,128 68,000 70,315 73,277Shareholders Equity 621,754 616,541 622,403 623,248 631,406Total Liabilities + Equity 1,546,225 1,577,711 1,607,190 1,661,906 1,731,908EBITDA / Fin. Expenses 15.2 11.3 11.7 10.5 10.7Financial Debt /EBITDA 2.9 2.9 2.8 3.0 3.0Financial Debt /Equity 1.1 1.2 1.2 1.3 1.3ROAE 19.5% 18.8% 19.8% 19.8% 21.0%ROAA 7.8% 7.5% 7.7% 7.5% 7.8%ROIC 11.3% 11.2% 12.5% 11.3% 11.5%
CLP mn 2012 2013 2014E 2015E 2016EInitial Cash 6,426 37,413 38,891 41,560 41,338Cash from Operations 209,204 243,069 203,356 223,651 223,911CAPEX -97,590 -116,824 -68,449 -113,084 -107,766Changes in Financial Debt 68,356 26,102 13,369 48,208 52,338Div idends (Paid) Received -113,190 -121,557 -116,658 -122,521 -123,365Taxes -35,793 -29,312 -28,949 -36,477 -42,275Changes in Equity 0 0 0 0 0Final Cash 37,413 38,891 41,560 41,338 44,181Change in Cash 30,987 1,478 2,668 -222 2,843Sources: Company Reports and Credicorp Capital; E Credicorp Capital Estimates
0%
25%
50%
75%
100%
6.0
6.3
6.6
6.9
7.2
2003 2005 2007 2009 2011 2013
Population (Mn.) DeliveryColection Treatment
CLP mn 2012 2013 2014E 2015E 2016ERevenues 382,886 402,362 425,320 423,050 452,144EBIT 186,713 182,310 203,622 200,081 216,101EBITDA 241,923 247,015 265,848 261,975 282,252Net Income 121,322 116,658 122,521 123,365 131,524EPS (CLP) 20.9 20.1 21.1 21.2 22.6EBIT Margin 48.8% 45.3% 47.9% 47.3% 47.8%EBITDA Margin 63.2% 61.4% 62.5% 61.9% 62.4%Net Margin 31.7% 29.0% 28.8% 29.2% 29.1%
86
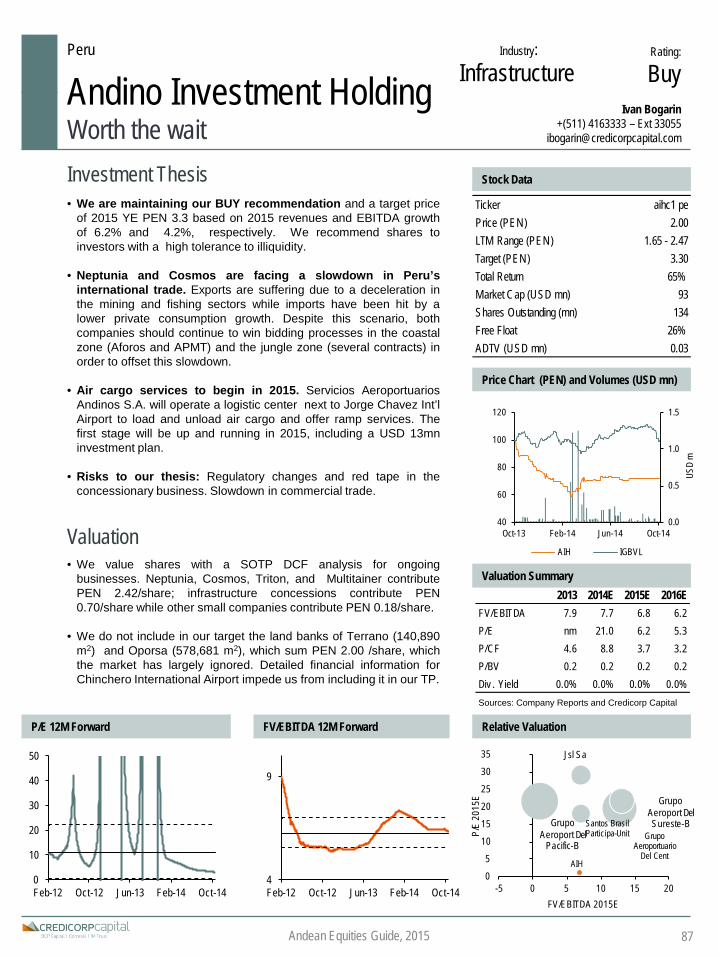
2013 2014E 2015E 2016EFV/EBITDA 7.9 7.7 6.8 6.2P/E nm 21.0 6.2 5.3P/CF 4.6 8.8 3.7 3.2P/BV 0.2 0.2 0.2 0.2Div . Yield 0.0% 0.0% 0.0% 0.0%Sources: Company Reports and Credicorp Capital
Peru Industry: Rating:
BuyAndino Investment HoldingWorth the wait
Ivan Bogarin+(511) 4163333 – Ext 33055
Investment Thesis Stock Data
• We are maintaining our BUY recommendation and a target priceof 2015 YE PEN 3.3 based on 2015 revenues and EBITDA growthof 6.2% and 4.2%, respectively. We recommend shares toinvestors with a high tolerance to illiquidity.
• Neptunia and Cosmos are facing a slowdown in Peru’sinternational trade. Exports are suffering due to a deceleration inthe mining and fishing sectors while imports have been hit by alower private consumption growth. Despite this scenario, bothcompanies should continue to win bidding processes in the coastalzone (Aforos and APMT) and the jungle zone (several contracts) inorder to offset this slowdown.
• Air cargo services to begin in 2015. Servicios AeroportuariosAndinos S.A. will operate a logistic center next to Jorge Chavez Int’lAirport to load and unload air cargo and offer ramp services. Thefirst stage will be up and running in 2015, including a USD 13mninvestment plan.
• Risks to our thesis: Regulatory changes and red tape in theconcessionary business. Slowdown in commercial trade.
Price Chart (PEN) and Volumes (USD mn)
Valuation• We value shares with a SOTP DCF analysis for ongoing
businesses. Neptunia, Cosmos, Triton, and Multitainer contributePEN 2.42/share; infrastructure concessions contribute PEN0.70/share while other small companies contribute PEN 0.18/share.
• We do not include in our target the land banks of Terrano (140,890m2) and Oporsa (578,681 m2), which sum PEN 2.00 /share, whichthe market has largely ignored. Detailed financial information forChinchero International Airport impede us from including it in our TP.
Valuation Summary
P/E 12M Forward FV/EBITDA 12M Forward Relative Valuation
Andean Equities Guide, 2015
Infrastructure
87
Ticker aihc1 pePrice (PEN) 2.00LTM Range (PEN) 1.65 - 2.47Target (PEN) 3.30Total Return 65%Market Cap (USD mn) 93Shares Outstanding (mn) 134Free Float 26%ADTV (USD mn) 0.03
0.0
0.5
1.0
1.5
40
60
80
100
120
Oct-13 Feb-14 Jun-14 Oct-14
USD
m
AIH IGBVL
0
10
20
30
40
50
Feb-12 Oct-12 Jun-13 Feb-14 Oct-144
9
Feb-12 Oct-12 Jun-13 Feb-14 Oct-14
Jsl Sa
Santos Brasil Participa-Unit
Grupo Aeroport Del Sureste-BGrupo
Aeroport Del Pacific-B
AIH
Grupo Aeroportuario
Del Cent
0
5
10
15
20
25
30
35
-5 0 5 10 15 20
P/E
2015
E
FV/EBITDA 2015E
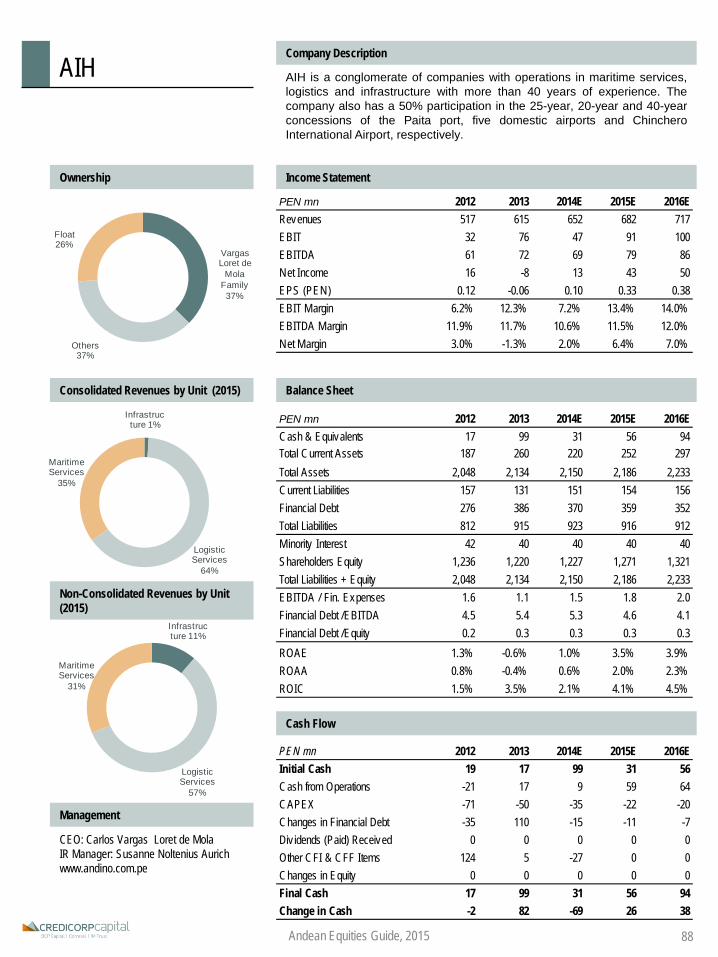
PEN mn 2012 2013 2014E 2015E 2016ECash & Equivalents 17 99 31 56 94Total Current Assets 187 260 220 252 297Total Assets 2,048 2,134 2,150 2,186 2,233Current Liabilities 157 131 151 154 156Financial Debt 276 386 370 359 352Total Liabilities 812 915 923 916 912Minority Interest 42 40 40 40 40Shareholders Equity 1,236 1,220 1,227 1,271 1,321Total Liabilities + Equity 2,048 2,134 2,150 2,186 2,233EBITDA / Fin. Expenses 1.6 1.1 1.5 1.8 2.0Financial Debt /EBITDA 4.5 5.4 5.3 4.6 4.1Financial Debt /Equity 0.2 0.3 0.3 0.3 0.3ROAE 1.3% -0.6% 1.0% 3.5% 3.9%ROAA 0.8% -0.4% 0.6% 2.0% 2.3%ROIC 1.5% 3.5% 2.1% 4.1% 4.5%
AIHCompany Description
AIH is a conglomerate of companies with operations in maritime services,logistics and infrastructure with more than 40 years of experience. Thecompany also has a 50% participation in the 25-year, 20-year and 40-yearconcessions of the Paita port, five domestic airports and ChincheroInternational Airport, respectively.
Ownership Income Statement
Consolidated Revenues by Unit (2015) Balance Sheet
Non-Consolidated Revenues by Unit (2015)
Cash Flow
Management
CEO: Carlos Vargas Loret de MolaIR Manager: Susanne Noltenius Aurichwww.andino.com.pe
Andean Equities Guide, 2015
PEN mn 2012 2013 2014E 2015E 2016EInitial Cash 19 17 99 31 56Cash from Operations -21 17 9 59 64CAPEX -71 -50 -35 -22 -20Changes in Financial Debt -35 110 -15 -11 -7Div idends (Paid) Received 0 0 0 0 0Other CFI & CFF Items 124 5 -27 0 0Changes in Equity 0 0 0 0 0Final Cash 17 99 31 56 94Change in Cash -2 82 -69 26 38
PEN mn 2012 2013 2014E 2015E 2016ERevenues 517 615 652 682 717EBIT 32 76 47 91 100EBITDA 61 72 69 79 86Net Income 16 -8 13 43 50EPS (PEN) 0.12 -0.06 0.10 0.33 0.38EBIT Margin 6.2% 12.3% 7.2% 13.4% 14.0%EBITDA Margin 11.9% 11.7% 10.6% 11.5% 12.0%Net Margin 3.0% -1.3% 2.0% 6.4% 7.0%
Infrastructure 1%
Logistic Services
64%
Maritime Services
35%
Infrastructure 11%
Logistic Services
57%
Maritime Services
31%
Vargas Loret de
Mola Family 37%
Others 37%
Float 26%
88

2013 2014E 2015E 2016EFV/EBITDA 12.7 13.1 11.6 10.1P/E 21.0 21.3 18.7 15.6P/CF 5.3 4.7 4.6 5.6P/BV 3.3 2.6 2.3 2.1Div . Yield 1.5% 1.6% 1.4% 1.6%Sources: Company Reports and Credicorp Capital
Peru Industry:
FoodRating:
HoldAlicorpTime to tidy up the house
Ivan Bogarin+(511) 4163333 – Ext 33055
Investment Thesis Stock Data
• We are maintaining our Hold recommendation, but reducingour 2015YE target to PEN 9.0 from PEN 9.5 2014YE due to aweaker economic outlook in Peru and Argentina. 2015E revenuesand EBITDA should grow by 7.5% and 12.9%, respectively.
• The Peruvian economy is not growing as expected (63% ofRevenues and 65% of EBITDA), due to external and internalfactors. Although we expect a rebound in 2015, we believe Alicorpwill face this bumpy environment through its renowned competitiveadvantages: commodity purchases, a unique distribution platform,brand management ,and product development.
• Decline in prices of soft commodities. Wheat and soybeanrepresent about 60% of COGS. Both commodity prices havedecreased YTD (Soybean -17.07% and wheat -21.04%). This willimprove gross margin heading 1H15 due to Alicorp’s active, hedgestrategy.
• Risks to our thesis: Fall in private consumption in Peru. Politicalrisk in Argentina and Ecuador. Higher FX volatility. Disposal of high-margin Nutrition Animal Unit to acquire a core business platform(abroad Peru).
Price Chart (PEN) and Volumes (USD mn)
Valuation• Using a DCF 10-year model with a WACC of 8.2% and D/E target
of 25%, we arrive at 2015YE target of PEN 9.0. We consider 6.2%growth in consumer goods division, a 6.4% growth in B2B brandedproducts, and a 13% growth in animal nutrition for 2015.
• Alicorp is trading within its +/- 1 SD 12M FWD P/E historicalaverage (12.5x). Shares are trading in line with its regional peers(Brazil, Mexico), which we view as fair.
Valuation Summary
P/E 12M Forward FV/EBITDA 12M Forward Relative Valuation
Andean Equities Guide, 2015 89
Ticker alicorc1 pePrice (PEN) 7.70LTM Range (PEN) 7.39 - 9.27Target (PEN) 9.00Total Return 18%Market Cap (USD mn) 2,256Shares Outstanding (mn) 847Free Float 55%ADTV (USD mn) 1.1
0
5
10
15
20
25
80
90
100
110
120
Oct-13 Feb-14 Jun-14 Oct-14
USD
m
Alicorp IGBVL
0
10
20
30
40
50
Oct-05 Oct-08 Oct-11 Oct-140
5
10
15
20
Oct-05 Oct-08 Oct-11 Oct-14
Grupo Bimbo SAB
M Dias Branco
Hypermarcas SA
Nutresa
GrumaGrupo Herdez
Alicorp
05
101520253035404550
8 10 12 14 16
P/E
2015
E
FV/EBITDA 2015E

AlicorpCompany Description
Alicorp is a leading Peruvian consumer goods company offering brandedproducts with operations in Argentina, Colombia, Ecuador, Chile and Brazil.The company has 133 family brands throughout 16 categories in theconsumer goods segment, 33 brands directed to the food industry and twobrands of fish and shrimp feed.
Ownership Income Statement
Revenue Breakdown by Unit (2015) Balance Sheet
Revenues by Country (2015)
Cash Flow
Management
CEO: Paolo Sacchi GiuratoCFO: Diego RosadoIR Manager: Fiorella Debernardi Baertlwww.alicorp.com.pe
Andean Equities Guide, 2015
PEN mn 2012 2013 2014E 2015E 2016ERevenues 4,474 5,822 6,335 6,812 7,462EBIT 481 590 592 668 761EBITDA 560 767 693 782 898Net Income 351 369 307 351 420EPS (PEN) 0.4 0.4 0.4 0.4 0.4EBIT Margin 10.8% 10.1% 9.4% 9.8% 10.2%EBITDA Margin 12.5% 13.2% 10.9% 11.5% 12.0%Net Margin 7.9% 6.3% 4.9% 5.1% 5.6%
PEN mn 2012 2013 2014E 2015E 2016ECash & Equivalents 496 93 96 285 261Total Current Assets 2,234 2,132 2,568 2,596 3,058Total Assets 4,250 5,894 6,891 7,110 8,004Current Liabilities 1,241 1,191 1,604 1,610 1,963Financial Debt 1,286 2,054 2,824 2,766 3,054Total Liabilities 2,121 3,528 4,324 4,285 4,864Minority Interest 7 9 12 12 12Shareholders Equity 2,130 2,366 2,567 2,825 3,140Total Liabilities + Equity 4,250 5,894 6,891 7,110 8,004EBITDA / Fin. Expenses -9.1 -3.6 -4.1 -4.7 -4.9Financial Debt /EBITDA 2.3 2.7 4.1 3.5 3.4Financial Debt /Equity 0.6 0.9 1.1 1.0 1.0ROAE 16.5% 16.4% 12.5% 13.0% 14.1%ROAA 8.3% 7.3% 4.8% 5.0% 5.6%ROIC 10.5% 9.7% 7.8% 8.8% 9.1%
PEN mn 2012 2013 2014E 2015E 2016EInitial Cash 111 496 93 96 285Cash from Operations 203 40 -24 646 361CAPEX -224 -88 -86 -307 -567Changes in Financial Debt 775 768 770 -58 287Div idends (Paid) Received -162 -103 -103 -92 -105Other CFI & CFF Items -207 -1,020 -554 0 0Changes in Equity 0 0 0 0 0Final Cash 496 93 96 285 261Change in Cash 385 -403 3 189 -24
Romero Group 45%
Pension Funds 31%
Inv. & MutualFunds 11%
Others 13%
Consumer Goods
57%
B2B Branded Products
24%
Animal Nutrition
18%
90

Colombia Industry:
RetailRating:
HoldAlmacenes ÉxitoCompetition challenging positive macro
Christopher DiSalvatore+(562) 2446 1724
Investment Thesis Stock Data
• After a 7% correction since our last update, we are upgradingour recommendation to Hold. Though underlying consumptiontrends should remain strong in Colombia heading into 2015, webelieve valuations provide little room for further upside andincreasing competition may limit margin expansion in the near term.
• Competitive environment underlying our conservative marginexpectations. Our lower gross margins expectations despite growthin complementary businesses reflect a competitive pricingenvironment for retail looking forward. Moreover, competition hasstrengthened in the informal market, which we estimate has gainedshare in 2014. Flat EBITDA margins in the near term also reflect ourview that cost efficiencies in retail risk being offset by continuedinvestments primarily in omni-channel and real estate segments.
• Risks to our thesis: Upside risks include a more aggressive capexplan, including further M&A announcements. Also, limited options forinvestors to expose themselves to consumption in Colombia couldcontinue to drive valuations upwards. Downside risks includeincreased competition and a less dynamic macro scenario.
Price Chart (CLP) and Volumes (USD mn)
Valuation• Premium valuation reflecting strong macro tailwinds and
uniqueness quality in Colombia. On a relative front, shares arenow trading at a 26% premium versus regional peers, despite lowerthan expected EPS growth through 2016 (7.8% versus 22%; 14%ex. InRetail); however, after adjusting for a change in accounting toIFRS, shares are trading at a 2015E P/E of 21x or in line Latam foodcomps. On a 2015e EV/EBITDA basis, shares are trading in linewith peers.
Valuation Summary
P/E 12M Forward FV/EBITDA 12M Forward Relative Valuation
Andean Equities Guide, 2015 91
Ticker ex ito cbPrice (COP$) 29,800LTM Range 33,200 - 25,0802015E Target (COP$) 32,800Total Return 11.7%Market Cap (USD mn) 6,528Shares Outstanding (mn) 448Free Float 45%ADTV (USD mn) 2.5
0
20
40
60
80
100
70
80
90
100
110
Oct-13 Jan-14 Apr-14 Jul-14 Oct-14
USD
mn
Éx ito COLCAP
2013 2014E 2015E 2016EFV/EBITDA 14.4 11.4 10.2 9.3 P/E 30.6 29.1 26.5 23.6 PEG 3.4 3.3 2.3 1.8 P/BV 1.7 1.6 1.6 1.5 Div . Yield 1.7% 1.6% 1.6% 1.8%
Walmex
Cencosud
Falabella
Ex ito
InRetailSoriana
ComerciChedraui
10131619222528
8 10 12 14
P / E
2015
E
EV / EBITDA 2015E
5
10
15
20
Oct-08 Oct-10 Oct-12 Oct-1410152025303540
Oct-08 Oct-10 Oct-12 Oct-14

Almacenes ÉxitoCompany Description
Almacenes Éxito is the largest retailer in Colombia with over 528 totalstores, totaling 839,733 m2 of retail space. The company operates under 3primary banners in Colombia and 3 primary banners in Uruguay, all with afocus on food retail. The company, also offers financial service products,operates a real estate division, other financial services, and e-commerce.
Ownership Income Statement
Group Sales by Category Balance Sheet
Sales space by Country (ltm)
Cash Flow
Management
CEO: Carlos Mario GiraldoCFO: Filipe DaSilvaIR Manager: Maria Fernanda Morenowww.grupoexito.com.co
Andean Equities Guide, 2015
COP bn 2012 2013 2014E 2015E 2016EInitial Cash 2,274 2,507 2,754 2,787 2,884Cash Flow From Operations 713 509 462 559 638CAPEX -472 -405 -501 -525 -541Changes in Financial Debt -70 25 6 13 12Div idends (Paid) Received 146 227 209 219 240Taxes -84 -109 -143 -169 -189Changes in Shareholders Equity 0 0 0 0 0Final Cash 2,507 2,754 2,787 2,884 3,044Change in Cash Position 233 247 33 97 160Sources: Company Reports and Credicorp Capital; E Credicorp Capital Estimates
92
Casino Group 54.8%
Colombian Pension
Funds 19.8%
International Funds
14.9%
Other 7.6%
ADR Program
3.0%
Food 71.0%
Non-Food 29.0%
Colombia 90.5%
Uruguay 9.5%
COP bn 2012 2013 2014E 2015E 2016ERevenues 10,230 10,697 11,282 12,667 13,928EBIT 494 545 576 632 703EBITDA 859 932 982 1,088 1,203Net Income 475 438 459 504 566EPS 978,063 998,902 1,023,969 1,123,910 1,261,669EBIT Margin 4.8% 5.1% 5.1% 5.0% 5.0%EBITDA Margin 8.4% 8.7% 8.7% 8.6% 8.6%Net Margin 4.6% 4.1% 4.1% 4.0% 4.1%Sources: Company Reports and Credicorp Capital; E Credicorp Capital Estimates
COP bn 2012 2013 2014E 2015E 2016ECash & Equivalentes 2,507 2,754 2,787 2,884 3,044Total Current Assets 4,018 4,018 4,353 4,429 4,729Total Assets 10,322 10,785 11,079 11,576 12,093Current Liabilities 2,428 2,677 2,762 3,104 3,413Financial Debt 227 252 258 272 284Total Liabilities 2,717 2,910 2,995 3,337 3,646Minority Interest 14 14 11 12 12Shareholders Equity 7,592 7,861 8,110 8,395 8,720Total Liabilities + Equity 10,322 10,785 11,079 11,576 12,093EBITDA / Fin. Expenses 6.1 11.4 13.6 9.8 11.2Financial Debt /EBITDA 0.3 0.3 0.3 0.2 0.2Financial Debt /Equity 0.0 0.0 0.0 0.0 0.0ROAE 6.4% 5.7% 5.7% 6.1% 6.6%ROAA 4.1% 4.2% 4.2% 4.4% 4.8%ROIC 8.2% 8.2% 8.0% 8.3% 9.0%

6101418222630343842
Oct-05 Oct-08 Oct-11 Oct-143
5
7
9
11
13
Oct-05 Oct-08 Oct-11 Oct-14
2013 2014E 2015E 2016EFV/EBITDA 10.5 8.4 8.1 7.9P/E 22.7 28.2 32.6 28.0P/CF -6.4 26.8 15.7 16.3P/BV 2.3 1.9 1.9 1.9Div . Yield 3.6% 3.8% 2.5% 2.2%Sources: Company Reports and Credicorp Capital
Chile Industry: Rating:UperfAndina-B
Consolidation in Latam, yet to comeTomás Sanhueza+(562) 2446 1751
Investment Thesis Stock Data
• We are downgrading our recommendation of Andina-B toUnderperform and introducing our new 2015YE TP of CLP1,990. A weak macro scenario will likely continue to pressure thecompany’s results. Furthermore, Andina’s M&A activity in the regionled to higher levels of debt, which we expect will continue topressure profitability ratios.
• Andina’s consolidated volumes will be negatively impacted bythe economic deceleration in Chile, Argentina, and Brazil. Newtaxes on soft drinks should put additional pressure on volumes inChile; a possible increase in taxes for soft drinks in Brazil will likelyapply additional pressure to volumes in that market, as well.
• Andina’s consolidation strategy to acquire bottlers, such as KOPolar in Chile and Ipiranga in Brazil, will be challenging interms of the integration of operations. M&A activity led to higherlevels of debt, which should continue to pressure earnings (highfinancial expenses). We expect a NFD/EBITDA ratio of 3x in2014YE, above the 1.1x seen in 2012, before KO Polar’sacquisition.
• Risks to our thesis: Upside risk: i) faster consolidation of Brazil’soperation. Downside risk: i) further depreciation of Latam currenciesagainst USD, pressuring costs, ii) political instability in Argentina.
Price Chart (CLP) and Volumes (USD mn)
Valuation• Andina is trading at 32.6x P/E 2015E and 8.1x FV/EBITDA 2015E.
At these multiples, the stock is trading at a 42% premium to itshistorical average in P/E terms, reflecting expected pressures onearnings; shares trade at fair multiples in terms of EV/EBITDAcompared to its historical average.
• When compared to peers, Andina is trading at fair multiples interms of FV/EBITDA and at a premium in terms of P/E, which webelieve is not justified due to the company’s lack of earnings visibilitycompared to peers.
Valuation Summary
P/E 12M Forward FV/EBITDA 12M Forward Relative Valuation
Andean Equities Guide, 2015
Food & Beverages
0
10
20
30
40
0
20
40
60
80
100
120
Oct-13 Feb-14 Jun-14 Oct-14
USD
m
Andina B IPSA
Ticker / ADR andinab ci / ako/b usPrice (CLP) 1,887LTM Range (CLP) 1,862 - 2,925Target (CLP / USD) 1,990 (loc) / 21.1 (ADR)Total Return 8%Market Cap (USD mn) 2,820Shares Outstanding (mn) 473Free Float 50%ADTV (USD mn) 1.7 (loc) - 0.8 (ADR)
Femsa
Andina
Embonor
10
13
16
19
22
25
28
8 9 10 11 12
P / E
2015
E
EV / EBITDA 2015E
Coca-Cola Enterprises
Arca Continental
93
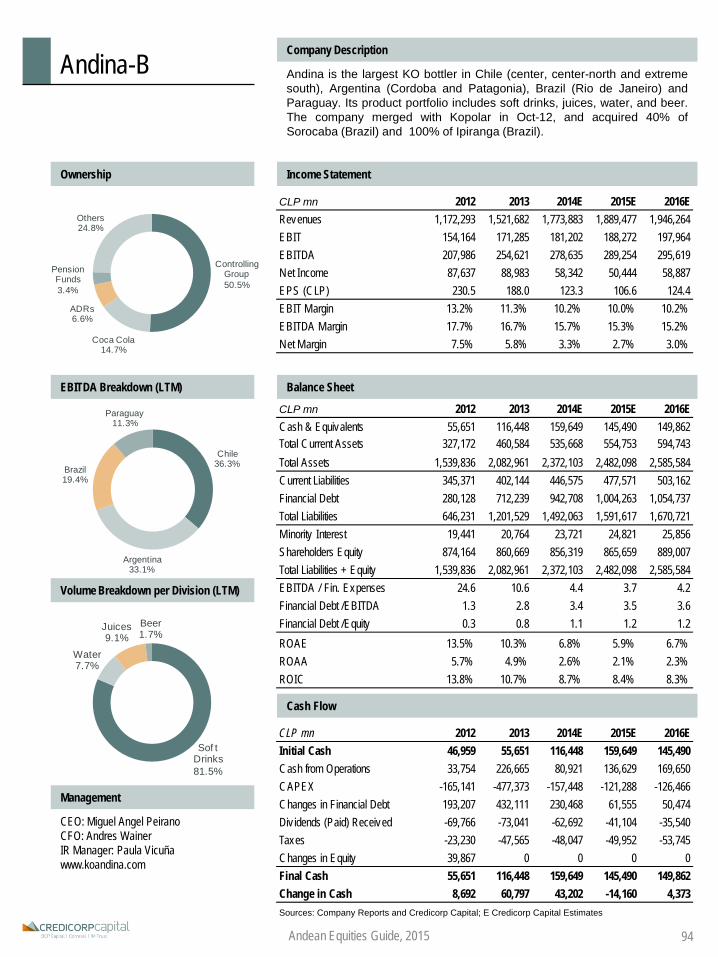
CLP mn 2012 2013 2014E 2015E 2016ECash & Equivalents 55,651 116,448 159,649 145,490 149,862Total Current Assets 327,172 460,584 535,668 554,753 594,743Total Assets 1,539,836 2,082,961 2,372,103 2,482,098 2,585,584Current Liabilities 345,371 402,144 446,575 477,571 503,162Financial Debt 280,128 712,239 942,708 1,004,263 1,054,737Total Liabilities 646,231 1,201,529 1,492,063 1,591,617 1,670,721Minority Interest 19,441 20,764 23,721 24,821 25,856Shareholders Equity 874,164 860,669 856,319 865,659 889,007Total Liabilities + Equity 1,539,836 2,082,961 2,372,103 2,482,098 2,585,584EBITDA / Fin. Expenses 24.6 10.6 4.4 3.7 4.2Financial Debt /EBITDA 1.3 2.8 3.4 3.5 3.6Financial Debt /Equity 0.3 0.8 1.1 1.2 1.2ROAE 13.5% 10.3% 6.8% 5.9% 6.7%ROAA 5.7% 4.9% 2.6% 2.1% 2.3%ROIC 13.8% 10.7% 8.7% 8.4% 8.3%
Andina-BCompany Description
Andina is the largest KO bottler in Chile (center, center-north and extremesouth), Argentina (Cordoba and Patagonia), Brazil (Rio de Janeiro) andParaguay. Its product portfolio includes soft drinks, juices, water, and beer.The company merged with Kopolar in Oct-12, and acquired 40% ofSorocaba (Brazil) and 100% of Ipiranga (Brazil).
Ownership Income Statement
EBITDA Breakdown (LTM) Balance Sheet
Volume Breakdown per Division (LTM)
Cash Flow
Management
CEO: Miguel Angel PeiranoCFO: Andres WainerIR Manager: Paula Vicuñawww.koandina.com
Andean Equities Guide, 2015
Controlling Group 50.5%
Coca Cola 14.7%
ADRs 6.6%
Pension Funds 3.4%
Others 24.8%
Chile 36.3%
Argentina 33.1%
Brazil 19.4%
Paraguay 11.3%
Sof t Drinks 81.5%
Water 7.7%
Juices 9.1%
Beer 1.7%
94
CLP mn 2012 2013 2014E 2015E 2016EInitial Cash 46,959 55,651 116,448 159,649 145,490Cash from Operations 33,754 226,665 80,921 136,629 169,650CAPEX -165,141 -477,373 -157,448 -121,288 -126,466Changes in Financial Debt 193,207 432,111 230,468 61,555 50,474Div idends (Paid) Received -69,766 -73,041 -62,692 -41,104 -35,540Taxes -23,230 -47,565 -48,047 -49,952 -53,745Changes in Equity 39,867 0 0 0 0Final Cash 55,651 116,448 159,649 145,490 149,862Change in Cash 8,692 60,797 43,202 -14,160 4,373Sources: Company Reports and Credicorp Capital; E Credicorp Capital Estimates
CLP mn 2012 2013 2014E 2015E 2016ERevenues 1,172,293 1,521,682 1,773,883 1,889,477 1,946,264EBIT 154,164 171,285 181,202 188,272 197,964EBITDA 207,986 254,621 278,635 289,254 295,619Net Income 87,637 88,983 58,342 50,444 58,887EPS (CLP) 230.5 188.0 123.3 106.6 124.4EBIT Margin 13.2% 11.3% 10.2% 10.0% 10.2%EBITDA Margin 17.7% 16.7% 15.7% 15.3% 15.2%Net Margin 7.5% 5.8% 3.3% 2.7% 3.0%

2013 2014E 2015E 2016EFV/EBITDA 12.4 5.7 11.5 4.3P/E 797.5 9.0 62.8 6.0P/CF nm 2.9 nm nmP/BV 1.1 1.0 1.0 0.9Div . Yield 9.5% 4.4% 4.4% 8.9%Sources: Company Reports and Credicorp Capital
Peru Industry: Rating:HoldAustral
Finding anchovyIvan Bogarin
+(511) 4163333 – Ext 33055 [email protected]
Investment Thesis Stock Data
• We are downgrading our recommendation to HOLD from BUY,and updating our 2015YETP to 2.40 (2014YETP PEN 3.00). Weare reducing our TP due to a worse-than-expected outlook due toclimatic risks, such as the El Niño phenomenon and a the stock’slow liquidity (ADTV USD 0.03 mn),
• “El Niño” phenomenon in 2015 remains as the most importantrisk. As seen in 2014, an increase in sea temperatures reduces theavailability of anchovy. Our base-case scenario includes a severeimpact from El Niño Phenomenon, a lower anchovy quota in the 2ndfishing season of 2014 (0.8 mn MT).
• Strong cash flow generation, results in a high dividend yield (4.5%for 2014 and 2015) despite years of quota reductions (-68% in 2nd
season of 2012). Austral is one of the companies with the highestdividend yield in Peru, limiting downside risk.
• Risks to our thesis: A reduction of biomass or global quota ofanchovy in 2015. Presence of adverse climatic phenomena such asEl Niño (Last severe: 1998). Significant reduction in prices offishmeal or fish oil drive by Chinese demand. M&A Activity could beboosted after negative news on “El Niño”.
Price Chart (PEN) and Volumes (USD mn)
Valuation• We value shares using a DCF model with a 10-year projection
horizon. We apply a 10% discount for illiquidity based on domesticstock market characteristics. We use a long term fishmeal price ofUSD 1,500/MT (Current USD 1,763/MT) and long term fish oil priceof USD 2,000/MT (Current USD 2,304/MT).
• A respective 2015 P/E and FV/EBITDA ratio of 64.6x and 11.7x arebased mainly on a -85.6% earnings decrease due to a lower quotavolume during the second season 2014.
Valuation Summary
P/E 12M Forward FV/EBITDA 12M Forward Relative Valuation
Andean Equities Guide, 2015
Fishing
95
0
10
20
30
40
50
Oct-05 Oct-08 Oct-11 Oct-140
5
10
15
20
25
Oct-05 Oct-08 Oct-11 Oct-14
Ticker austrac1 pePrice (PEN) 2.25LTM Range (PEN) 2.03 - 2.53Target (PEN) 2.40Total Return 11%Market Cap (USD mn) 201Shares Outstanding (mn) 259Free Float 11%ADTV (USD mn) 0.03
0.0
0.5
1.0
1.5
2.0
80
90
100
110
120
Oct-13 Feb-14 Jun-14 Oct-14
USD
m
Austral IGBVL
Oceana Group
Leroy Seafood GroupAker ASA-A
Austral
Grieg Seafood
-100
10203040506070
4 9 14
P/E
2015
E
FV/EBITDA 2015E

AustralCompany Description
Austral Group is a subsidiary of the Norwegian Austevoll Seafood. Australis the fifth largest producer of fishmeal and fish oil in Peru. The company'sfleet is composed of 22 vessels and it has four factories along the coast ofPeru, two of them additionally produce canned products and frozen fish.
Ownership Income Statement
Revenue Breakdown by Unit (2015) Balance Sheet
Revenues by Destination (LTM)
Cash Flow
Management
CEO: Adriana Carmen Giudicie AlvaCFO: Andrew Darkwww.austral.com.pe
Andean Equities Guide, 2015
PEN mn 2012 2013 2014E 2015E 2016ECash & Equivalents 11 20 75 54 101Total Current Assets 234 326 281 427 429Total Assets 965 1,093 1,018 1,167 1,252Current Liabilities 105 304 226 347 365Financial Debt 169 348 281 383 432Total Liabilities 338 515 428 594 634Minority Interest 0 0 0 0 0Shareholders Equity 627 577 590 573 618Total Liabilities + Equity 965 1,093 1,018 1,167 1,252EBITDA / Fin. Expenses -15.1 -3.2 -16.7 -5.8 -11.8Financial Debt /EBITDA 1.1 4.4 1.8 4.9 2.1Financial Debt /Equity 0.3 0.6 0.5 0.7 0.7ROAE 10.7% 0.1% 11.0% 1.6% 16.2%ROAA 7.0% 0.1% 6.1% 0.8% 8.0%ROIC 8.6% 1.6% 9.0% 2.1% 11.5%
PEN mn 2012 2013 2014E 2015E 2016EInitial Cash 8 11 20 75 54Cash from Operations 196 -30 178 -39 194CAPEX -46 -129 -54 -58 -145Changes in Financial Debt -104 179 -68 102 49Div idends (Paid) Received -78 -52 -26 -26 -52Other CFI & CFF Items 35 40 25 0 0Changes in Equity 0 0 0 0 0Final Cash 11 20 75 54 101Change in Cash 3 9 55 -21 46
PEN mn 2012 2013 2014E 2015E 2016ERevenues 677 546 548 545 750EBIT 97 21 103 27 155EBITDA 156 79 156 77 209Net Income 67 1 64 9 96EPS (PEN) 0.26 0.00 0.25 0.04 0.37EBIT Margin 14.3% 3.9% 18.7% 4.9% 20.7%EBITDA Margin 23.0% 14.5% 28.5% 14.2% 27.8%Net Margin 9.9% 0.1% 11.7% 1.7% 12.9%
Dordogne
Holdings 89%
Others 11%
Local market
9%
Exports 91%
Indirect Human
Consumption 83%
Direct Human
Consumption 17%
96
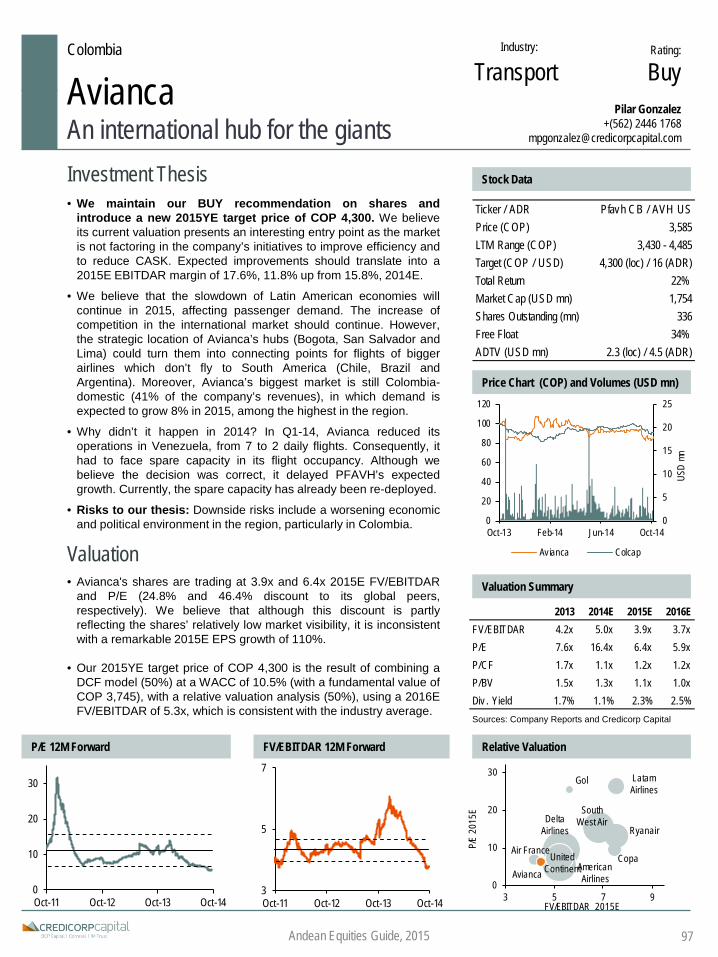
Colombia Industry: Rating:
BuyAviancaAn international hub for the giants
Pilar Gonzalez+(562) 2446 1768
Investment Thesis Stock Data
• We maintain our BUY recommendation on shares andintroduce a new 2015YE target price of COP 4,300. We believeits current valuation presents an interesting entry point as the marketis not factoring in the company’s initiatives to improve efficiency andto reduce CASK. Expected improvements should translate into a2015E EBITDAR margin of 17.6%, 11.8% up from 15.8%, 2014E.
• We believe that the slowdown of Latin American economies willcontinue in 2015, affecting passenger demand. The increase ofcompetition in the international market should continue. However,the strategic location of Avianca’s hubs (Bogota, San Salvador andLima) could turn them into connecting points for flights of biggerairlines which don’t fly to South America (Chile, Brazil andArgentina). Moreover, Avianca’s biggest market is still Colombia-domestic (41% of the company’s revenues), in which demand isexpected to grow 8% in 2015, among the highest in the region.
• Why didn’t it happen in 2014? In Q1-14, Avianca reduced itsoperations in Venezuela, from 7 to 2 daily flights. Consequently, ithad to face spare capacity in its flight occupancy. Although webelieve the decision was correct, it delayed PFAVH’s expectedgrowth. Currently, the spare capacity has already been re-deployed.
• Risks to our thesis: Downside risks include a worsening economicand political environment in the region, particularly in Colombia.
Price Chart (COP) and Volumes (USD mn)
Valuation• Avianca's shares are trading at 3.9x and 6.4x 2015E FV/EBITDAR
and P/E (24.8% and 46.4% discount to its global peers,respectively). We believe that although this discount is partlyreflecting the shares’ relatively low market visibility, it is inconsistentwith a remarkable 2015E EPS growth of 110%.
• Our 2015YE target price of COP 4,300 is the result of combining aDCF model (50%) at a WACC of 10.5% (with a fundamental value ofCOP 3,745), with a relative valuation analysis (50%), using a 2016EFV/EBITDAR of 5.3x, which is consistent with the industry average.
Valuation Summary
P/E 12M Forward FV/EBITDAR 12M Forward Relative Valuation
Andean Equities Guide, 2015
Transport
0
5
10
15
20
25
0
20
40
60
80
100
120
Oct-13 Feb-14 Jun-14 Oct-14
USD
mn
Av ianca Colcap
Latam Airlines
Gol
Copa
Delta Airlines
American Airlines
South West Air
United Continent
Ryanair
Air France
Avianca 0
10
20
30
3 5 7 9
P/E
2015
E
FV/EBITDAR 2015E0
10
20
30
Oct-11 Oct-12 Oct-13 Oct-143
5
7
Oct-11 Oct-12 Oct-13 Oct-14
97
Ticker / ADR Pfavh CB / AVH USPrice (COP) 3,585LTM Range (COP) 3,430 - 4,485Target (COP / USD) 4,300 (loc) / 16 (ADR)Total Return 22%Market Cap (USD mn) 1,754Shares Outstanding (mn) 336Free Float 34%ADTV (USD mn) 2.3 (loc) / 4.5 (ADR)
2013 2014E 2015E 2016EFV/EBITDAR 4.2x 5.0x 3.9x 3.7xP/E 7.6x 16.4x 6.4x 5.9xP/CF 1.7x 1.1x 1.2x 1.2xP/BV 1.5x 1.3x 1.1x 1.0xDiv . Yield 1.7% 1.1% 2.3% 2.5%Sources: Company Reports and Credicorp Capital

AviancaCompany Description
Avianca Holdings owns and operates airlines, offers scheduled airpassenger and cargo transportation services within Colombia, CentralAmerica, North America, South America and Europe. The holding is theparent company of Avianca, Tampa Cargo SA, Aerogal and TACA groupcompanies, Aerotaxis La Costeña Nicaragua, and ISLEÑA.
Ownership Income Statement
Revenue breakdown by region (LTM) Balance Sheet
ASK breakdown by Region (LTM)
Cash Flow
Management
Andean Equities Guide, 2015
CEO: Fabio Villegas RamírezCFO: Gerardo GrajalesIR Manager: Andrés Felipe Ruiz Vesgawww. aviancaholdings.com
Sy nergy 52%
ADS Shares 19%
Kingsland 14%
Float 14%
Colombia 41%
S. America (excl.
Colombia) 24%
C. America & Caribian
14%
N. America 3%
Others 7%
Colombia 21%
Rest of the world 79%
98
USD mn 2012 2013 2014E 2015E 2016ERevenues 4,259 4,610 4,763 5,359 5,731EBIT 270 386 251 403 426EBITDAR 648 829 751 945 1,005Net Income 24 250 107 273 298EPS (COP) 89 441 186 475 518EBIT Margin 6.3% 8.4% 5.3% 7.5% 7.4%EBITDAR Margin 15.2% 18.0% 15.8% 17.6% 17.5%Net Margin 0.6% 5.4% 2.2% 5.1% 5.2%
USD mn 2012 2013 2014E 2015E 2016ECash & Equivalents 403 736 619 750 802Total Current Assets 880 1,295 1,205 1,382 1,472Total Assets 4,321 5,179 5,797 6,378 6,771Current Liabilities 1,531 1,658 1,754 1,893 2,007Financial Debt 3,040 2,265 2,674 2,880 2,902Total Liabilities 3,569 3,964 4,471 4,820 4,959Minority Interest 13 6 7 8 8Shareholders Equity 739 1,208 1,319 1,551 1,804Total Liabilities + Equity 4,321 5,179 5,797 6,378 6,771EBITDAR / Fin. Expenses 9.8 8.1 5.2 13.8 13.7Financial Debt /EBITDAR 4.7 2.7 3.6 3.0 2.9Financial Debt /Equity 4.1 1.9 2.0 1.9 1.6ROAE 3.3% 25.7% 8.5% 19.0% 17.8%ROAA 0.6% 5.3% 1.9% 4.5% 4.5%ROIC 6.9% 11.7% 9.7% 11.1% 11.0%
USD mn 2012 2013 2014E 2015E 2016EInitial Cash 289 403 736 619 750Cash from Operations 195 1,409 416 647 672CAPEX -300.8 -400 -912 -608 -532Changes in Financial Debt 312 -775 408 206 22Div idends (Paid) Received -32 -38 -20 -41 -45Taxes -50 -46 -9 -73 -65Changes in Equity -10 183 0 0 0Final Cash 403 736 619 750 802Change in Cash 114 333 -116 131 52Sources: Company Reports and Credicorp Capital; E Credicorp Capital Estimates

Colombia Industry:
BanksRating:
UperfBanco de BogotáCautious on liquidity and overhang
Juan Dominguez+(571) 339 4400 Ext 1026
Investment Thesis Stock Data
• We are maintaining our UNDERPERFORM rating on the sharesbased on liquidity and overhang risk. The ADTV of Banco deBogotá decreased materially from more than USD 1mn in 2013 toaround USD 0.4mn in 2014. With these low traded volumes,multiples require a considerable discount compared to Grupo Aval,which is not the case at current metrics. Also, the overhang from theannounced issuance of COP 1.5 tn (dilution of 7%, probably to belaunched in 4Q14) in the local equity market will weigh in ROAE inthe short to mid term. Besides, most of this issuance will besubscribed by current shareholders, lowering the free-float,translating into an additional negative impact on liquidity.
• Fundamental trends remain strong. In our pre-money model, weexpect ROAE to improve from 14.4% in 2014E to 16.2% in 2016E,as a result of better efficiency and slight positive pressures on NIM.Bogotá is the most effective bank in cost control strategies; the cost-to-income ratio could decline to 49% in the long-term. As aconsequence, Bogotá should outperform peers in the long run.
• Risks to our thesis. Potential mergers within the banks of GrupoAval are a risk, and thus, in the absence of material discounts ofBogotá compared to the HoldCo, we are favoring PfAval. Other risksinclude issues preventing a successful integration of the acquiredassets in Guatemala and Panama.
Valuation• Our new 2015E target price is based on a pre-money DDM using
a Ke of 12.7% in COP terms and an exit P/B of 1.8x. To reach ourT.P. at COP 71,000, we discounted the DDM for dilution/overhang.Our T.P. implies a 10.9x 2016E P/E and 1.9x 2015E P/B. Sharesare trading at 12.2x 2015E P/E, higher than the more liquidBancolombia and Davivienda. In terms of BV, Bogotá and GrupoAval are trading similarly, despite the lower liquidity of Bogotá. Lastbut not least, its PEG ratio at 1.3x does not look attractive.
Price Chart (COP) and Volumes (USD mn)
Valuation Summary
P/B 12M Forward P/E 12M Forward Relative Valuation
Andean Equities Guide, 2015
2013 2014E 2015E 2016EP/E 14.9 14.4 12.2 10.7P/BV 2.2 2.0 1.8 1.6ROAE 15.8% 14.4% 15.6% 16.2%Div . Yield 3.2% 3.5% 3.6% 3.5%Sources: Company Reports and Credicorp Capital
0
1
2
3
4
5
70
80
90
100
110
Oct-13 Feb-14 Jun-14 Oct-14
USD
mn
Bogota COLCAP
1.5
1.7
1.9
2.1
2.3
Oct-11 Oct-12 Oct-13 Oct-148
10
12
14
16
18
Oct-11 Oct-12 Oct-13 Oct-14
Banco de Chile
Santander Chile
Corpbanca
DaviviendaBancolombia
Grupo AvalBogota
1.01.21.41.61.82.02.22.42.62.8
12% 14% 16% 18% 20% 22% 24%
2015
E P/
B
2015E ROAE
99
Ticker bogota cbPrice (COP) 69,440LTM Range (COP) 64,220 - 73,500Target 71,000Total Return 6%Market Cap (USD mn) 10,447Shares Outstanding (mn) 307Free Float 12%ADTV (USD mn) 0.5
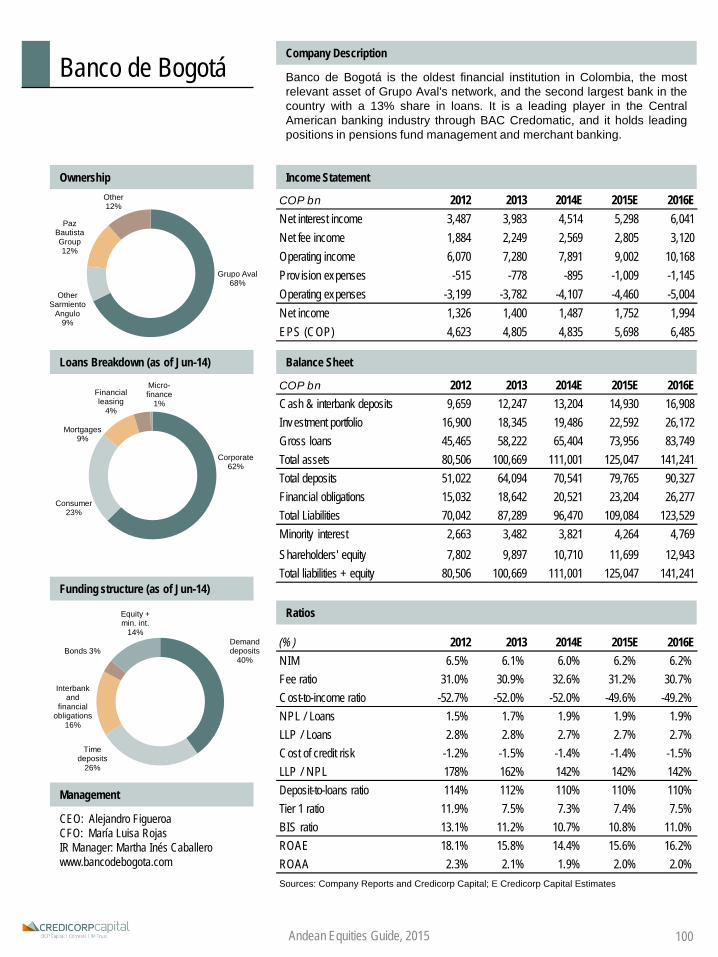
Banco de BogotáCompany Description
Banco de Bogotá is the oldest financial institution in Colombia, the mostrelevant asset of Grupo Aval's network, and the second largest bank in thecountry with a 13% share in loans. It is a leading player in the CentralAmerican banking industry through BAC Credomatic, and it holds leadingpositions in pensions fund management and merchant banking.
Ownership Income Statement
Loans Breakdown (as of Jun-14) Balance Sheet
Funding structure (as of Jun-14)
Ratios
Management
CEO: Alejandro FigueroaCFO: María Luisa RojasIR Manager: Martha Inés Caballerowww.bancodebogota.com
Andean Equities Guide, 2015
Grupo Aval68%
Other Sarmiento
Angulo9%
Paz Bautista Group12%
Other12%
Corporate62%
Consumer23%
Mortgages9%
Financial leasing
4%
Micro-finance
1%
Demand deposits
40%
Time deposits
26%
Interbank and
financial obligations
16%
Bonds 3%
Equity + min. int.
14%(%) 2012 2013 2014E 2015E 2016ENIM 6.5% 6.1% 6.0% 6.2% 6.2%Fee ratio 31.0% 30.9% 32.6% 31.2% 30.7%Cost-to-income ratio -52.7% -52.0% -52.0% -49.6% -49.2%NPL / Loans 1.5% 1.7% 1.9% 1.9% 1.9%LLP / Loans 2.8% 2.8% 2.7% 2.7% 2.7%Cost of credit risk -1.2% -1.5% -1.4% -1.4% -1.5%LLP / NPL 178% 162% 142% 142% 142%Deposit-to-loans ratio 114% 112% 110% 110% 110%Tier 1 ratio 11.9% 7.5% 7.3% 7.4% 7.5%BIS ratio 13.1% 11.2% 10.7% 10.8% 11.0%ROAE 18.1% 15.8% 14.4% 15.6% 16.2%ROAA 2.3% 2.1% 1.9% 2.0% 2.0%Sources: Company Reports and Credicorp Capital; E Credicorp Capital Estimates
COP bn 2012 2013 2014E 2015E 2016ENet interest income 3,487 3,983 4,514 5,298 6,041Net fee income 1,884 2,249 2,569 2,805 3,120Operating income 6,070 7,280 7,891 9,002 10,168Prov ision expenses -515 -778 -895 -1,009 -1,145Operating expenses -3,199 -3,782 -4,107 -4,460 -5,004Net income 1,326 1,400 1,487 1,752 1,994EPS (COP) 4,623 4,805 4,835 5,698 6,485
COP bn 2012 2013 2014E 2015E 2016ECash & interbank deposits 9,659 12,247 13,204 14,930 16,908Investment portfolio 16,900 18,345 19,486 22,592 26,172Gross loans 45,465 58,222 65,404 73,956 83,749Total assets 80,506 100,669 111,001 125,047 141,241Total deposits 51,022 64,094 70,541 79,765 90,327Financial obligations 15,032 18,642 20,521 23,204 26,277Total Liabilities 70,042 87,289 96,470 109,084 123,529Minority interest 2,663 3,482 3,821 4,264 4,769Shareholders' equity 7,802 9,897 10,710 11,699 12,943Total liabilities + equity 80,506 100,669 111,001 125,047 141,241
100

Chile Industry:
BanksRating:BuyBanco de Chile
A bank playing defenseJuan Dominguez
+(571) 339 4400 Ext 1026 [email protected]
Investment Thesis Stock Data
• We remain constructive on Banco de Chile, as its strongfundamentals make it a defensive play. Several topics are attractive:i) the cost of funding is low, the bank is the leader in demanddeposits, international credit ratings are the best in the region, andfunding is diversified and atomized; ii) despite increases in 2014 dueto lower business activity, NPL ratios are materially lower than theindustry (1.2% vs. 2.1% as of Aug-14), and are covered almost 2xwith allowances, signaling conservative risk management; iii)attractive dividend yield; iv) cost control culture reflects on healthycost-to-income ratios; v) ROAE is the highest in our coverage. Thenegative: loan growth has slowed more than among peers.
• A high ROAE, but with pressures. The tax reform, regulatorychanges, and a potential increase in effective tax rate post debtrepayment with BCCh will pressure ROAE; however, the robuststrategy towards funding diversification, brand development, andselective loan growth should provide for an outperformance versusregional peers. We expect ROAE to fall to 22% in the long-run.
• Risks to our thesis: Downside risks include further increases inNPL ratios and deceleration in credit demand. As we mentionedbefore, Banco de Chile’s loan growth has slowed significantly. Also,the high payout ratio expose investors to recurrent dilution(dividends and capital increases).
Valuation• Our new 2015E target price is based on a 10-year DDM
valuation using a Ke of 11.3% in CLP terms and an exit P/B of 2.6x.Our T.P. at CLP 86 implies a 13.4x 2016E P/E and 3.1x 2015E P/B.Although shares trade at a slightly higher 2015E P/E (11.6x)compared to Santander, they trade fair compared to history.Further, shares are trading at a discounted EVA-adjusted P/Bcompared to regional peers. However, PEG ratio is not attractive.
Price Chart (CLP) and Volumes (USD mn)
Valuation Summary
P/E 12M Forward P/E 12M Forward Relative Valuation
Andean Equities Guide, 2015
01020304050607080
80
85
90
95
100
105
110
Oct-13 Feb-14 Jun-14 Oct-14
USD
mn
Chile IPSA
Ticker chile ci / bch usPrice (CLP) 69.9LTM Range (CLP) 64.8 - 76.6Target 86.0 (loc) - 89.0 (ADR)Total Return 28%Market Cap (USD mn) 11,349Shares Outstanding (mn) 94,655Free Float 25%ADTV (USD mn) 9.0 (loc) - 4.6 (ADR)
2013 2014E 2015E 2016EP/E 13.8 11.5 11.6 10.9P/B 3.1 2.7 2.5 2.4ROAE 23.9% 24.4% 23.0% 22.9%Div . Yield 4.5% 4.9% 5.4% 5.4%Sources: Company Reports and Credicorp Capital
101

Banco de ChileCompany Description
Banco de Chile is a full service financial institution offering credit productsand services across all segments of the Chilean financial market. Today,Banco de Chile competes with Santander the leadership in the bankingindustry in Chile by loan size with USD 38 bn and 18% market share. Thebank is the most profitable amongst its large peers. As a consequence ofthe merger with Citibank Chile in 2008, the controlling company is LQIF(50% Quiñenco -Luksic group-, 50% Citigroup).
Ownership Income Statement
Loans Breakdown (as of Jun-14) Balance Sheet
Funding structure (as of Jun-14)
Ratios
Management
CEO: Arturo TagleCFO: Pedro SamhanIR Manager: Pablo Mejíawww.bancochile.cl
Andean Equities Guide, 2015
(%) 2012 2013 2014E 2015E 2016ENIM 4.7% 4.7% 5.0% 5.0% 5.0%Fee ratio 22.0% 19.7% 16.8% 17.2% 17.2%Cost-to-income ratio -46.5% -42.8% -41.3% -42.3% -42.3%NPL / Loans 1.0% 1.1% 1.3% 1.2% 1.2%LLP / Loans 2.3% 2.3% 2.5% 2.5% 2.5%Cost of credit risk -1.0% -1.2% -1.3% -1.2% -1.2%LLP / NPL 235% 203% 195% 206% 206%Deposit-to-loans ratio 77% 76% 75% 75% 75%Tier 1 ratio 9.7% 9.9% 10.3% 10.2% 10.0%BIS ratio 13.2% 13.1% 13.3% 13.2% 13.0%ROAE 25.0% 23.9% 24.4% 23.0% 22.9%ROAA 2.1% 2.1% 2.2% 2.1% 2.0%Sources: Company Reports and Credicorp Capital; E Credicorp Capital Estimates
LQIF51%
Other indirect
18%
Ergas6%
Free-float25%
Individuals & SMEs47%
Consumer Finance
4%
Companies28%
Corporations19%
Demand deposits
26%
Time deposits
and saving accounts
40%
Interbank and
financial obligations
4%
Bonds 20%
Equity + min. int.
10%
CLP bn 2012 2013 2014E 2015E 2016ENet interest income 953 1,059 1,211 1,284 1,415Net fee income 293 287 270 291 321Operating income 1,327 1,456 1,608 1,689 1,861Prov ision expenses -188 -242 -287 -284 -314Operating expenses -617 -623 -664 -715 -787Net income 468 514 576 586 635EPS (CLP) 5.33 5.53 6.08 6.05 6.42
CLP bn 2012 2013 2014E 2015E 2016ECash & interbank deposits 1,082 1,248 1,230 1,349 1,496Investment portfolio 1,836 2,541 2,576 2,813 3,072Gross loans 18,762 20,870 22,190 24,341 26,991Total assets 23,261 25,934 27,036 29,635 32,805Total deposits 15,084 16,387 16,876 18,511 20,527Financial obligations 4,545 5,567 5,963 6,541 7,253Total Liabilities 21,254 23,650 24,593 26,977 29,915Minority interest 0 0 0 0 0Shareholders' equity 2,007 2,284 2,442 2,658 2,890Total liabilities + equity 23,261 25,934 27,036 29,635 32,805
102

Colombia Industry:
BanksRating:
HoldBancolombiaA new speech towards profitability
Juan Dominguez+(571) 339 4400 Ext 1026
Investment Thesis Stock Data
• After adjusting EPS to included the proposed tax reform, weare downgrading Bancolombia to HOLD while setting a new2015YE T.P. of COP 33,200 (from COP 35,000). Valuation metricsare incorporating an adequate capital structure following theinjection in 1Q14, and renewed management efforts to improveefficiency. After the strong organic and inorganic expansion in thelast 5 years, management has shifted its strategy from growingaggressively to improving efficiency and profitability. This change infocus could be a positive catalyst, should management deliversuccessfully.
• These efforts on efficiency and a slight increase in NIM fromthe hikes in policy rate in Colombia during 2014 will expandROAE. ROAE should improve to 13.7% in 2014 from 12.6% in 2013.Furthermore, efficiency efforts should lower the cost-to-income ratiofrom 60% in 2013 to 52% in the long run, generating a long-termROAE of 16%. Nonetheless, Bancolombia will keepunderperforming its peers in terms of profitability and efficiency,despite its leading position in the market.
• Risks to our thesis. Downside risks include lower-than-expecteddeliveries in efficiency and challenges from the integration ofBanistmo. The latter is demanding opex in order to improve qualityof service and to migrate IT systems to Colombia (currently inMexico through a contract with HSBC).
Valuation• Our 2015E target price is based on a DDM using a Ke of 12.4% in
COP terms and an exit P/B of 1.6x. Our T.P. at COP 33,200 impliesa 12.1x 2016E P/E and 1.8x 2015E P/B. Shares are trading at11.7x 2015E P/E, a significant adjustment after including tax(11x pre-reform). PEG ratio (using 2014-2016 growth) stands at0.9x. Given our expected trend on ROAE, forward P/B ratios seemneutral.
Price Chart (COP) and Volumes (USD mn)
Valuation Summary
P/B 12M Forward P/E 12M Forward Relative Valuation
Andean Equities Guide, 2015
0
1
2
3
4
5
Oct-02 Oct-06 Oct-10 Oct-140
5
10
15
20
Oct-02 Oct-06 Oct-10 Oct-14
01020304050607080
70
80
90
100
110
120
Oct-13 Feb-14 Jun-14 Oct-14
US
D m
n
PfBancolombia COLCAP
Banco de Chile
Davivienda
Santander Chile
Corpbanca
BogotaGrupo Aval
Bancolombia
1.01.21.41.61.82.02.22.42.62.8
12% 14% 16% 18% 20% 22% 24%
2015
E P/
B
2015E ROAE
103
2013 2014E 2015E 2016EP/E 13.2 14.0 11.7 10.4P/BV 1.6 1.7 1.5 1.4ROAE 12.6% 13.7% 13.8% 14.1%Div . Yield 3.2% 2.7% 2.9% 3.4%Sources: Company Reports and Credicorp Capital
Ticker pfbcolo cb / cib usPrice (COP) 28,720LTM Range (COP) 22,100 - 31,000Target 33,200 (loc) / 65.0 (ADR)Total Return 18%Market Cap (USD mn) 13,302Shares Outstanding (mn) 962Free Float 70%ADTV (USD mn) 10.1 (loc) - 19.3 (ADR)

BancolombiaCompany Description
Bancolombia is the second largest financial conglomerate in Colombia,offering a wide range of financial products and services to its individual andcorporate client base. In Colombia, the Group has a 25% market share inloans. The bank also has presence in Panama (Banistmo), in El Salvador(Banagrícola), and in Guatemala (non-controlling stake in Agromercantil).Its major shareholder is Grupo Suramericana, holding with leadingcompanies in insurance, asset management and banking.
Ownership Income Statement
Loans Breakdown (as of Jun-14) Balance Sheet
Funding structure (as of Jun-14)
Ratios
Management
CEO: Carlos Raúl YepesCFO: José Humberto AcostaIR Manager: Alejandro Mejía /
Simón Boterowww.grupobancolombia.com.co
Andean Equities Guide, 2015
Grupo Sura27%
Grupo Argos
3%
ADR Program
20%
Local pension funds21%
Other internat.
15%
Other local15%
Corporate59%
Consumer18%
Mortgages12%
Financial leasing
11%
Micro-finance
1%
Demand deposits
41%
Time deposits
27%
Interbank and
financial obligations
10%
Bonds10%
Equity + min. int.
13%(%) 2012 2013 2014E 2015E 2016ENIM 6.4% 5.5% 5.7% 6.0% 6.0%Fee ratio 24.4% 24.7% 23.6% 22.7% 21.8%Cost-to-income ratio -56.2% -59.7% -56.7% -54.3% -54.1%NPL / Loans 1.8% 1.8% 1.9% 1.9% 1.9%LLP / Loans 4.6% 4.5% 4.5% 4.5% 4.5%Cost of credit risk -1.7% -1.5% -1.4% -1.5% -1.5%LLP / NPL 265% 249% 243% 243% 243%Deposit-to-loans ratio 95% 101% 99% 99% 99%Tier 1 ratio 10.4% 5.8% 8.5% 8.5% 8.6%BIS ratio 15.8% 10.6% 12.8% 12.8% 12.9%ROAE 16.5% 12.6% 13.7% 13.8% 14.1%ROAA 1.9% 1.3% 1.5% 1.6% 1.6%Sources: Company Reports and Credicorp Capital; E Credicorp Capital Estimates
COP bn 2012 2013 2014E 2015E 2016ENet interest income 4,767 5,009 6,115 7,214 8,155Net fee income 1,807 1,916 2,210 2,450 2,634Operating income 7,407 7,765 9,360 10,807 12,065Prov ision expenses -1,111 -1,231 -1,342 -1,632 -1,842Operating expenses -4,162 -4,639 -5,306 -5,866 -6,527Net income 1,702 1,515 1,970 2,367 2,644EPS (COP) 1,998 1,779 2,048 2,461 2,749
COP bn 2012 2013 2014E 2015E 2016ECash & interbank deposits 8,169 15,409 11,726 13,241 14,924Investment portfolio 12,554 13,806 17,285 19,607 22,160Gross loans 69,989 89,460 98,995 111,788 125,997Total assets 97,916 130,816 140,784 158,387 177,883Total deposits 64,159 86,557 94,243 106,422 119,950Financial obligations 17,899 26,572 23,799 26,874 30,290Total Liabilities 86,228 117,878 123,959 139,978 157,771Minority interest 81 445 473 478 483Shareholders' equity 11,607 12,493 16,353 17,932 19,629Total liabilities + equity 97,916 130,816 140,784 158,387 177,883
104

4
8
12
16
20
24
28
Oct-05 Oct-08 Oct-11 Oct-144
6
8
10
12
14
16
Oct-05 Oct-08 Oct-11 Oct-14
Chile Industry: Rating:BuyBanmedica
A healthy player in LatamTomás Sanhueza+(562) 2446 1751
Investment Thesis Stock Data
• We are maintaining our Buy recommendation on Banmedica,introducing our new 2015YE TP of CLP 1,170 and dropping our2014 TP of 1,150. We believe Banmedica is the best vehicle to gainexposure to the healthcare sector in the region, as it is highlyexposed to health providers and insurance in Colombia and Peru,with a clear diversification strategy.
• Banmedica has focused on strengthening its inpatient andoutpatient providers, locally and internationally, leaving themless exposed to regulatory changes; we believe changes in theinsurance business should be more moderate than expected. Thecompany has an investment plan of USD 300mn between 2014-2018, mainly focused on capacity increases (Santa Maria, Davila,Vespucio, VidaIntegra in Chile and La Colina in Colombia).
• Banmedica has an extensive and proven track record inmanaging healthcare businesses in the region. We believe thecompany will continue to show growth, especially in the internationalsegment, supported by a strong balance sheet and above averageprofitability ratios versus peers.
• Risks to our thesis: Upside risk: i) pre-agreement with Pacifico inPeru, ii) M&A target. Downside risk: i) strong regulatory changes tothe insurance business, ii) low traded volumes in shares.
Price Chart (CLP) and Volumes (USD mn)
Valuation• In terms of forward multiples, Banmedica is trading at an 11.9%
discount in terms of P/E and a 9.5% discount in terms of FV/EBITDAcompared to its 5-year historical average.
• Banmedica is trading at fair multiples when compared to its peers,ex. Cruz Blanca, which trades at a 22% premium in terms of P/E.For this reason, we believe Banmedica is an attractive M&A target inChile and the regional healthcare sector. Bupa Sanitas acquisition ofCruz Blanca suggests that Banmedica could be the next M&Atarget.
Valuation Summary
P/E 12M Forward FV/EBITDA 12M Forward Relative Valuation
UNH
Cruz Blanca
Fleury
DASA
11
13
15
17
19
21
6 7 8 9 10 11
P / E
2015
E
EV / EBITDA 2015E
Andean Equities Guide, 2015
Health Services
Banmedica
Sonic Healthcare
2013 2014E 2015E 2016EFV/EBITDA 11.0 10.2 9.3 8.3P/E 18.0 16.5 14.8 13.0P/CF 16.0 17.7 13.6 13.2P/BV 4.3 3.7 3.4 3.0Div . Yield 3.7% 3.3% 4.1% 4.5%Sources: Company Reports and Credicorp Capital
Ticker banmed ciPrice (CLP) 975LTM Range (CLP) 870 - 1,032Target (CLP) 1,170Total Return 24%Market Cap (USD mn) 1,345Shares Outstanding (mn) 805Free Float 43%ADTV (USD mn) 0.3
01234567
70
80
90
100
110
120
Oct-13 Feb-14 Jun-14 Oct-14
USD
m
Banmedica IPSA
105
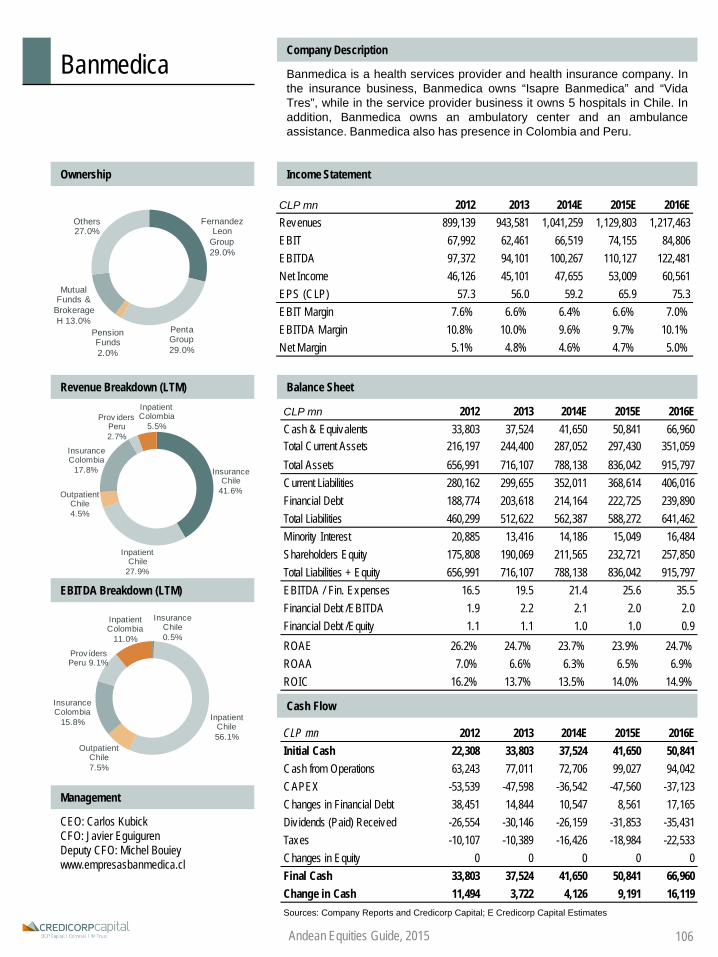
CLP mn 2012 2013 2014E 2015E 2016ECash & Equivalents 33,803 37,524 41,650 50,841 66,960Total Current Assets 216,197 244,400 287,052 297,430 351,059Total Assets 656,991 716,107 788,138 836,042 915,797Current Liabilities 280,162 299,655 352,011 368,614 406,016Financial Debt 188,774 203,618 214,164 222,725 239,890Total Liabilities 460,299 512,622 562,387 588,272 641,462Minority Interest 20,885 13,416 14,186 15,049 16,484Shareholders Equity 175,808 190,069 211,565 232,721 257,850Total Liabilities + Equity 656,991 716,107 788,138 836,042 915,797EBITDA / Fin. Expenses 16.5 19.5 21.4 25.6 35.5Financial Debt /EBITDA 1.9 2.2 2.1 2.0 2.0Financial Debt /Equity 1.1 1.1 1.0 1.0 0.9ROAE 26.2% 24.7% 23.7% 23.9% 24.7%ROAA 7.0% 6.6% 6.3% 6.5% 6.9%ROIC 16.2% 13.7% 13.5% 14.0% 14.9%
BanmedicaCompany Description
Banmedica is a health services provider and health insurance company. Inthe insurance business, Banmedica owns “Isapre Banmedica” and “VidaTres”, while in the service provider business it owns 5 hospitals in Chile. Inaddition, Banmedica owns an ambulatory center and an ambulanceassistance. Banmedica also has presence in Colombia and Peru.
Ownership Income Statement
Revenue Breakdown (LTM) Balance Sheet
EBITDA Breakdown (LTM)
Cash Flow
Management
CEO: Carlos KubickCFO: Javier EguigurenDeputy CFO: Michel Bouieywww.empresasbanmedica.cl
Andean Equities Guide, 2015 106
CLP mn 2012 2013 2014E 2015E 2016EInitial Cash 22,308 33,803 37,524 41,650 50,841Cash from Operations 63,243 77,011 72,706 99,027 94,042CAPEX -53,539 -47,598 -36,542 -47,560 -37,123Changes in Financial Debt 38,451 14,844 10,547 8,561 17,165Div idends (Paid) Received -26,554 -30,146 -26,159 -31,853 -35,431Taxes -10,107 -10,389 -16,426 -18,984 -22,533Changes in Equity 0 0 0 0 0Final Cash 33,803 37,524 41,650 50,841 66,960Change in Cash 11,494 3,722 4,126 9,191 16,119Sources: Company Reports and Credicorp Capital; E Credicorp Capital Estimates
CLP mn 2012 2013 2014E 2015E 2016ERevenues 899,139 943,581 1,041,259 1,129,803 1,217,463EBIT 67,992 62,461 66,519 74,155 84,806EBITDA 97,372 94,101 100,267 110,127 122,481Net Income 46,126 45,101 47,655 53,009 60,561EPS (CLP) 57.3 56.0 59.2 65.9 75.3EBIT Margin 7.6% 6.6% 6.4% 6.6% 7.0%EBITDA Margin 10.8% 10.0% 9.6% 9.7% 10.1%Net Margin 5.1% 4.8% 4.6% 4.7% 5.0%
Fernandez Leon
Group 29.0%
Penta Group 29.0%
Pension Funds 2.0%
Mutual Funds &
Brokerage H 13.0%
Others 27.0%
Insurance Chile
41.6%
Inpatient Chile
27.9%
Outpatient Chile 4.5%
Insurance Colombia
17.8%
Prov iders Peru 2.7%
Inpatient Colombia
5.5%
Insurance Chile 0.5%
Inpatient Chile 56.1%
Outpatient Chile 7.5%
Insurance Colombia
15.8%
Prov iders Peru 9.1%
Inpatient Colombia
11.0%

2013 2014E 2015E 2016EFV/EBITDA 17.9 13.4 9.8 7.7P/E 25.5 30.4 21.7 16.2P/CF nm nm 9.8 nmP/BV 1.8 1.2 1.2 1.1Div . Yield 1.2% 1.0% 1.4% 1.9%Sources: Company Reports and Credicorp Capital
SalfacorpICA
Carso
Conconcreto
Obrascon
KBR
Fluor
Jacobs
Granite
Besalco
6
11
16
21
26
0 5 10 15
P/E
2015
E
FV/EBITDA 2015E
Chile Industry: Rating:
HoldBesalcoPilar Gonzalez
+(562) 2446 1768 [email protected]
Investment Thesis Stock Data
• We maintain our HOLD recommendation on shares andintroduce a new, 2015E target price of CLP 464, implying a totalreturn of 19%. Despite the slowdown in the Chilean economy andthe company’s weak results during this year, most of the currentnon-profitable contracts will expire by December 2014 and weexpect the company to negotiate under more new market conditions.
• Besalco’s earnings were pressured by fixed costs in its currentcontracts, which were heavily impacted by increasing labor costsand inflation; however, we expect new contracts to be negotiatedwith more favorable cost conditions.
• On the other hand, we expect the company to sell one of itshydroelectric plants next year, which should amount to USD 100mn.We expect the proceeds of this sale to be used to pre-payoutstanding debt, helping to bring net debt/Ebitda down to 5.6x in2016. Additionally, we like the company’s diversification in energyand machinery businesses, together representing 90% of LTMEBITDA.
• However, we are concerned with Besalco’s decrease in returns, aswe expect ROAE to fall to 5.6% in 2015, compared to 15% in 2012.Profitability has been affected by higher capex and lower margins.
• Risks to our thesis: Further economic slowdown and potentialimpact of labor reform due to high exposure to labor costs.
Price Chart (CLP) and Volumes (USD mn)
Valuation• Our 2015E target price of CLP 464 is based on a 10-year, DCF
valuation using a WACC of 10.28% in nominal CLP terms. Valuationdoes not look attractive at all, although shares are trading at 25%and 24% discount to its historical average, respectively.
• At 2015E EV/EBITDA of 9.8x and P/E of 21.7x, shares are trading ata 24% and 67% respective premium to regional peers. However, weexpect an operational improvement from 2015 onwards due to thenegotiation of the new contracts, driving more attractive multiples.We argue Besalco is more of a 2H15 story.
Valuation Summary
P/E 12M Forward FV/EBITDA 12M Forward Relative Valuation
Andean Equities Guide, 2015
Cement & Construction
New contracts; fresh air
0
1
2
3
4
40
60
80
100
Oct-13 Feb-14 Jun-14 Oct-14
USD
mn
Besalco IPSA
0
10
20
30
Oct/05 Oct/08 Oct/11 Oct/140
20
40
60
Oct/05 Oct/08 Oct/11 Oct/14
Ticker besalco ciPrice (CLP) 395LTM Range (CLP) 362 - 779Target (CLP) 464Total Return 19%Market Cap (USD mn) 386Shares Outstanding (mn) 569Free Float 32%ADTV (USD mn) 0.4
107
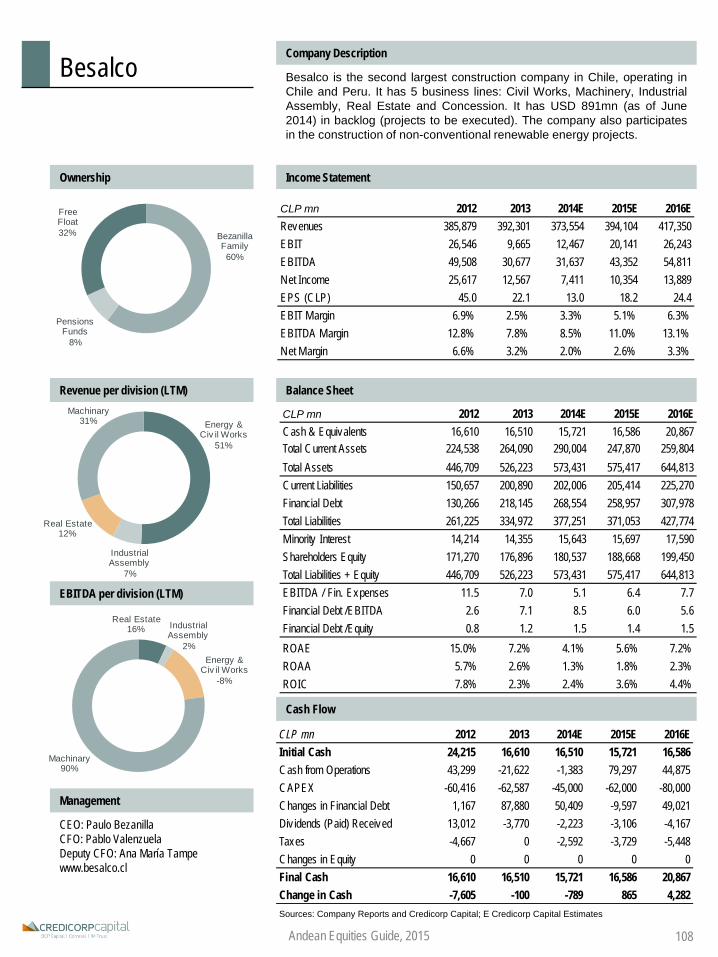
BesalcoCompany Description
Besalco is the second largest construction company in Chile, operating inChile and Peru. It has 5 business lines: Civil Works, Machinery, IndustrialAssembly, Real Estate and Concession. It has USD 891mn (as of June2014) in backlog (projects to be executed). The company also participatesin the construction of non-conventional renewable energy projects.
Ownership Income Statement
Revenue per division (LTM) Balance Sheet
EBITDA per division (LTM)
Cash Flow
Management
CEO: Paulo BezanillaCFO: Pablo ValenzuelaDeputy CFO: Ana María Tampewww.besalco.cl
Andean Equities Guide, 2015
CLP mn 2012 2013 2014E 2015E 2016ERevenues 385,879 392,301 373,554 394,104 417,350EBIT 26,546 9,665 12,467 20,141 26,243EBITDA 49,508 30,677 31,637 43,352 54,811Net Income 25,617 12,567 7,411 10,354 13,889EPS (CLP) 45.0 22.1 13.0 18.2 24.4EBIT Margin 6.9% 2.5% 3.3% 5.1% 6.3%EBITDA Margin 12.8% 7.8% 8.5% 11.0% 13.1%Net Margin 6.6% 3.2% 2.0% 2.6% 3.3%
CLP mn 2012 2013 2014E 2015E 2016ECash & Equivalents 16,610 16,510 15,721 16,586 20,867Total Current Assets 224,538 264,090 290,004 247,870 259,804Total Assets 446,709 526,223 573,431 575,417 644,813Current Liabilities 150,657 200,890 202,006 205,414 225,270Financial Debt 130,266 218,145 268,554 258,957 307,978Total Liabilities 261,225 334,972 377,251 371,053 427,774Minority Interest 14,214 14,355 15,643 15,697 17,590Shareholders Equity 171,270 176,896 180,537 188,668 199,450Total Liabilities + Equity 446,709 526,223 573,431 575,417 644,813EBITDA / Fin. Expenses 11.5 7.0 5.1 6.4 7.7Financial Debt /EBITDA 2.6 7.1 8.5 6.0 5.6Financial Debt /Equity 0.8 1.2 1.5 1.4 1.5ROAE 15.0% 7.2% 4.1% 5.6% 7.2%ROAA 5.7% 2.6% 1.3% 1.8% 2.3%ROIC 7.8% 2.3% 2.4% 3.6% 4.4%
CLP mn 2012 2013 2014E 2015E 2016EInitial Cash 24,215 16,610 16,510 15,721 16,586Cash from Operations 43,299 -21,622 -1,383 79,297 44,875CAPEX -60,416 -62,587 -45,000 -62,000 -80,000Changes in Financial Debt 1,167 87,880 50,409 -9,597 49,021Div idends (Paid) Received 13,012 -3,770 -2,223 -3,106 -4,167Taxes -4,667 0 -2,592 -3,729 -5,448Changes in Equity 0 0 0 0 0Final Cash 16,610 16,510 15,721 16,586 20,867Change in Cash -7,605 -100 -789 865 4,282Sources: Company Reports and Credicorp Capital; E Credicorp Capital Estimates
Bezanilla Family 60%
Pensions Funds
8%
Free Float32%
Energy & Civ il Works
51%
Industrial Assembly
7%
Real Estate 12%
Machinary31%
Energy & Civ il Works
-8%
Industrial Assembly
2%
Real Estate 16%
Machinary90%
108

2013 2014E 2015E 2016EFV/EBITDA 4.2 7.0 6.7 9.4P/E nm 25.1 24.6 17.6P/CF 1.0 0.2 0.1 0.1P/BV 0.8 0.8 0.7 0.7Div . Yield 0.4% 0.5% 0.6% 0.6%Sources: Company Reports and Credicorp Capital
Peru Industry:
MiningRating:
HoldBuenaventuraIs it reaching the golden tipping point?
Héctor Collantes+(511) 416 3333 Ext 33052
Investment Thesis Stock Data
• 2015YE TP is reduced to USD 12.90, but still a HOLD. We aretaking Conga out of our numbers, but the decrease in TP is partiallyoffset by output increases from expanding operations.
• Conga’s capex is under review (USD3.5bn target) and the “waterfirst” approach is still on. However, the public’s opposition evidentin the reelection of dissenter Gregorio Santos in Cajamarcaadds an extra layer of complexity to Conga’s development.Yanacocha’s continuation beyond 2018 is still unclear.
• Buenaventura’s direct production has improved. Uchucchacuais reaping the benefits of the Rio Seco plant to reach 12.9mn oz Ag(+9% y/y) and Orcopampa has stabilized at 200,000 oz Au. Brocal’sand Cerro Verde’s expansions will boost Zn and Cu production.
• Early stage projects could be transformational. Tambomayocould bring 150,000 oz Au (35% of BVN’s direct production) in 2016.Chucapaca, offers similar expectations towards 2018 and TrapicheCu potential could be unlocked via a SPV looking for a JV partner.
• Risks to our thesis: Yanacocha may develop successfully otheroptions for extending its life of mine, cost control may slip again.
Price Chart (USD) and Volumes (USD mn)
Valuation• Our DCF considers 8 years, factoring in the life of mine in reserves
for the precious metals operations. We add the participation of the31 years DCF for Cerro Verde and in situ value of developmentprojects.
• Low FV/EBITDA multiples seem to acknowledge BVN’s relativelyshort life of mine in reserves. High P/E is affected by 1H14 and 2013losses.
Valuation Summary
P/E 12M Forward FV/EBITDA 12M Forward Relative Valuation
Andean Equities Guide, 2015 109
Ticker / ADR buenavc1 pe / bvn usPrice (USD) 11.16LTM Range (USD) 9.95 - 14.70Target (USD) 38.80 (loc) / 12.90 (ADR)Total Return 16%Market Cap (USD mn) 3,076Shares Outstanding (mn) 275Free Float 73%ADTV (USD mn) 0.03 (loc) / 23.8 (ADR)
0
20
40
60
80
100
60708090
100110120130
Oct-13 Feb-14 Jun-14 Oct-14
USD
m
BVN IGBVL
05
10152025303540
Oct-05 Oct-08 Oct-11 Oct-1405
10152025303540
Oct-05 Oct-08 Oct-11 Oct-14
Barrick Gold
Newmont
Agnico -Eagle Mines
Goldcorp
Yamana Gold
BVN
05
10152025303540
0 5 10 15
P/E
2015
E
FV/EBITDA 2015E

USD mn 2012 2013 2014E 2015E 2016ECash & Equivalents 187 24 122 262 414Total Current Assets 803 495 573 735 928Total Assets 4,587 4,498 4,593 4,737 4,911Current Liabilities 350 335 316 330 330Financial Debt 179 179 179 179 179Total Liabilities 624 609 582 601 601Minority Interest 262 0 0 0 0Shareholders Equity 3,701 3,889 4,011 4,136 4,311Total Liabilities + Equity 4,587 4,498 4,593 4,737 4,911EBITDA / Fin. Expenses 1,203 792 394 62 333 Financial Debt /EBITDA 0.1 0.2 0.3 0.3 0.5Financial Debt /Equity 0.0 0.0 0.0 0.0 0.0ROAE 18.5% nm 3.1% 3.1% 4.1%ROAA 14.9% nm 2.7% 2.7% 3.6%ROIC 2.1% 3.1% 1.7% 1.5% 4.4%
BuenaventuraCompany Description
Buenaventura ranks among the largest publicly listed precious metalsmining companies in Latin America. The company has a 43.65% stake inYanacocha (gold, JV with Newmont); 19.58% in Cerro Verde (copper, JVwith Freeport McMoRan) and 53.78% in El Brocal (copper, zinc). Thecompany has been listed on the NYSE since 1996.
Ownership Income Statement
Revenue Breakdown by Metal (YTD) Balance Sheet
EBITDA Breakdown by company (YTD)
Cash Flow
Management
CEO: Roque BenavidesCFO: Carlos GálvezIR Manager: Daniel Domínguezwww.buenaventura.pe
Andean Equities Guide, 2015
Inst Invest 56%
Bena vides
Family 27%
Peruvian Pension Funds
8%
Others 9%
Gold 45%
Silver 29%
Copper 21%
Lead 3%
Zinc 2%
BVN Direct 54%
Yana cocha
7%
Cerro Verde 30%
Tantahuatay 9%
USD mn 2012 2013 2014E 2015E 2016ERevenues 1,564 1,285 1,219 1,292 1,425EBIT 418 132 75 80 194EBITDA 1,439 813 512 534 379Net Income 685 -74 123 125 175EPS (USD) 2.69 -0.40 0.27 0.45 0.63EBIT Margin 26.7% 10.3% 6.2% 6.2% 13.6%EBITDA Margin 92.0% 63.3% 42.0% 41.4% 26.6%Net Margin 43.8% -5.8% 10.1% 9.7% 12.3%
110
USD mn 2012 2013 2014E 2015E 2016EInitial Cash 187 187 24 122 262Cash from Operations 303 222 308 306 319CAPEX 0 -385 -210 -166 -166Changes in Financial Debt 73 0 0 0 0Div idends (Paid) Received -155 -43 -16 -20 -20Financial&Investing, others -221 43 16 20 20Changes in Equity 0 0 0 0 0Final Cash 187 24 122 262 414Change in Cash 0 -163 98 140 152Sources: Company Reports and Credicorp Capital; E Credicorp Capital Estimates

Colombia Industry:
FinancialsRating:
HoldBVCCautious on key growth drivers
Sebastián Gallego+(571) 3394400 Ext. 1594
Investment Thesis Stock Data
• Cash is king. Under the current business model, the company’sgeneration of free cash flow stands out. Furthermore, our estimatessuggest that this trend will continue in upcoming years. Low CAPEXneeds at least in the short term (8% - 12% of revenues) as well asEBITDA margins above 40% support our view. Furthermore, weconsider current ROIC levels above 16% (vs. a cost of capital of9.14%) and an expected dividend yield above 6% to be attractive.
• BVC is a monopoly and the entrance of a new player will not beeasy. The company appears as the only multi-product exchangewith presence in the entire value chain of the Colombian capitalmarket. Beyond high capital requirements to enter the market, wealso see barriers to entry in terms of ownership structure. Topbrokerage firms are current shareholders of BVC and this may atleast delay the entrance of a potential new player.
• Valuation offers modest upside given the lack of positivecatalysts. The lack of visibility in terms of volume growth and newissuers coming to the market has a negative effect on valuation.Improvements in quality and infrastructure of the market could be apositive game changer.
• Risks to our thesis. Lower trading volumes, fee structure, the newtax reform, commissions of pension funds, and shares’ liquidity.
Price Chart and Volumes (USD mn)
Valuation• Our 2015E T.P of COP 24.2 is based on a 10-year DCF model,
using a 9.14% WACC (COP-nominal) and a 4% perpetuity growthrate. We highlight that we do not consider any increase in the feestructure of the trading segment before 2017.
• Our T.P implies a P/E 15E and EV/EBITDA 15E of 16.9x and 10.7x(16.4x and 10.8x from peers), respectively. Upside on a relativevaluation basis seems limited given lower growth on EPS relative topeers and skepticism regarding further margin expansion inupcoming years.
Valuation Summary
P/E 12M Forward FV/EBITDA 12M Forward Relative Valuation
Andean Equities Guide, 2015
10
14
18
22
26
30
Jan-12 Sep-12 May-13 Jan-14 Sep-141012141618202224
Jan-12 Sep-12 May-13 Jan-14 Sep-14
BM&F Bovespa
Singapore Nasdaq
NYSE
CME
Detsche Boerse
Malaysia
BVC
05
101520253035
8 10 12 14 16 18
P/E
2015
E
EV/EBITDA 2015E
0
1
2
3
4
5
6
60
70
80
90
100
110
120
Oct-13 Feb-14 Jun-14 Oct-14
USD
mn
BVC Colcap
111
2013 2014E 2015E 2016EEV/EBITDA 11.3 10.6 10.0 9.5P/E 17.9 15.1 15.6 14.9P/BV 3.9 3.8 3.8 3.7Div Yield 6.3% 6.3% 6.3% 6.1%Sources: Company Reports and Credicorp Capital
Ticker bvc cb Price (COP) 22.4LTM Range (COP) 18.73 - 25.23Target 24.2Total Return 15%Market Cap (USD mn) 204Shares Outstanding 18,673Free Float 87.4%ADTV (USD mn) 0.4
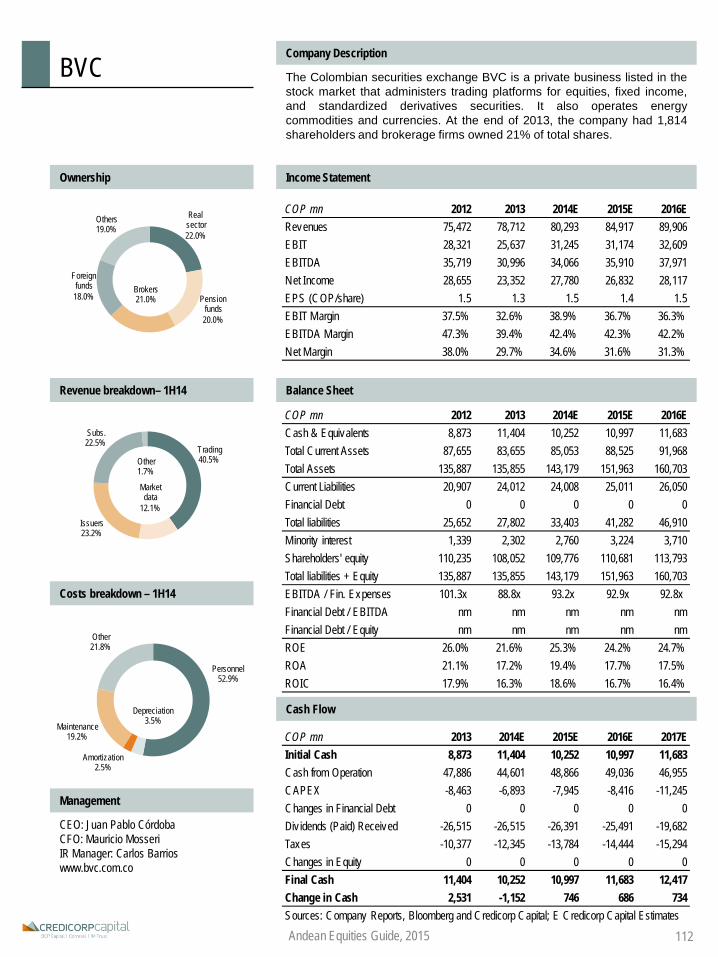
COP mn 2012 2013 2014E 2015E 2016ECash & Equivalents 8,873 11,404 10,252 10,997 11,683Total Current Assets 87,655 83,655 85,053 88,525 91,968Total Assets 135,887 135,855 143,179 151,963 160,703Current Liabilities 20,907 24,012 24,008 25,011 26,050Financial Debt 0 0 0 0 0Total liabilities 25,652 27,802 33,403 41,282 46,910Minority interest 1,339 2,302 2,760 3,224 3,710Shareholders' equity 110,235 108,052 109,776 110,681 113,793Total liabilities + Equity 135,887 135,855 143,179 151,963 160,703EBITDA / Fin. Expenses 101.3x 88.8x 93.2x 92.9x 92.8xFinancial Debt / EBITDA nm nm nm nm nmFinancial Debt / Equity nm nm nm nm nmROE 26.0% 21.6% 25.3% 24.2% 24.7%ROA 21.1% 17.2% 19.4% 17.7% 17.5%ROIC 17.9% 16.3% 18.6% 16.7% 16.4%
BVCCompany Description
The Colombian securities exchange BVC is a private business listed in thestock market that administers trading platforms for equities, fixed income,and standardized derivatives securities. It also operates energycommodities and currencies. At the end of 2013, the company had 1,814shareholders and brokerage firms owned 21% of total shares.
Ownership Income Statement
Revenue breakdown– 1H14 Balance Sheet
Costs breakdown – 1H14
Cash Flow
Management
CEO: Juan Pablo CórdobaCFO: Mauricio MosseriIR Manager: Carlos Barrioswww.bvc.com.co
Andean Equities Guide, 2015 112
COP mn 2012 2013 2014E 2015E 2016ERevenues 75,472 78,712 80,293 84,917 89,906EBIT 28,321 25,637 31,245 31,174 32,609EBITDA 35,719 30,996 34,066 35,910 37,971Net Income 28,655 23,352 27,780 26,832 28,117EPS (COP/share) 1.5 1.3 1.5 1.4 1.5EBIT Margin 37.5% 32.6% 38.9% 36.7% 36.3%EBITDA Margin 47.3% 39.4% 42.4% 42.3% 42.2%Net Margin 38.0% 29.7% 34.6% 31.6% 31.3%
COP mn 2013 2014E 2015E 2016E 2017EInitial Cash 8,873 11,404 10,252 10,997 11,683Cash from Operation 47,886 44,601 48,866 49,036 46,955CAPEX -8,463 -6,893 -7,945 -8,416 -11,245Changes in Financial Debt 0 0 0 0 0Div idends (Paid) Received -26,515 -26,515 -26,391 -25,491 -19,682Taxes -10,377 -12,345 -13,784 -14,444 -15,294Changes in Equity 0 0 0 0 0Final Cash 11,404 10,252 10,997 11,683 12,417Change in Cash 2,531 -1,152 746 686 734Sources: Company Reports, Bloomberg and Credicorp Capital; E Credicorp Capital Estimates
Trading40.5%
Market data
12.1%Issuers23.2%
Subs.22.5%
Other1.7%
Real sector22.0%
Pension funds20.0%
Brokers21.0%
Foreign funds18.0%
Others19.0%
Personnel52.9%
Depreciation3.5%
Amortization2.5%
Maintenance19.2%
Other21.8%
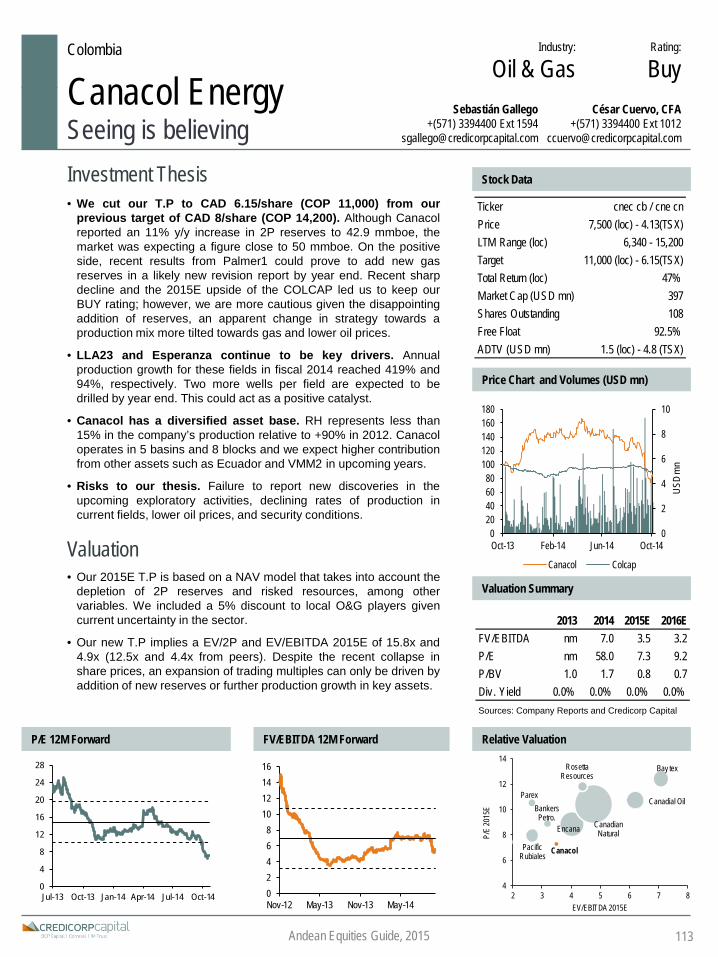
Colombia Industry:
Oil & Gas Rating:
BuyCanacol EnergySeeing is believing
César Cuervo, CFA+(571) 3394400 Ext 1012
Investment Thesis Stock Data
• We cut our T.P to CAD 6.15/share (COP 11,000) from ourprevious target of CAD 8/share (COP 14,200). Although Canacolreported an 11% y/y increase in 2P reserves to 42.9 mmboe, themarket was expecting a figure close to 50 mmboe. On the positiveside, recent results from Palmer1 could prove to add new gasreserves in a likely new revision report by year end. Recent sharpdecline and the 2015E upside of the COLCAP led us to keep ourBUY rating; however, we are more cautious given the disappointingaddition of reserves, an apparent change in strategy towards aproduction mix more tilted towards gas and lower oil prices.
• LLA23 and Esperanza continue to be key drivers. Annualproduction growth for these fields in fiscal 2014 reached 419% and94%, respectively. Two more wells per field are expected to bedrilled by year end. This could act as a positive catalyst.
• Canacol has a diversified asset base. RH represents less than15% in the company’s production relative to +90% in 2012. Canacoloperates in 5 basins and 8 blocks and we expect higher contributionfrom other assets such as Ecuador and VMM2 in upcoming years.
• Risks to our thesis. Failure to report new discoveries in theupcoming exploratory activities, declining rates of production incurrent fields, lower oil prices, and security conditions.
Price Chart and Volumes (USD mn)
Valuation• Our 2015E T.P is based on a NAV model that takes into account the
depletion of 2P reserves and risked resources, among othervariables. We included a 5% discount to local O&G players givencurrent uncertainty in the sector.
• Our new T.P implies a EV/2P and EV/EBITDA 2015E of 15.8x and4.9x (12.5x and 4.4x from peers). Despite the recent collapse inshare prices, an expansion of trading multiples can only be driven byaddition of new reserves or further production growth in key assets.
Valuation Summary
P/E 12M Forward FV/EBITDA 12M Forward Relative Valuation
Canadial Oil
Encana Canadian Natural
Bay tex
Bankers Petro.
Rosetta Resources
Pacific Rubiales Canacol
Parex
4
6
8
10
12
14
2 3 4 5 6 7 8
P/E
2015
E
EV/EBITDA 2015E
Andean Equities Guide, 2015
0
4
8
12
16
20
24
28
Jul-13 Oct-13 Jan-14 Apr-14 Jul-14 Oct-14 02468
10121416
Nov-12 May-13 Nov-13 May-14
0
2
4
6
8
10
020406080
100120140160180
Oct-13 Feb-14 Jun-14 Oct-14
USD
mn
Canacol Colcap
Sebastián Gallego+(571) 3394400 Ext 1594
113
2013 2014 2015E 2016EFV/EBITDA nm 7.0 3.5 3.2P/E nm 58.0 7.3 9.2P/BV 1.0 1.7 0.8 0.7Div. Yield 0.0% 0.0% 0.0% 0.0%Sources: Company Reports and Credicorp Capital
Ticker cnec cb / cne cnPrice 7,500 (loc) - 4.13(TSX)LTM Range (loc) 6,340 - 15,200Target 11,000 (loc) - 6.15(TSX)Total Return (loc) 47%Market Cap (USD mn) 397Shares Outstanding 108Free Float 92.5%ADTV (USD mn) 1.5 (loc) - 4.8 (TSX)

Canacol EnergyCompany Description
Canacol Energy and its subsidiaries are primarily focused on the E&P of oil& gas in Colombia and Ecuador. The company also has non-strategicoperations in Brazil, Peru, and Guyana. The company's main producingasset is LLA23 (around 40% of the company's total production) which islocated in the Llanos basin in Colombia.
Ownership Income Statement
Oil & gas production – FY 2014 Balance Sheet
CAPEX per activity – FY 2014
Cash Flow
Management
CEO: Charle GambaCFO: George GramatkeIR Manager: Carolina Orozcowww.canacolenergy.com
Andean Equities Guide, 2015
CDS & CO (custody) 76.3%
Ingalls 1.1%
GDE Investments
1.1%
Guillermo Jara 1.1%
Others 20.4%
RH14.6%
LLA2340.6%
Esperanza 27.7%
Ecuador 13.3%
Others3.9%
Production 36%
Facilities6%Acquisitions
29%
Seismic9%
Others19%
114
USD mn 2012 2013 2014 2015E 2016ERevenues 185 139 211 250 277EBIT 17 -65 70 87 86EBITDA 80 -18 108 137 152Net Income 24 -128 10 56 47EPS (USD/share) 0.32 -1.71 0.11 0.52 0.44EBIT Margin 8.9% -46.6% 32.9% 34.7% 31.2%EBITDA Margin 43.5% -12.8% 51.2% 54.8% 54.8%Net Margin 13.0% -92.0% 4.7% 22.4% 17.0%
USD mn 2012 2013 2014 2015E 2016ECash & Equivalents 31 52 164 38 42Total Current Assets 86 114 252 136 150Total Assets 407 470 757 811 1,066Current Liabilities 65 43 164 123 304Financial Debt 53 156 211 201 201Total liabilities 116 230 356 326 506Minority interest 0 0 0 0 0Shareholder's equity 291 239 400 484 560Total liabilities + Equity 407 470 757 811 1,066EBITDA / Fin. Expenses 25.8x NA 11.2x 11.6x 5.9xFinancial Debt / EBITDA 0.7x NA 1.9x 1.5x 1.3xFinancial Debt / Equity 0.2x 0.7x 0.5x 0.4x 0.4xROE 8.2% -53.4% 2.5% 11.5% 8.4%ROA 5.9% -27.2% 1.3% 6.9% 4.4%ROIC 3.2% -11.4% 3.4% 7.2% 6.5%
USD mn 2012 2013 2014 2015E 2016EInitial Cash 102 31 52 164 38Cash from Operation 13 -91 178 121 142CAPEX -166 -101 -241 -228 -308Changes in Financial Debt 22 103 54 -8 174Div idends (Paid) Received 0 0 0 0 0Taxes -11 42 -22 -40 -33Changes in Equity 71 68 142 28 29Final Cash 31 52 164 38 42Change in Cash -71 22 111 -126 4Sources: Company Reports, Bloomberg and Credicorp Capital; E Credicorp Capital Estimates

Chile Industry:
MiningRating:
HoldCAPThe end of the Iron Boom
Arturo Prado+(562) 2450 1688
Investment Thesis Stock Data
• We are introducing our new 2015YE T.P. of CLP 6,200 andmaintaining our Hold recommendation on shares. After therecent stock correction (-45%YTD), which reflects the decline iniron ore prices, multiples appear fair. During 2014, we have seenstrong growth of low-cost supply, a trend which we expect tocontinue, led by expansions in Australia and Brazil, adding 450mntons until 2017. We see this issue as a structural change in the ironore supply side; however, there is a significant part of the supply(25%) mainly from Chinese producers, which at these prices, areoperating with losses. Despite increasing closure of Chinese mines,we expect the upcoming lower cash cost supply to maintain iron oreprices at these levels for the coming years.
• The flat steel division (CSH) has continued to suffer from oversupplyin the market. During previous months, we have observed adownward trend in steel prices mainly due to lower raw materialprices (iron ore and coking coal), which has given some relief tosteel makers. Nevertheless, we believe most of this decrease in theprice of raw materials should be passed through to clients, so weexpect lower margins to continue during 2015.
• Risks to our thesis: i) higher/lower than expected iron-ore prices;ii) better/worse than expected performance of the Chinese economy.
Price Chart (CLP) and Volumes (USD mn)
Valuation• Our revised 2015E target price is based on a 10-year, SOTP DCF
valuation, considering a WACC of 10.4% in nominal (Iron ore 74%,Steel 22% and Steel Processing 4%), USD terms.
• The company is trading at 14.6x P/E 2015E and 6.0x FV/EBITDA2015E, at a discount when compared to 5 year averages. Howeverin our view, this is justified by the decline in profitability ratios, in linewith lower iron ore prices.
Valuation Summary
P/E 12M Forward FV/EBITDA 12M Forward Relative Valuation
Andean Equities Guide, 2015
2013 2014E 2015E 2016EFV/EBITDA 7.6 5.8 6.0 5.3P/E 15.5 13.2 14.6 11.1P/CF -11.0 -4.9 5.8 6.3P/BV 1.5 0.7 0.7 0.7Div . Yield 4.6% 6.4% 3.8% 3.4%Sources: Company Reports and Credicorp Capital
Ticker / ADR CAP ciPrice (CLP) 5,549LTM Range (CLP) 5,549 - 11,145Target (CLP) 6,200Total Return 16%Market Cap (USD mn) 1,421Shares Outstanding (mn) 149Free Float 69%ADTV (USD mn) 2.6
0
2
4
6
8
10
50
60
70
80
90
100
110
Oct-13 Feb-14 Jun-14 Oct-14
USD
m
CAP IPSA
0
10
20
30
40
50
Oct-02 Oct-05 Oct-08 Oct-11 Oct-1405
10152025303540
Oct-02 Oct-05 Oct-08 Oct-11 Oct-14
Vale
GerdauBHP
Rio
CAP
02468
1012141618
4 5 6 7
P/E
2015
E
FV/EBITDA 2015E
115
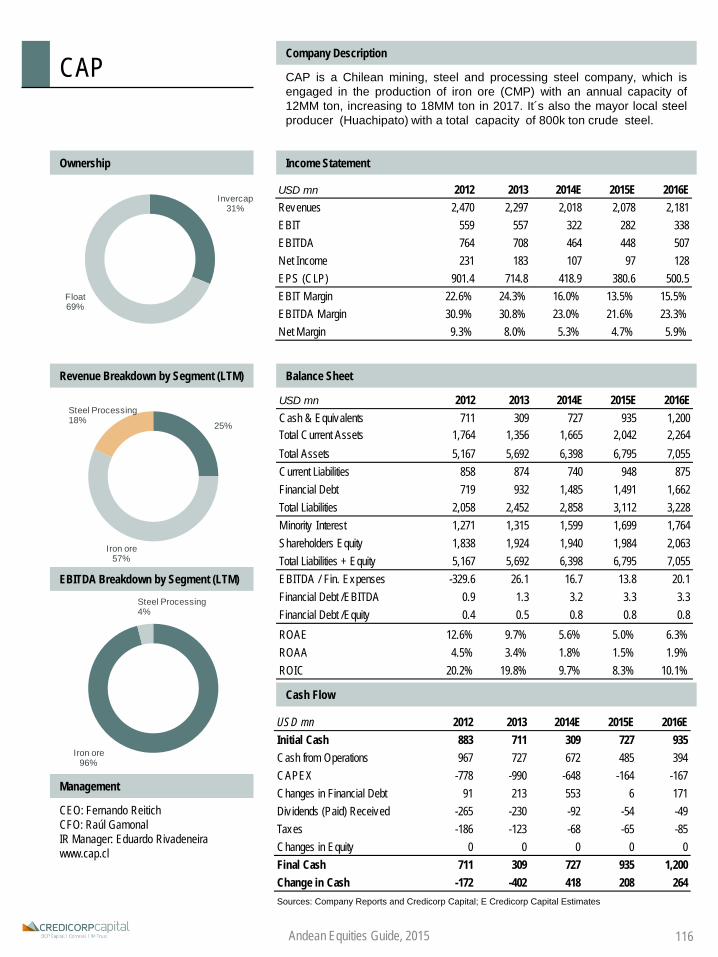
USD mn 2012 2013 2014E 2015E 2016ECash & Equivalents 711 309 727 935 1,200Total Current Assets 1,764 1,356 1,665 2,042 2,264Total Assets 5,167 5,692 6,398 6,795 7,055Current Liabilities 858 874 740 948 875Financial Debt 719 932 1,485 1,491 1,662Total Liabilities 2,058 2,452 2,858 3,112 3,228Minority Interest 1,271 1,315 1,599 1,699 1,764Shareholders Equity 1,838 1,924 1,940 1,984 2,063Total Liabilities + Equity 5,167 5,692 6,398 6,795 7,055EBITDA / Fin. Expenses -329.6 26.1 16.7 13.8 20.1Financial Debt /EBITDA 0.9 1.3 3.2 3.3 3.3Financial Debt /Equity 0.4 0.5 0.8 0.8 0.8ROAE 12.6% 9.7% 5.6% 5.0% 6.3%ROAA 4.5% 3.4% 1.8% 1.5% 1.9%ROIC 20.2% 19.8% 9.7% 8.3% 10.1%
Invercap 31%
Float 69%
CAPCompany Description
CAP is a Chilean mining, steel and processing steel company, which isengaged in the production of iron ore (CMP) with an annual capacity of12MM ton, increasing to 18MM ton in 2017. It´s also the mayor local steelproducer (Huachipato) with a total capacity of 800k ton crude steel.
Ownership Income Statement
Revenue Breakdown by Segment (LTM) Balance Sheet
EBITDA Breakdown by Segment (LTM)
Cash Flow
Management
CEO: Fernando ReitichCFO: Raúl GamonalIR Manager: Eduardo Rivadeneirawww.cap.cl
Andean Equities Guide, 2015
USD mn 2012 2013 2014E 2015E 2016ERevenues 2,470 2,297 2,018 2,078 2,181EBIT 559 557 322 282 338EBITDA 764 708 464 448 507Net Income 231 183 107 97 128EPS (CLP) 901.4 714.8 418.9 380.6 500.5EBIT Margin 22.6% 24.3% 16.0% 13.5% 15.5%EBITDA Margin 30.9% 30.8% 23.0% 21.6% 23.3%Net Margin 9.3% 8.0% 5.3% 4.7% 5.9%
USD mn 2012 2013 2014E 2015E 2016EInitial Cash 883 711 309 727 935Cash from Operations 967 727 672 485 394CAPEX -778 -990 -648 -164 -167Changes in Financial Debt 91 213 553 6 171Div idends (Paid) Received -265 -230 -92 -54 -49Taxes -186 -123 -68 -65 -85Changes in Equity 0 0 0 0 0Final Cash 711 309 727 935 1,200Change in Cash -172 -402 418 208 264Sources: Company Reports and Credicorp Capital; E Credicorp Capital Estimates
25%
Iron ore 57%
Steel Processing 18%
Iron ore 96%
Steel Processing 4%
116

Peru Industry: Rating:
HoldCasa GrandeWaiting for the sweet offer
Ivan Bogarin+(511) 4163333 – Ext 33055
Investment Thesis Stock Data
• We are maintaining our recommendation of HOLD and our 2015YE TP of PEN 9.0. Our recommendation is based on revenues andEBITDA growth of 4% and 8%, respectively. We recommend thisshare only to investors with high tolerance to illiquidity.
• High productivity (160 MT/Ha) compared to world average (100MT/ Ha). The company’s productivity is higher than the nationalaverage (126 MT/ Ha). Sugarcane harvest throughout the year andseven times before requiring re-seeding.
• One of the lowest cost producer in Latam. Casa Grande has anefficient cost structure, which allows it to maintain decent operationalmargins in a low price environment (2012 EBITDA margin of 40.8%).
• Public Tender Offer for delisting purposes. On July 21st,Coazucar (Rodriguez Banda family), the controlling group, informedthe local regulator that will hold a public tender offer for CasaGrande’s shares in the coming months (end-2014).
• Risks to our thesis: Sugar price volatility. Presence of adverseclimatic phenomena such as El Niño (Last severe: 1998). Upsiderisk will be the start of operations of the refinery plant in 4Q14.
Price Chart (PEN) and Volumes (USD mn)
Valuation• We have revised our DCF 10-year model considering a sugar price
of PEN 67.5 per 50kg bag, a 12.92% sucrose content of sugarcaneand a sugarcane yield of 159 MT / Ha in 2015.
• Casa Grande trades at 11.7x PE 2015E or below its historicalaverage and below most of its world peers.
Valuation Summary
P/E 12M Forward FV/EBITDA 12M Forward Relative Valuation
Andean Equities Guide, 2015
0
10
20
30
40
50
Oct-05 Oct-08 Oct-11 Oct-140
5
10
15
20
25
Oct-05 Oct-08 Oct-11 Oct-14
Sugar Mills
117
2013 2014E 2015E 2016EFV/EBITDA 7.3 5.9 5.6 5.5P/E 42.9 12.9 11.7 11.4P/CF 14.4 7.3 8.3 7.2P/BV 0.6 0.6 0.6 0.6Div . Yield 0.7% 1.1% 4.6% 5.1%Sources: Company Reports and Credicorp Capital
Tongaat Hulett
SavolaCasa Grande
Suedzucker AG
Mitsui Sugar CO
Khon Kaen Sugar
Industry PCL
Nanning Sugar
Industry
0
5
10
15
20
25
30
0 10 20 30
P/E
2015
E
FV/EBITDA 2015E
0.0
0.5
1.0
1.5
60
70
80
90
100
110
120
Oct-13 Feb-14 Jun-14 Oct-14
USD
m
Casa Grande IGBVL
Ticker casagrc1 pePrice (PEN) 8.70LTM Range (PEN) 5.45 - 9.80Target (PEN) 9.00Total Return 8%Market Cap (USD mn) 252Shares Outstanding (mn) 84Free Float 39%ADTV (USD mn) 0.07

PEN mn 2012 2013 2014E 2015E 2016EInitial Cash 9 17 37 88 112Cash from Operations 102 74 117 93 106CAPEX -76 -45 -37 -39 -38Changes in Financial Debt -112 13 -14 5 3Div idends (Paid) Received -102 -8 -8 -34 -38Other CFI & CFF Items 196 -15 -8 -1 -1Changes in Equity 0 0 0 0 0Final Cash 17 37 88 112 145Change in Cash 9 20 51 24 32Sources: Company Reports and Credicorp Capital; E Credicorp Capital Estimates
PEN mn 2012 2013 2014E 2015E 2016ECash & Equivalents 17 37 88 112 145Total Current Assets 174 222 283 313 345Total Assets 1,740 1,783 1,831 1,859 1,888Current Liabilities 90 129 130 126 126Financial Debt 7 20 7 11 15Total Liabilities 528 575 575 573 576Minority Interest 0 0 0 0 0Shareholders Equity 1,212 1,208 1,257 1,285 1,312Total Liabilities + Equity 1,740 1,783 1,831 1,859 1,888EBITDA / Fin. Expenses 14.3 5.9 7.6 7.4 7.2Financial Debt /EBITDA 0.0 0.2 0.1 0.1 0.1Financial Debt /Equity 0.0 0.0 0.0 0.0 0.0ROAE 8.0% 1.3% 4.6% 4.9% 5.0%ROAA 5.6% 0.9% 3.1% 3.4% 3.4%ROIC 6.6% 2.9% 4.7% 5.1% 5.2%
Casa GrandeCompany Description
Casa Grande is member of the Peruvian group Gloria with interests indairy, food, cement, and paper businesses, is the leading sugar producer inPeru, selling brown sugar in the domestic and international markets, andthe third largest hydrous alcohol producer and exporter. The company wasincorporated in 1860 and has the largest sugar mill in Peru.
Ownership Income Statement
Revenue Breakdown by Product (2015) Balance Sheet
Revenues by Destination (2013)
Cash Flow
Management
CEO: Jhon Carty ChirinosCFO: Francis Pilkingtonwww.coazucar.com
Andean Equities Guide, 2015 118
Coazucar 61%
Others 39%
Sugar 88%
Alcohol 6%Others
6%
Local Market 75%
Exports 25%
PEN mn 2012 2013 2014E 2015E 2016ERevenues 511 454 423 439 442EBIT 113 50 80 86 88EBITDA 209 91 121 128 130Net Income 97 16 57 63 65EPS (PEN) 1.15 0.19 0.67 0.75 0.77EBIT Margin 22.2% 10.9% 18.8% 19.7% 20.0%EBITDA Margin 40.8% 20.1% 28.6% 29.2% 29.4%Net Margin 18.9% 3.5% 13.4% 14.3% 14.6%

4
9
14
19
24
29
Oct-05 Oct-08 Oct-11 Oct-145
7
9
11
13
Oct-05 Oct-08 Oct-11 Oct-14
Chile Industry: Rating:
HoldCCUA complex mid-term outlook
Tomás Sanhueza+(562) 2446 1751
Investment Thesis Stock Data
• We are maintaining our Hold recommendation on CCU,introducing our new 2015YE TP of CLP 6,850, while droppingour 2014 TP of 8,500. We like CCU’s multi-category businessstrategy, its ability to leverage its distribution network, and relativelystrong profitability ratios; however, a more competitive scenario,economic slowdown, and effects from the tax reform will negativelyimpact the company’s results.
• CCU will face a challenging scenario during 2015. We areexpecting a decrease in volume growth rates, due to weakereconomic conditions in Chile and Argentina. In addition, increases inthe tax rate on soft drinks and alcoholic beverages should reflect inprices, pressuring volumes even further. On the other hand,competition in the Chilean beer market has increased, with moreaggressive strategies. As a result, EBITDA margins and profitabilityratios will likely be pressured in 2015.
• The company has a strong cash position due to its 2013 capitalincrease, which has only been used for limited M&A activity. We areexpecting more material use of capital proceeds over the upcomingyears, which could add upside to the stock.
• Risks to our thesis: Upside risk: i) M&A activity, Downside risk: i)stronger strategy from its competitors, ii) Argentina’s political risk.
Price Chart (CLP) and Volumes (USD mn)
Valuation• In terms of forward multiples, CCU is trading at fair multiples in
terms of P/E and FV/EBITDA 2015E, when compared to its history,which sustain our neutral stance on the shares.
• When compared to peers, CCU is trading at fair multiples in termsof P/E, but at a discount in terms of EV/EBITDA. We believe this isjustified by a higher competitive scenario in Chile and the exposureto Argentina.
Valuation Summary
P/E 12M Forward FV/EBITDA 12M Forward Relative Valuation
Andean Equities Guide, 2015
2013 2014E 2015E 2016EFV/EBITDA 9.4 9.3 9.4 9.0P/E 18.9 17.7 19.6 20.3P/CF 22.4 45.2 46.1 -192.8P/BV 2.4 2.1 2.1 2.0Div . Yield 2.7% 3.0% 3.1% 2.8%Sources: Company Reports and Credicorp Capital
Food & Beverages
0
5
10
15
20
25
30
70
80
90
100
110
Oct-13 Feb-14 Jun-14 Oct-14
USD
m
CCU IPSA
AmbevCCUSAB Miller
Heineken
10
13
16
19
22
25
7 9 11 13 15
P / E
2015
E
EV / EBITDA 2015E
119
Ticker / ADR ccu ci / ccu usPrice (CLP) 6,079LTM Range (CLP) 5,742 - 6,958Target (CLP / USD) 6,850 (loc) / 24.2 (ADR)Total Return 16%Market Cap (USD mn) 3,850Shares Outstanding (mn) 370Free Float 34%ADTV (USD mn) 3.3 (loc) - 3.5 (ADR)

CCUCompany Description
CCU is a multicategory bottler and distribution company, and leader beerproducer in Chile. It is also the second largest beer producer in Argentina.CCU also produces and distributes soft drinks (PepsiCo and Schweppes),wines (VSPT winery), spirits, cider in Argentina and snacks. In the pastthree years, it has entered the markets in Uruguay, Paraguay and Bolivia.
Ownership Income Statement
EBITDA Breakdown by Division (LTM) Balance Sheet
Volume Breakdown by Division (LTM)
Cash Flow
Management
CEO: Patricio JottarCFO: Felipe DubernetIR Manager: Cristobal Escobarwww.ccu.cl
Andean Equities Guide, 2015
Quiñenco-Heineken
60.0%
ADRs 12.9%
Others 27.1%
Chile 65.6%
Rio de la Plata
18.4%
Wines 10.8%
Others 5.2%
Chile 71.1%
Rio de la Plata 23.2%
Wines 5.7%
120
CLP mn 2012 2013 2014E 2015E 2016ECash & Equivalents 103,718 413,322 461,336 507,661 553,365Total Current Assets 495,888 818,497 891,530 964,035 1,037,271Total Assets 1,326,448 1,727,720 1,900,951 2,067,996 2,296,572Current Liabilities 314,530 409,129 442,649 475,211 503,846Financial Debt 263,997 263,251 327,170 409,323 550,202Total Liabilities 615,929 643,476 737,840 849,687 1,016,941Minority Interest 97,299 95,568 115,958 126,148 140,091Shareholders Equity 613,220 988,676 1,047,153 1,092,161 1,139,540Total Liabilities + Equity 1,326,448 1,727,720 1,900,951 2,067,996 2,296,572EBITDA / Fin. Expenses 25.0 16.1 32.4 34.0 16.4Financial Debt /EBITDA 1.1 1.0 1.3 1.6 2.1Financial Debt /Equity 0.4 0.3 0.3 0.4 0.5ROAE 19.4% 15.4% 12.5% 10.7% 9.9%ROAA 8.6% 8.1% 7.0% 5.8% 5.1%ROIC 19.8% 18.5% 16.2% 14.1% 12.9%
CLP mn 2012 2013 2014E 2015E 2016EInitial Cash 181,608 103,718 413,322 461,336 507,661Cash from Operations 121,079 193,258 248,401 226,455 229,894CAPEX -116,951 -124,510 -153,448 -150,563 -216,073Changes in Financial Debt 16,937 -746 63,918 82,153 140,879Div idends (Paid) Received -66,117 -63,681 -68,469 -69,820 -63,156Taxes -32,838 -26,390 -42,389 -41,900 -45,841Changes in Equity 0 331,674 0 0 0Final Cash 103,718 413,322 461,336 507,661 553,365Change in Cash -77,891 309,604 48,014 46,325 45,704Sources: Company Reports and Credicorp Capital; E Credicorp Capital Estimates
CLP mn 2012 2013 2014E 2015E 2016ERevenues 1,075,690 1,197,227 1,298,685 1,389,965 1,474,722EBIT 181,188 188,266 183,072 174,765 180,872EBITDA 234,093 255,501 257,498 254,043 263,982Net Income 114,433 123,036 126,946 114,828 110,534EPS (CLP) 354.2 333.0 343.6 310.8 299.1EBIT Margin 16.8% 15.7% 14.1% 12.6% 12.3%EBITDA Margin 21.8% 21.3% 19.8% 18.3% 17.9%Net Margin 10.6% 10.3% 9.8% 8.3% 7.5%

2013 2014E 2015E 2016EFV/EBITDA 7.8 6.2 8.1 8.2P/E 10.9 12.2 18.8 19.3P/CF 6.8 6.6 6.6 6.5P/BV 1.2 1.2 1.2 1.1Div . Yield 1.8% 1.9% 2.0% 2.2%Sources: Company Reports and Credicorp Capital
Colombia Industry:
UtilitiesRating:
HoldCelsiaTaking advantage of the drought
Jaime Pedroza+(571) 339 44 00 ext. 1025
Investment Thesis Stock Data
• We are launching our 2015E TP of COP 7,020 and downgradingour rating from BUY to HOLD. Celsia has posted impressivefinancial results in 2014, boosted by the company taking advantageof the flexibility of its installed capacity (56% Hydro, 44% Thermal)by increasing its sales in the spot market in the middle of a droughtperiod that results in historically high power prices; we expect thisperformance to continue in coming quarters.
• The international expansion began. Celsia announced theacquisition of power facilities with a 530 MW installed capacity inCosta Rica and Panama, increasing current plant capacity by 30%.The acquisition was closed at 9.8x EV/EBITDA 15E, which is fairrelative to recent transactions. Even though it wasn’t a bargain, welike the deal and believe it is in line with the company’s strategy. Thetransaction is expected to close on December 2014 and thecompany announced it will not require a capital increase to fund it.
• Delays in the Porvenir II project. The hydroelectric plant (352MW), will increase the company’s installed capacity in Colombia by20%. Expected to be fully operational by late 2018, the project isfacing major delays due to holdbacks on environmental permitsrequired for the construction phase to begin; the associatedreliability charges may be at risk. However, we highlight this projectaccounts for no more than 5% of our fundamental value estimate.
Valuation• Our 2015 TP of COP 7,020/share is based on a DCF incorporating
slight EBITDA margin improvements with the expansion projects,and long-term yearly nominal growth of 2%, in line with expectedpower prices. Our 2015 TP implies an 8.7x EV/EBITDA 15E and a22.1x P/E 15E. Our target price does not include a valuation of theassets recently acquired in Central America as we are expectingmore financial information regarding the assets.
Price Chart (COP) and Volumes (USD mn)
Valuation Summary
P/E 12M Forward FV/EBITDA 12M Forward Relative Valuation
Andean Equities Guide, 2015
-
10
20
30
40
50
60
70
80
90
100
110
120
Oct-13 Apr-14 Oct-14
USD
mn
Celsia Colcap
Ticker celsia cbPrice (COP) 5,980LTM Range (COP) 6,570 - 4,885Target (COP) 7,020Total Return 19%Market Cap (USD mn) 2,099Shares Outstanding (mn) 720Free Float 48%ADTV (USD mn) 1.6
813182328333843
Dec-09 Dec-10 Dec-11 Dec-12 Dec-13
56789
101112
Dec-09 Dec-10 Dec-11 Dec-12 Dec-13
E-CL
Endesa Chile
AES GenerColbun
Enersis
EnersurEdegel
Celsia
Isagen
AES Tiete
Tractebel
Cesp02468
101214
4 6 8 10 12 14 16 18 20 22 24
EV/E
BITD
A 20
15E
P/E 2015E
121

COP mn 2012 2013 2014E 2015E 2016ECash & Equivalents 744,227 897,760 968,813 917,663 921,811Total Current Assets 1,055,536 1,130,618 1,208,757 1,230,397 1,272,719Total Assets 6,840,008 7,326,546 7,832,897 7,973,130 8,247,383Current Liabilities 442,731 433,661 466,326 459,406 479,148Financial Debt 1,716,344 1,786,159 1,780,698 1,851,702 1,915,967Total Liabilities 2,466,596 2,416,064 2,598,051 2,559,499 2,669,488Minority Interest 1,468,001 1,622,157 1,674,748 1,711,560 1,747,325Shareholders Equity 2,905,411 3,288,325 3,561,396 3,703,404 3,831,935Total Liabilities + Equity 6,840,008 7,326,546 7,832,897 7,973,130 8,247,383EBITDA / Fin. Expenses 4.7 6.1 7.8 5.9 5.7Financial Debt /EBITDA 2.3 2.1 1.6 2.1 2.2Financial Debt /Equity 0.6 0.5 0.5 0.5 0.5ROAE 7.9% 11.4% 10.6% 8.0% 6.0%ROAA 3.4% 5.1% 4.8% 3.7% 2.8%ROIC 11.0% 13.7% 12.3% 9.6% 9.4%
CelsiaCompany Description
Celsia is a power generation and distribution company in Colombia. It has 1,789 MW ofinstalled capacity (44% thermal, 56% hydro) which makes it the fourth largest powergenerator in Colombia. Through its subsidiaries, it is the fifth largest power distributioncompany in Colombia with about 520,000 customers in 39 municipalities in Valle del Cauca(Southwest Colombia).
Ownership Income Statement
Revenues Breakdown (Jun-14) Balance Sheet
Installed Capacity (Oct-14)
Cash Flow
Management
CEO: Juan Guillermo LondoñoCFO: Esteban PiedrahitaIR Manager: Natalia Muñozwww.celsia.com.
Andean Equities Guide, 2015
Grupo Argos 52%
Pension funds 26%
Other 17%
COP mn 2012 2013 2014E 2015E 2016EInitial Cash 685,026 744,227 897,760 968,813 917,663Cash from Operations 519,347 605,135 650,351 652,559 663,155CAPEX -103,488 -265,034 -254,260 -462,525 -403,634Changes in Financial Debt -147,466 69,815 -5,461 71,004 64,266Div idends (Paid) Received -66,998 9,268 -80,593 -87,041 -94,004Taxes -142,194 -194,598 -290,133 -220,999 -214,714Changes in Equity 0 0 0 0 0Final Cash 744,227 968,813 917,663 921,811 932,732Change in Cash 59,201 224,586 19,903 -47,002 15,068Sources: Company Reports and Credicorp Capital; E Credicorp Capital Estimates
Wholesale power sales
66%
Power distribution
22%
Other 12%
Thermal 44%
Hydro 56%
COP mn 2012 2013 2014E 2015E 2016ERevenues 2,023,673 2,381,947 2,731,101 2,238,352 2,336,216EBIT 592,488 716,948 980,542 726,345 715,015EBITDA 731,175 864,564 1,119,752 872,957 876,081Net Income 230,760 374,476 352,834 229,049 222,535EPS (COP) 320.7 520.4 490.3 318.3 309.3EBIT Margin 29.3% 30.1% 35.9% 32.5% 30.6%EBITDA Margin 36.1% 36.3% 41.0% 39.0% 37.5%Net Margin 11.4% 15.7% 12.9% 10.2% 9.5%
122

Colombia Industry: Rating:
HoldCemargosBetter margins in the near future
Carlos E Rodríguez.+(571) 339 4400 ext. 1365
Investment Thesis Stock Data
• We are setting our 2015 TP at 11,300 (2014 TP 9,950) andupgrading Cemargos’ rating to Hold, supported by figures in theUnited States that should keep improving to contribute positively toconsolidated EBITDA. Even though this region still posts marginsbelow the company’s consolidated figure, it stopped being a cashburner. We are expecting an EBITDA margin of 10% for the USoperation in 2015, and management guidance is to reach margins inthe mid-teens in the coming years.
• We are optimistic on 4G road concessions in Colombia (7projects for a CAPEX of USD ~4bn have been awarded so far) andCemargos is well-suited to take advantage of the opportunity. Thecompany has the installed capacity to assume the future demand oncement, which we are expecting to occur by late 2015 / early 2016.Further, Cemargos’ geographic diversification across Colombia willallow it be closer to the 4G projects, and offer competitive prices.
• The expansion project of the Sogamoso plant should bring operatingefficiencies (dry cutting edge technology) and provide installedcapacity for growth beyond year 2018. Further, with an estimatedCapex of USD 450 mn (meaning a very low USD 195 /ton), return onthis project should benefit Cemargos’ consolidated figures.
Price Chart (COP) and Volumes (USD mn)
Valuation• Our 2015 T.P. of COP 11,300/share is based on a DCF model at a
10% (WACC). Perpetuity growth standing at 2.8%, reflects long-termforecasts on regionally-weighted price growths. ConsolidatedEBITDA margin is expected to reach 25% by 2018 vs. 18% in 2012.
• Our valuation implies 2014E FV/EBITDA and P/E of 10.8x and24.3x, respectively (both clean from the investment portfolio). Theseshow substantial improvements relative to those observed in 2013and 2014, but Cemargos continues to look overvalued vs. peers.
Valuation Summary
P/E 12M Forward FV/EBITDA 12M Forward Relative Valuation
Holcim
UnacemHeidelberg
Lafarge
CLH
Pacasmayo
Cemex
Cemargos
Ciments Francais
0
10
20
30
40
50
60
- 5.0 10.0 15.0
P/E
201
5E
EV/EBITDA 2015E
Cement & Construction
0
20
40
60
80
100
Mar-10 Mar-11 Mar-12 Mar-13 Mar-148
10
12
14
16
18
20
Mar-10 Mar-11 Mar-12 Mar-13 Mar-14
Ticker cemargos cb equityPrice (COP) 10,340LTM Range (COP) 8,280 - 12,100Target (COP) 11,300Total Return 11%Market Cap (USD mn) 6,820Shares Outstanding (mn) 1,361Free Float 39%ADTV (USD mn) 2.5
123Andean Equities Guide, 2015
-
10
20
30
40
50
80
90
100
110
120
130
Oct-13 Apr-14
USD
mn
Cemargos Colcap
2013 2014E 2015E 2016EFV/EBITDA 16.3 11.9 10.3 9.2P/E 72.3 34.1 25.9 21.6P/CF -77.8 -38.3 20.7 18.1P/BV 1.8 1.9 1.8 1.7Div . Yield 1.6% 1.6% 1.7% 1.8%Sources: Company Reports and Credicorp Capital
César Cuervo, CFA+(571) 3394400 Ext 1012
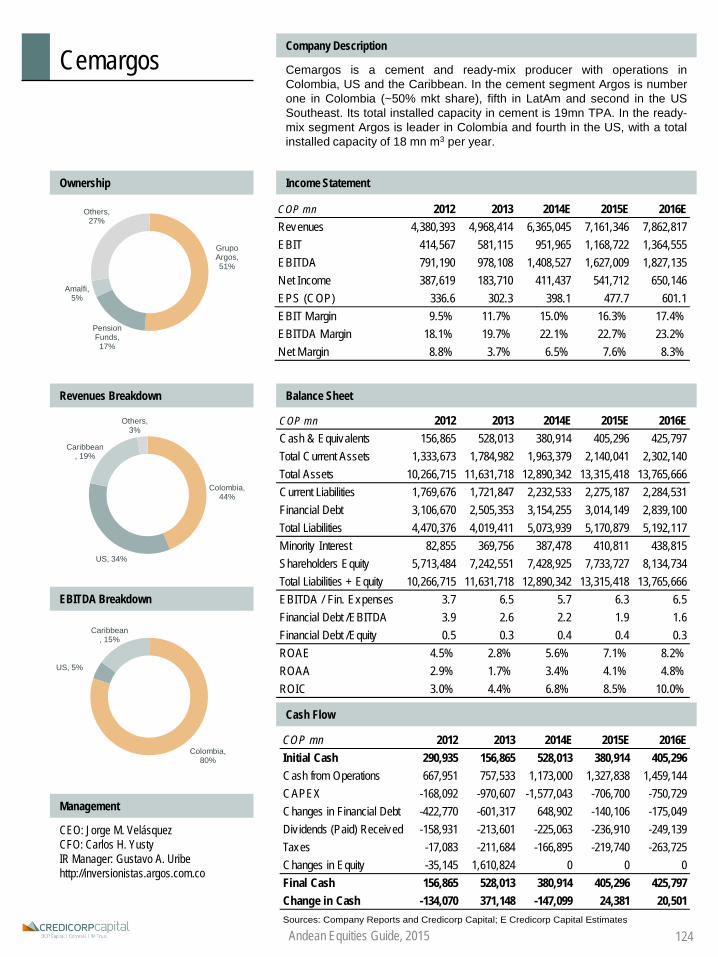
CemargosCompany Description
Cemargos is a cement and ready-mix producer with operations inColombia, US and the Caribbean. In the cement segment Argos is numberone in Colombia (~50% mkt share), fifth in LatAm and second in the USSoutheast. Its total installed capacity in cement is 19mn TPA. In the ready-mix segment Argos is leader in Colombia and fourth in the US, with a totalinstalled capacity of 18 mn m3 per year.
Ownership Income Statement
Revenues Breakdown Balance Sheet
EBITDA Breakdown
Cash Flow
Management
CEO: Jorge M. VelásquezCFO: Carlos H. YustyIR Manager: Gustavo A. Uribehttp://inversionistas.argos.com.co
Grupo Argos, 51%
Pension Funds, 17%
Amalfi, 5%
Others, 27%
Colombia, 44%
US, 34%
Caribbean, 19%
Others, 3%
Colombia, 80%
US, 5%
Caribbean, 15%
124Andean Equities Guide, 2015
COP mn 2012 2013 2014E 2015E 2016ERevenues 4,380,393 4,968,414 6,365,045 7,161,346 7,862,817EBIT 414,567 581,115 951,965 1,168,722 1,364,555EBITDA 791,190 978,108 1,408,527 1,627,009 1,827,135Net Income 387,619 183,710 411,437 541,712 650,146EPS (COP) 336.6 302.3 398.1 477.7 601.1EBIT Margin 9.5% 11.7% 15.0% 16.3% 17.4%EBITDA Margin 18.1% 19.7% 22.1% 22.7% 23.2%Net Margin 8.8% 3.7% 6.5% 7.6% 8.3%
COP mn 2012 2013 2014E 2015E 2016EInitial Cash 290,935 156,865 528,013 380,914 405,296Cash from Operations 667,951 757,533 1,173,000 1,327,838 1,459,144CAPEX -168,092 -970,607 -1,577,043 -706,700 -750,729Changes in Financial Debt -422,770 -601,317 648,902 -140,106 -175,049Div idends (Paid) Received -158,931 -213,601 -225,063 -236,910 -249,139Taxes -17,083 -211,684 -166,895 -219,740 -263,725Changes in Equity -35,145 1,610,824 0 0 0Final Cash 156,865 528,013 380,914 405,296 425,797Change in Cash -134,070 371,148 -147,099 24,381 20,501Sources: Company Reports and Credicorp Capital; E Credicorp Capital Estimates
COP mn 2012 2013 2014E 2015E 2016ECash & Equivalents 156,865 528,013 380,914 405,296 425,797Total Current Assets 1,333,673 1,784,982 1,963,379 2,140,041 2,302,140Total Assets 10,266,715 11,631,718 12,890,342 13,315,418 13,765,666Current Liabilities 1,769,676 1,721,847 2,232,533 2,275,187 2,284,531Financial Debt 3,106,670 2,505,353 3,154,255 3,014,149 2,839,100Total Liabilities 4,470,376 4,019,411 5,073,939 5,170,879 5,192,117Minority Interest 82,855 369,756 387,478 410,811 438,815Shareholders Equity 5,713,484 7,242,551 7,428,925 7,733,727 8,134,734Total Liabilities + Equity 10,266,715 11,631,718 12,890,342 13,315,418 13,765,666EBITDA / Fin. Expenses 3.7 6.5 5.7 6.3 6.5Financial Debt /EBITDA 3.9 2.6 2.2 1.9 1.6Financial Debt /Equity 0.5 0.3 0.4 0.4 0.3ROAE 4.5% 2.8% 5.6% 7.1% 8.2%ROAA 2.9% 1.7% 3.4% 4.1% 4.8%ROIC 3.0% 4.4% 6.8% 8.5% 10.0%

2013 2014E 2015E 2016EFV/EBITDA 10.2 9.1 8.3 7.1P/E 23.9 18.4 17.5 14.4P/CF n.m n.m n.m 12.1P/BV 1.8 1.4 1.4 1.3Div . Yield 1.5% 2.5% 2.8% 2.9%Sources: Company Reports and Credicorp Capital
Peru Industry:
CementRating:BuyCementos Pacasmayo
Ride the wild windFernando Pereda
+(511) 416 3333 - Ext: [email protected]
Investment Thesis Stock Data
• We are reiterating our Buy rating on Cementos Pacasmayo, butreducing our 2015YE T.P. to PEN 6.14 from a previous 2014YETP of PEN 6.96, implying a total return of 22%. In our view, C.Pacasmayo stands as a solid and stable company, with positivemid-term prospects in the cement business.
• The market is discounting a very tough growth scenario forCementos Pacasmayo. Although we do not foresee many shortterm catalysts, we believe that the company is still attractive due toits strong financial position and low debt. Rising employment levelswill result in the expansion of housing market (54% of total salescome from self-construction). Peru has a significant housingshortage, with an estimated deficit of 0.5mn homes nationwide.
• Expanding cement capacity. The company is building a newcement plant in Piura (1.6mn MT; USD 385mn), which will expandits installed capacity by 48% in 3Q15. This new capacity will ensurethat it continues to dominate the cement market in northern Peru inthe foreseeable future.
• Risks to our thesis: additional slowdown of self-construction, publicand private investments. Delays in Piura plant construction (2015).
Price Chart (PEN) and Volumes (USD mn)
Valuation• Current valuations of 8.3x FV/EBITDA and 17.5x P/E imply that
comparable companies trade significantly above CementosPacasmayo. We see room for important multiples expansion as thePiura plant will enhance EBITDA margins. Moreover, this new facilityshall allow the company to operate without the need of furthercapacity expansions through 2022.
• We determined our TP with a sum of parts DCF model broken downby plant. Clinker will be imported until 1H15 when Piura plant beginsproduction. EBITDA margin peaks at 31.0% in 2016 when the newand most efficient Piura plant operates at 85% of clinker capacity.
Valuation Summary
P/E 12M Forward FV/EBITDA 12M Forward Relative Valuation
Andean Equities Guide, 2015
Cementos Argos
CRH
Italcementi Ords
UnacemCementos Pacasmayo
CLH
05
10152025303540
0 5 10 15 20
P/E
2015
E
FV/EBITDA 2015E
0
2
4
6
8
60
70
80
90
100
110
120
Oct-13 Feb-14 Jun-14 Oct-14
USD
m
C. Pacasmayo IGBVL
0
10
20
30
40
50
Oct-05 Oct-08 Oct-11 Oct-140
5
10
15
20
Oct-05 Oct-08 Oct-11 Oct-14
125
Ticker / ADR cpacasc1 pe / cpac usPrice (PEN) 5.16LTM Range (USD) 4.73 - 6.53Target 6.14 (loc) / 10.62 (ADR)Total Return 22%Market Cap (USD mn) 1,034Shares Outstanding (mn) 531Free Float 22%ADTV (USD mn) 0.40 (loc) - 0.33 (ADR)

C. PacasmayoCompany Description
Cementos Pacasmayo is Peru’s second-largest cement producer and theonly manufacturer in the northern region of the country (24% population,16% of GDP). The company is part of the Hochschild group (mining andindustrial businesses) and has been listed on the Lima SE since 1995 andon the NYSE since February 2012.
Ownership Income Statement
Cement Capacity Breakdown (2015) Balance Sheet
COGS Breakdown (2015)
Cash Flow
Management
CEO: Humberto NadalCFO: Manuel FerreyrosIR Manager: Claudia Bustamante
Andean Equities Guide, 2015
Pension Funds 23.6%
Invers. Pacasmayo 52.6%
ADRS 20.5%
Others 3.3%
Piura , 1600 k
MT
Pacasmayo, 2900
k MT
Rioja, 440 k MT
Non-cash charges 8.5%
Production inputs 42.6%
Maintainance
17.8%
Labour 10.3%
Others 20.8%
PEN mn 2012 2013 2014E 2015E 2016ERevenues 1,170 1,240 1,251 1,280 1,374EBIT 231 293 267 283 336EBITDA 278 349 333 367 425Net Income 156 152 165 175 213EPS (PEN) 0.27 0.26 0.28 0.30 0.37EBIT Margin 19.7% 23.6% 21.4% 22.1% 24.5%EBITDA Margin 23.8% 28.1% 26.6% 28.7% 31.0%Net Margin 13.3% 12.3% 13.2% 13.7% 15.5%
PEN mn 2012 2013 2014E 2015E 2016ECash & Equivalents 474 977 534 383 511Total Current Assets 853 1,419 945 804 962Total Assets 2,383 3,115 3,192 3,286 3,416Current Liabilities 180 158 146 147 152Financial Debt 215 824 825 825 825Total Liabilities 489 1,105 1,094 1,095 1,100Minority Interest 0 0 0 0 0Shareholders Equity 1,894 2,009 2,098 2,191 2,316Total Liabilities + Equity 2,383 3,115 3,192 3,286 3,416EBITDA / Fin. Expenses 11.7 9.4 8.5 8.9 10.3 Financial Debt /EBITDA 0.8 2.4 2.5 2.2 1.9Financial Debt /Equity 0.1 0.4 0.4 0.4 0.4ROAE 8.2% 7.8% 8.0% 8.2% 9.4%ROAA 6.5% 5.5% 5.2% 5.4% 6.4%ROIC 9.9% 11.7% 8.8% 7.9% 8.9%
PEN mn 2012 2013 2014E 2015E 2016EInitial Cash 363 474 977 534 383Cash from Operations 100 192 251 251 276CAPEX -248 -201 -615 -319 -61Changes in Financial Debt -375 609 1 0 0Div idends (Paid) Received -52 -58 -76 -83 -88Other CFI & CFF Items 20 -38 -4 0 0Changes in Equity 666 0 0 0 0Final Cash 474 977 534 383 511Change in Cash 111 503 -443 -151 128Sources: Company Reports and Credicorp Capital; E Credicorp Capital Estimates
126

2013 2014E 2015E 2016EFV/EBITDA 9.9 9.5 8.8 6.8P/E 18.6 16.2 14.2 13.4P/CF 6.3 12.1 15.4 12.5P/BV 3.6 3.0 2.5 2.1Div . Yield 0.0% 0.0% 0.0% 0.0%Sources: Company Reports and Credicorp Capital
Colombia Industry:
CementRating:
HoldCemex Latam HoldingsCaribbean Queen, someday
Fernando Pereda+(511) 416 3333 - Ext: 37856
Investment Thesis Stock Data
• We are maintaining our Hold rating on Cemex Latam Holdings(CLH) and our 2015YE T.P. at COP 20,100, implying a totalreturn of 11.0%. Growing demand in the company’s area ofinfluence may be capitalized in coming years but margins will belower given that the company will need to import more clinker.
• Sales and EBITDA in Colombia will account for 60% and 68% ofconsolidated figures in 2015. We have a positive view onconstruction in Colombia and forecast that construction GDP maygrow by 8.9% and 10.0% during 2015 and 2016, respectively,mainly due to large public infrastructure projects.
• Can CLH take advantage of vigorous demand growth if itsproduction capacity is almost saturated and cash generationwill focus on paying debt with Cemex S.A.B. by 2018? We thinkthey can, but strategic Capex may be limited to: i) a new cementplant in Nicaragua by 2017 (0.44mn MT, USD 55mn); and ii) anotherexpansion of cement (2015) and clinker (2016) in Antioquia,Colombia (1.0 mn MT, USD 340mn).
• Risks to our thesis: Delays in the 4G infrastructure projects inColombia. Higher competition.
Price Chart (COP) and Volumes (USD mn)
Valuation• Current 2015YE valuations of 8.8x FV/EBITDA and 14.2x P/E are in
line with those of peers, but we do not see room for an expansion inmultiples. Although the company operates in fast growing markets,financial expenses and debt amortization could considerably reducecash flows from operations (CFO) and financing (CFF) and we donot see room for the Capex to expand beyond the level that hasalready been announced. Furthermore, the company does notexpect to pay dividends until debt to Cemex is cancelled in 2018.
Valuation Summary
P/E 12M Forward FV/EBITDA 12M Forward Relative Valuation
Andean Equities Guide, 2015 127
Ticker clh cbPrice (COP) 18,100LTM Range (COP) 12,760 - 19,820Target (COP) 20,100Total Return 11%Market Cap (USD mn) 4,919Shares Outstanding (mn) 556Free Float 27%ADTV (USD mn) 2.9
0
5
10
15
20
25
30
80
90
100
110
120
130
140
Oct-13 Feb-14 Jun-14 Oct-14
USD
m
CLH COLCAP
911131517192123
Oct-12 Abr-13 Oct-13 Abr-14 Oct-147
8
9
10
11
12
Oct-12 Apr-13 Oct-13 Apr-14 Oct-14
Cementos Argos
CRH
Italcementi Ords
UnacemCementos Pacasmayo
CLH
05
10152025303540
0 5 10 15 20
P/E
2015
E
FV/EBITDA 2015E

CLHCompany Description
Cemex Latam Holdings produces, distributes and sells cement, ready mixconcrete and aggregates in Colombia, Panama, Costa Rica, Brazil,Nicaragua, Guatemala and El Salvador. The company has been listed onthe Colombian SE since November 2012. CLH represents about 12% ofCemex SAB revenues
Ownership Income Statement
Revenues Breakdown (2015E) Balance Sheet
COGS Breakdown (2015E)
Cash Flow
Management
CEO: Carlos JacksCFO: Josue GonzalezIR Manager: Patricio Treviño
Andean Equities Guide, 2015
USD mn 2012 2013 2014E 2015E 2016ERevenues 1,592 1,750 1,843 1,914 2,134EBIT 477 520 526 554 621EBITDA 548 633 625 671 756Net Income 266 265 286 318 369EPS (USD) 0.48 0.48 0.51 0.57 0.66EBIT Margin 30.0% 29.7% 28.5% 28.9% 29.1%EBITDA Margin 34.4% 36.2% 33.9% 35.1% 35.4%Net Margin 16.7% 15.1% 15.5% 16.6% 17.3%
USD mn 2012 2013 2014E 2015E 2016ECash & Equivalents 57 77 73 123 295Total Current Assets 351 450 477 543 763Total Assets 4,059 3,836 3,904 4,098 4,373Current Liabilities 456 642 654 674 723Financial Debt 1,633 1,381 1,125 982 839Total Liabilities 2,666 2,478 2,282 2,159 2,065Minority Interest 0 0 0 0 0Shareholders Equity 1,392 1,358 1,621 1,939 2,308Total Liabilities + Equity 4,059 3,836 3,904 4,098 4,373EBITDA / Fin. Expenses 4.7 5.6 7.1 9.3 12.1 Financial Debt /EBITDA 3.0 2.2 1.8 1.5 1.1Financial Debt /Equity 1.2 1.0 0.7 0.5 0.4ROAE 19.1% 19.3% 19.2% 17.8% 17.4%ROAA 6.5% 6.7% 7.4% 7.9% 8.7%ROIC 11.3% 12.9% 13.8% 14.2% 15.4%
USD mn 2012 2013 2014E 2015E 2016EInitial Cash 0 57 77 73 123Cash from Operations 187 337 370 439 504CAPEX -51 -94 -127 -245 -190Changes in Financial Debt 1,633 -252 -256 -143 -143Div idends (Paid) Received 0 0 0 0 0Other CFI & CFF Items -3,401 29 9 0 0Changes in Equity 1,688 0 0 0 0Final Cash 57 77 73 123 295Change in Cash 57 20 -4 51 171Sources: Company Reports and Credicorp Capital; E Credicorp Capital Estimates
Colombia 62%
Panama 14%
Costa Rica 8%
Rest of CLH 15%
Cemex España 73.4%
Others 26.6%
Colombia 53%
Panama 12%
Costa Rica 5%
Rest of CLH 17%
Non-cash charges
12%
128
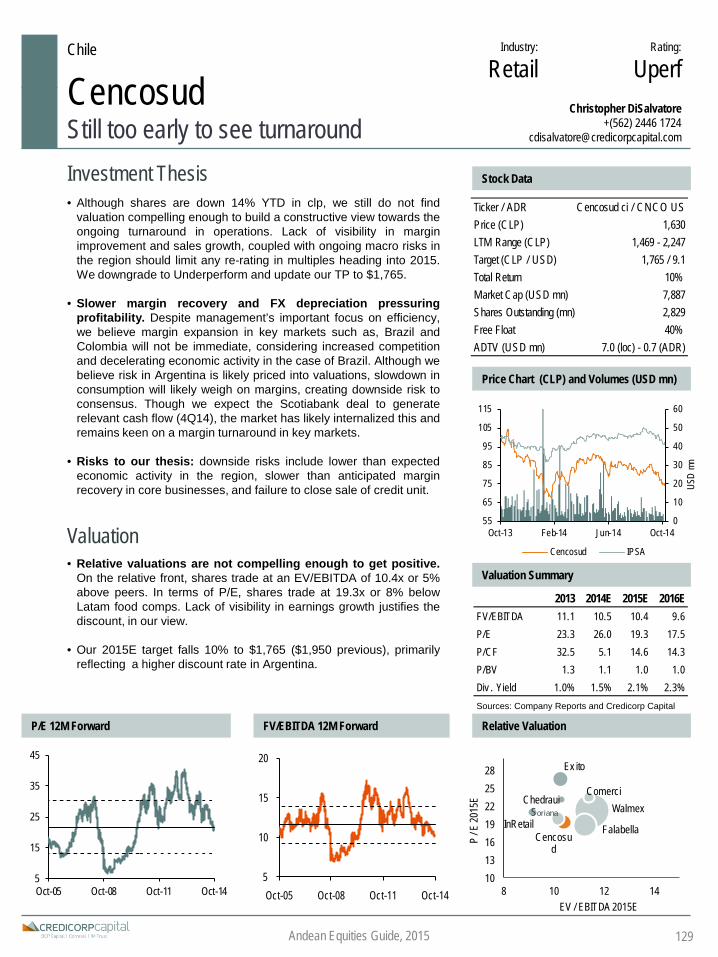
2013 2014E 2015E 2016EFV/EBITDA 11.1 10.5 10.4 9.6P/E 23.3 26.0 19.3 17.5P/CF 32.5 5.1 14.6 14.3P/BV 1.3 1.1 1.0 1.0Div . Yield 1.0% 1.5% 2.1% 2.3%Sources: Company Reports and Credicorp Capital
Chile Industry:
RetailRating:
UperfCencosudStill too early to see turnaround
Christopher DiSalvatore+(562) 2446 1724
Investment Thesis Stock Data
• Although shares are down 14% YTD in clp, we still do not findvaluation compelling enough to build a constructive view towards theongoing turnaround in operations. Lack of visibility in marginimprovement and sales growth, coupled with ongoing macro risks inthe region should limit any re-rating in multiples heading into 2015.We downgrade to Underperform and update our TP to $1,765.
• Slower margin recovery and FX depreciation pressuringprofitability. Despite management’s important focus on efficiency,we believe margin expansion in key markets such as, Brazil andColombia will not be immediate, considering increased competitionand decelerating economic activity in the case of Brazil. Although webelieve risk in Argentina is likely priced into valuations, slowdown inconsumption will likely weigh on margins, creating downside risk toconsensus. Though we expect the Scotiabank deal to generaterelevant cash flow (4Q14), the market has likely internalized this andremains keen on a margin turnaround in key markets.
• Risks to our thesis: downside risks include lower than expectedeconomic activity in the region, slower than anticipated marginrecovery in core businesses, and failure to close sale of credit unit.
Price Chart (CLP) and Volumes (USD mn)
Valuation• Relative valuations are not compelling enough to get positive.
On the relative front, shares trade at an EV/EBITDA of 10.4x or 5%above peers. In terms of P/E, shares trade at 19.3x or 8% belowLatam food comps. Lack of visibility in earnings growth justifies thediscount, in our view.
• Our 2015E target falls 10% to $1,765 ($1,950 previous), primarilyreflecting a higher discount rate in Argentina.
Valuation Summary
P/E 12M Forward FV/EBITDA 12M Forward Relative Valuation
Andean Equities Guide, 2015
0
10
20
30
40
50
60
55
65
75
85
95
105
115
Oct-13 Feb-14 Jun-14 Oct-14
USD
mn
Cencosud IPSA
Walmex
Cencosud
Falabella
Ex ito
InRetailSoriana
ComerciChedraui
10131619222528
8 10 12 14
P / E
2015
E
EV / EBITDA 2015E
129
5
15
25
35
45
Oct-05 Oct-08 Oct-11 Oct-14
Ticker / ADR Cencosud ci / CNCO USPrice (CLP) 1,630LTM Range (CLP) 1,469 - 2,247Target (CLP / USD) 1,765 / 9.1Total Return 10%Market Cap (USD mn) 7,887Shares Outstanding (mn) 2,829Free Float 40%ADTV (USD mn) 7.0 (loc) - 0.7 (ADR)
5
10
15
20
Oct-05 Oct-08 Oct-11 Oct-14

CencosudCompany Description
Cencosud operates as a multi-format retailer, integrating supermarkets,department stores, real estate, home improvement, and financial services.The company ranks among the largest retailers in Latam with operations inArgentina, Brazil, Chile, Colombia, and Peru, where together operationsgenerate over USD 20 bn in sales.
Ownership Income Statement
Revenue Breakdown by Country (LTM) Balance Sheet
EBITDA by Country (LTM)
Cash Flow
Management
CEO: Daniel RodríguezCFO: Juan Manuel ParadaIR Manager: Marisol Fernández / Ignacio Reyes / Natalia Nacifwww.cencosud.cl
Andean Equities Guide, 2015
CLP mn 2012 2013 2014E 2015E 2016ERevenues 9,149,077 10,341,040 10,853,174 11,210,292 11,751,422EBIT 607,866 624,125 507,666 500,801 554,479EBITDA 656,323 728,363 707,171 715,567 776,020Net Income 269,958 229,930 176,679 238,116 262,354EPS 113.1 81.3 62.5 84.2 92.7EBIT Margin 6.6% 6.0% 4.7% 4.5% 4.7%EBITDA Margin 7.2% 7.0% 6.5% 6.4% 6.6%Net Margin 3.0% 2.2% 1.6% 2.1% 2.2%
CLP mn 2012 2013 2014E 2015E 2016ECash & Equivalents 305,888 221,296 217,063 224,206 235,028Total Current Assets 2,334,567 2,434,485 2,087,416 2,196,335 2,315,237Total Assets 9,674,000 10,065,234 9,729,863 9,973,531 10,257,314Current Liabilities 3,315,041 2,951,699 3,136,007 3,306,779 3,499,634Financial Debt 3,538,632 2,957,141 2,381,546 2,341,061 2,316,685Total Liabilities 6,261,788 5,803,867 5,362,930 5,466,365 5,595,805Minority Interest 678 100 682 699 718Shareholders Equity 3,410,857 4,261,267 4,366,252 4,506,468 4,660,790Total Liabilities + Equity 9,674,000 10,065,334 9,729,863 9,973,531 10,257,314EBITDA / Fin. Expenses 3.2 2.9 3.3 4.0 4.4Financial Debt /EBITDA 5.4 4.1 3.4 3.3 3.0Financial Debt /Equity 1.0 0.7 0.5 0.5 0.5ROAE 7.9% 6.0% 4.1% 5.4% 5.7%ROAA 2.8% 2.3% 1.8% 2.4% 2.6%ROIC* 6.8% 6.5% 5.5% 5.4% 5.8%
CLP mn 2012 2013 2014E 2015E 2016EInitial Cash 175,950 305,888 221,296 217,063 224,206Cash from Operations -1,154,147 213,498 924,131 586,981 642,455CAPEX -572,931 -331,746 -218,994 -349,515 -386,422Changes in Financial Debt 1,395,459 -581,491 -575,595 -40,484 -24,376Div idends (Paid) Received -53,259 -58,263 -67,555 -95,246 -104,942Taxes -109,190 -96,158 -66,219 -94,594 -115,892Changes in Equity 624,007 769,569 0 0 0Final Cash 305,888 221,296 217,063 224,206 235,028Change in Cash 129,938 -84,592 -4,232 7,142 10,823Sources: Company Reports and Credicorp Capital; E Credicorp Capital Estimates; *Revalue Adj.
Controller 60%
Float 40%
Chile 38%
Argentina 25%
Brazil 19%
Peru 8%
Colombia 10%
Chile 55%
Argentina 30%
Brazil 5%
Peru 6%
Colombia 4%
130

2013 2014E 2015E 2016EFV/EBITDA 7.3 9.4 8.6 3.6P/E 14.0 18.2 17.6 6.9P/CF 8.6 nm nm 2.4P/BV 2.1 1.9 1.7 1.4Div . Yield 0.0% 0.0% 0.0% 1.1%Sources: Company Reports and Credicorp Capital
Peru Industry:
MiningRating:
UperfCerro VerdeLow Cu grades have arrived to stay
Hector Collantes+(511) 416 3333 Ext 33052
Investment Thesis Stock Data
• We keep our UNDERPERFORM rating and reduce our 2015YETP to USD21.00, as lower output at still weak copper prices cast ashadow over cost control. The average copper head grade touched0.44% in 1H14 (from 0.56% a year ago), while Cu grade in reservesis 0.37%. Copper production has, accordingly, fallen three years in arow (-7% CAGR). We now model a 0.44% Cu grade that could resultoptimistic.
• Total copper output will increase 125% by 2016 due toconcentrator expansion that will triple sulfides milling capacity (to360,000 tpd, USD4.60bn capex) but double copper output (to556,000 MT, including 41,000 MT from oxides). We expect theUSD1.8bn debt facility to be fully drawn by 2015. The resultingconcentrator, amongst the largest worldwide, will allow stable costs.
• Cerro Verde works on maintaining local support by treatingArequipa’s waste water that will be used in its expansion. Besides, afavorable tax stability agreement with the Government is valid aslong as the large scale expansion continues.
• Risks to our thesis: Cerro Verde’s appeal against a USD153mntax ruling may fail (<1% of 2014 profits), Cu grades could fall faster.
Price Chart (USD) and Volumes (USD mn)
Valuation• Our 2015 YE TP is based on a 31-year DCF valuation using a cost
of equity of 13.1% in nominal, USD terms.
• Shares are trading at 17.8x 2015E P/E, which seems high (35%higher than copper mining peers) considering disappointing recentgrowth. In FV/EBITDA terms, shares are trading at 2015E 7.8x, a22% premium to peers.
Valuation Summary
P/E 12M Forward FV/EBITDA 12M Forward Relative Valuation
Southern Copper
First Quantum
Freeport McMoRan
Cerro VerdeAntofagasta
0
5
10
15
20
25
0 5 10
P/E
2015
E
FV/EBITDA 2015E
0
5
10
15
20
25
30
Oct-05 Oct-08 Oct-11 Oct-140
5
10
15
20
Oct-05 Oct-08 Oct-11 Oct-14
Andean Equities Guide, 2015
0
1
2
3
70
80
90
100
110
120
Oct-13 Feb-14 Jun-14 Oct-14
USD
m
Cerro Verde IGBVL
Ticker cverdec1 pePrice (USD) 24.30LTM Range (USD) 19.00 - 27.05Target (USD) 21.00Total Return -14%Market Cap (USD mn) 8,506Shares Outstanding (mn) 350Free Float 46%ADTV (USD mn) 0.2
131

Cerro VerdeCompany Description
Cerro Verde is an open pit copper and molybdenum complex majorityowned and operated by Freeport-McMoRan (53.56% stake) with minorityparticipation of Sumitomo and Buenaventura. It is the third copper producerin Peru with operations in Arequipa (southern Peru). Copper concentratesare the major component of its sales, followed by cathodes.
Ownership Income Statement
Sales Breakdown by Metal Balance Sheet
Reserves Breakdown by Metal
Cash Flow
Management
CEO: Jeffrey MonteithCFO: Steve PalmerAccounting Manager: Jean Paul Casaswww.fcx.com/operations/Peru_Arequipa
Andean Equities Guide, 2015
Freeport 54%
Sumi tomo 21%
Buena ventura
18%
Float 7%
Copper -Concentr
72%
Copper -Cathodes
23%
Moly -Concentr
4%
Copper Sulfides
79%
Copper Oxides 14%
Moly Sulfides
7%
132
USD mn 2012 2013 2014E 2015E 2016ERevenues 2,127 1,811 1,609 1,668 3,548EBIT 1,235 948 734 816 2,045EBITDA 1,331 1,057 876 958 2,295Net Income 784 613 467 482 1,235EPS (USD) 2.24 1.75 1.34 1.38 3.53EBIT Margin 58.1% 52.3% 45.6% 48.9% 57.6%EBITDA Margin 62.6% 58.4% 54.4% 57.4% 64.7%Net Margin 36.9% 33.9% 29.0% 28.9% 34.8%
USD mn 2012 2013 2014E 2015E 2016ECash & Equivalents 1,428 824 529 572 971Total Current Assets 1,985 1,621 1,236 1,305 2,531Total Assets 4,043 4,668 5,780 7,305 8,527Current Liabilities 272 277 283 273 458Financial Debt 0 0 630 1,695 1,356Total Liabilities 593 605 1,250 2,292 2,375Minority Interest 0 0 0 0 0Shareholders Equity 3,450 4,063 4,530 5,012 6,151Total Liabilities + Equity 4,043 4,668 5,780 7,305 8,527EBITDA / Fin. Expenses 262.8 -3156.3 51.9 27.6 78.1Financial Debt /EBITDA 0.0 0.0 0.7 1.8 0.6Financial Debt /Equity 0.0 0.0 0.1 0.3 0.2ROAE 22.7% 16.3% 10.9% 10.1% 22.1%ROAA 19.4% 14.1% 8.9% 7.4% 15.6%ROIC 47.4% 23.4% 12.2% 10.3% 21.9%
USD mn 2012 2013 2014E 2015E 2016EInitial Cash 1,384 1,428 824 529 572Cash from Operations 866 470 723 627 1,025CAPEX -832 -1,073 -1,649 -1,649 -190Changes in Financial Debt 0 0 630 1,065 -339Div idends (Paid) Received 0 0 0 0 -96Financial&Investing, others 10 0 0 0 0Changes in Equity 0 0 0 0 0Final Cash 1,428 824 529 572 971Change in Cash 44 -603 -296 43 399Sources: Company Reports and Credicorp Capital; E Credicorp Capital Estimates
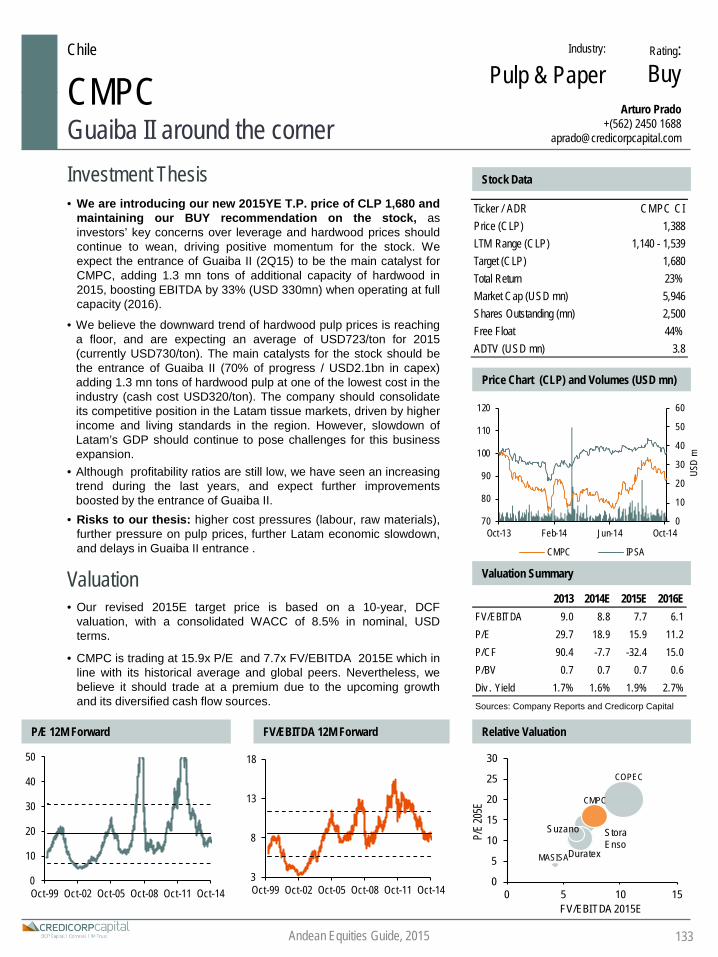
Chile Industry: Rating:BuyCMPC
Guaiba II around the cornerArturo Prado
+(562) 2450 1688 [email protected]
Investment Thesis Stock Data
• We are introducing our new 2015YE T.P. price of CLP 1,680 andmaintaining our BUY recommendation on the stock, asinvestors’ key concerns over leverage and hardwood prices shouldcontinue to wean, driving positive momentum for the stock. Weexpect the entrance of Guaiba II (2Q15) to be the main catalyst forCMPC, adding 1.3 mn tons of additional capacity of hardwood in2015, boosting EBITDA by 33% (USD 330mn) when operating at fullcapacity (2016).
• We believe the downward trend of hardwood pulp prices is reachinga floor, and are expecting an average of USD723/ton for 2015(currently USD730/ton). The main catalysts for the stock should bethe entrance of Guaiba II (70% of progress / USD2.1bn in capex)adding 1.3 mn tons of hardwood pulp at one of the lowest cost in theindustry (cash cost USD320/ton). The company should consolidateits competitive position in the Latam tissue markets, driven by higherincome and living standards in the region. However, slowdown ofLatam’s GDP should continue to pose challenges for this businessexpansion.
• Although profitability ratios are still low, we have seen an increasingtrend during the last years, and expect further improvementsboosted by the entrance of Guaiba II.
• Risks to our thesis: higher cost pressures (labour, raw materials),further pressure on pulp prices, further Latam economic slowdown,and delays in Guaiba II entrance .
Price Chart (CLP) and Volumes (USD mn)
Valuation• Our revised 2015E target price is based on a 10-year, DCF
valuation, with a consolidated WACC of 8.5% in nominal, USDterms.
• CMPC is trading at 15.9x P/E and 7.7x FV/EBITDA 2015E which inline with its historical average and global peers. Nevertheless, webelieve it should trade at a premium due to the upcoming growthand its diversified cash flow sources.
Valuation Summary
P/E 12M Forward FV/EBITDA 12M Forward Relative Valuation
0
10
20
30
40
50
Oct-99 Oct-02 Oct-05 Oct-08 Oct-11 Oct-143
8
13
18
Oct-99 Oct-02 Oct-05 Oct-08 Oct-11 Oct-14
Ticker / ADR CMPC CIPrice (CLP) 1,388LTM Range (CLP) 1,140 - 1,539Target (CLP) 1,680Total Return 23%Market Cap (USD mn) 5,946Shares Outstanding (mn) 2,500Free Float 44%ADTV (USD mn) 3.8
COPEC
MASISA
Suzano Stora Enso
Duratex
CMPC
0
5
10
15
20
25
30
0 5 10 15
P/E 2
05E
FV/EBITDA 2015E
0
10
20
30
40
50
60
70
80
90
100
110
120
Oct-13 Feb-14 Jun-14 Oct-14
USD
m
CMPC IPSA
2013 2014E 2015E 2016EFV/EBITDA 9.0 8.8 7.7 6.1P/E 29.7 18.9 15.9 11.2P/CF 90.4 -7.7 -32.4 15.0P/BV 0.7 0.7 0.7 0.6Div . Yield 1.7% 1.6% 1.9% 2.7%Sources: Company Reports and Credicorp Capital
Andean Equities Guide, 2015 133
Pulp & Paper
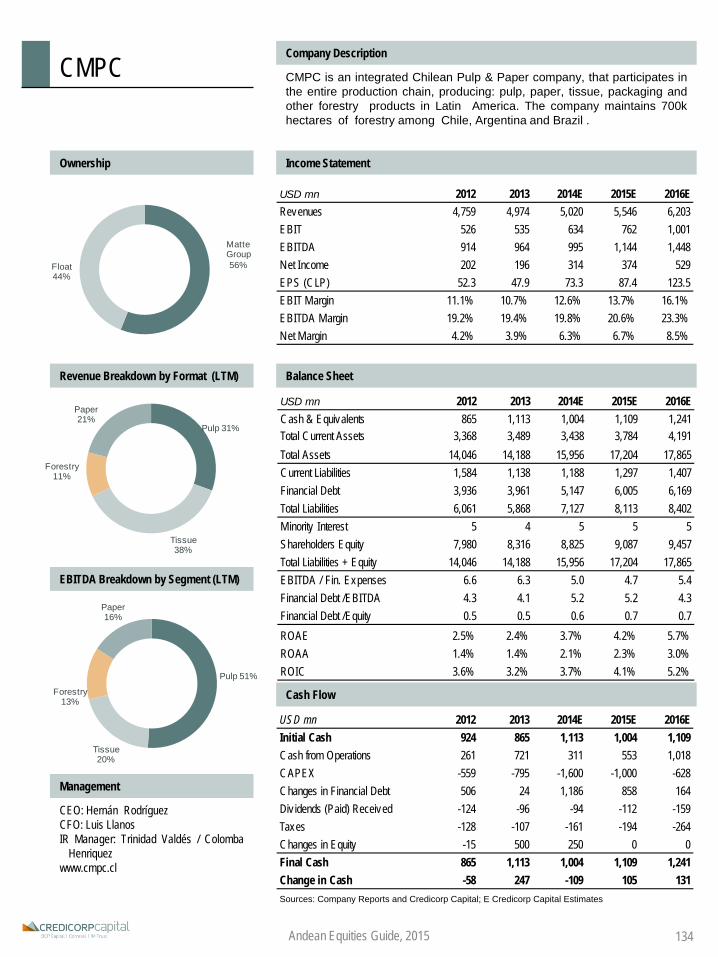
USD mn 2012 2013 2014E 2015E 2016ECash & Equivalents 865 1,113 1,004 1,109 1,241Total Current Assets 3,368 3,489 3,438 3,784 4,191Total Assets 14,046 14,188 15,956 17,204 17,865Current Liabilities 1,584 1,138 1,188 1,297 1,407Financial Debt 3,936 3,961 5,147 6,005 6,169Total Liabilities 6,061 5,868 7,127 8,113 8,402Minority Interest 5 4 5 5 5Shareholders Equity 7,980 8,316 8,825 9,087 9,457Total Liabilities + Equity 14,046 14,188 15,956 17,204 17,865EBITDA / Fin. Expenses 6.6 6.3 5.0 4.7 5.4Financial Debt /EBITDA 4.3 4.1 5.2 5.2 4.3Financial Debt /Equity 0.5 0.5 0.6 0.7 0.7ROAE 2.5% 2.4% 3.7% 4.2% 5.7%ROAA 1.4% 1.4% 2.1% 2.3% 3.0%ROIC 3.6% 3.2% 3.7% 4.1% 5.2%
CMPCCompany Description
CMPC is an integrated Chilean Pulp & Paper company, that participates inthe entire production chain, producing: pulp, paper, tissue, packaging andother forestry products in Latin America. The company maintains 700khectares of forestry among Chile, Argentina and Brazil .
Ownership Income Statement
Revenue Breakdown by Format (LTM) Balance Sheet
EBITDA Breakdown by Segment (LTM)
Cash Flow
Management
CEO: Hernán RodríguezCFO: Luis LlanosIR Manager: Trinidad Valdés / Colomba
Henriquezwww.cmpc.cl
Pulp 51%
Tissue 20%
Forestry 13%
Paper 16%
Andean Equities Guide, 2015
Matte Group 56%Float
44%
Pulp 31%
Tissue 38%
Forestry 11%
Paper 21%
USD mn 2012 2013 2014E 2015E 2016ERevenues 4,759 4,974 5,020 5,546 6,203EBIT 526 535 634 762 1,001EBITDA 914 964 995 1,144 1,448Net Income 202 196 314 374 529EPS (CLP) 52.3 47.9 73.3 87.4 123.5EBIT Margin 11.1% 10.7% 12.6% 13.7% 16.1%EBITDA Margin 19.2% 19.4% 19.8% 20.6% 23.3%Net Margin 4.2% 3.9% 6.3% 6.7% 8.5%
USD mn 2012 2013 2014E 2015E 2016EInitial Cash 924 865 1,113 1,004 1,109Cash from Operations 261 721 311 553 1,018CAPEX -559 -795 -1,600 -1,000 -628Changes in Financial Debt 506 24 1,186 858 164Div idends (Paid) Received -124 -96 -94 -112 -159Taxes -128 -107 -161 -194 -264Changes in Equity -15 500 250 0 0Final Cash 865 1,113 1,004 1,109 1,241Change in Cash -58 247 -109 105 131Sources: Company Reports and Credicorp Capital; E Credicorp Capital Estimates
134
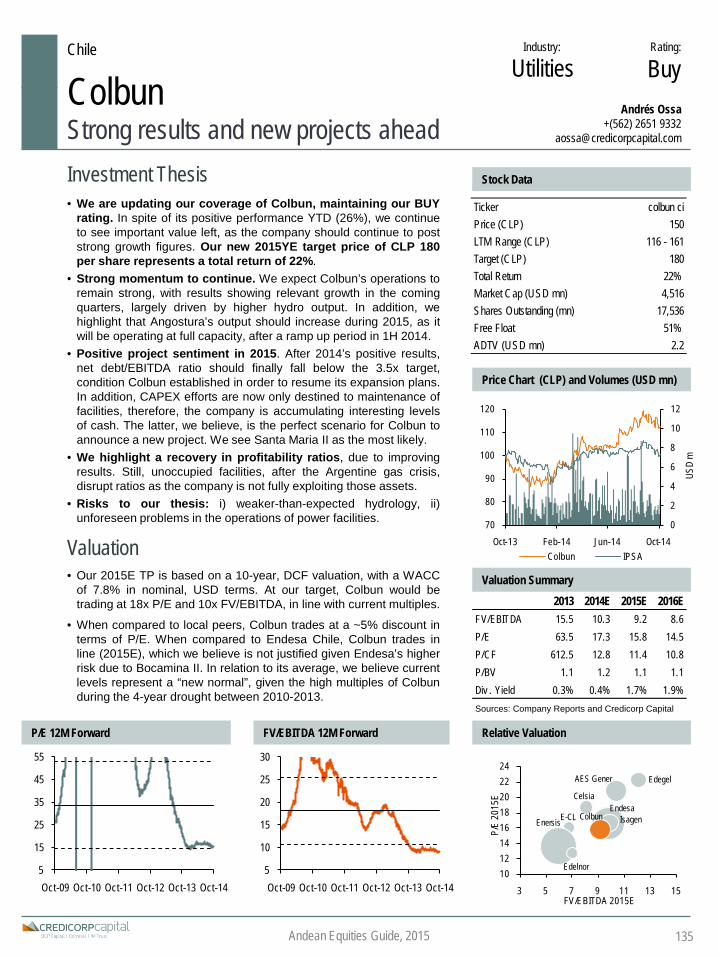
5
15
25
35
45
55
Oct-09 Oct-10 Oct-11 Oct-12 Oct-13 Oct-145
10
15
20
25
30
Oct-09 Oct-10 Oct-11 Oct-12 Oct-13 Oct-14
EndesaE-CL
Celsia
IsagenColbun
Edegel
Enersis
AES Gener
Edelnor1012141618202224
3 5 7 9 11 13 15
P/E
2015
E
FV/EBITDA 2015E
Chile Industry: Rating:
BuyColbunStrong results and new projects ahead
Andrés Ossa+(562) 2651 9332
Investment Thesis Stock Data
• We are updating our coverage of Colbun, maintaining our BUYrating. In spite of its positive performance YTD (26%), we continueto see important value left, as the company should continue to poststrong growth figures. Our new 2015YE target price of CLP 180per share represents a total return of 22%.
• Strong momentum to continue. We expect Colbun’s operations toremain strong, with results showing relevant growth in the comingquarters, largely driven by higher hydro output. In addition, wehighlight that Angostura’s output should increase during 2015, as itwill be operating at full capacity, after a ramp up period in 1H 2014.
• Positive project sentiment in 2015. After 2014’s positive results,net debt/EBITDA ratio should finally fall below the 3.5x target,condition Colbun established in order to resume its expansion plans.In addition, CAPEX efforts are now only destined to maintenance offacilities, therefore, the company is accumulating interesting levelsof cash. The latter, we believe, is the perfect scenario for Colbun toannounce a new project. We see Santa Maria II as the most likely.
• We highlight a recovery in profitability ratios, due to improvingresults. Still, unoccupied facilities, after the Argentine gas crisis,disrupt ratios as the company is not fully exploiting those assets.
• Risks to our thesis: i) weaker-than-expected hydrology, ii)unforeseen problems in the operations of power facilities.
Price Chart (CLP) and Volumes (USD mn)
Valuation• Our 2015E TP is based on a 10-year, DCF valuation, with a WACC
of 7.8% in nominal, USD terms. At our target, Colbun would betrading at 18x P/E and 10x FV/EBITDA, in line with current multiples.
• When compared to local peers, Colbun trades at a ~5% discount interms of P/E. When compared to Endesa Chile, Colbun trades inline (2015E), which we believe is not justified given Endesa’s higherrisk due to Bocamina II. In relation to its average, we believe currentlevels represent a “new normal”, given the high multiples of Colbunduring the 4-year drought between 2010-2013.
Valuation Summary
P/E 12M Forward FV/EBITDA 12M Forward Relative Valuation
2013 2014E 2015E 2016EFV/EBITDA 15.5 10.3 9.2 8.6P/E 63.5 17.3 15.8 14.5P/CF 612.5 12.8 11.4 10.8P/BV 1.1 1.2 1.1 1.1Div . Yield 0.3% 0.4% 1.7% 1.9%Sources: Company Reports and Credicorp Capital
Andean Equities Guide, 2015
Utilities
Ticker colbun ciPrice (CLP) 150LTM Range (CLP) 116 - 161Target (CLP) 180Total Return 22%Market Cap (USD mn) 4,516Shares Outstanding (mn) 17,536Free Float 51%ADTV (USD mn) 2.2
0
2
4
6
8
10
12
70
80
90
100
110
120
Oct-13 Feb-14 Jun-14 Oct-14
USD
m
Colbun IPSA
135

ColbunCompany Description
Colbun is the second largest generation company in the central grid ofChile, with nearly 20% of market share. With an installed capacity of 1,567MW of hydro generation and 1,689 MW of thermo generation, the companyowns 23 power units along the center and south of Chile.
Ownership Income Statement
Installed capacity by Technology Balance Sheet
Revenue breakdown by client (2014E)
Cash Flow
Management
CEO: Thomas KellerCFO: Sebastian MoragaIR Manager: Miguel AlarconIR: Maria Elena Palmawww.colbun.cl
Andean Equities Guide, 2015
Matte Group49%
Angelini Group10%
Pension Funds18%
Others23%
Hydro48%
Coal11%
LNG35%
Diesel6%
Regulated47%
Free36%
Spot4%
Others13%
136
USD mn 2012 2013 2014E 2015E 2016ECash & Equivalents 266 260 644 720 768Total Current Assets 789 744 1,124 1,197 1,243Total Assets 6,003 6,058 6,467 6,492 6,484Current Liabilities 551 342 338 336 334Financial Debt 1,726 1,703 1,922 1,757 1,548Total Liabilities 2,491 2,502 2,669 2,486 2,252Minority Interest 0 0 0 0 0Shareholders Equity 3,513 3,556 3,798 4,006 4,232Total Liabilities + Equity 6,003 6,058 6,467 6,492 6,484EBITDA / Fin. Expenses 10.3 7.8 9.0 8.7 10.9Financial Debt /EBITDA 6.1 4.9 3.4 2.8 2.3Financial Debt /Equity 0.5 0.5 0.5 0.4 0.4ROAE 1.4% 1.8% 7.1% 7.3% 7.6%ROAA 0.8% 1.0% 4.2% 4.4% 4.8%ROIC 1.3% 2.0% 6.1% 6.8% 7.3%
USD mn 2012 2013 2014E 2015E 2016ERevenues 1,409 1,696 1,569 1,536 1,482EBIT 148 190 382 441 479EBITDA 284 350 564 630 672Net Income 49 63 261 286 312EPS (CLP) 1.6 2.1 8.7 9.5 10.4EBIT Margin 10.5% 11.2% 24.4% 28.7% 32.3%EBITDA Margin 20.1% 20.7% 35.9% 41.0% 45.3%Net Margin 3.5% 3.7% 16.6% 18.6% 21.0%
USD mn 2012 2013 2014E 2015E 2016EInitial Cash 296 266 260 644 720Cash from Operations 280 423 390 550 593CAPEX -490 -339 -145 -148 -151Changes in Financial Debt 229 -23 219 -165 -209Div idends (Paid) Received 0 -13 -19 -78 -86Taxes -64 -56 -61 -83 -98Changes in Equity 15 2 0 0 0Final Cash 266 260 644 720 768Change in Cash -30 -5 384 75 48Sources: Company Reports and Credicorp Capital; E Credicorp Capital Estimates

10
15
20
25
30
35
Oct-05 Oct-08 Oct-11 Oct-1410
13
16
19
22
Oct-05 Oct-08 Oct-11 Oct-14
2013 2014E 2015E 2016EFV/EBITDA 17.5 13.2 12.5 11.6P/E 22.2 17.8 16.8 16.3P/CF -48.9 31.7 30.6 31.5P/BV 1.7 1.8 1.7 1.6Div . Yield 1.6% 1.6% 2.2% 2.4%Sources: Company Reports and Credicorp Capital
Chile Industry: Rating:BuyConcha y Toro
A good year that will continueTomás Sanhueza+(562) 2446 1751
Investment Thesis Stock Data
• We maintain our Buy recommendation on Concha y Toro, andintroduce our new 2015YE TP of CLP 1,320, while dropping our2014 TP of 1,150. 2014 was a turning point for the company, whichbenefited from strong supply conditions in Chile. Our constructiveview looking forward should be supported by favorable FX, lowerwine costs and higher export volumes.
• Positive scenario for Concha y Toro should continue. Strongindustry inventories offer limited risk in terms of wine costs. Weexpect costs to remain flat, regardless of the lower productivity seenin the 2014’s harvest. Export volumes should continue on theirupward trend as main export markets, such as USA, UK andEurope, are recovering from a deceleration period.
• Concha y Toro continues to reinforce its distribution networkand brand equity. Between September and October 2014, thecompany associated with companies in Canada and Japan todistribute their wines in these new markets. In the USA, Fetzer hasnot performed as expected, but we believe it is due to the industry’sslow penetration due to its operative framework; however, it alsoadds stability and potential growth to its operations in the long term.
• Risks to our thesis: Downside risk is mainly due to depreciation ofmain export currencies and the outcome of the 2015 harvest.
Price Chart (CLP) and Volumes (USD mn)
Valuation• In terms of forward multiples, Concha y Toro is trading at 16.8x
P/E 2015E and 12.5x FV/EBITDA 2015E, both at a discount to 3-year averages, providing an attractive entry point.
• Shares have historically traded at a premium compared to its peers,reflecting a strong global network and brand equity. In terms of P/Eand FV/EBITDA, the premium is in line with historical levels.
Valuation Summary
P/E 12M Forward FV/EBITDA 12M Forward Relative Valuation
Andean Equities Guide, 2015
Ticker / ADR concha ci / vco usPrice (CLP) 1,121LTM Range (CLP) 917 - 1,200Target (CLP / USD) 1,320(loc) / 46.7 (ADR)Total Return 20%Market Cap (USD mn) 1,435Shares Outstanding (mn) 747Free Float 60%ADTV (USD mn) 1.6 (loc) - 0.2 (ADR)
Food & Beverages
02468101214
708090
100110120130140
Oct-13 Feb-14 Jun-14 Oct-14
USD
m
Concha y Toro IPSA
Concha y ToroBaron de
Ley Yantai Changy u
Treasury Wine
Estates
10131619222528
7 9 11 13 15
P / E
2015
E
EV / EBITDA 2015E
Constellation
137

CLP mn 2012 2013 2014E 2015E 2016ECash & Equivalents 70,954 21,082 36,731 45,712 55,310Total Current Assets 431,686 419,497 467,305 506,472 548,020Total Assets 854,669 850,154 923,820 977,790 1,034,494Current Liabilities 224,132 197,161 226,759 245,923 264,759Financial Debt 272,725 253,579 269,427 276,009 284,773Total Liabilities 430,219 420,059 459,832 482,793 507,903Minority Interest 573 879 956 1,011 1,070Shareholders Equity 423,877 429,215 463,032 493,986 525,521Total Liabilities + Equity 854,669 850,154 923,820 977,790 1,034,494EBITDA / Fin. Expenses 7.0 6.4 9.3 9.8 10.8Financial Debt /EBITDA 5.1 4.6 3.2 3.1 3.0Financial Debt /Equity 0.6 0.6 0.6 0.6 0.5ROAE 7.1% 7.8% 10.6% 10.4% 10.1%ROAA 3.5% 3.9% 5.3% 5.2% 5.1%ROIC 4.4% 4.5% 7.3% 7.3% 7.2%
Concha y ToroCompany Description
Concha y Toro is the largest Chilean wine company, a leader in thedomestic market and exports, selling 30.4 million cases in 2013. It currentlyowns vineyards in Chile, Argentina and the USA, with focus on exports anda strong distribution network. It also owns commercial subsidiaries in Brazil,UK, Nordic countries, South Africa, Mexico, Canada and Singapore.
Ownership Income Statement
Revenue Breakdown (LTM) Balance Sheet
Volume Breakdown (LTM)
Cash Flow
Management
CEO: Eduardo GuilisastiCFO: Osvaldo SolarIR Manager: Patricio Garretonwww.conchaytoro.com
Andean Equities Guide, 2015
Controlling Group 40.1%
Pension Funds 8.3%
Brokerage H, Mutual F 20.2%
ADRs 2.6%
Others 28.8%
Export Markets (*)
72.1%
Chile 11.8%
Argentina 5.6%
USA 10.5%
Export Markets (*)
67.6%
Chile 21.1%
Argentina 4.6%
USA 6.7%
(*) Export markets includes exports to third parties and sales through the company’s distribution subsidiaries.
(*) Export markets includes exports to third parties and sales through the company’s distribution subsidiaries.
138
CLP mn 2012 2013 2014E 2015E 2016EInitial Cash 29,192 70,954 21,082 36,731 45,712Cash from Operations 57,869 19,780 51,727 62,537 68,537CAPEX -29,056 -28,592 -24,602 -26,613 -29,987Changes in Financial Debt 42,089 -19,146 15,848 6,582 8,764Div idends (Paid) Received -19,422 -12,027 -13,268 -18,834 -19,915Taxes -9,718 -9,888 -14,056 -14,691 -17,801Changes in Equity 0 0 0 0 0Final Cash 70,954 21,082 36,731 45,712 55,310Change in Cash 41,762 -49,872 15,649 8,981 9,598Sources: Company Reports and Credicorp Capital; E Credicorp Capital Estimates
CLP mn 2012 2013 2014E 2015E 2016ERevenues 450,546 475,620 583,029 626,189 666,380EBIT 35,993 36,622 63,955 67,057 71,171EBITDA 53,682 55,383 83,636 88,347 95,160Net Income 30,023 33,171 47,085 49,787 51,451EPS (CLP) 40.2 44.4 63.0 66.6 68.9EBIT Margin 8.0% 7.7% 11.0% 10.7% 10.7%EBITDA Margin 11.9% 11.6% 14.3% 14.1% 14.3%Net Margin 6.7% 7.0% 8.1% 8.0% 7.7%

Chile Industry: Rating:
HoldCopecSlowdown in Terpel’s volumes
Arturo Prado+(562) 2450 1688
Investment Thesis Stock Data
• We are downgrading our recommendation of COPEC from Buyto Hold, introducing our new 2015YE T.P. of CLP 8,000. Althoughwe like the strong fundamentals of the company, its solid positionand diversified cash flow, we believe the negative macro scenario inChile, in addition to the slowdown in trend volumes in Terpel, couldnegatively impact the fuel’s division performance.
• The fuel division has been showing a slowdown in volumes growth,mainly, in Colombia , driven by delays in the country´s infrastructureinvestment program. In Chile, the retail and industrial segmentsshould be negatively affected by the slowdown of the Chileaneconomy.
• Arauco has been positively impacted by Fx depreciation and itsmajor exposure to softwood (62%). In 2015, volumes should beboosted by Montes del Plata operating at full capacity (650k tons).However, we expect the gap between both fibers to shrink andsoftwood prices to decrease (USD890/ tons). The panels business isbeing affected by aggressive competition in Brazil and therefrainment from purchasing SierraPine facilities (900k m3), after theacquisition was objected by the US antitrust authority.
• Risks to our thesis: weaker/stronger than expected pulp marketenvironment ii) weaker-than-expect Terpel’s volumes iii) weakdemand for wood products/panels in the US, Brazil and Europe.
Price Chart (CLP) and Volumes (USD mn)
Valuation• Our revised 2015E target price is based on a 10-year, SOTP DCF
valuation, with a consolidated WACC of % 8.1 in nominal, USDterms
• When compared to its peers, COPEC has always traded at ajustified premium, due to its diversified cash generation. Currentlythis premium is in line when compared to historical levels. Whencompared to its own history, Copec is trading at fair multiples.
Valuation Summary
P/E 12M Forward FV/EBITDA 12M Forward Relative Valuation
0
10
20
30
40
50
Oct-99 Oct-02 Oct-05 Oct-08 Oct-11 Oct-140
5
10
15
20
25
Oct-99 Oct-02 Oct-05 Oct-08 Oct-11 Oct-14
Ticker / ADR Copec ciPrice (CLP) 6,889LTM Range (CLP) 6,339 - 7,664Target (CLP) 8,000Total Return 19%Market Cap (USD mn) 15,347Shares Outstanding (mn) 1,300Free Float 39%ADTV (USD mn) 6.5
CMPC
COPEC
MASISA
Suzano Stora Enso
Duratex
0
5
10
15
20
25
30
0 5 10 15
P/E
2015
E
FV/EBITDA 2015E
0
20
40
60
80
100
120
85
90
95
100
105
110
Oct-13 Feb-14 Jun-14 Oct-14
USD
m
Copec IPSA
Andean Equities Guide, 2015 139
2013 2014E 2015E 2016EFV/EBITDA 12.2 11.0 10.3 9.7P/E 22.1 16.3 20.0 18.6P/CF 36.1 23.8 33.1 25.6P/BV 1.5 1.4 1.4 1.3Div . Yield 2.8% 2.0% 2.5% 2.0%Sources: Company Reports and Credicorp Capital
Pulp & Paper
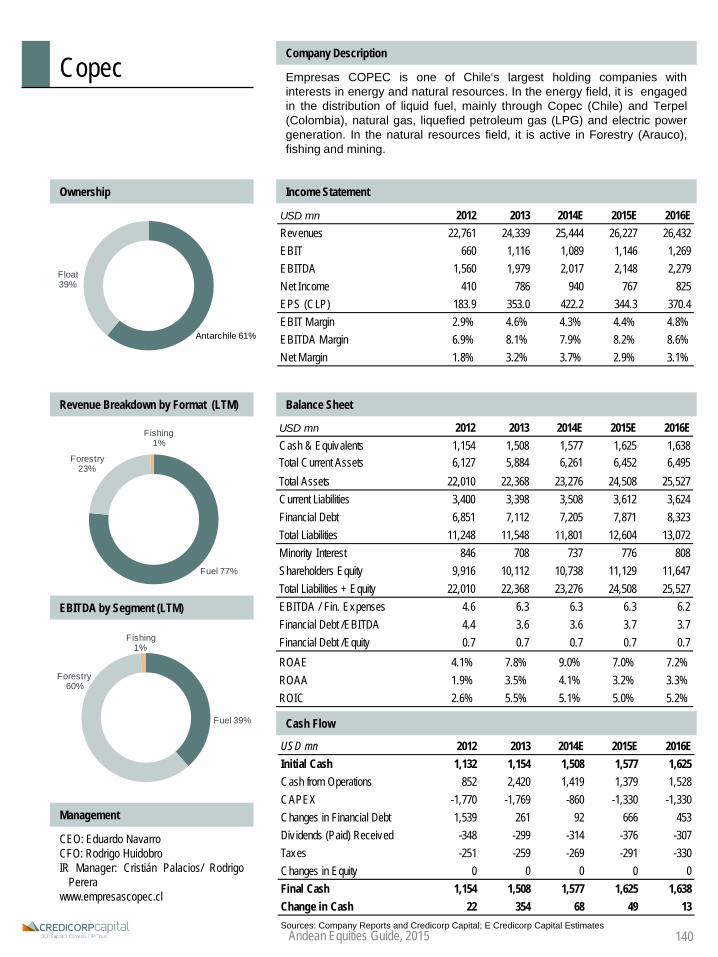
USD mn 2012 2013 2014E 2015E 2016EInitial Cash 1,132 1,154 1,508 1,577 1,625Cash from Operations 852 2,420 1,419 1,379 1,528CAPEX -1,770 -1,769 -860 -1,330 -1,330Changes in Financial Debt 1,539 261 92 666 453Div idends (Paid) Received -348 -299 -314 -376 -307Taxes -251 -259 -269 -291 -330Changes in Equity 0 0 0 0 0Final Cash 1,154 1,508 1,577 1,625 1,638Change in Cash 22 354 68 49 13Sources: Company Reports and Credicorp Capital; E Credicorp Capital Estimates
USD mn 2012 2013 2014E 2015E 2016ECash & Equivalents 1,154 1,508 1,577 1,625 1,638Total Current Assets 6,127 5,884 6,261 6,452 6,495Total Assets 22,010 22,368 23,276 24,508 25,527Current Liabilities 3,400 3,398 3,508 3,612 3,624Financial Debt 6,851 7,112 7,205 7,871 8,323Total Liabilities 11,248 11,548 11,801 12,604 13,072Minority Interest 846 708 737 776 808Shareholders Equity 9,916 10,112 10,738 11,129 11,647Total Liabilities + Equity 22,010 22,368 23,276 24,508 25,527EBITDA / Fin. Expenses 4.6 6.3 6.3 6.3 6.2Financial Debt /EBITDA 4.4 3.6 3.6 3.7 3.7Financial Debt /Equity 0.7 0.7 0.7 0.7 0.7ROAE 4.1% 7.8% 9.0% 7.0% 7.2%ROAA 1.9% 3.5% 4.1% 3.2% 3.3%ROIC 2.6% 5.5% 5.1% 5.0% 5.2%
Fuel 39%
Forestry 60%
Fishing 1%
CopecCompany Description
Empresas COPEC is one of Chile‘s largest holding companies withinterests in energy and natural resources. In the energy field, it is engagedin the distribution of liquid fuel, mainly through Copec (Chile) and Terpel(Colombia), natural gas, liquefied petroleum gas (LPG) and electric powergeneration. In the natural resources field, it is active in Forestry (Arauco),fishing and mining.
Ownership Income Statement
Revenue Breakdown by Format (LTM) Balance Sheet
EBITDA by Segment (LTM)
Cash Flow
Management
CEO: Eduardo NavarroCFO: Rodrigo HuidobroIR Manager: Cristián Palacios/ Rodrigo
Pererawww.empresascopec.cl
Float 39%
Antarchile 61%
Fuel 77%
Forestry 23%
Fishing 1%
USD mn 2012 2013 2014E 2015E 2016ERevenues 22,761 24,339 25,444 26,227 26,432EBIT 660 1,116 1,089 1,146 1,269EBITDA 1,560 1,979 2,017 2,148 2,279Net Income 410 786 940 767 825EPS (CLP) 183.9 353.0 422.2 344.3 370.4EBIT Margin 2.9% 4.6% 4.3% 4.4% 4.8%EBITDA Margin 6.9% 8.1% 7.9% 8.2% 8.6%Net Margin 1.8% 3.2% 3.7% 2.9% 3.1%
Andean Equities Guide, 2015 140

Colombia Industry:Conglomerates
Rating:
HoldCorficolombianaRoad under construction
Juan Dominguez+(571) 339 4400 Ext 1026
Investment Thesis Stock Data
• Corficolombiana is the leading player in the boominginfrastructure sector in Colombia. This year, the company wasawarded the Conexión Pacífico 1 road concession (capex of COP2.3 tn), and the extension of Ruta del Sol Sector 2 (capex of COP1.2 tn). We also included in our model the final section of the Bogotá– Villavicencio road (capex of COP 1.9 tn). However, the expectedtotal return, although attractive, is in line with that of the COLCAPindex. Therefore, we keep on HOLD, setting a new 2015YE T.P. atCOP 44,000 (from COP 45,500), including the tax reform.
• The corporation is prepared for this boom as leverage is low,and the equity and soundness of the controlling group is acompetitive advantage in the financial structuring of green-fields.
• Corficolombiana provides an attractive exposure to bothgrowth assets and stable revenue. Revenue from matureinvestments supports other equity investments in their growthphases, such as road concessions in earlier construction stages.The most relevant of this mature investments is Promigas, which isengaged in gas transportation / distribution, a natural monopoly.
• Risks to our thesis. The most relevant upside risk is the awardingof new infrastructure concessions. Downside risks include capexoverruns or delays in the construction phases of concessions. Otherrisks are market biases on complexity, changes on regulation, andvolatility in debt markets affecting NIM.
Valuation• Our new 2015E T.P. is based on a SOTP of the different equity
investments plus the value generated by the direct financialbusiness of the corporation. Shares trade fairly including the finalsection of Bogotá-Villavicencio. Including dividends (cash andstock, as we are assuming dilution) implies a return in line with themarket.
Price Chart (COP) and Volumes (USD mn)
Valuation Summary
P/B 12M Forward P/E 12M Forward 2015E Value Breakdown
Andean Equities Guide, 2015
Ticker corficol cbPrice (COP) 39,000LTM Range (COP) 32,550 - 40,086Target 44,000Total Return 20%Market Cap (USD mn) 4,020Shares Outstanding (mn) 211Free Float 42%ADTV (USD mn) 1.4
2013 2014E 2015E 2016EP/E 14.6 18.0 16.3 14.1P/BV 2.0 1.8 1.6 1.4ROAE 15.8% 10.7% 10.6% 10.7%Div . Yield 1.7% 1.8% 1.8% 2.1%Sources: Company Reports and Credicorp Capital
0.5
0.8
1.1
1.4
1.7
2.0
2.3
Oct-07 Oct-09 Oct-11 Oct-130
4
8
12
16
20
Oct-07 Oct-09 Oct-11 Oct-13
012345678910
70
80
90
100
110
Oct-13 Feb-14 Jun-14 Oct-14
USD
mn
Corficol COLCAP
141
Infrastructure31%
Power & Gas38%
Hotels6%
0%0%0%Financials
4%
Agribusiness7%
Other investments and funding
4%
Direct operation
10%

CorficolombianaCompany Description
Corficolombiana is a merchant bank that invests in strategic sectors of theColombian economy, including infrastructure, energy, hotels, agribusinessand finance, and also provides treasury, investment banking and privatebanking services. It is considered the real sector investment vehicle ofGrupo Aval, leading financial conglomerate in Colombia.
Equity Investments
Ownership Income Statement
Management
CEO: José Elías MeloExecutive VP: Juan Carlos PáezIR Manager: María José Nietowww.corficolombiana.com
Andean Equities Guide, 2015
Promigas Episol Pajonales Estelar Leasing CFC(45%) (100%) (95%) (85%) (95%)
EEB Epiandes Unipalma Santamar Fiduciaria CFC(4%) (98%) (55%) (85%) (95%)
Concecol PISA Pizano Banco CFC Panama(100%) (88%) (40%) (100%)
Gascop Aerocali Casa de Bolsa(83%) (50%) (39%)
Gas Natural Tibitoc(2%) (33%)
Financials
Corficolombiana
Power & Gas Infrastructure Agribusiness Hotels
Banco de Bogotá
38%
Banco de Occidente
14%
Banco Popular
6%
Pension funds5%
Other common
31%
Pref. Shares
6%
COP mn 2012 2013 2014E 2015E 2016ENet interest income 62,819 76,691 94,625 104,226 120,197Net fee income 17,556 8,430 16,242 20,165 21,718Operating expenses -52,531 -61,535 -63,222 -67,218 -71,251Div idend income 428,808 491,518 490,864 477,551 548,603
Promigas 60,996 240,450 141,701 158,510 183,694Episol 47,390 53,127 50,511 52,892 81,839Epiandes 57,269 75,715 110,963 69,890 71,797PISA 46,326 38,631 49,820 51,778 56,051
Net income 395,179 557,709 472,801 545,767 649,416EPS (COP) 2,032 2,717 2,222 2,456 2,827ROAE 13.6% 15.8% 10.7% 10.6% 10.7%ROAA 4.6% 5.5% 4.2% 4.3% 4.5%Sources: Company Reports and Credicorp Capital; E Credicorp Capital Estimates
142

Chile Industry:
BanksRating:
BuyCorpbancaAll-in on accretive merger
Juan Dominguez+(571) 339 4400 Ext 1026
Investment Thesis Stock Data
• Corpbanca is an attractive bet on a merged scenario with ItaúChile. Shares are trading at discounted 2016E P/E ratios while itsPEG ratio (EPS 2014E-16E) is the lowest in Chile, despite theoutperformance in recent months. We maintain our BUY and adjustour 2015YE T.P. to CLP 8.8 (from CLP 8.5), including the tax reformin Colombia and fine-tuning our assumptions on cost synergies.
• The transaction looks accretive as the new bank will benefitfrom larger scale (closes the market share gap in loans with BCI).We increased our assumption on cost-side synergies to USD 80mnper year, which mostly comprised savings in personnel andadministrative expenses. A better cost of funding could be anadditional catalyst not included yet in our model. ROAE shouldrebound to 15% in the long-run, with a cost-to-income ratio at 46%.Notable improvements should become apparent in 2016.
• The Colombian operation is a buffer for the moderation of theChilean economy. Corpbanca has managed to defend its marketshare (~6%) in an attractive, Colombian industry. According toguidance, synergies (mostly cost and tax synergies) have beencaptured as scheduled, although integration costs are offsetting thebenefits. Still, the cost-to income ratio in Colombia has improved to55.5% in 2Q14, down from 71.6% in 4Q13.
• Risks to our thesis: The most relevant downside risks include thefaliure to close the transaction with Itaú, issues preventing synergiesboth in Colombia and Chile, and regulatory changes.
Valuation• Our 2015E target price is based on a DDM valuation (Ke @
11.6%, CLP terms; exit P/B of 1.5x). Our T.P. at CLP 8.8 implies a11.8x 2016E P/E and 1.6x 2015E P/B. Shares are trading at thelowest 2016 P/E, and at an attractive PEG ratio vs. Chileanpeers. 2015 P/E is not as attractive due to integration costs.
Price Chart (CLP) and Volumes (USD mn)
Valuation Summary
P/B 12M Forward P/E 12M Forward Relative Valuation
Andean Equities Guide, 2015
Ticker corpbanc ci / bca usPrice (CLP) 7.40LTM Range (CLP) 5.61 - 7.79Target 8.8 (loc) / 22.8 (ADR)Total Return 22%Market Cap (USD mn) 4,320Shares Outstanding (mn) 340,358Free Float 42%ADTV (USD mn) 4.7
2013 2014E 2015E 2016EP/E 15.9 12.5 13.2 9.9P/B 1.7 1.6 1.3 1.2ROAE 13.2% 13.5% 12.8% 12.7%Div . Yield 2.4% 3.5% 2.7% 5.8%Sources: Company Reports and Credicorp Capital
0
10
20
30
40
50
60
80
90
100
110
120
130
140
Oct-13 Feb-14 Jun-14 Oct-14
USD
mn
Corpbanca IPSA
0.5
1.0
1.5
2.0
2.5
3.0
Oct-04 Oct-07 Oct-10 Oct-13
4
9
14
19
24
Oct-04 Oct-07 Oct-10 Oct-13
Banco de Chile
Santander Chile
Corpbanca
DaviviendaBancolombia
Grupo AvalBogota
1.01.21.41.61.82.02.22.42.62.8
12% 14% 16% 18% 20% 22% 24%
2015
E P/
B
2015E ROAE
143

CorpbancaCompany Description
Corpbanca is the 4th largest private bank in Chile with a 7% share in loansand a strong presence in corporates. Through the acquisitions of SantanderColombia (2011) and Helm Bank (2012), Corpbanca has become the 5thlargest bank in Colombia with a 6% share. In 2014, Corpbanca and ItaúChile announced a business combination, which will grant control to Itaú.
Ownership Income Statement
Loans Breakdown (as of Jun-14) Balance Sheet
Funding structure (as of Jun-14)
Ratios
Management
CEO: Fernando MassúCFO: Eugenio GigogneIR Manager: Claudia Labbéwww.corpbanca.cl
Andean Equities Guide, 2015
CLP bn 2012 2013 2014E 2015E 2016ECash & interbank deposits 644 1,024 1,191 1,923 2,144Investment portfolio 1,667 2,136 2,434 3,589 4,022Gross loans 10,161 13,086 15,387 23,352 26,028Total assets 13,528 17,490 20,484 30,649 34,045Total deposits 8,795 10,789 12,644 19,247 21,453Financial obligations 2,874 3,705 4,363 6,336 7,062Total Liabilities 12,532 15,773 18,556 27,739 30,918Minority interest 54 306 352 5 6Shareholders' equity 942 1,411 1,576 2,906 3,121Total liabilities + equity 13,528 17,490 20,484 30,649 34,045
(%) 2012 2013 2014E 2015E 2016ENIM 2.6% 3.4% 3.9% 4.0% 3.7%Fee ratio 19.2% 16.8% 16.5% 18.4% 18.3%Cost-to-income ratio -56.7% -52.9% -53.0% -53.0% -49.4%NPL / Loans 1.2% 1.1% 1.0% 1.1% 1.1%LLP / Loans 1.6% 2.4% 2.3% 2.0% 2.0%Cost of credit risk -0.6% -0.9% -0.9% -1.1% -1.0%LLP / NPL 140% 213% 230% 186% 186%Deposit-to-loans ratio 87% 82% 82% 82% 82%Tier 1 ratio 8.2% 9.4% 8.9% 11.1% 10.7%BIS ratio 11.1% 13.4% 12.5% 15.5% 15.0%ROAE 14.4% 13.2% 13.5% 12.8% 12.7%ROAA 1.1% 1.0% 1.1% 1.1% 1.2%Sources: Company Reports and Credicorp Capital; E Credicorp Capital Estimates
Saieh Group50%
IFC5%
Santo Domingo
Group3%
Free-float42%
Wholesale Chile44%
Retail Chile15%
Wholesale Colombia
28%
Retail Colombia
13%
Demand deposits
23%
Time deposits
and saving accounts
44%
Interbank and
financial obligations
8%
Bonds14%
Equity + min. int.
10%
CLP bn 2012 2013 2014E 2015E 2016ENet interest income 257 458 622 871 1,035Net fee income 86 118 154 234 274Operating income 447 704 937 1,270 1,498Prov ision expenses -51 -101 -135 -205 -238Operating expenses -253 -372 -497 -673 -740Net income 120 155 202 287 382EPS (CLP) 0.42 0.46 0.59 0.56 0.75
144

0
10
20
30
40
50
60
Oct-11 Oct-12 Oct-13 Oct-142468
10121416182022
Oct-11 Oct-12 Oct-13 Oct-14
Chile Industry: Rating:HoldCruz Blanca
Looking towards the finish lineTomás Sanhueza+(562) 2446 1751
Investment Thesis Stock Data
• We are upgrading our recommendation on Cruz Blanca to Hold,introducing a new 2015YE TP of CLP 564 and dropping our2014 TP of 430. We do not like the company’s high exposure to theinsurance business in Chile, which offers important regulatory risk,but expect weak growth in medical providers to offset theseheadwinds.
• In terms of fundamentals, we believe that the company willcontinue with volatile results. We believe the insurance segmentwill continue to face pressures. While investments in new medicalcenters and clinics should increase competitiveness, slowmaturation will likely pressure margins in the near term.
• We believe the Put option held by Said group will be exercisedin February 2016, triggering a tender offer for 100% of shares atCLP 525 + CPI. We estimate that the strike price should rise to CLP564 (4.2 CPI for 2014 and 3.2 CPI for 2015), which is in turn ourtarget price.
• Risks to our thesis: Upside risk: i) regulatory changes in insurancebusiness, ii) higher-than-expected claims rate.
Price Chart (CLP) and Volumes (USD mn)
Valuation• In terms of forward multiples, Cruz Blanca is trading at 18.7x P/E
2015E and 8.7x FV/EBITDA, representing a discount versushistorical average though justified by lack of earnings visibility.
• When compared to peers, Cruz Blanca is trading at a premium interms of P/E and FV/EBITDA. We justify this premium due to the putoption held by the Said group, which has driven the stock price.
Valuation Summary
P/E 12M Forward FV/EBITDA 12M Forward Relative Valuation
Andean Equities Guide, 2015
2013 2014E 2015E 2016EFV/EBITDA 13.3 9.6 8.7 8.4P/E 28.4 17.5 18.7 23.9P/CF 136.3 -16.9 -109.1 11.2P/BV 1.6 1.6 1.5 1.5Div . Yield 2.9% 1.4% 2.4% 2.3%Sources: Company Reports and Credicorp Capital
Ticker cruzblan ciPrice (CLP) 490LTM Range (CLP) 327 - 501Target (CLP) 564Total Return 18%Market Cap (USD mn) 536Shares Outstanding (mn) 638Free Float 44%ADTV (USD mn) 0.6
Health Services
02468101214
708090
100110120130140
Oct-13 Feb-14 Jun-14 Oct-14
USD
m
Cruz Blanca IPSA
UNH
Cruz Blanca
Fleury
DASA
11
13
15
17
19
21
6 7 8 9 10 11
P / E
2015
E
EV / EBITDA 2015E
Banmedica
Sonic Healthcare
145

CLP mn 2012 2013 2014E 2015E 2016ECash & Equivalents 60,746 55,254 47,638 59,042 82,570Total Current Assets 111,130 120,440 112,676 130,704 164,652Total Assets 463,112 481,977 549,622 630,410 712,558Current Liabilities 129,719 142,451 146,423 163,176 190,418Financial Debt 132,737 150,831 199,647 254,182 300,667Total Liabilities 272,898 289,623 342,204 411,973 486,189Minority Interest 14,181 11,739 13,386 15,354 17,355Shareholders Equity 176,033 180,615 194,032 203,083 209,015Total Liabilities + Equity 463,112 481,977 549,622 630,410 712,558EBITDA / Fin. Expenses 9.0 5.5 6.7 4.9 5.3Financial Debt /EBITDA 3.2 4.9 4.3 4.9 5.6Financial Debt /Equity 0.8 0.8 1.0 1.3 1.4ROAE 11.3% 5.8% 9.5% 8.4% 6.4%ROAA 4.3% 2.2% 3.5% 2.8% 2.0%ROIC 10.8% 5.7% 8.0% 7.1% 5.4%
Cruz BlancaCompany Description
Cruz Blanca is a leading company in the Health Care industry highlightingits leading position as a private service provider and the second largestChilean Isapre (Insurance Business), with more than 340,000 policyholders. The inpatient business has 3 hospitals in three different Chileanregions, while Outpatient business has 25 centers.
Ownership Income Statement
Revenue per Division (LTM) Balance Sheet
EBITDA per Division (LTM)
Cash Flow
Management
CEO: Andrés VárasCFO: Marcelo BermudezIR: Sebastián Ahumadawww.cruzblancasalud.cl
Andean Equities Guide, 2015
Bupa Sanitas 56.4%
Said Group 17.4%
Pension Funds 2.7%
Mutual Funds 1.0%
Others 22.6%
Outpatient 21.3%
Hospitals 10.1%
Insurance 68.7%
Outpatient 44.4%
Hospitals 22.7%
Insurance 32.9%
146
CLP mn 2012 2013 2014E 2015E 2016EInitial Cash 92,536 60,746 55,254 47,638 59,042Cash from Operations 9,146 12,958 15,210 23,833 19,384CAPEX -34,189 -25,065 -60,585 -52,060 -28,183Changes in Financial Debt 5,468 18,093 48,816 54,535 46,485Div idends (Paid) Received -8,555 -8,554 -4,429 -7,654 -7,165Taxes -3,661 -2,925 -6,628 -7,250 -6,992Changes in Equity 0 0 0 0 0Final Cash 60,746 55,254 47,638 59,042 82,570Change in Cash -31,791 -5,492 -7,616 11,404 23,529Sources: Company Reports and Credicorp Capital; E Credicorp Capital Estimates
CLP mn 2012 2013 2014E 2015E 2016ERevenues 471,327 532,049 595,477 656,020 750,639EBIT 30,609 17,985 31,562 33,720 29,135EBITDA 41,099 30,707 46,965 51,913 53,682Net Income 19,944 10,327 17,846 16,706 13,097EPS (CLP) 31.3 16.2 28.0 26.2 20.5EBIT Margin 6.5% 3.4% 5.3% 5.1% 3.9%EBITDA Margin 8.7% 5.8% 7.9% 7.9% 7.2%Net Margin 4.2% 1.9% 3.0% 2.5% 1.7%
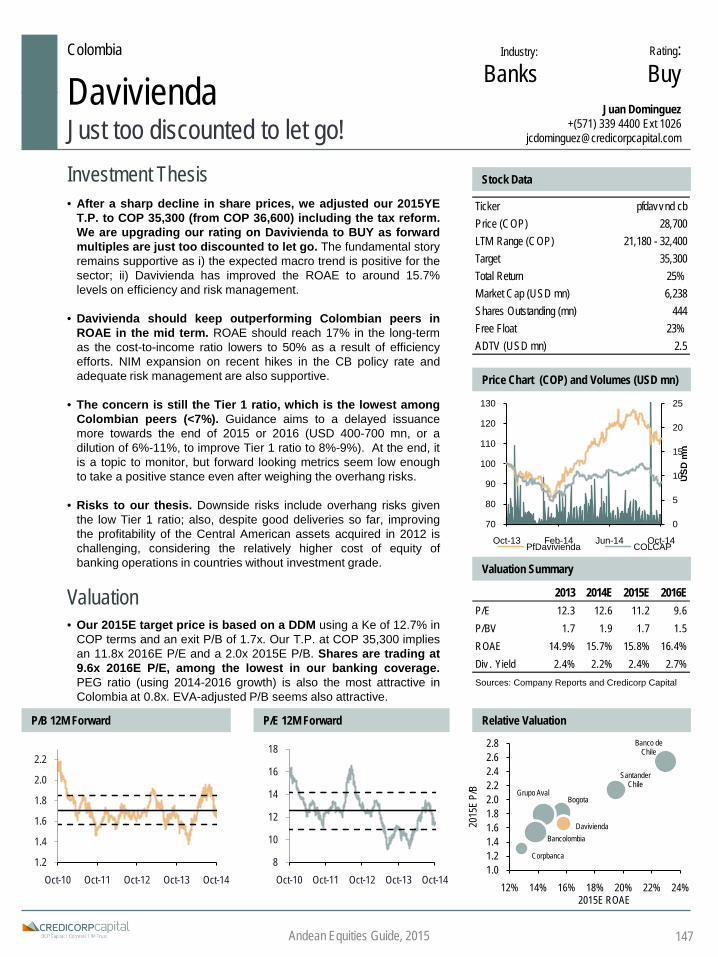
Colombia Industry:
BanksRating:BuyDavivienda
Just too discounted to let go!Juan Dominguez
+(571) 339 4400 Ext 1026 [email protected]
Investment Thesis Stock Data
• After a sharp decline in share prices, we adjusted our 2015YET.P. to COP 35,300 (from COP 36,600) including the tax reform.We are upgrading our rating on Davivienda to BUY as forwardmultiples are just too discounted to let go. The fundamental storyremains supportive as i) the expected macro trend is positive for thesector; ii) Davivienda has improved the ROAE to around 15.7%levels on efficiency and risk management.
• Davivienda should keep outperforming Colombian peers inROAE in the mid term. ROAE should reach 17% in the long-termas the cost-to-income ratio lowers to 50% as a result of efficiencyefforts. NIM expansion on recent hikes in the CB policy rate andadequate risk management are also supportive.
• The concern is still the Tier 1 ratio, which is the lowest amongColombian peers (<7%). Guidance aims to a delayed issuancemore towards the end of 2015 or 2016 (USD 400-700 mn, or adilution of 6%-11%, to improve Tier 1 ratio to 8%-9%). At the end, itis a topic to monitor, but forward looking metrics seem low enoughto take a positive stance even after weighing the overhang risks.
• Risks to our thesis. Downside risks include overhang risks giventhe low Tier 1 ratio; also, despite good deliveries so far, improvingthe profitability of the Central American assets acquired in 2012 ischallenging, considering the relatively higher cost of equity ofbanking operations in countries without investment grade.
Valuation• Our 2015E target price is based on a DDM using a Ke of 12.7% in
COP terms and an exit P/B of 1.7x. Our T.P. at COP 35,300 impliesan 11.8x 2016E P/E and a 2.0x 2015E P/B. Shares are trading at9.6x 2016E P/E, among the lowest in our banking coverage.PEG ratio (using 2014-2016 growth) is also the most attractive inColombia at 0.8x. EVA-adjusted P/B seems also attractive.
Price Chart (COP) and Volumes (USD mn)
Valuation Summary
P/B 12M Forward P/E 12M Forward Relative Valuation
Andean Equities Guide, 2015
Ticker pfdavvnd cbPrice (COP) 28,700LTM Range (COP) 21,180 - 32,400Target 35,300Total Return 25%Market Cap (USD mn) 6,238Shares Outstanding (mn) 444Free Float 23%ADTV (USD mn) 2.5
2013 2014E 2015E 2016EP/E 12.3 12.6 11.2 9.6P/BV 1.7 1.9 1.7 1.5ROAE 14.9% 15.7% 15.8% 16.4%Div . Yield 2.4% 2.2% 2.4% 2.7%Sources: Company Reports and Credicorp Capital
0
5
10
15
20
25
70
80
90
100
110
120
130
Oct-13 Feb-14 Jun-14 Oct-14
USD
mn
PfDavivienda COLCAP
1.2
1.4
1.6
1.8
2.0
2.2
Oct-10 Oct-11 Oct-12 Oct-13 Oct-148
10
12
14
16
18
Oct-10 Oct-11 Oct-12 Oct-13 Oct-14
Banco de Chile
Santander Chile
Corpbanca
Bogota
Davivienda
Grupo Aval
Bancolombia
1.01.21.41.61.82.02.22.42.62.8
12% 14% 16% 18% 20% 22% 24%
2015
E P/
B
2015E ROAE
147

DaviviendaCompany Description
Davivienda has consolidated its position as the third largest bank inColombia (12% market share in loans) as a result of several M&A activity,and forayed in Central America with the acquisition of HSBC's banks andinsurance assets in Costa Rica, El Salvador and Honduras (2012). It has astrong presence in retail lending and the construction sector. It is controlledby Grupo Bolívar, one of the most important groups in Colombia, withinterests in construction, insurance, hospitality and banking services.
Ownership Income Statement
Loans Breakdown (as of Jun-14) Balance Sheet
Funding structure (as of Jun-14)
Ratios
Management
CEO: Efraín ForeroCFO: Ricardo LeónIR Manager: Julián Naranjohttps://linea.davivienda.com
Andean Equities Guide, 2015
Grupo Bolívar
56%
Grupo Cusezar
18%
IFC 2%
Other common
2%
Preferred shares 23%
Corporate50%
Consumer27%
Mortgages (inc
housing leasing)
23%
Micro-finance
0%
Demand deposits
43%
Time deposits
24%
Interbank and
financial obligations
10%
Bonds12%
Equity + min. int.
11% (%) 2012 2013 2014E 2015E 2016ENIM 7.8% 7.1% 7.0% 7.2% 7.3%Fee ratio 20.8% 23.0% 21.8% 19.9% 19.2%Cost-to-income ratio -51.1% -55.1% -54.6% -52.2% -51.6%NPL / Loans 1.8% 1.6% 1.7% 1.7% 1.7%LLP / Loans 4.7% 4.1% 3.9% 3.9% 3.9%Cost of credit risk -2.8% -2.2% -1.8% -2.0% -2.0%LLP / NPL 258% 255% 230% 230% 230%Deposit-to-loans ratio 90% 90% 90% 91% 91%Tier 1 ratio 10.1% 7.0% 6.5% 6.7% 6.9%BIS ratio 15.2% 10.8% 10.4% 10.7% 11.1%ROAE 13.7% 14.9% 15.7% 15.8% 16.4%ROAA 1.7% 1.6% 1.7% 1.7% 1.7%Sources: Company Reports and Credicorp Capital; E Credicorp Capital Estimates
COP bn 2012 2013 2014E 2015E 2016ENet interest income 2,784 3,090 3,557 4,246 4,855Net fee income 765 951 1,005 1,077 1,184Operating income 3,683 4,134 4,617 5,423 6,151Prov ision expenses -850 -816 -791 -1,015 -1,136Operating expenses -1,881 -2,278 -2,519 -2,830 -3,176Net income 696 851 1,010 1,143 1,333EPS (COP) 1,567 1,916 2,273 2,573 3,000
COP bn 2012 2013 2014E 2015E 2016ECash & interbank deposits 4,245 4,997 5,446 6,277 7,044Investment portfolio 6,135 7,877 8,051 10,327 11,924Gross loans 34,440 41,132 47,503 53,820 60,401Total assets 47,122 56,374 63,463 72,902 81,869Total deposits 30,040 36,286 41,890 47,998 53,867Financial obligations 9,850 12,233 12,567 14,769 16,574Total Liabilities 41,694 50,255 56,593 65,186 73,157Minority interest 97 60 57 63 70Shareholders' equity 5,331 6,059 6,813 7,653 8,643Total liabilities + equity 47,122 56,374 63,463 72,902 81,869
148

EndesaE-CL
Celsia
IsagenColbun
Edegel
Enersis
Edelnor
AES Gener
1012141618202224
3 5 7 9 11 13 15
P/E
2015
E
FV/EBITDA 2015E
0
10
20
30
40
50
Oct-09 Oct-10 Oct-11 Oct-12 Oct-13 Oct-140
3
6
9
12
15
Oct-09 Oct-10 Oct-11 Oct-12 Oct-13 Oct-14
Chile Industry: Rating:
BuyE-CLWaiting for the line, great entry point
Andrés Ossa+(562) 2651 9332
Investment Thesis Stock Data
• We are updating our coverage of E-CL, maintaining our BUYrating and introducing our new 2015YE TP of CLP 995. Despitethe strong performance YTD (28%), we remain positive on the nameas we believe the value of the SIC-SING line is not fully priced-in.Additionally, the company has managed to stabilize its operatingresults, presenting important growth figures, with solid cost controls.
• SIC-SING line to be formally announced. While the company hasalready stated that the interconnection will be developed, we believethe market is waiting for the regulator to officially announce E-CL’sline as a trunk transmission line. This should occur towards the yearend (2014), in a transmission study to be published by the regulator.We are now including the SIC-SING line (50% of its equity value) inour TP, which adds CLP 55 per share, according to our calculations.
• Steady results, forget about one-timers. Last year the companypresented different non-recurrent charges. During 2014 there hasbeen no more one-timers and results have been consistentlyabove our expectations. In addition, the company is dealing withthe SING’s over-costs through an agreement with Gener, whilelower depreciation, due to a recalculation of the lifespan of somefacilities, will continue to positively impact E-CL going forward.
• Risks to our thesis: i) delays in SIC-SING project, ii) unforeseenproblems in power facilities, iii) higher over-costs in the SING grid.
Price Chart (CLP) and Volumes (USD mn)
Valuation• Our 2015YE TP of E-CL is based on a 10-year, DCF valuation, with
a WACC of 7.8% in nominal, USD terms. At our target, E-CL wouldtrade at 18x P/E and 8x FV/EVITDA, in line with its current multiples.
• When compared to its average, the company trades at a ~25%discount in terms of P/E and FV/EBITDA. We believe this discount isnot justified, given the company’s solid results over the past yearand its growth potential due to the SIC-SING project. Whencompared to peers, the company trades in line in terms of P/E, andat a ~20% discount in terms of FV/EBITDA. The latter is explainedby E-CL’s lower leverage.
Valuation Summary
P/E 12M Forward FV/EBITDA 12M Forward Relative Valuation
2013 2014E 2015E 2016EFV/EBITDA 8.1 7.0 6.7 6.4P/E 34.4 18.7 16.1 13.8P/CF 7.7 9.0 10.1 10.6P/BV 0.8 0.9 0.9 0.8Div . Yield 1.1% 2.6% 2.7% 3.1%Sources: Company Reports and Credicorp Capital
Andean Equities Guide, 2015
Utilities
Ticker ecl ciPrice (CLP) 841LTM Range (CLP) 634 - 877Target (CLP) 995Total Return 21%Market Cap (USD mn) 1,518Shares Outstanding (mn) 1,053Free Float 47%ADTV (USD mn) 1.9
0
4
8
12
16
20
80
90
100
110
120
Oct-13 Feb-14 Jun-14 Oct-14
USD
m
ECL IPSA
149
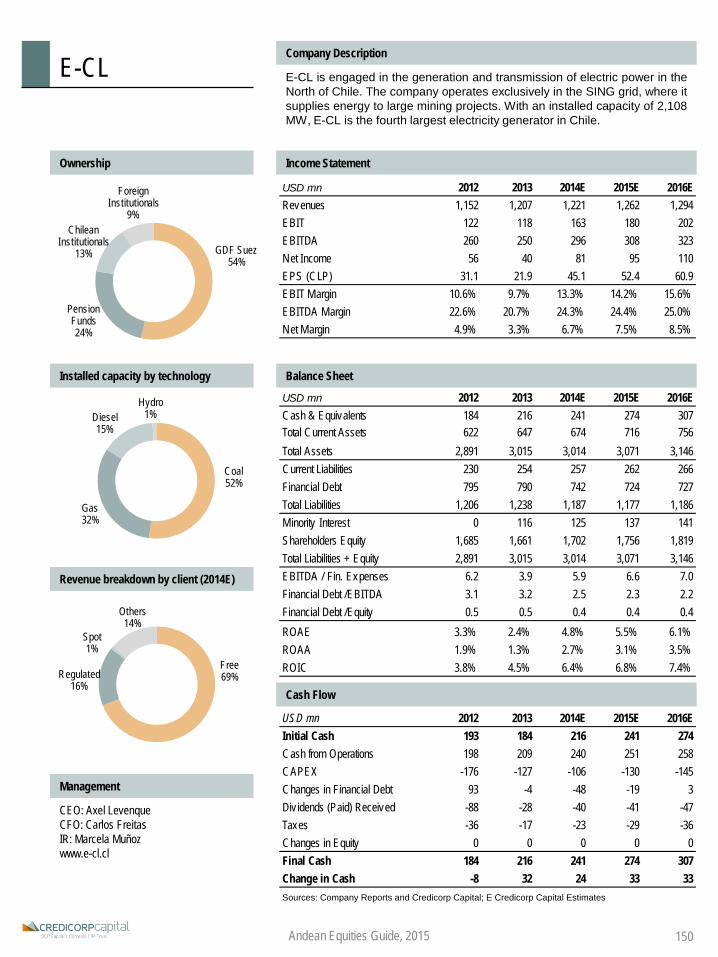
E-CLCompany Description
E-CL is engaged in the generation and transmission of electric power in theNorth of Chile. The company operates exclusively in the SING grid, where itsupplies energy to large mining projects. With an installed capacity of 2,108MW, E-CL is the fourth largest electricity generator in Chile.
Ownership Income Statement
Installed capacity by technology Balance Sheet
Revenue breakdown by client (2014E)
Cash Flow
Management
CEO: Axel LevenqueCFO: Carlos FreitasIR: Marcela Muñozwww.e-cl.cl
Andean Equities Guide, 2015
USD mn 2012 2013 2014E 2015E 2016ERevenues 1,152 1,207 1,221 1,262 1,294EBIT 122 118 163 180 202EBITDA 260 250 296 308 323Net Income 56 40 81 95 110EPS (CLP) 31.1 21.9 45.1 52.4 60.9EBIT Margin 10.6% 9.7% 13.3% 14.2% 15.6%EBITDA Margin 22.6% 20.7% 24.3% 24.4% 25.0%Net Margin 4.9% 3.3% 6.7% 7.5% 8.5%
USD mn 2012 2013 2014E 2015E 2016ECash & Equivalents 184 216 241 274 307Total Current Assets 622 647 674 716 756Total Assets 2,891 3,015 3,014 3,071 3,146Current Liabilities 230 254 257 262 266Financial Debt 795 790 742 724 727Total Liabilities 1,206 1,238 1,187 1,177 1,186Minority Interest 0 116 125 137 141Shareholders Equity 1,685 1,661 1,702 1,756 1,819Total Liabilities + Equity 2,891 3,015 3,014 3,071 3,146EBITDA / Fin. Expenses 6.2 3.9 5.9 6.6 7.0Financial Debt /EBITDA 3.1 3.2 2.5 2.3 2.2Financial Debt /Equity 0.5 0.5 0.4 0.4 0.4ROAE 3.3% 2.4% 4.8% 5.5% 6.1%ROAA 1.9% 1.3% 2.7% 3.1% 3.5%ROIC 3.8% 4.5% 6.4% 6.8% 7.4%
USD mn 2012 2013 2014E 2015E 2016EInitial Cash 193 184 216 241 274Cash from Operations 198 209 240 251 258CAPEX -176 -127 -106 -130 -145Changes in Financial Debt 93 -4 -48 -19 3Div idends (Paid) Received -88 -28 -40 -41 -47Taxes -36 -17 -23 -29 -36Changes in Equity 0 0 0 0 0Final Cash 184 216 241 274 307Change in Cash -8 32 24 33 33Sources: Company Reports and Credicorp Capital; E Credicorp Capital Estimates
GDF Suez54%
Pension Funds24%
Chilean Institutionals
13%
Foreign Institutionals
9%
Coal52%
Gas32%
Diesel15%
Hydro1%
Free69%Regulated
16%
Spot1%
Others14%
150
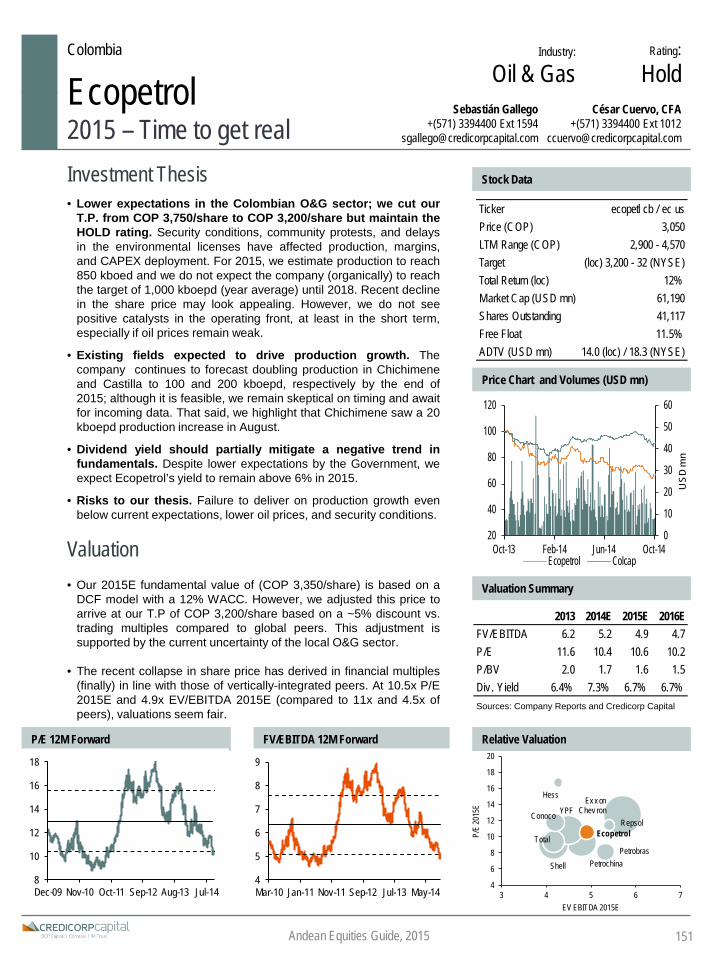
Colombia Industry:
Oil & Gas Rating:
HoldEcopetrol2015 – Time to get real
César Cuervo, CFA+(571) 3394400 Ext 1012
Investment Thesis Stock Data
• Lower expectations in the Colombian O&G sector; we cut ourT.P. from COP 3,750/share to COP 3,200/share but maintain theHOLD rating. Security conditions, community protests, and delaysin the environmental licenses have affected production, margins,and CAPEX deployment. For 2015, we estimate production to reach850 kboed and we do not expect the company (organically) to reachthe target of 1,000 kboepd (year average) until 2018. Recent declinein the share price may look appealing. However, we do not seepositive catalysts in the operating front, at least in the short term,especially if oil prices remain weak.
• Existing fields expected to drive production growth. Thecompany continues to forecast doubling production in Chichimeneand Castilla to 100 and 200 kboepd, respectively by the end of2015; although it is feasible, we remain skeptical on timing and awaitfor incoming data. That said, we highlight that Chichimene saw a 20kboepd production increase in August.
• Dividend yield should partially mitigate a negative trend infundamentals. Despite lower expectations by the Government, weexpect Ecopetrol’s yield to remain above 6% in 2015.
• Risks to our thesis. Failure to deliver on production growth evenbelow current expectations, lower oil prices, and security conditions.
Price Chart and Volumes (USD mn)
Valuation• Our 2015E fundamental value of (COP 3,350/share) is based on a
DCF model with a 12% WACC. However, we adjusted this price toarrive at our T.P of COP 3,200/share based on a ~5% discount vs.trading multiples compared to global peers. This adjustment issupported by the current uncertainty of the local O&G sector.
• The recent collapse in share price has derived in financial multiples(finally) in line with those of vertically-integrated peers. At 10.5x P/E2015E and 4.9x EV/EBITDA 2015E (compared to 11x and 4.5x ofpeers), valuations seem fair.
Valuation Summary
P/E 12M Forward FV/EBITDA 12M Forward Relative Valuation
8
10
12
14
16
18
Dec-09 Nov-10 Oct-11 Sep-12 Aug-13 Jul-144
5
6
7
8
9
Mar-10 Jan-11 Nov-11 Sep-12 Jul-13 May-14
Petrobras
Ex x on
PetrochinaShell
Total
Repsol
Hess
Conoco Chev ron
Ecopetrol
YPF
4
6
8
10
12
14
16
18
20
3 4 5 6 7
P/E
2015
E
EV EBITDA 2015E
Andean Equities Guide, 2015
0
10
20
30
40
50
60
20
40
60
80
100
120
Oct-13 Feb-14 Jun-14 Oct-14
USD
mn
Ecopetrol Colcap
Sebastián Gallego+(571) 3394400 Ext 1594
151
2013 2014E 2015E 2016EFV/EBITDA 6.2 5.2 4.9 4.7P/E 11.6 10.4 10.6 10.2P/BV 2.0 1.7 1.6 1.5Div. Yield 6.4% 7.3% 6.7% 6.7%Sources: Company Reports and Credicorp Capital
Ticker ecopetl cb / ec usPrice (COP) 3,050LTM Range (COP) 2,900 - 4,570Target (loc) 3,200 - 32 (NYSE)Total Return (loc) 12%Market Cap (USD mn) 61,190Shares Outstanding 41,117Free Float 11.5%ADTV (USD mn) 14.0 (loc) / 18.3 (NYSE)
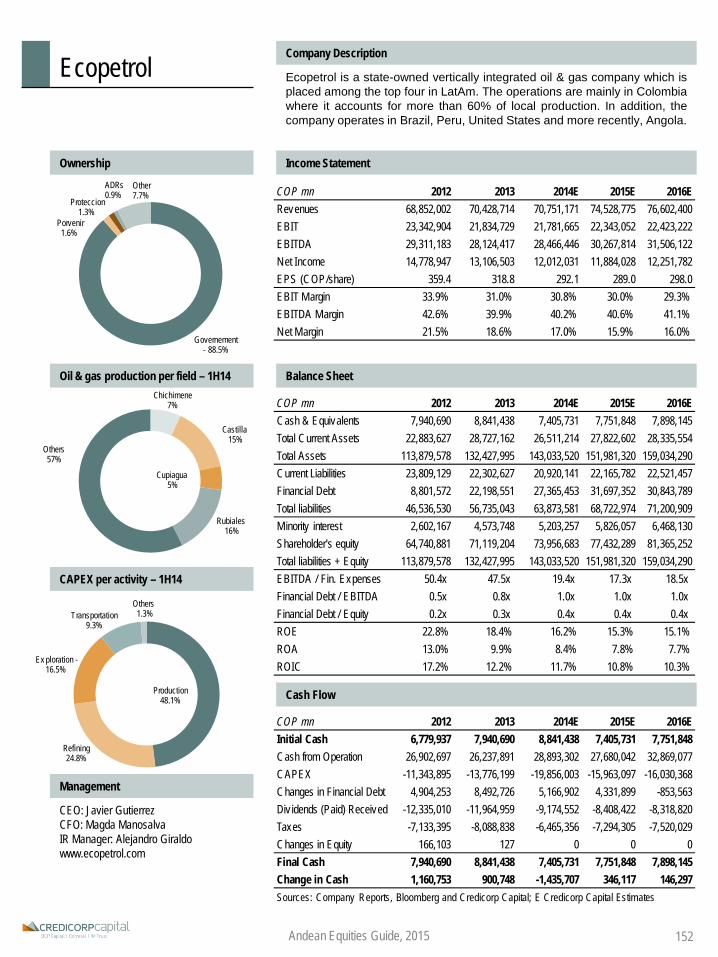
EcopetrolCompany Description
Ecopetrol is a state-owned vertically integrated oil & gas company which isplaced among the top four in LatAm. The operations are mainly in Colombiawhere it accounts for more than 60% of local production. In addition, thecompany operates in Brazil, Peru, United States and more recently, Angola.
Ownership Income Statement
Oil & gas production per field – 1H14 Balance Sheet
CAPEX per activity – 1H14
Cash Flow
Management
CEO: Javier GutierrezCFO: Magda ManosalvaIR Manager: Alejandro Giraldowww.ecopetrol.com
Andean Equities Guide, 2015
Governement - 88.5%
Porvenir1.6%
Proteccion1.3%
ADRs 0.9%
Other 7.7%
Chichimene 7%
Castilla15%
Cupiagua5%
Rubiales16%
Others57%
Production 48.1%
Refining 24.8%
Ex ploration -16.5%
Transportation 9.3%
Others1.3%
152
COP mn 2012 2013 2014E 2015E 2016ECash & Equivalents 7,940,690 8,841,438 7,405,731 7,751,848 7,898,145Total Current Assets 22,883,627 28,727,162 26,511,214 27,822,602 28,335,554Total Assets 113,879,578 132,427,995 143,033,520 151,981,320 159,034,290Current Liabilities 23,809,129 22,302,627 20,920,141 22,165,782 22,521,457Financial Debt 8,801,572 22,198,551 27,365,453 31,697,352 30,843,789Total liabilities 46,536,530 56,735,043 63,873,581 68,722,974 71,200,909Minority interest 2,602,167 4,573,748 5,203,257 5,826,057 6,468,130Shareholder's equity 64,740,881 71,119,204 73,956,683 77,432,289 81,365,252Total liabilities + Equity 113,879,578 132,427,995 143,033,520 151,981,320 159,034,290EBITDA / Fin. Expenses 50.4x 47.5x 19.4x 17.3x 18.5xFinancial Debt / EBITDA 0.5x 0.8x 1.0x 1.0x 1.0xFinancial Debt / Equity 0.2x 0.3x 0.4x 0.4x 0.4xROE 22.8% 18.4% 16.2% 15.3% 15.1%ROA 13.0% 9.9% 8.4% 7.8% 7.7%ROIC 17.2% 12.2% 11.7% 10.8% 10.3%
COP mn 2012 2013 2014E 2015E 2016ERevenues 68,852,002 70,428,714 70,751,171 74,528,775 76,602,400EBIT 23,342,904 21,834,729 21,781,665 22,343,052 22,423,222EBITDA 29,311,183 28,124,417 28,466,446 30,267,814 31,506,122Net Income 14,778,947 13,106,503 12,012,031 11,884,028 12,251,782EPS (COP/share) 359.4 318.8 292.1 289.0 298.0EBIT Margin 33.9% 31.0% 30.8% 30.0% 29.3%EBITDA Margin 42.6% 39.9% 40.2% 40.6% 41.1%Net Margin 21.5% 18.6% 17.0% 15.9% 16.0%
COP mn 2012 2013 2014E 2015E 2016EInitial Cash 6,779,937 7,940,690 8,841,438 7,405,731 7,751,848Cash from Operation 26,902,697 26,237,891 28,893,302 27,680,042 32,869,077CAPEX -11,343,895 -13,776,199 -19,856,003 -15,963,097 -16,030,368Changes in Financial Debt 4,904,253 8,492,726 5,166,902 4,331,899 -853,563Div idends (Paid) Received -12,335,010 -11,964,959 -9,174,552 -8,408,422 -8,318,820Taxes -7,133,395 -8,088,838 -6,465,356 -7,294,305 -7,520,029Changes in Equity 166,103 127 0 0 0Final Cash 7,940,690 8,841,438 7,405,731 7,751,848 7,898,145Change in Cash 1,160,753 900,748 -1,435,707 346,117 146,297Sources: Company Reports, Bloomberg and Credicorp Capital; E Credicorp Capital Estimates

2013 2014E 2015E 2016EFV/EBITDA 8.8 11.5 12.1 11.6P/E 13.3 19.1 22.2 22.4P/CF 12.8 53.5 n.m n.mP/BV 2.4 3.0 3.0 2.9Div . Yield 6.5% 4.5% 4.6% 3.8%Sources: Company Reports and Credicorp Capital
Peru Industry:
UtilitiesRating:
HoldEdegelSpread the wings
Fernando Pereda+(511) 416 3333 - Ext: 37856
Investment Thesis Stock Data
• We are reiterating our Hold rating on Edegel and setting a new2015YE TP of PEN 3.45, while dropping our 2014YE TP of PEN2.96. In our view, the company is a value play (strong fundamentals)in the Peruvian utilities industry; however, valuations limit upside.
• M&A noise has pressured share prices. Enersis acquired 39.0%of the shares of Generandes Perú, which owns 54.2% of Edegel’sshares for USD 413mn, from Inkia. Currently, Enersis consolidatesEdegel through Endesa Chile, owning 63% of total shares. The lattermeans that the operation will not have any impact on an operatinglevel for either Edegel or Enersis and will only be reflected onEnersis’ bottom line. Endesa Chile will be unaffected. After the deal,Enersis will directly and indirectly control 84% of Edegel.
• Upturn in thermal generation levels. The risk of insufficient supplyfor Edegel’s thermal generation is mitigated by long term contractswith the gas pipeline operator; nevertheless, we expect highernatural gas costs, which Edegel will pass through to its clients,increasing revenues and reducing margins.
• Risks to our thesis: Unfavorable hydrological conditions. Non-regulated clients cooling down.
Price Chart (PEN) and Volumes (USD mn)
Valuation• Valuations appear expensive, but Edegel’s flexibility to develop new
projects with its low debt structure and possible synergies with othersubsidiaries of Endesa and/or Enersis in Peru justify its currentprice. The shares are trading at 12.1x and 22.2x FV/EBITDA andP/E 2015, respectively, which is mostly above comparables and itshistorical levels.
• Our recommendation is based on a DCF model broken down bygeneration unit. EBITDA margins tend to decrease to 43.6% in 2015as thermal production increases and marginal generation cost rises.
Valuation Summary
P/E 12M Forward FV/EBITDA 12M Forward Relative Valuation
Andean Equities Guide, 2015
Ticker edegelc1 pePrice (PEN) 3.25LTM Range (PEN) 2.2 - 3.3Target (PEN) 3.45Total Return 11%Market Cap (USD mn) 2,568Shares Outstanding (mn) 2,294Free Float 16%ADTV (USD mn) 0.2
EndesaIsagen
Colbun
AesGener
Enersur Edegel
0
5
10
15
20
25
30
5 10 15
P/E
2015
E
FV/EBITDA 2015E
4
9
14
Oct-06 Oct-08 Oct-10 Oct-12 Oct-145
10
15
20
25
Oct-06 Oct-08 Oct-10 Oct-12 Oct-14
0
1
2
3
4
8090
100110120130140150
Oct-13 Feb-14 Jun-14 Oct-14
USD
m
Edegel IGBVL
153
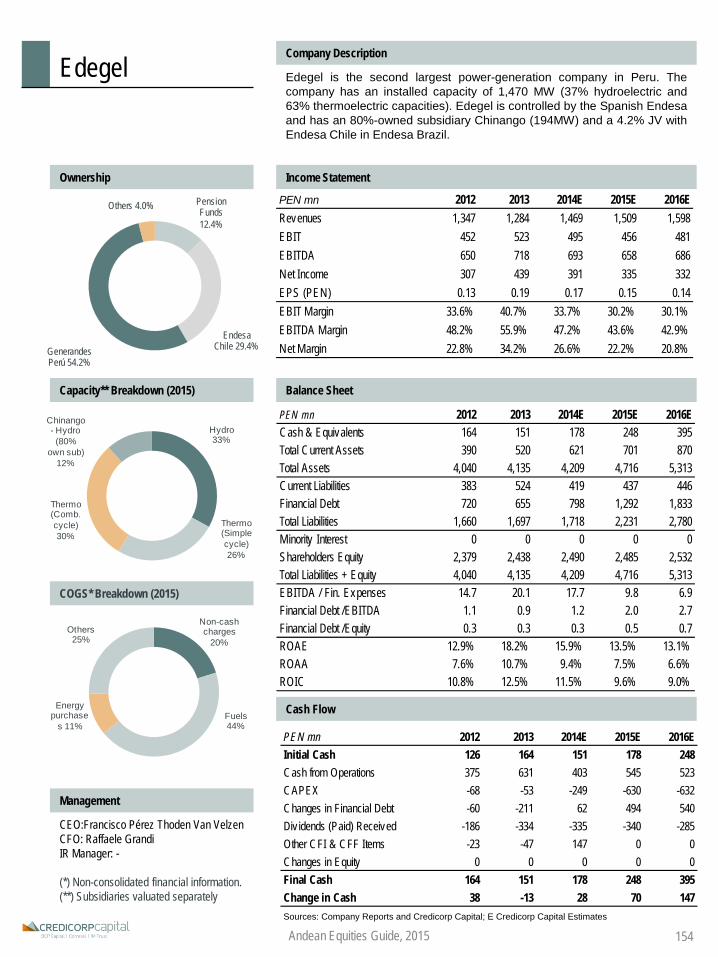
EdegelCompany Description
Edegel is the second largest power-generation company in Peru. Thecompany has an installed capacity of 1,470 MW (37% hydroelectric and63% thermoelectric capacities). Edegel is controlled by the Spanish Endesaand has an 80%-owned subsidiary Chinango (194MW) and a 4.2% JV withEndesa Chile in Endesa Brazil.
Ownership Income Statement
Capacity** Breakdown (2015) Balance Sheet
COGS* Breakdown (2015)
Cash Flow
Management
CEO:Francisco Pérez Thoden Van VelzenCFO: Raffaele GrandiIR Manager: -
(*) Non-consolidated financial information.(**) Subsidiaries valuated separately
Andean Equities Guide, 2015
PEN mn 2012 2013 2014E 2015E 2016ERevenues 1,347 1,284 1,469 1,509 1,598EBIT 452 523 495 456 481EBITDA 650 718 693 658 686Net Income 307 439 391 335 332EPS (PEN) 0.13 0.19 0.17 0.15 0.14EBIT Margin 33.6% 40.7% 33.7% 30.2% 30.1%EBITDA Margin 48.2% 55.9% 47.2% 43.6% 42.9%Net Margin 22.8% 34.2% 26.6% 22.2% 20.8%
PEN mn 2012 2013 2014E 2015E 2016ECash & Equivalents 164 151 178 248 395Total Current Assets 390 520 621 701 870Total Assets 4,040 4,135 4,209 4,716 5,313Current Liabilities 383 524 419 437 446Financial Debt 720 655 798 1,292 1,833Total Liabilities 1,660 1,697 1,718 2,231 2,780Minority Interest 0 0 0 0 0Shareholders Equity 2,379 2,438 2,490 2,485 2,532Total Liabilities + Equity 4,040 4,135 4,209 4,716 5,313EBITDA / Fin. Expenses 14.7 20.1 17.7 9.8 6.9Financial Debt /EBITDA 1.1 0.9 1.2 2.0 2.7Financial Debt /Equity 0.3 0.3 0.3 0.5 0.7ROAE 12.9% 18.2% 15.9% 13.5% 13.1%ROAA 7.6% 10.7% 9.4% 7.5% 6.6%ROIC 10.8% 12.5% 11.5% 9.6% 9.0%
Hydro 33%
Thermo (Simple cycle) 26%
Thermo (Comb. cycle) 30%
Chinango - Hydro (80%
own sub) 12%
Pension Funds 12.4%
Endesa Chile 29.4%Generandes
Perú 54.2%
Others 4.0%
Non-cash charges
20%
Fuels 44%
Energy purchase
s 11%
Others 25%
PEN mn 2012 2013 2014E 2015E 2016EInitial Cash 126 164 151 178 248Cash from Operations 375 631 403 545 523CAPEX -68 -53 -249 -630 -632Changes in Financial Debt -60 -211 62 494 540Div idends (Paid) Received -186 -334 -335 -340 -285Other CFI & CFF Items -23 -47 147 0 0Changes in Equity 0 0 0 0 0Final Cash 164 151 178 248 395Change in Cash 38 -13 28 70 147Sources: Company Reports and Credicorp Capital; E Credicorp Capital Estimates
154

Peru Industry:
UtilitiesRating:
HoldEdelnorSteady and ready
Fernando Pereda+(511) 416 3333 - Ext: 37856
Investment Thesis Stock Data
• We reiterate our Hold rating on Edelnor and set a 2015YE TP ofPEN 5.74, while dropping our 2014YE TP of 5.21. Even thougheconomic dynamism in Edelnor’s concession area will supportenergy demand, we see this as largely priced in the shares whichhave posted a 5-year CAGR of 21.5%.
• Structure of physical energy sales favor margins. Regulatedcustomers will explain about 85% of energy sales and 91% ofearnings in 2015. Moreover, their consumption may rise 5.1% and5.5% in 2015 and 2016, respectively. This will enhance margins asresidential clients are subject to higher prices.
• Edelnor’s 2014 Capex increased 42%, from PEN 308 mn (USD110 mn) to PEN 437 mn (USD 156 mn). This Capex increase ispositive since the company will improve its operational efficiencyratios in its concession area, which will show growing demand in themedium term. Energy losses, which have come down from 18.8% atthe time of the privatization in 1994, will remain around currentlevels of 8.2%.
• Risks to our thesis: deceleration of commercial activity in the areaof concession, reductions in DAV in the next tariff revision (2017).
Price Chart (PEN) and Volumes (USD mn)
Valuation• Edelnor trades at 7.0x FV/EBITDA and 12.7x P/E, slightly below its
peers. We believe this is justified because Capex per kw/h will behigher than for its comparables through 2016 and the company’sdividend payout should decline from 80% to 60%.
• Our recommendation is based on a DCF model which considersimportant capital expenditures through 2016 to enhance service.
Valuation Summary
P/E 12M Forward FV/EBITDA 12M Forward Relative Valuation
Andean Equities Guide, 2015
Ticker edelnoc1 pePrice (PEN) 5.56LTM Range (PEN) 4.1 - 5.6Target (PEN) 5.74Total Return 8%Market Cap (USD mn) 1,223Shares Outstanding (mn) 639Free Float 24%ADTV (USD mn) 0.2
0
1
2
3
4
80
90
100
110
120
130
140
Oct-13 Feb-14 Jun-14 Oct-14
USD
m
Edelnor IGBVL
2
7
12
Oct-05 Oct-08 Oct-11 Oct-142
7
Oct-05 Oct-08 Oct-11 Oct-14
CPFL
Coelce
EdelnorLuz del Sur
0
5
10
15
20
25
0 5 10 15
P/E
2015
E
FV/EBITDA 2015E
155
2013 2014E 2015E 2016EFV/EBITDA 6.7 7.5 7.0 6.5P/E 11.4 12.0 12.7 12.0P/CF 14.5 n.m 1342.2 249.3P/BV 2.5 2.8 2.6 2.4Div . Yield 3.5% 7.5% 4.6% 5.0%Sources: Company Reports and Credicorp Capital

EdelnorCompany Description
Edelnor distributes electricity to the northern area of the Lima MetropolitanArea and Callao (port of Lima) with more than 1,100 th. customers and acoverage territory of 2,440 km2. The company serves exclusively 52districts of Lima and its concession area consists mainly of the industrialpart of Lima and some of the most populous districts of Lima.
Ownership Income Statement
Sales Breakdown (% of MW.h in 2015) Balance Sheet
COGS Breakdown (2015)
Cash Flow
Management
CEO: Ignacio BlancoCFO: Raffaele GrandiIR Manager: -
Andean Equities Guide, 2015
Invers. Distrilima
52%
Enersis 24%
Pension Funds 10%
Others 7%
Credicorp 7%
Regulated clients
88%
Non-regulated
clients 12%
Energy purchase
s 85%
Non-cash charges
6%
Services 4%
Others 3%
Labour 2%
PEN mn 2012 2013 2014E 2015E 2016ERevenues 2,096 2,235 2,388 2,541 2,710EBIT 379 456 462 484 522EBITDA 506 587 596 636 689Net Income 217 271 299 284 301EPS (PEN) 0.34 0.42 0.47 0.44 0.47EBIT Margin 18.1% 20.4% 19.3% 19.1% 19.3%EBITDA Margin 24.2% 26.3% 25.0% 25.0% 25.4%Net Margin 10.3% 12.1% 12.5% 11.2% 11.1%
PEN mn 2012 2013 2014E 2015E 2016ECash & Equivalents 73 214 50 66 80Total Current Assets 368 518 439 477 516Total Assets 2,802 3,115 3,351 3,737 4,141Current Liabilities 646 727 636 644 652Financial Debt 952 1,041 1,304 1,561 1,835Total Liabilities 1,724 1,861 2,079 2,344 2,626Minority Interest 0 0 0 0 0Shareholders Equity 1,078 1,254 1,272 1,393 1,515Total Liabilities + Equity 2,802 3,115 3,351 3,737 4,141EBITDA / Fin. Expenses 6.0 6.3 9.0 8.0 7.5 Financial Debt /EBITDA 1.9 1.8 2.2 2.5 2.7Financial Debt /Equity 0.9 0.8 1.0 1.1 1.2ROAE 20.1% 23.2% 23.7% 21.3% 19.9%ROAA 7.7% 9.2% 9.2% 8.0% 7.6%ROIC 13.6% 15.8% 14.0% 12.5% 11.9%
PEN mn 2012 2013 2014E 2015E 2016EInitial Cash 48 73 214 50 66Cash from Operations 464 357 278 421 452CAPEX -294 -307 -437 -500 -532Changes in Financial Debt 14 196 263 257 274Div idends (Paid) Received -142 -98 -266 -162 -179Other CFI & CFF Items -17 -9 -2 0 0Changes in Equity 0 0 0 0 0Final Cash 73 214 50 66 80Change in Cash 25 140 -164 16 15Sources: Company Reports and Credicorp Capital; E Credicorp Capital Estimates
156
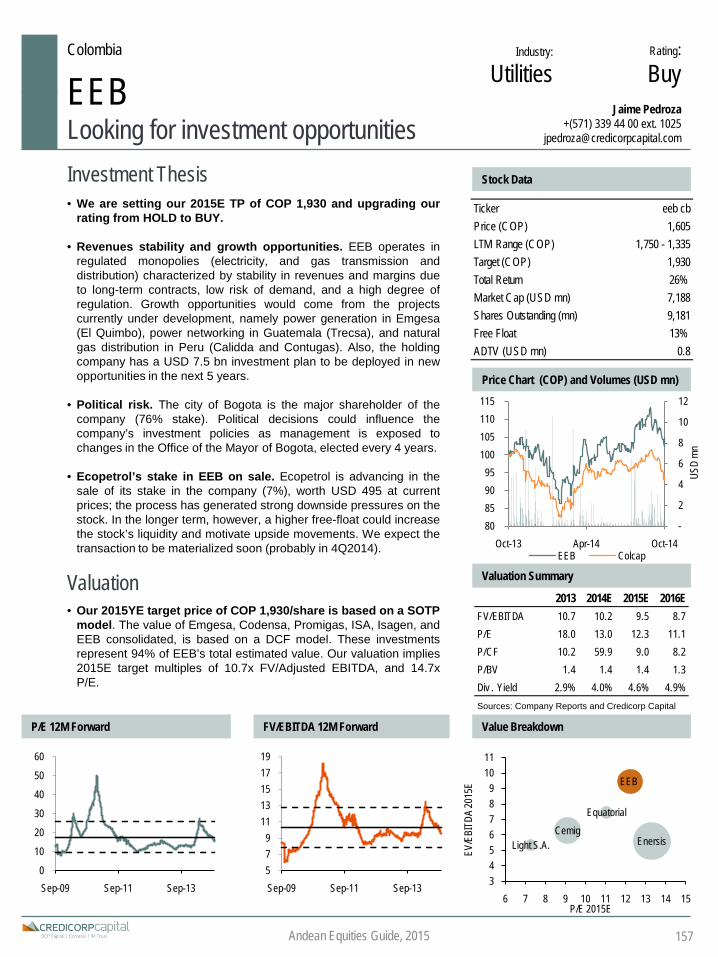
2013 2014E 2015E 2016EFV/EBITDA 10.7 10.2 9.5 8.7P/E 18.0 13.0 12.3 11.1P/CF 10.2 59.9 9.0 8.2P/BV 1.4 1.4 1.4 1.3Div . Yield 2.9% 4.0% 4.6% 4.9%Sources: Company Reports and Credicorp Capital
Colombia Industry:
UtilitiesRating:BuyEEB
Looking for investment opportunitiesJaime Pedroza
+(571) 339 44 00 ext. [email protected]
Investment Thesis Stock Data
• We are setting our 2015E TP of COP 1,930 and upgrading ourrating from HOLD to BUY.
• Revenues stability and growth opportunities. EEB operates inregulated monopolies (electricity, and gas transmission anddistribution) characterized by stability in revenues and margins dueto long-term contracts, low risk of demand, and a high degree ofregulation. Growth opportunities would come from the projectscurrently under development, namely power generation in Emgesa(El Quimbo), power networking in Guatemala (Trecsa), and naturalgas distribution in Peru (Calidda and Contugas). Also, the holdingcompany has a USD 7.5 bn investment plan to be deployed in newopportunities in the next 5 years.
• Political risk. The city of Bogota is the major shareholder of thecompany (76% stake). Political decisions could influence thecompany’s investment policies as management is exposed tochanges in the Office of the Mayor of Bogota, elected every 4 years.
• Ecopetrol’s stake in EEB on sale. Ecopetrol is advancing in thesale of its stake in the company (7%), worth USD 495 at currentprices; the process has generated strong downside pressures on thestock. In the longer term, however, a higher free-float could increasethe stock’s liquidity and motivate upside movements. We expect thetransaction to be materialized soon (probably in 4Q2014).
Valuation• Our 2015YE target price of COP 1,930/share is based on a SOTP
model. The value of Emgesa, Codensa, Promigas, ISA, Isagen, andEEB consolidated, is based on a DCF model. These investmentsrepresent 94% of EEB’s total estimated value. Our valuation implies2015E target multiples of 10.7x FV/Adjusted EBITDA, and 14.7xP/E.
Price Chart (COP) and Volumes (USD mn)
Valuation Summary
P/E 12M Forward FV/EBITDA 12M Forward Value Breakdown
Andean Equities Guide, 2015
Ticker eeb cbPrice (COP) 1,605LTM Range (COP) 1,750 - 1,335Target (COP) 1,930Total Return 26%Market Cap (USD mn) 7,188Shares Outstanding (mn) 9,181Free Float 13%ADTV (USD mn) 0.8
-
2
4
6
8
10
12
80 85 90 95
100 105 110 115
Oct-13 Apr-14 Oct-14
USD
mn
EEB Colcap
0
10
20
30
40
50
60
Sep-09 Sep-11 Sep-13579
1113151719
Sep-09 Sep-11 Sep-13
EEB
EnersisLight S.A.
EquatorialCemig
3456789
1011
6 7 8 9 10 11 12 13 14 15
EV/E
BITD
A 20
15E
P/E 2015E
157

COP mn 2012 2013 2014E 2015E 2016ECash & Equivalents 663,918 1,655,916 1,147,780 1,196,608 1,293,097Total Current Assets 1,458,644 1,669,305 1,855,105 1,929,084 2,017,836Total Assets 14,689,730 16,811,262 18,682,410 19,427,444 20,321,246Current Liabilities 673,719 842,643 1,233,347 1,253,758 1,282,072Financial Debt 3,203,989 4,318,497 6,706,086 6,819,125 6,934,678Total Liabilities 4,492,725 5,619,200 8,224,627 8,360,743 8,549,557Minority Interest 1,202,345 1,386,102 179,418 264,459 368,023Shareholders Equity 8,994,660 9,805,960 10,278,366 10,802,243 11,403,667Total Liabilities + Equity 14,689,730 16,811,262 18,682,410 19,427,444 20,321,246EBITDA / Fin. Expenses 3.4 7.7 5.6 5.4 5.8Financial Debt /EBITDA 2.5 2.4 3.3 3.1 2.9Financial Debt /Equity 0.4 0.4 0.7 0.6 0.6ROAE 7.7% 7.8% 9.5% 11.1% 11.4%ROAA 4.7% 4.7% 5.4% 6.1% 6.3%ROIC 6.6% 7.3% 7.8% 7.6% 7.8%
EEBCompany Description
EEB, directly and through its investments, operates in the power (transmission, distribution,and generation) and natural gas (transmission and distribution) businesses. Emgesa andCodensa (~62% of the value) are controlled by Enersis (Chile). Its operations areconcentrated in Colombia, Peru and Guatemala. The City of Bogotá is the controllingshareholder of the company.
Ownership Income Statement
Revenue Breakdown (Jun-14) Balance Sheet
Value Breakdown
Cash Flow
Management
CEO: Ricardo Roa BarragánCFO: Felipe CastillaIR Manager: Nicolás Manciniwww.grupoenergiadebogota.com
Andean Equities Guide, 2015
Power transmission
5%
Power distribution
13%
Gas transportation
43%
Gas distribution
38%
COP mn 2012 2013 2014E 2015E 2016EInitial Cash 953,259 663,918 1,655,916 1,147,780 1,196,608Cash from Operations 993,107 1,378,483 246,103 1,637,869 1,807,388CAPEX -717,122 -1,033,228 -2,083,958 -867,041 -913,905Changes in Financial Debt -170,930 1,114,508 2,387,589 113,039 115,553Div idends (Paid) Received -319,964 -403,605 -920,561 -677,713 -720,954Taxes -74,432 -64,160 -137,309 -157,326 -191,594Changes in Equity 0 0 0 0 0Final Cash 663,918 1,655,916 1,147,780 1,196,608 1,293,097Change in Cash -289,341 991,998 -508,136 48,828 96,488Sources: Company Reports and Credicorp Capital; E Credicorp Capital Estimates
Bogota D.C. 76%
Ecopetrol 7%
Corficol 4%
Pension Funds 9%
Other 4%
Consolidated EEB 19%
Emgesa 33%Codensa 29%
Gas Natural 6%
Promigas 5%Other 8%
COP mn 2012 2013 2014E 2015E 2016ERevenues 1,585,105 1,958,521 2,285,170 2,382,384 2,574,488EBIT 558,518 607,965 881,942 951,667 1,056,993EBITDA 1,279,394 1,775,908 2,049,188 2,219,570 2,432,954Net Income 690,701 781,699 1,129,521 1,201,590 1,322,378EPS 75.2 85.1 123.0 130.9 144.0EBIT Margin 35.2% 31.0% 38.6% 39.9% 41.1%EBITDA Margin 80.7% 90.7% 89.7% 93.2% 94.5%Net Margin 43.6% 39.9% 49.4% 50.4% 51.4%
158

05
10152025303540
Oct-05 Oct-08 Oct-11 Oct-142
6
10
14
18
Oct-05 Oct-08 Oct-11 Oct-14
2013 2014E 2015E 2016EFV/EBITDA 10.5 9.4 9.0 8.5P/E 19.3 22.6 19.1 12.8P/CF 67.3 33.0 34.0 15.5P/BV 1.9 1.7 1.6 1.5Div . Yield 5.1% 4.1% 3.1% 3.7%Sources: Company Reports and Credicorp Capital
Chile Industry: Rating:HoldEmbonor-B
Bolivia drives our thirstTomás Sanhueza+(562) 2446 1751
Investment Thesis Stock Data
• We are downgrading our recommendation to Hold, andintroducing our new 2015YE TP of CLP 1,090. Despite improvingprofitability ratios and Embonor’s exposure to Bolivia (high growth),we remain cautious on Chilean operations due to macrodeceleration, in addition to Bolivia’s political risks.
• We are expecting volumes in Chile to grow 2.7% and EBITDA toremain flat. We believe pressures in labor costs and USD indexedcosts will decrease but will not fully offset lower volumes due toweaker macro scenario. Pricing will be an issue, due to a morecompetitive scenario and higher taxes, which will force Embonor tocompete in pricing with companies with higher economies of scale,such as CCU.
• Growth to be driven by Bolivian operations. We expect volumesin the country to increase along with a 10.5% increase in EBITDA,the latter driven by lower operational costs through year end. Heavyexposure to Bolivia (45% of EBITDA) provides an important growthoutlet during times of economic slowdown in Chile. Consumption inthat country remains 3x less than per capita consumption in Chile.
• Risks to our thesis: Upside risk: i) potential M&A target. Downsiderisk: i) higher-than-expected mandatory salary increases in Bolivia.Ii) political risks in Bolivia, iii) low traded volumes in shares.
Price Chart (CLP) and Volumes (USD mn)
Valuation• In terms of forward multiples, Embonor is trading at a fair P/E and
at a slight discount in terms of EV/EBITDA compared to its 5-yearshistorical average, making it difficult to get constructive on avaluation basis.
• When compared to peers, Embonor is trading at a discount interms of FV/EBITDA and at fair multiples in terms of P/E. Though adiscount in EV/EBITDA likely reflects low liquidity of shares andexposure to Bolivia, relative valuations create an opportunity forM&A for another KO bottler looking to expand in the region.
Valuation Summary
P/E 12M Forward FV/EBITDA 12M Forward Relative Valuation
Andean Equities Guide, 2015
Ticker embonob ci equityPrice (CLP) 1,000LTM Range (CLP) 951 - 1,303Target (CLP) 1,090Total Return 12%Market Cap (USD mn) 838Shares Outstanding (mn) 266Free Float 49%ADTV (USD mn) 0.7
Food & Beverages
01234567
0
20
40
60
80
100
120
Oct-13 Feb-14 Jun-14 Oct-14
USD
m
Embonor B IPSA
Femsa
Andina
Embonor
10
13
16
19
22
25
28
8 9 10 11 12
P / E
2015
E
EV / EBITDA 2015E
Arca Continental
Coca-Cola Enterprises
159

CLP mn 2012 2013 2014E 2015E 2016ECash & Equivalents 21,134 34,164 21,612 22,968 24,297Total Current Assets 96,577 106,600 112,312 118,375 124,624Total Assets 483,086 510,883 550,503 593,747 620,865Current Liabilities 127,635 101,372 107,481 112,606 117,862Financial Debt 95,859 119,213 151,291 178,881 180,466Total Liabilities 202,842 220,584 258,771 291,485 298,325Minority Interest 9 9 9 10 10Shareholders Equity 280,234 290,291 291,723 302,253 322,530Total Liabilities + Equity 483,086 510,883 550,503 593,747 620,865EBITDA / Fin. Expenses 18.6 12.0 10.9 9.1 8.5Financial Debt /EBITDA 1.4 2.0 2.3 2.6 2.5Financial Debt /Equity 0.3 0.4 0.5 0.6 0.6ROAE 13.5% 10.1% 7.4% 8.6% 12.2%ROAA 7.8% 5.8% 4.1% 4.5% 6.3%ROIC 7.5% 9.2% 7.9% 8.7% 7.5%
Embonor-BCompany Description
Embonor is a Coca-Cola bottler with operations in Chile (extreme north andcenter-south) and Bolivia. In Chile, the company serves more than 7.5million inhabitants and produces more than 110 MUC. In Bolivia, it covers95% of the total territory, serving more than 10 million inhabitants andproducing more than 110 MUC, annually.
Ownership Income Statement
EBITDA per Country (LTM) Balance Sheet
Volume per Country (LTM)
Cash Flow
Management
CEO: Cristian HohlbergCFO: Anton SzafronovIR Manager: Fernando Sahliwww.embonor.cl
Andean Equities Guide, 2015
Vicuña Family 50.6%
Pension & Mutual
Funds 6.5%
Others 42.9%
Chile 55.2%
Boliv ia 44.8%
Chile 50.6%
Boliv ia 49.4%
160
CLP mn 2012 2013 2014E 2015E 2016EInitial Cash 23,288 21,134 34,164 21,612 22,968Cash from Operations 78,459 70,467 24,312 41,033 56,325CAPEX -47,324 -47,324 -43,101 -45,807 -32,063Changes in Financial Debt -1,361 23,355 32,078 27,590 1,585Div idends (Paid) Received -27,457 -28,455 -20,193 -15,138 -17,967Taxes -4,472 -5,013 -5,647 -6,321 -6,551Changes in Equity 0 0 0 0 0Final Cash 21,134 34,164 21,612 22,968 24,297Change in Cash -2,154 13,030 -12,552 1,357 1,329Sources: Company Reports and Credicorp Capital; E Credicorp Capital Estimates
CLP mn 2012 2013 2014E 2015E 2016ERevenues 380,449 406,035 431,012 458,067 484,572EBIT 49,469 50,382 42,739 45,255 46,714EBITDA 67,707 61,078 65,737 68,834 72,557Net Income 37,807 28,848 21,626 25,668 38,244EPS (CLP) 141.9 108.3 81.2 96.3 143.5EBIT Margin 13.0% 12.4% 9.9% 9.9% 9.6%EBITDA Margin 17.8% 15.0% 15.3% 15.0% 15.0%Net Margin 9.9% 7.1% 5.0% 5.6% 7.9%
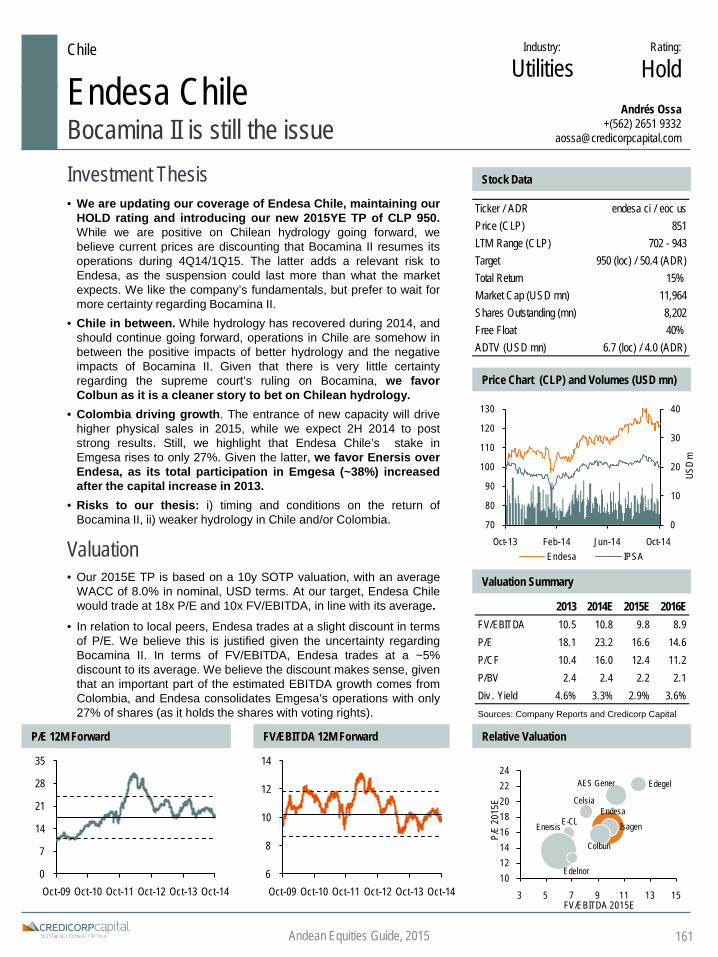
EndesaE-CL
Celsia
Isagen
Colbun
Edegel
Enersis
AES Gener
Edelnor1012141618202224
3 5 7 9 11 13 15
P/E
2015
E
FV/EBITDA 2015E
0
7
14
21
28
35
Oct-09 Oct-10 Oct-11 Oct-12 Oct-13 Oct-146
8
10
12
14
Oct-09 Oct-10 Oct-11 Oct-12 Oct-13 Oct-14
Chile Industry: Rating:
HoldEndesa ChileBocamina II is still the issue
Andrés Ossa+(562) 2651 9332
Investment Thesis Stock Data
• We are updating our coverage of Endesa Chile, maintaining ourHOLD rating and introducing our new 2015YE TP of CLP 950.While we are positive on Chilean hydrology going forward, webelieve current prices are discounting that Bocamina II resumes itsoperations during 4Q14/1Q15. The latter adds a relevant risk toEndesa, as the suspension could last more than what the marketexpects. We like the company’s fundamentals, but prefer to wait formore certainty regarding Bocamina II.
• Chile in between. While hydrology has recovered during 2014, andshould continue going forward, operations in Chile are somehow inbetween the positive impacts of better hydrology and the negativeimpacts of Bocamina II. Given that there is very little certaintyregarding the supreme court’s ruling on Bocamina, we favorColbun as it is a cleaner story to bet on Chilean hydrology.
• Colombia driving growth. The entrance of new capacity will drivehigher physical sales in 2015, while we expect 2H 2014 to poststrong results. Still, we highlight that Endesa Chile’s stake inEmgesa rises to only 27%. Given the latter, we favor Enersis overEndesa, as its total participation in Emgesa (~38%) increasedafter the capital increase in 2013.
• Risks to our thesis: i) timing and conditions on the return ofBocamina II, ii) weaker hydrology in Chile and/or Colombia.
Price Chart (CLP) and Volumes (USD mn)
Valuation• Our 2015E TP is based on a 10y SOTP valuation, with an average
WACC of 8.0% in nominal, USD terms. At our target, Endesa Chilewould trade at 18x P/E and 10x FV/EBITDA, in line with its average.
• In relation to local peers, Endesa trades at a slight discount in termsof P/E. We believe this is justified given the uncertainty regardingBocamina II. In terms of FV/EBITDA, Endesa trades at a ~5%discount to its average. We believe the discount makes sense, giventhat an important part of the estimated EBITDA growth comes fromColombia, and Endesa consolidates Emgesa’s operations with only27% of shares (as it holds the shares with voting rights).
Valuation Summary
P/E 12M Forward FV/EBITDA 12M Forward Relative Valuation
Andean Equities Guide, 2015
Utilities
Ticker / ADR endesa ci / eoc usPrice (CLP) 851LTM Range (CLP) 702 - 943Target 950 (loc) / 50.4 (ADR)Total Return 15%Market Cap (USD mn) 11,964Shares Outstanding (mn) 8,202Free Float 40%ADTV (USD mn) 6.7 (loc) / 4.0 (ADR)
0
10
20
30
40
70
80
90
100
110
120
130
Oct-13 Feb-14 Jun-14 Oct-14
USD
m
Endesa IPSA
2013 2014E 2015E 2016EFV/EBITDA 10.5 10.8 9.8 8.9P/E 18.1 23.2 16.6 14.6P/CF 10.4 16.0 12.4 11.2P/BV 2.4 2.4 2.2 2.1Div . Yield 4.6% 3.3% 2.9% 3.6%Sources: Company Reports and Credicorp Capital
161
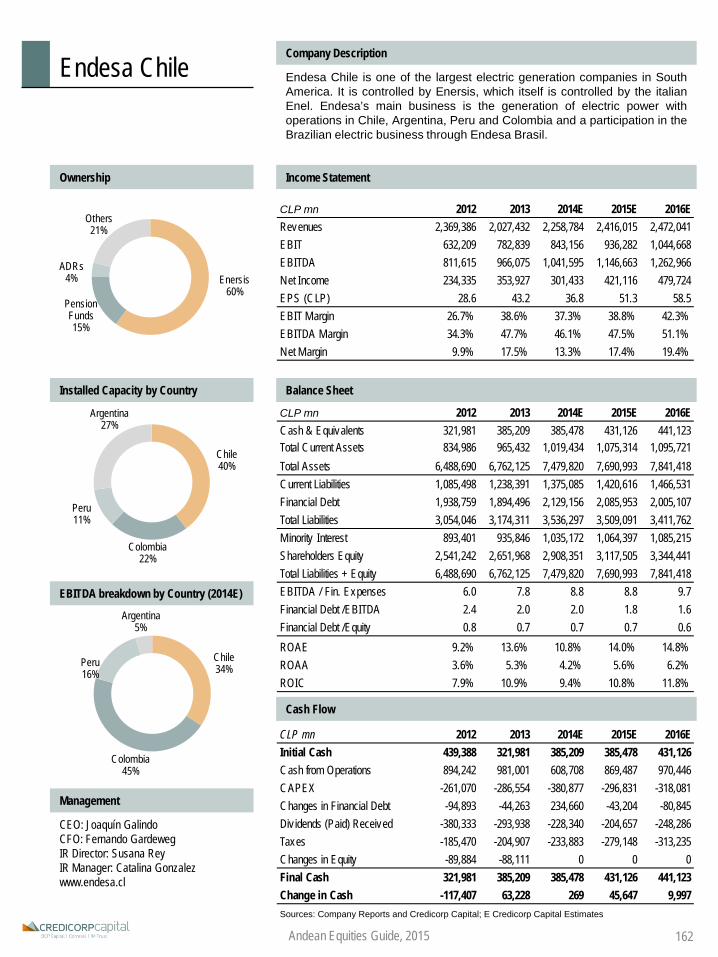
Endesa ChileCompany Description
Endesa Chile is one of the largest electric generation companies in SouthAmerica. It is controlled by Enersis, which itself is controlled by the italianEnel. Endesa’s main business is the generation of electric power withoperations in Chile, Argentina, Peru and Colombia and a participation in theBrazilian electric business through Endesa Brasil.
Ownership Income Statement
Installed Capacity by Country Balance Sheet
EBITDA breakdown by Country (2014E)
Cash Flow
Management
CEO: Joaquín GalindoCFO: Fernando GardewegIR Director: Susana ReyIR Manager: Catalina Gonzalezwww.endesa.cl
Andean Equities Guide, 2015
Enersis60%
Pension Funds15%
ADRs4%
Others21%
Chile34%
Colombia45%
Peru16%
Argentina5%
Chile40%
Colombia22%
Peru11%
Argentina27%
162
CLP mn 2012 2013 2014E 2015E 2016ERevenues 2,369,386 2,027,432 2,258,784 2,416,015 2,472,041EBIT 632,209 782,839 843,156 936,282 1,044,668EBITDA 811,615 966,075 1,041,595 1,146,663 1,262,966Net Income 234,335 353,927 301,433 421,116 479,724EPS (CLP) 28.6 43.2 36.8 51.3 58.5EBIT Margin 26.7% 38.6% 37.3% 38.8% 42.3%EBITDA Margin 34.3% 47.7% 46.1% 47.5% 51.1%Net Margin 9.9% 17.5% 13.3% 17.4% 19.4%
CLP mn 2012 2013 2014E 2015E 2016ECash & Equivalents 321,981 385,209 385,478 431,126 441,123Total Current Assets 834,986 965,432 1,019,434 1,075,314 1,095,721Total Assets 6,488,690 6,762,125 7,479,820 7,690,993 7,841,418Current Liabilities 1,085,498 1,238,391 1,375,085 1,420,616 1,466,531Financial Debt 1,938,759 1,894,496 2,129,156 2,085,953 2,005,107Total Liabilities 3,054,046 3,174,311 3,536,297 3,509,091 3,411,762Minority Interest 893,401 935,846 1,035,172 1,064,397 1,085,215Shareholders Equity 2,541,242 2,651,968 2,908,351 3,117,505 3,344,441Total Liabilities + Equity 6,488,690 6,762,125 7,479,820 7,690,993 7,841,418EBITDA / Fin. Expenses 6.0 7.8 8.8 8.8 9.7Financial Debt /EBITDA 2.4 2.0 2.0 1.8 1.6Financial Debt /Equity 0.8 0.7 0.7 0.7 0.6ROAE 9.2% 13.6% 10.8% 14.0% 14.8%ROAA 3.6% 5.3% 4.2% 5.6% 6.2%ROIC 7.9% 10.9% 9.4% 10.8% 11.8%
CLP mn 2012 2013 2014E 2015E 2016EInitial Cash 439,388 321,981 385,209 385,478 431,126Cash from Operations 894,242 981,001 608,708 869,487 970,446CAPEX -261,070 -286,554 -380,877 -296,831 -318,081Changes in Financial Debt -94,893 -44,263 234,660 -43,204 -80,845Div idends (Paid) Received -380,333 -293,938 -228,340 -204,657 -248,286Taxes -185,470 -204,907 -233,883 -279,148 -313,235Changes in Equity -89,884 -88,111 0 0 0Final Cash 321,981 385,209 385,478 431,126 441,123Change in Cash -117,407 63,228 269 45,647 9,997Sources: Company Reports and Credicorp Capital; E Credicorp Capital Estimates

EndesaE-CL
Celsia
IsagenColbun
Edegel
Enersis
AES Gener
Edelnor1012141618202224
3 5 7 9 11 13 15
P/E
2015
E
FV/EBITDA 2015E
4
5
6
7
Oct-09 Oct-10 Oct-11 Oct-12 Oct-13 Oct-144
9
14
19
24
Oct-09 Oct-10 Oct-11 Oct-12 Oct-13 Oct-14
Chile Industry: Rating:
BuyEnersisPrice correction opens entry point
Andrés Ossa+(562) 2651 9332
Investment Thesis Stock Data
• We are updating our coverage of Enersis, maintaining our BUYrating and introducing our new 2015YE TP of CLP 215. Wecontinue to like the company’s defensive attributes, with a solidbusiness and strong cash generation, along with itsdiversification throughout the entire region. In addition, Enersishas roughly USD 1,700 mn left at its disposal for M&A activity.
• Price correction offers good entry point. During the past weeks,Enersis’ stock price decreased roughly 10%. We attribute the latterto foreign outflows, as we see no fundamental change in thecompany. In our view, current levels represent a good entry point.
• M&A could pick up in 2015. As we expected, Enersis closedimportant deals of minority acquisitions during 2014 (15% of Coelcefor USD 242 mn, 21% of Edegel for USD 413 mn). We believe thelatter partially drove the stock’s positive performance YTD. Weexpect M&A to pick up in 2015, driving share outperformance again.
• Dx still harmed by Brazil. Dx in Brazil remains affected by over-costs that have not been fully recognized in tariffs. While we believethis might only improve when hydrology recovers, we highlight thatdownside risk is limited, as the comparison base in Brazil is not high.
• Risks to our thesis: i) weak hydrology in Chile, ii) delays in M&Aexecution, iii) changes in framework that regulates Dx companies.
Price Chart (CLP) and Volumes (USD mn)
Valuation• Our 2015E TP is based on a 10-year SOTP, DCF valuation, with a
WACC of 8.1 % in nominal, USD terms. At our target, Enersis wouldbe trading at roughly 14x in terms of P/E 2016E, in line with its 5-year average
• When compared to local peers, Enersis trades at a discount of~20% and ~30% in terms of P/E and FV/EBITDA 2015E. This ispartially explained by Enersis mix of Gx and Dx (Dx stocks normallytrade at lower multiples). Still, we believe the discount is too highgiven Enersis growth potential through M&A activity. Whencompared to its own history, Enersis is trading roughly in line interms of P/E and FV/EBITDA.
Valuation Summary
P/E 12M Forward FV/EBITDA 12M Forward Relative Valuation
2013 2014E 2015E 2016EFV/EBITDA 4.8 6.4 6.0 5.6P/E 11.7 16.9 13.6 12.1P/CF nm 9.3 6.2 6.1P/BV 1.3 1.4 1.3 1.2Div . Yield 3.3% 3.7% 3.0% 3.7%Sources: Company Reports and Credicorp Capital
Andean Equities Guide, 2015
Utilities
0
10
20
30
40
65
75
85
95
105
115
125
Oct-13 Feb-14 Jun-14 Oct-14
USD
m
Enersis IPSA
163
Ticker / ADR enersis ci / eni usPrice (CLP) 182LTM Range (CLP) 144 - 209Target 215 (loc) / 19.0 (ADR)Total Return 21%Market Cap (USD mn) 15,338Shares Outstanding (mn) 49,093Free Float 39%ADTV (USD mn) 9.1 (loc) / 9.2 (ADR)

EnersisCompany Description
Enersis is an electric utility company engaged, through its subsidiaries andrelated companies, in the generation, transmission and distribution ofelectricity in Chile, Argentina, Brazil, Colombia and Peru. It is one of thelargest private sector electricity companies in South America in terms ofconsolidated assets and operating revenues, with 14 million customers.
Ownership Income Statement
EBITDA by country (2014E) Balance Sheet
EBITDA by business (2014E)
Cash Flow
Management
CEO: Ignacio AntoñanzasCFO: Eduardo EscaffiIR Manager: Pedro CañameroIR: Denisse Labarcawww.enersis.cl
Andean Equities Guide, 2015
CLP mn 2012 2013 2014E 2015E 2016ECash & Equivalents 1,051,881 2,387,417 1,937,091 2,023,242 2,093,524Total Current Assets 2,354,518 3,896,215 3,492,085 3,620,536 3,732,765Total Assets 13,317,834 15,177,664 15,866,632 16,499,466 17,102,687Current Liabilities 2,354,518 3,896,215 3,492,085 3,620,536 3,732,765Financial Debt 3,598,302 3,696,924 3,896,788 3,991,905 4,022,637Total Liabilities 6,354,065 6,670,199 7,053,472 7,195,864 7,291,900Minority Interest 3,069,970 2,338,911 2,445,082 2,542,603 2,635,561Shareholders Equity 3,893,799 6,168,554 6,368,078 6,760,999 7,175,225Total Liabilities + Equity 13,317,834 15,177,664 15,866,632 16,499,466 17,102,687EBITDA / Fin. Expenses 12.1 19.3 7.9 6.5 10.8Financial Debt /EBITDA 1.6 1.5 1.8 1.7 1.6Financial Debt /Equity 0.9 0.6 0.6 0.6 0.6ROAE 9.7% 13.1% 8.4% 10.0% 10.7%ROAA 2.8% 4.6% 3.4% 4.1% 4.4%ROIC 12.5% 14.9% 11.9% 13.0% 12.8%
CLP mn 2012 2013 2014E 2015E 2016EInitial Cash 1,220,860 1,051,881 2,387,417 1,937,091 2,023,242Cash from Operations 1,695,904 2,553,552 945,959 1,215,003 1,460,893CAPEX -709,519 -2,506,196 -854,284 -500,706 -518,163Changes in Financial Debt -345,136 98,622 199,863 95,117 30,733Div idends (Paid) Received -208,098 -188,675 -329,257 -264,390 -328,655Taxes -411,891 -504,168 -412,607 -458,873 -574,525Changes in Equity -190,240 1,882,400 0 0 0Final Cash 1,051,881 2,387,417 1,937,091 2,023,242 2,093,524Change in Cash -168,980 1,335,536 -450,326 86,151 70,282Sources: Company Reports and Credicorp Capital; E Credicorp Capital Estimates
Enel60%
Pension Funds14%
ADR12%
Others14%
Chile23%
Colombia31%
Peru12%
Argentina9%
Brasil25%
Gx52%Dx
48%
CLP mn 2012 2013 2014E 2015E 2016ERevenues 6,577,667 6,264,446 6,844,125 7,148,513 7,396,833EBIT 1,682,575 1,963,207 1,765,379 1,922,514 2,070,191EBITDA 2,285,530 2,473,558 2,222,309 2,400,793 2,566,469Net Income 377,351 658,514 528,781 657,311 742,882EPS (CLP) 11.2 13.4 10.8 13.4 15.1EBIT Margin 25.6% 31.3% 25.8% 26.9% 28.0%EBITDA Margin 34.7% 39.5% 32.5% 33.6% 34.7%Net Margin 5.7% 10.5% 7.7% 9.2% 10.0%
164

2013 2014E 2015E 2016EFV/EBITDA 10.0 9.6 9.0 8.6P/E 15.7 14.6 14.7 14.3P/CF n.m 39.0 n.m 39.2P/BV 3.1 2.8 2.4 2.2Div . Yield 1.9% 2.9% 2.1% 2.0%Sources: Company Reports and Credicorp Capital
Peru Industry:
UtilitiesRating:BuyEnersur
Eye of the tigerFernando Pereda
+(511) 416 3333 - Ext: [email protected]
Investment Thesis Stock Data
• We are maintaining our rating of Enersur on Buy with anestimated 2015YE TP of PEN 12.71, while dropping our 2014YETP of PEN 11.58. Our outlook for the company is positive as weexpect a boost in earnings through 2015 and stronger margins.Based on the assumption that natural gas will be available insouthern Peru by 2021, we have valued the Energy Node – Ilo plant(EN-I) project considering that Enersur could use either a simple orcombined cycle to produce energy.
• Enersur was awarded the bid to build the Energy Node – Iloplant (EN-I) (Thermo, 600 MW). Commercial operations areexpected to start prior to March 2017. Enersur obtained a capacitypayment of USD 5.75 /KW-month, which will translate into an annualEBITDA of USD 41.4mn when the station begins operating.
• The Quitaracsa hydro-electrical project (112 MW, in Ancash,central Peru) is set to begin operations in April 2015, althoughthe total investment is expected to increase from USD 280mn toUSD 450mn due to works for infrastructure.
• Risks to our thesis: High concentration of sales in Southern Peru(33% of the total). Non-regulated clients cooling down. Delay in thearrival of the Camisea gas pipeline to the South (2021E).
Price Chart (PEN) and Volumes (USD mn)
Valuation• Current P/E and FV/EBITDA of 14.7x and 9.0x, respectively, imply a
discount with regional peers. We see room for multiples expansionas cash generation capacity is relatively better than peers.
• We considered a tax scheme for the leasings of ChilcaUno, Ilo31and the EN-I, in which tax depreciation tops financial depreciation inthe first few years and the company accumulates deferred taxliabilities, which are reversed in subsequent years. This improvescash flow from operations (CFO) in early years and leads to lowerP/CFO as compared to peers.
Valuation Summary
P/E 12M Forward FV/EBITDA 12M Forward Relative Valuation
Andean Equities Guide, 2015
Ticker enersuc1 pePrice (PEN) 9.55LTM Range (PEN) 9.2 - 9.8Target (PEN) 12.71Total Return 35%Market Cap (USD mn) 1,979Shares Outstanding (mn) 601Free Float 11%ADTV (USD mn) 0.2
0
2
4
6
8
85
90
95
100
105
110
115
Oct-13 Feb-14 Jun-14 Oct-14
USD
m
Enersur IGBVL
5
10
15
20
Oct-05 Oct-08 Oct-11 Oct-145
10
Oct-05 Oct-08 Oct-11 Oct-14
EndesaIsagenColbun
AesGener
Enersur Edegel
0
5
10
15
20
25
30
5 10 15
P/E
2015
E
FV/EBITDA 2015E
165

EnersurCompany Description
Enersur, is the largest power generation company in Peru with an installedcapacity of 1,928 MW (7% hydro and 93% thermolectric capacities), whichincludes 569 MW capacity of its back-up unit Reserva Fria. The companyhas a balanced portfolio of regulated and non-regulated customers and hasPPAs with important clients.
Ownership Income Statement
Capacity Breakdown (2015) Balance Sheet
COGS Breakdown (2015)
Cash Flow
Management
CEO: Michel GantoisCFO: Eduardo MilliganIR Manager: Eduardo Milligan
Andean Equities Guide, 2015
Pension Funds 28%
GDF Suez 62%
RIMAC INT. 5%
Others 5%
Shopping 27%
Natural gas
combined cycle 852
MW
Cold Reserve in Ilo 560
MW
Hydro 134 MW
Quitaracsa (Hydro project) 112w
Coal and Diesel
373 MW
Non-cash charges
14%
Fuels 51%
Transmission
costs & Energy
purchases 19%
Labour 4%
Others 13%
USD mn 2012 2013 2014E 2015E 2016ERevenues 496 610 638 676 703EBIT 152 226 235 243 251EBITDA 188 270 285 301 318Net Income 101 127 136 135 138EPS (USD) 0.17 0.21 0.23 0.22 0.23EBIT Margin 30.7% 37.0% 36.9% 35.9% 35.7%EBITDA Margin 37.9% 44.3% 44.7% 44.6% 45.2%Net Margin 20.3% 20.9% 21.3% 20.0% 19.6%S C R t d C di C it l E C di C it l E ti t
USD mn 2012 2013 2014E 2015E 2016ECash & Equivalents 97 25 36 32 31Total Current Assets 199 221 192 193 195Total Assets 1,344 1,518 1,662 1,870 2,011Current Liabilities 135 263 190 194 195Financial Debt 664 733 795 887 911Total Liabilities 794 879 945 1,059 1,102Minority Interest 0 0 0 0 0Shareholders Equity 550 639 717 811 909Total Liabilities + Equity 1,344 1,518 1,662 1,870 2,011EBITDA / Fin. Expenses 12.3 7.0 6.8 6.1 5.9 Financial Debt /EBITDA 3.5 2.7 2.8 2.9 2.9Financial Debt /Equity 1.2 1.1 1.1 1.1 1.0ROAE 18.3% 21.4% 20.1% 17.7% 16.1%ROAA 7.5% 8.9% 8.6% 7.6% 7.1%ROIC 9.5% 12.8% 11.7% 10.8% 10.2%
USD mn 2012 2013 2014E 2015E 2016EInitial Cash 22 97 25 36 32Cash from Operations 100 93 214 211 221CAPEX -101 -165 -196 -266 -206Changes in Financial Debt 106 17 33 92 24Div idends (Paid) Received -28 -33 -58 -41 -41Other CFI & CFF Items -2 16 17 0 0Changes in Equity 0 0 0 0 0Final Cash 97 25 36 32 31Change in Cash 75 -71 11 -4 -2Sources: Company Reports and Credicorp Capital; E Credicorp Capital Estimates
166
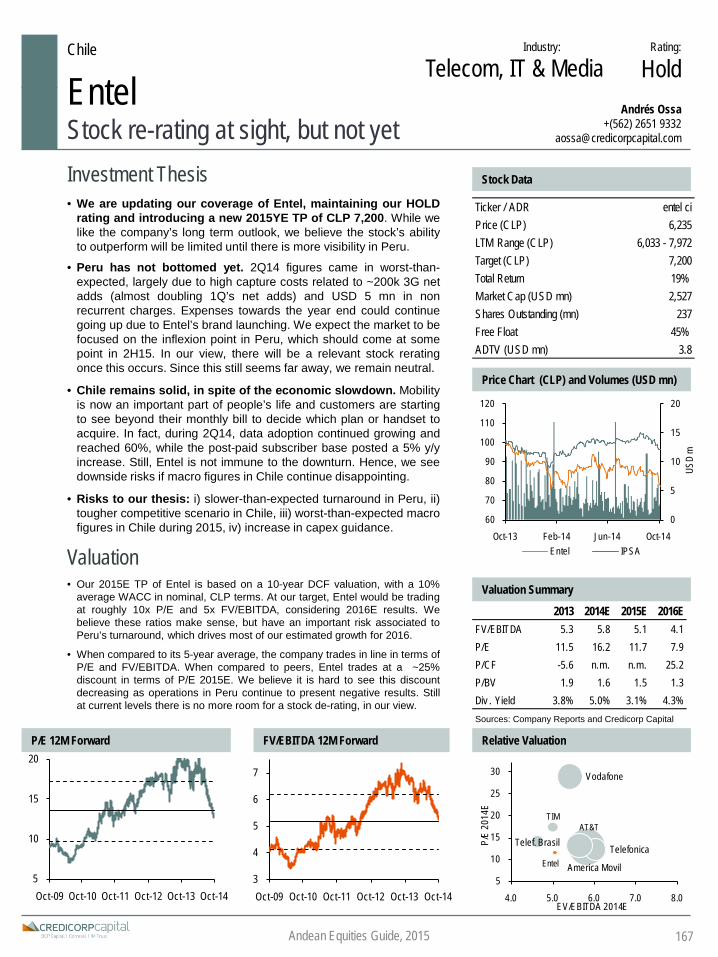
2013 2014E 2015E 2016EFV/EBITDA 5.3 5.8 5.1 4.1P/E 11.5 16.2 11.7 7.9P/CF -5.6 n.m. n.m. 25.2P/BV 1.9 1.6 1.5 1.3Div . Yield 3.8% 5.0% 3.1% 4.3%Sources: Company Reports and Credicorp Capital
5
10
15
20
Oct-09 Oct-10 Oct-11 Oct-12 Oct-13 Oct-143
4
5
6
7
Oct-09 Oct-10 Oct-11 Oct-12 Oct-13 Oct-14
Chile Industry: Rating:
HoldEntelStock re-rating at sight, but not yet
Andrés Ossa+(562) 2651 9332
Investment Thesis Stock Data
• We are updating our coverage of Entel, maintaining our HOLDrating and introducing a new 2015YE TP of CLP 7,200. While welike the company’s long term outlook, we believe the stock’s abilityto outperform will be limited until there is more visibility in Peru.
• Peru has not bottomed yet. 2Q14 figures came in worst-than-expected, largely due to high capture costs related to ~200k 3G netadds (almost doubling 1Q’s net adds) and USD 5 mn in nonrecurrent charges. Expenses towards the year end could continuegoing up due to Entel’s brand launching. We expect the market to befocused on the inflexion point in Peru, which should come at somepoint in 2H15. In our view, there will be a relevant stock reratingonce this occurs. Since this still seems far away, we remain neutral.
• Chile remains solid, in spite of the economic slowdown. Mobilityis now an important part of people’s life and customers are startingto see beyond their monthly bill to decide which plan or handset toacquire. In fact, during 2Q14, data adoption continued growing andreached 60%, while the post-paid subscriber base posted a 5% y/yincrease. Still, Entel is not immune to the downturn. Hence, we seedownside risks if macro figures in Chile continue disappointing.
• Risks to our thesis: i) slower-than-expected turnaround in Peru, ii)tougher competitive scenario in Chile, iii) worst-than-expected macrofigures in Chile during 2015, iv) increase in capex guidance.
Price Chart (CLP) and Volumes (USD mn)
Valuation• Our 2015E TP of Entel is based on a 10-year DCF valuation, with a 10%
average WACC in nominal, CLP terms. At our target, Entel would be tradingat roughly 10x P/E and 5x FV/EBITDA, considering 2016E results. Webelieve these ratios make sense, but have an important risk associated toPeru’s turnaround, which drives most of our estimated growth for 2016.
• When compared to its 5-year average, the company trades in line in terms ofP/E and FV/EBITDA. When compared to peers, Entel trades at a ~25%discount in terms of P/E 2015E. We believe it is hard to see this discountdecreasing as operations in Peru continue to present negative results. Stillat current levels there is no more room for a stock de-rating, in our view.
Valuation Summary
P/E 12M Forward FV/EBITDA 12M Forward Relative Valuation
Andean Equities Guide, 2015
Telecom, IT & Media
Ticker / ADR entel ciPrice (CLP) 6,235LTM Range (CLP) 6,033 - 7,972Target (CLP) 7,200Total Return 19%Market Cap (USD mn) 2,527Shares Outstanding (mn) 237Free Float 45%ADTV (USD mn) 3.8
0
5
10
15
20
60
70
80
90
100
110
120
Oct-13 Feb-14 Jun-14 Oct-14
USD
m
Entel IPSA
167
Telef. BrasilAT&T
Vodafone
Telefonica
America Movil
TIM
Entel
5
10
15
20
25
30
4.0 5.0 6.0 7.0 8.0
P/E
2014
E
EV/EBITDA 2014E

EntelCompany Description
Entel is a telecommunications company that operates in Chile and Peru,offering mobile and fixed line services, along with IT services. Entelcurrently has more than 10.3 mn clients in Chile, being the lider with a 46%revenue share. In Peru, the company has roughly 1.5 mn clients.
Ownership Income Statement
Revenue breakdown (2013) Balance Sheet
EBITDA breakdown (2013)
Cash Flow
Management
CEO: Antonio BüchiCFO: Felipe UretaIR Manager: Carmen Luz de la CerdaIR: Ximena Lucowww.entel.cl
Andean Equities Guide, 2015
Almendral55%
Pension Funds
9%
Others36%
Consumers53%
Corporate & SME27%
Network rentals & others22%
Nextel Peru-2%
Americatel Peru1%
Consumers54%
Corporate & SME28%
Network rentals, call centers & others
14%
Nextel Peru3%
Americatel Peru1%
168
CLP mn 2012 2013 2014E 2015E 2016ERevenues 1,441,101 1,643,930 1,697,470 1,863,682 2,025,079EBIT 214,463 218,038 169,945 213,146 303,597EBITDA 529,548 467,317 402,352 463,035 574,816Net Income 167,294 146,965 91,188 126,291 187,533EPS (CLP) 707.3 621.4 385.5 533.9 792.9EBIT Margin 14.9% 13.3% 10.0% 11.4% 15.0%EBITDA Margin 36.7% 28.4% 23.7% 24.8% 28.4%Net Margin 11.6% 8.9% 5.4% 6.8% 9.3%
CLP mn 2012 2013 2014E 2015E 2016ECash & Equivalents 55,155 34,680 46,763 51,134 55,562Total Current Assets 422,838 568,285 608,335 645,450 684,185Total Assets 1,695,255 2,256,950 2,508,891 2,804,150 3,071,176Current Liabilities 439,323 515,270 553,393 592,020 631,192Financial Debt 435,784 840,394 1,034,106 1,208,360 1,310,911Total Liabilities 881,249 1,375,865 1,610,100 1,824,663 1,967,301Minority Interest 0 0 0 0 0Shareholders Equity 814,007 881,085 898,791 979,487 1,103,875Total Liabilities + Equity 1,695,255 2,256,950 2,508,891 2,804,150 3,071,176EBITDA / Fin. Expenses 48.7 24.7 9.0 11.8 13.0Financial Debt /EBITDA 0.8 1.8 2.6 2.6 2.3Financial Debt /Equity 0.5 1.0 1.2 1.2 1.2ROAE 20.6% 17.3% 10.2% 13.4% 18.0%ROAA 9.9% 7.4% 3.8% 4.8% 6.4%ROIC 15.1% 10.7% 8.2% 7.8% 9.8%
CLP mn 2012 2013 2014E 2015E 2016EInitial Cash 28,471 55,155 34,680 46,763 51,134Cash from Operations 527,067 387,291 331,949 384,744 489,327CAPEX -403,922 -696,112 -431,268 -473,690 -464,715Changes in Financial Debt 63,696 404,610 193,712 174,254 102,551Div idends (Paid) Received -129,680 -89,023 -73,483 -45,594 -63,145Taxes -31,342 -29,952 -8,827 -35,343 -59,589Changes in Equity 864 2,711 0 0 0Final Cash 55,155 34,680 46,763 51,134 55,562Change in Cash 26,683 -20,474 12,083 4,371 4,428Sources: Company Reports and Credicorp Capital; E Credicorp Capital Estimates
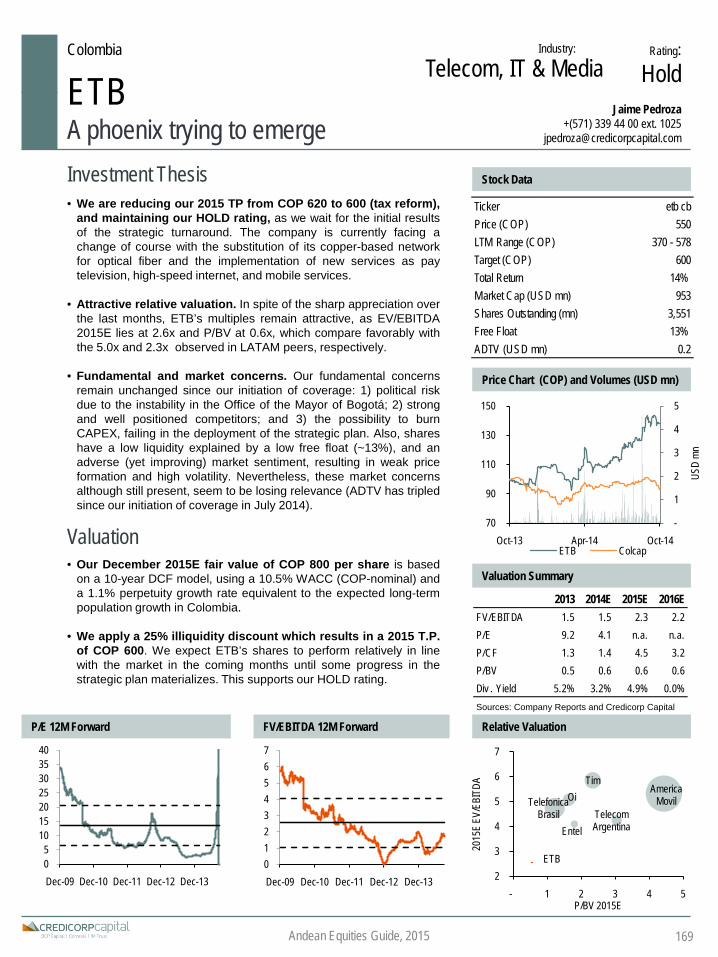
2013 2014E 2015E 2016EFV/EBITDA 1.5 1.5 2.3 2.2P/E 9.2 4.1 n.a. n.a.P/CF 1.3 1.4 4.5 3.2P/BV 0.5 0.6 0.6 0.6Div . Yield 5.2% 3.2% 4.9% 0.0%Sources: Company Reports and Credicorp Capital
Colombia Industry: Rating:HoldETB
A phoenix trying to emergeJaime Pedroza
+(571) 339 44 00 ext. [email protected]
Investment Thesis Stock Data
• We are reducing our 2015 TP from COP 620 to 600 (tax reform),and maintaining our HOLD rating, as we wait for the initial resultsof the strategic turnaround. The company is currently facing achange of course with the substitution of its copper-based networkfor optical fiber and the implementation of new services as paytelevision, high-speed internet, and mobile services.
• Attractive relative valuation. In spite of the sharp appreciation overthe last months, ETB’s multiples remain attractive, as EV/EBITDA2015E lies at 2.6x and P/BV at 0.6x, which compare favorably withthe 5.0x and 2.3x observed in LATAM peers, respectively.
• Fundamental and market concerns. Our fundamental concernsremain unchanged since our initiation of coverage: 1) political riskdue to the instability in the Office of the Mayor of Bogotá; 2) strongand well positioned competitors; and 3) the possibility to burnCAPEX, failing in the deployment of the strategic plan. Also, shareshave a low liquidity explained by a low free float (~13%), and anadverse (yet improving) market sentiment, resulting in weak priceformation and high volatility. Nevertheless, these market concernsalthough still present, seem to be losing relevance (ADTV has tripledsince our initiation of coverage in July 2014).
Price Chart (COP) and Volumes (USD mn)
Valuation• Our December 2015E fair value of COP 800 per share is based
on a 10-year DCF model, using a 10.5% WACC (COP-nominal) anda 1.1% perpetuity growth rate equivalent to the expected long-termpopulation growth in Colombia.
• We apply a 25% illiquidity discount which results in a 2015 T.P.of COP 600. We expect ETB’s shares to perform relatively in linewith the market in the coming months until some progress in thestrategic plan materializes. This supports our HOLD rating.
Valuation Summary
P/E 12M Forward FV/EBITDA 12M Forward Relative Valuation
Andean Equities Guide, 2015
Ticker etb cbPrice (COP) 550LTM Range (COP) 370 - 578Target (COP) 600Total Return 14%Market Cap (USD mn) 953Shares Outstanding (mn) 3,551Free Float 13%ADTV (USD mn) 0.2
Telecom Argentina
ETB
Telefonica Brasil
OiTim
Entel
America Movil
2
3
4
5
6
7
- 1 2 3 4 5
2015
E EV
/EBI
TDA
P/BV 2015E
-
1
2
3
4
5
70
90
110
130
150
Oct-13 Apr-14 Oct-14
USD
mn
ETB Colcap
05
10152025303540
Dec-09 Dec-10 Dec-11 Dec-12 Dec-1301234567
Dec-09 Dec-10 Dec-11 Dec-12 Dec-13
169
Telecom, IT & Media
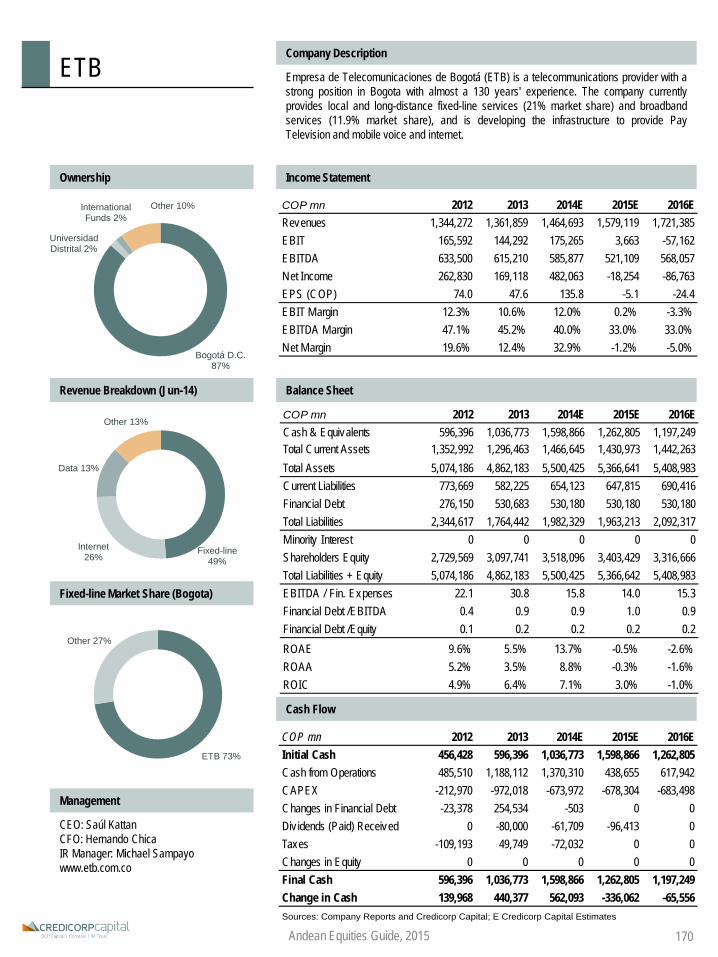
COP mn 2012 2013 2014E 2015E 2016ECash & Equivalents 596,396 1,036,773 1,598,866 1,262,805 1,197,249Total Current Assets 1,352,992 1,296,463 1,466,645 1,430,973 1,442,263Total Assets 5,074,186 4,862,183 5,500,425 5,366,641 5,408,983Current Liabilities 773,669 582,225 654,123 647,815 690,416Financial Debt 276,150 530,683 530,180 530,180 530,180Total Liabilities 2,344,617 1,764,442 1,982,329 1,963,213 2,092,317Minority Interest 0 0 0 0 0Shareholders Equity 2,729,569 3,097,741 3,518,096 3,403,429 3,316,666Total Liabilities + Equity 5,074,186 4,862,183 5,500,425 5,366,642 5,408,983EBITDA / Fin. Expenses 22.1 30.8 15.8 14.0 15.3Financial Debt /EBITDA 0.4 0.9 0.9 1.0 0.9Financial Debt /Equity 0.1 0.2 0.2 0.2 0.2ROAE 9.6% 5.5% 13.7% -0.5% -2.6%ROAA 5.2% 3.5% 8.8% -0.3% -1.6%ROIC 4.9% 6.4% 7.1% 3.0% -1.0%
ETBCompany Description
Empresa de Telecomunicaciones de Bogotá (ETB) is a telecommunications provider with astrong position in Bogota with almost a 130 years' experience. The company currentlyprovides local and long-distance fixed-line services (21% market share) and broadbandservices (11.9% market share), and is developing the infrastructure to provide PayTelevision and mobile voice and internet.
Ownership Income Statement
Revenue Breakdown (Jun-14) Balance Sheet
Fixed-line Market Share (Bogota)
Cash Flow
Management
CEO: Saúl KattanCFO: Hernando ChicaIR Manager: Michael Sampayowww.etb.com.co
Andean Equities Guide, 2015
Fixed-line 49%
Internet 26%
Data 13%
Other 13%
Bogotá D.C. 87%
Universidad Distrital 2%
International Funds 2%
Other 10%
ETB 73%
Other 27%
COP mn 2012 2013 2014E 2015E 2016EInitial Cash 456,428 596,396 1,036,773 1,598,866 1,262,805Cash from Operations 485,510 1,188,112 1,370,310 438,655 617,942CAPEX -212,970 -972,018 -673,972 -678,304 -683,498Changes in Financial Debt -23,378 254,534 -503 0 0Div idends (Paid) Received 0 -80,000 -61,709 -96,413 0Taxes -109,193 49,749 -72,032 0 0Changes in Equity 0 0 0 0 0Final Cash 596,396 1,036,773 1,598,866 1,262,805 1,197,249Change in Cash 139,968 440,377 562,093 -336,062 -65,556Sources: Company Reports and Credicorp Capital; E Credicorp Capital Estimates
COP mn 2012 2013 2014E 2015E 2016ERevenues 1,344,272 1,361,859 1,464,693 1,579,119 1,721,385EBIT 165,592 144,292 175,265 3,663 -57,162EBITDA 633,500 615,210 585,877 521,109 568,057Net Income 262,830 169,118 482,063 -18,254 -86,763EPS (COP) 74.0 47.6 135.8 -5.1 -24.4EBIT Margin 12.3% 10.6% 12.0% 0.2% -3.3%EBITDA Margin 47.1% 45.2% 40.0% 33.0% 33.0%Net Margin 19.6% 12.4% 32.9% -1.2% -5.0%
170

2013 2014E 2015E 2016EFV/EBITDA 17.5 12.7 11.2 9.9P/E 25.5 22.4 18.8 16.5P/CF nm 63.1 45.6 61.0P/BV 3.6 3.0 2.7 2.5Div . Yield 1.5% 1.7% 2.1% 2.4%Sources: Company Reports and Credicorp Capital
Chile Industry:
RetailRating:
BuyFalabellaLeadership & Diversity not priced in
Christopher DiSalvatore+(562) 2446 1724
Investment Thesis Stock Data
• Falabella remains amongst our Top Picks in the Andean retailspace due to market leadership and regional diversity. Althoughwe appreciate the negative momentum currently facing the sector,we believe that after a 16% ltm correction, valuations provide anattractive entry for what we believe is a core, growth asset in theAndean. We maintain our Buy rating on shares and $5,140 T.P.
• Macro outlook in Chile adding a degree of cautiousness toestimates. Our numbers now assume, albeit more conservatively,cost dilution to sustain profitability growth in 2015 rather than 2H14,reflecting potential headwinds to sales growth in upcoming quarters.Our updated numbers remain on the lower end of consensus and, inour view, internalize a relatively weak operating environment in thenear term. Our target does not assume a material upward, multiplere-rating (at target 2016E P/E 20x) given the economic uncertaintyin Chile today. Rather, we continue to view EBITDA and EPSexpansion as key drivers to share outperformance, looking forward.
• Risks to our thesis: downside risks include lower than expectedeconomic activity in the region, material changes in capex plan, andshare overhang from recent divestment by a controlling family (DelRio Family).
Price Chart (CLP) and Volumes (USD mn)
Valuation• However, valuation has adjusted for weak economic outlook in
Chile. In terms of 2015E P/E, shares are trading at an 8% premiumto peers, but at a 22% discount to 5 year averages, reflecting shortterm pressure on earnings growth; however, excluding 2014, EPSgrowth should average 16% (15-17), or above its regional peersaverage. Despite a shift in capital allocation (focus on food retail),profitability remains accretive and as scale materializes, a relativepremium over peers should remain justifiable.
Valuation Summary
P/E 12M Forward FV/EBITDA 12M Forward Relative Valuation
Andean Equities Guide, 2015
0
20
40
60
80
100
80
85
90
95
100
105
110
Oct-13 Feb-14 Jun-14 Oct-14
USD
mn
Falabella IPSA
Ticker falab ciPrice (CLP) 4,224LTM Range (CLP) 4,028 - 5,143Target (CLP) 5,140Total Return 24%Market Cap (USD mn) 17,419Shares Outstanding (mn) 2,406Free Float 19%ADTV (USD mn) 11.3
Forus
Ripley
Falabella
Lojas America
na
Liv erpool
Lojas Renner
Soriana
Hering10131619222528
7 9 11 13 15
P / E
2015
E
EV / EBITDA 2015E
171
5
15
25
35
45
Oct-02 Oct-05 Oct-08 Oct-11 Oct-145
15
25
35
Oct-02 Oct-05 Oct-08 Oct-11 Oct-14

FalabellaCompany Description
Falabella operates as a multi-format retailer, integrating department stores,home improvement, shopping centers, supermarkets, and financialservices. Today, Falabella (over US 12bn in sales) ranks among the largestLatin American retailers with presence in Chile, Peru, Argentina, andColombia.
Ownership Income Statement
Revenue Breakdown by Country (LTM) Balance Sheet
EBITDA by Country (LTM)
Cash Flow
Management
CEO: Sandro SolariCFO: Alejandro GonzálezIR Manager: Lucrecia Fittipaldiwww.falabella.com
Andean Equities Guide, 2015
CLP mn 2012 2013 2014E 2015E 2016ERevenues 5,907,595 6,659,641 7,478,658 8,024,603 8,895,854EBIT 621,551 735,127 783,930 892,943 1,017,069EBITDA 764,284 902,439 978,293 1,104,177 1,252,206Net Income 370,697 443,827 452,679 540,443 616,389EPS 154.0 184.4 188.1 224.6 256.1EBIT Margin 10.5% 11.0% 10.5% 11.1% 11.4%EBITDA Margin 12.9% 13.6% 13.1% 13.8% 14.1%Net Margin 6.3% 6.7% 6.1% 6.7% 6.9%
CLP mn 2012 2013 2014E 2015E 2016EInitial Cash 142,563 224,062 306,629 317,768 350,706Cash from Operations 296,979 588,722 422,191 881,294 1,039,300CAPEX -106,970 -550,744 -542,903 -589,313 -713,655Changes in Financial Debt 222,920 358,695 447,410 147,755 207,746Div idends (Paid) Received -191,410 -171,186 -176,218 -212,314 -244,353Taxes -142,733 -143,760 -139,341 -194,483 -247,326Changes in Equity 2,713 840 0 0 0Final Cash 224,062 306,629 317,768 350,706 392,419Change in Cash 81,499 82,567 11,139 32,938 41,713Sources: Company Reports and Credicorp Capital; E Credicorp Capital Estimates
Controlling Group 81%
Float 19%
Chile 74%
Colombia 4%
Argentina 4%
Brazil 1%
Chile 62%
Peru 21% Colombia 6% Argentina
7%
Brazil 3%
CLP mn 2012 2013 2014E 2015E 2016ECash & Equivalents 224,062 306,629 317,768 350,706 392,419Total Current Assets 2,300,175 2,697,881 2,905,978 3,103,713 3,388,946Total Assets 8,639,220 9,895,313 10,669,352 11,450,610 12,434,188Current Liabilities 1,522,730 1,752,340 1,951,406 2,077,715 2,297,123Financial Debt 2,003,068 2,361,763 2,809,173 2,956,928 3,164,674Total Liabilities 5,164,847 6,070,667 6,515,631 6,915,656 7,460,340Minority Interest 589,103 672,617 725,231 778,336 845,193Shareholders Equity 2,885,270 3,152,028 3,428,489 3,756,618 4,128,655Total Liabilities + Equity 8,639,220 9,895,313 10,669,352 11,450,610 12,434,188EBITDA / Fin. Expenses 10.7 10.5 8.5 9.6 10.4Net Debt /EBITDA 2.3 2.3 2.5 2.4 2.2Financial Debt /Equity 0.7 0.7 0.8 0.8 0.8ROAE 12.8% 14.7% 13.8% 15.0% 15.6%ROAA 4.3% 4.8% 4.4% 4.9% 5.2%ROIC 10.0% 11.6% 11.0% 10.9% 11.3%
172

2013 2014E 2015E 2016EFV/EBITDA 6.1 6.4 6.0 5.8P/E 18.2 9.0 7.8 8.0P/CF 7.3 3.0 5.3 6.7P/BV 1.2 0.9 0.9 0.8Div . Yield 2.7% 3.5% 2.7% 3.1%Sources: Company Reports and Credicorp Capital
Peru Industry: Rating:
HoldFerreycorpTime to live from its seeds
Omar Avellaneda+(511) 416 3333 - Ext: 36065
Investment Thesis Stock Data
• We are updating our valuation on Ferreycorp maintaining aHold recommendation and a 2015YE target price of PEN 1.82.We like Ferreycorp for its portfolio of leading brands and itscapability to provide tailored products as well as after-sale servicesat nationwide level. However, we expect flat revenues growth in2014-2016 due to the decline in mining investment (-10% perannum) which should be partially offset by the development of newinfrastructure projects.
• Improvement in working capital is real. Cash flow from operationshas improved due to lower days of inventory related to i) lower salesof machines and the increase of spare parts and services over totalrevenues, and ii) the implementation of the “Rental Accelerationprogram” to increase inventory turnover. We expect the CashConversion Cycle to stay at around 121 days over the 2014-2016period (140 days in 2012).
• Risks to our thesis: Delays in mining projects due to lowercommodity prices and social conflicts. Delays in auctions forinfrastructure projects. Higher competition in the mining sector,mainly in open pit projects.
Price Chart (PEN) and Volumes (USD mn)
Valuation• We arrived at our 2015YE target price based on a 10-year DCF
model. This target includes updated estimates for mininginvestments over the 2014-2016 period as well as a more efficientuse of working capital.
• Stable margins. Over the next few years we expect EBITDA andnet margins to be slightly above 11% and 4%, respectively.Ferreycorp trades at 2015 P/E of 7.8x and 2015 FV/EBITDA 6.0x,which remains within +/-0.5 SD from its historical level since 2009and below comparable peers.
Valuation Summary
P/E 12M Forward FV/EBITDA 12M Forward Relative Valuation
0
5
10
15
20
25
30
Oct-05 Oct-08 Oct-11 Oct-140
5
10
15
Oct-05 Oct-08 Oct-11 Oct-14
Cement & Construction
02468101214
60
70
80
90
100
110
120
Oct-13 Feb-14 Jun-14 Oct-14
USD
m
Ferreycorp IGBVL
Andean Equities Guide, 2015
Finning
H&E Equipment
Ferreycorp
MarcopoloRandon
Toromont
0
5
10
15
20
25
0 4 8 12
P/E
2015
E
FV/EBITDA 2015E
173
Ticker ferreyc1 pePrice (PEN) 1.55LTM Range 1.31 - 1.82Target 1.82Total Return 20%Market Cap (USD, mn) 542Shares Outstanding (mn) 1,014Free Float 48%ADTV (USD, mn) 0.8
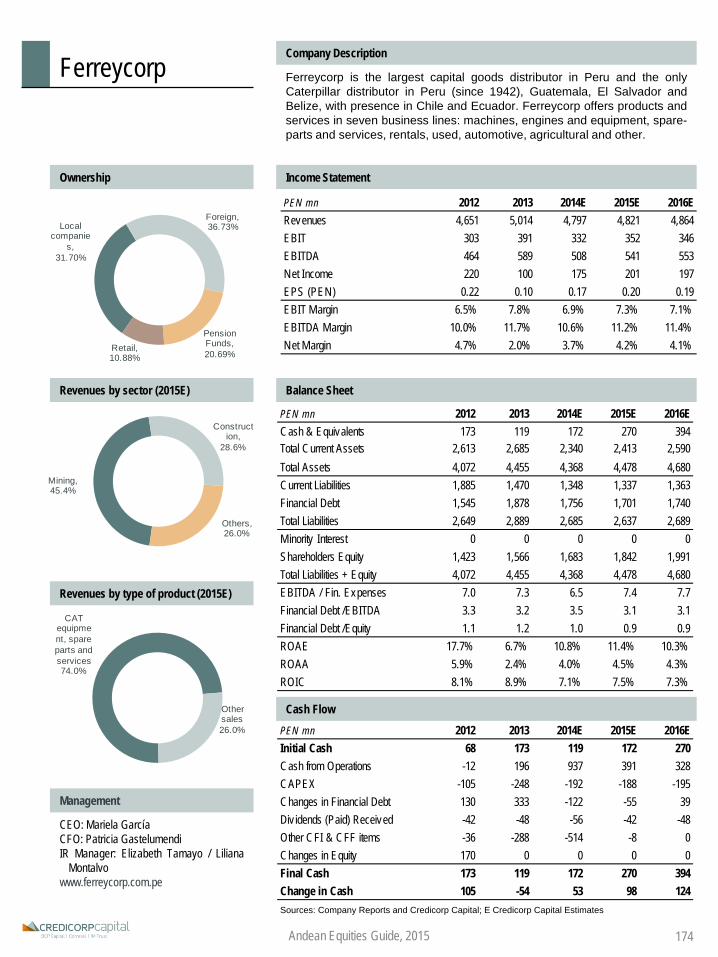
FerreycorpCompany Description
Ferreycorp is the largest capital goods distributor in Peru and the onlyCaterpillar distributor in Peru (since 1942), Guatemala, El Salvador andBelize, with presence in Chile and Ecuador. Ferreycorp offers products andservices in seven business lines: machines, engines and equipment, spare-parts and services, rentals, used, automotive, agricultural and other.
Ownership Income Statement
Revenues by sector (2015E) Balance Sheet
Revenues by type of product (2015E)
Cash Flow
Management
CEO: Mariela GarcíaCFO: Patricia GastelumendiIR Manager: Elizabeth Tamayo / Liliana
Montalvowww.ferreycorp.com.pe
CAT equipment, spare parts and services 74.0%
Other sales 26.0%
Mining, 45.4%
Construction,
28.6%
Others, 26.0%
Local companie
s, 31.70%
Foreign, 36.73%
Pension Funds, 20.69%
Retail, 10.88%
PEN mn 2012 2013 2014E 2015E 2016ERevenues 4,651 5,014 4,797 4,821 4,864EBIT 303 391 332 352 346EBITDA 464 589 508 541 553Net Income 220 100 175 201 197EPS (PEN) 0.22 0.10 0.17 0.20 0.19EBIT Margin 6.5% 7.8% 6.9% 7.3% 7.1%EBITDA Margin 10.0% 11.7% 10.6% 11.2% 11.4%Net Margin 4.7% 2.0% 3.7% 4.2% 4.1%
PEN mn 2012 2013 2014E 2015E 2016ECash & Equivalents 173 119 172 270 394Total Current Assets 2,613 2,685 2,340 2,413 2,590Total Assets 4,072 4,455 4,368 4,478 4,680Current Liabilities 1,885 1,470 1,348 1,337 1,363Financial Debt 1,545 1,878 1,756 1,701 1,740Total Liabilities 2,649 2,889 2,685 2,637 2,689Minority Interest 0 0 0 0 0Shareholders Equity 1,423 1,566 1,683 1,842 1,991Total Liabilities + Equity 4,072 4,455 4,368 4,478 4,680EBITDA / Fin. Expenses 7.0 7.3 6.5 7.4 7.7Financial Debt /EBITDA 3.3 3.2 3.5 3.1 3.1Financial Debt /Equity 1.1 1.2 1.0 0.9 0.9ROAE 17.7% 6.7% 10.8% 11.4% 10.3%ROAA 5.9% 2.4% 4.0% 4.5% 4.3%ROIC 8.1% 8.9% 7.1% 7.5% 7.3%
PEN mn 2012 2013 2014E 2015E 2016EInitial Cash 68 173 119 172 270Cash from Operations -12 196 937 391 328CAPEX -105 -248 -192 -188 -195Changes in Financial Debt 130 333 -122 -55 39Div idends (Paid) Received -42 -48 -56 -42 -48Other CFI & CFF items -36 -288 -514 -8 0Changes in Equity 170 0 0 0 0Final Cash 173 119 172 270 394Change in Cash 105 -54 53 98 124Sources: Company Reports and Credicorp Capital; E Credicorp Capital Estimates
Andean Equities Guide, 2015 174

2013 2014E 2015E 2016EFV/EBITDA 13.6 12.5 11.2 10.1P/E 18.2 17.5 16.1 14.7P/CF 31.6 57.9 20.0 19.9P/BV 5.1 4.1 3.7 3.2Div . Yield 1.9% 2.4% 2.6% 2.8%Sources: Company Reports and Credicorp Capital
Chile Industry:
RetailRating:
HoldForusExternalities limiting near term upside
Christopher DiSalvatore+(562) 2446 1724
Investment Thesis Stock Data
• Though we appreciate the medium term growth prospects andsuperior profitability of the company, we view shares to be fairlyvalued today (limited downside risk), with a lack of significant upsidepotential in the near term due to economic headwinds. Despite therecent downgrade to Hold (Sept. 12th), we still believe thecompany's long term growth story remains intact, offering 11% 14-17 CAGR in EBITDA and a 29% ROIC in 2015. Hold is maintained.
• Until macro trends in Chile (90% of EBIT) positively inflect,upside catalysts remain challenged. Risk of increased costsassociated with FX devaluation will likely weigh on upside in nearterm; however, growth prospects remain positive, especially in Peruand Colombia where penetration remains low. Moreover, an assetlight model should further support positive cash flows in the face ofdeteriorating margins, supporting current valuations, in our view.
• Risks. Upside risks include better macro figures leading to betterSSS and quicker store maturation. Further brand M&A could driveupside to our numbers. Downside risks include a worsening macroscenario, pressuring consumption and FX. Also, slower thanexpected integration of new brands could pressure overhead costs,resulting in lower profitability.
Price Chart (CLP) and Volumes (USD mn)
Valuation• Shares trading in line with global comps. On a relative front,
shares are trading are trading in line with global peers on 2015E P/Eterms (16.1x vs. 17.4x for peers). In a scenario of upwardconsumption trends in Chile and Peru, we would expect shares tore-rate upwards, reflecting above average returns and clear growthopportunities in less mature markets, such as Peru and Colombia.
Valuation Summary
P/E 12M Forward FV/EBITDA 12M Forward Relative Valuation
Andean Equities Guide, 2015
Ticker forus ciPrice (CLP) 2,525LTM Range (CLP) 2,210 - 2,890Target (CLP) 2,800Total Return 13%Market Cap (USD mn) 1,119Shares Outstanding (mn) 258Free Float 32%ADTV (USD mn) 1.5
0
5
10
15
20
70
80
90
100
110
120
Oct-13 Jan-14 Apr-14 Jul-14 Oct-14
USD
mn
Forus IPSA
Forus
Ripley
Falabella
Lojas America
naLiv erpoo
l
Lojas Renner
Soriana
Hering10131619222528
7 9 11 13 15
P / E
2015
E
EV / EBITDA 2015E
175
5
10
15
20
25
30
Oct-07 Apr-11 Oct-140
5
10
15
20
25
Oct-07 Apr-11 Oct-14

ForusCompany Description
Forus is a Chilean brand licensee and retailer specializing in footwear,apparel, and accessories. It generates sales through, both a wholesale andretail channel, the latter of which through the operation of stores in Chile,Peru, Colombia, and Uruguay. The company represents over 32 brands (6own), which it sells directly in its 18 distinct, formatted stores across LatAm.
Ownership Income Statement
Revenues by Segment (LTM) Balance Sheet
EBIT by Country (LTM)
Cash Flow
Management
CEO: Gonazalo DarraidouCFO: Marisol CespedesIR Manager: Macarena Swettwww.forus.cl
Andean Equities Guide, 2015
CLP mn 2012 2013 2014E 2015E 2016ERevenues 170,768 193,631 225,135 245,146 269,713EBIT 38,131 42,888 44,121 49,353 55,454EBITDA 42,463 48,210 50,061 55,719 62,149Net Income 31,366 37,822 37,323 40,594 44,301EPS 121.4 146.3 144.4 157.1 171.4EBIT Margin 22.3% 22.1% 19.6% 20.1% 20.6%EBITDA Margin 24.9% 24.9% 22.2% 22.7% 23.0%Net Margin 18.4% 19.5% 16.6% 16.6% 16.4%
CLP mn 2012 2013 2014E 2015E 2016ECash & Equivalents 40,526 42,071 45,027 49,029 53,943Total Current Assets 103,050 116,262 135,701 154,014 171,855Total Assets 137,464 165,058 188,688 210,069 233,535Current Liabilities 23,090 27,323 28,722 29,246 30,736Financial Debt 4,672 4,077 4,560 4,783 5,056Total Liabilities 26,022 29,310 30,733 31,268 32,771Minority Interest 1,023 1,604 1,834 2,042 2,270Shareholders Equity 111,442 135,748 157,983 178,718 201,273Total Liabilities + Equity 137,464 165,058 188,688 210,069 233,535EBITDA / Fin. Expenses -21.1 -35.1 -77.7 -52.9 -54.0Net Debt /EBITDA -0.8 -0.8 -0.8 -0.8 -0.8Financial Debt /Equity 0.0 0.0 0.0 0.0 0.0ROAE 28.1% 30.6% 25.4% 24.1% 23.3%ROAA 22.8% 25.0% 21.1% 20.4% 20.0%ROIC 46.5% 40.4% 32.4% 29.9% 28.8%
CLP mn 2011 2012 2013E 2014E 2015EInitial Cash 38,863 40,526 42,071 45,027 49,029Cash from Operations 32,834 34,116 35,075 40,595 47,998CAPEX -8,024 -10,451 -6,924 -7,396 -9,820Changes in Financial Debt -3,963 -595 483 224 272Div idends (Paid) Received -11,945 -13,063 -15,752 -16,795 -18,267Taxes -7,239 -8,462 -9,926 -12,624 -15,270Changes in Equity 0 0 0 0 0Final Cash 40,526 42,071 45,027 49,029 53,943Change in Cash 1,663 1,545 2,956 4,002 4,913Sources: Company Reports and Credicorp Capital; E Credicorp Capital Estimates
Controller 68%
Float 32%
Footwear 73%
Clothing 20%
Accessory 7%
Chile 92%
Uruguay 5%
Peru 4% Colombia -1%
176

2013 2014E 2015E 2016EFV/EBITDA 8.6 6.9 6.1 5.6P/E 24.6 17.2 16.0 14.3P/CF nm nm 17.7 8.1P/BV 2.8 1.7 1.6 1.5Div . Yield 1.6% 2.2% 1.7% 2.2%Sources: Company Reports and Credicorp Capital
Peru Industry: Rating:BuyGraña y Montero
Looking for infrastructure opportunitiesOmar Avellaneda
+(511) 416 3333 Ext 36065 [email protected]
Investment Thesis Stock Data
• Underperformance of GRAM is explained by not participating andlosing major PPPs auctions, lower margins, declining backlog andno news on awarded projects (Javier Prado and Cuartel SanMartín). We expect top line growth to moderate to 5.1% in 2014-16due to lower investment and construction activity estimates, andEBITDA to recover to a 11.5% growth over the same period, drivenby a modest recovery on its E&C, real estate and technical servicesunits. After this adjustments and negative performance, we seeattractive entry points, keeping our Buy recommendation.
• M&A activity to continue. GRAM used USD 81mn from its 2013capital increase (USD 420mn) to acquire DSD and Coasin in Chile,and to increase its stake in Vial y Vives, TGP, Stracon GyM andNorvial toll road. Acquisition of COGA and Maple assets are stillpending. GRAM is still looking for M&A opportunities in the region.
• Risks to our thesis: Slowdown in public and private investment.Delays in tender processes (inc. mining projects) and red tape.Lower margins due to a more competitive environment and volatilityon margins due to a decrease of cost plus fee contracts in backlog.
Price Chart (PEN) and Volumes (USD mn)
Valuation• We estimate our revised 2015E target price based on a 10-year,
DCF valuation. We do not include Javier Prado highway andCuartel San Martín projects on our base scenario. We see sharestrading at 6.1x 2015 FV/EBITDA, which is a 20% discount tocomparable peers.
• ‘Mining backlog’ not a concern: Although 48% of GRAM’s backlogis concentrated in the mining sector, 30% comes from miningservices rather than mining projects.; also, 48% of its E&C backlogare cost plus fee contracts.
Valuation Summary
P/E 12M Forward FV/EBITDA 12M Forward Relative Valuation
Andean Equities Guide, 2015
Cement & Construction
0
2
4
6
8
10
60
70
80
90
100
110
120
Oct-13 Feb-14 Jun-14 Oct-14
USD
m
Graña y Montero IGBVL
0
5
10
15
20
25
30
Oct-05 Oct-08 Oct-11 Oct-140
5
10
15
Oct-05 Oct-08 Oct-11 Oct-14
Salini Impregilo
SPASalfacorp
Besalco
FCC
Ica Conconcreto
El CóndorGranite Construction
Graña y Montero
05
101520253035
3 5 7 9 11
P/E
2015
E
FV/EBITDA 2015E
177
Ticker / ADR gramonc1 pe / GRAM USPrice (PEN) 7.75LTM Range (USD) 7.7 - 12.08Target (PEN / USD) 10.33 (loc) / 17.75 (ADS)Total Return 35%Market Cap (USD mn) 1,762Shares Outstanding (mn) 660Free Float 56%ADTV (USD mn) 1.0

PEN mn 2012 2013 2014E 2015E 2016ECash & Equivalents 780 959 1,130 1,131 1,438Total Current Assets 2,974 3,982 4,663 4,848 5,146Total Assets 5,045 6,313 7,732 8,161 8,627Current Liabilities 2,693 2,387 3,473 3,591 3,711Financial Debt 847 796 1,780 1,807 1,846Total Liabilities 3,269 3,116 4,303 4,428 4,559Minority Interest 379 430 490 564 653Shareholders Equity 1,397 2,767 2,939 3,170 3,415Total Liabilities + Equity 5,045 6,313 7,732 8,161 8,627EBITDA / Fin. Expenses 77.5 9.2 30.1 10.4 10.3Financial Debt /EBITDA 1.1 0.8 2.0 1.8 1.7Financial Debt /Equity 0.6 0.3 0.6 0.6 0.5ROAE 22.5% 15.4% 10.4% 10.5% 10.8%ROAA 6.6% 5.6% 4.2% 4.0% 4.2%ROIC 23.5% 19.3% 10.6% 10.4% 11.1%
Graña y MonteroCompany Description
GRAM is the largest engineering and construction company in Peru withcomplementary businesses in infrastructure, real estate and technicalservices, with 80 years of operations and a long track record of manylandmark private-and-public-sector infrastructure projects. GRAM hasoperations in Chile since 2011, and listed its shares on NYSE in July 2013.
Ownership Income Statement
Revenue Breakdown by unit (2015E) Balance Sheet
EBITDA by unit (2015E)
Cash Flow
Management
CEO: Mario AlvaradoCFO: Mónica MiloslavichIR Manager: Dennis Gray www.granaymontero.com.pe
E&C 49.80%
Infrastructure 32.90%
Technical Services 11.10%Real
Estate 6.20%
E&C 68.80%
Infrastructure 11.40%
Technical Services 15.80%
Real Estate 4.00%
Andean Equities Guide, 2015
Internal shareholders
32.0%
Pension Funds 12.5%
ADSs program
39.4%
Others 16.1%
PEN mn 2012 2013 2014E 2015E 2016ERevenues 5,232 5,967 6,639 7,009 7,337EBIT 529 673 539 631 704EBITDA 801 1,036 887 1,004 1,104Net Income 290 320 297 319 357EPS (PEN) 0.44 0.48 0.45 0.48 0.54EBIT Margin 10.1% 11.3% 8.1% 9.0% 9.6%EBITDA Margin 15.3% 17.4% 13.4% 14.3% 15.0%Net Margin 5.5% 5.4% 4.5% 4.6% 4.9%
PEN mn 2012 2013 2014E 2015E 2016EInitial Cash 659 780 959 1,130 1,131Cash from Operations 556 -361 132 608 849CAPEX -180 -351 -662 -461 -381Changes in Financial Debt 318 -52 984 27 38Div idends (Paid) Received -87 -87 -112 -89 -112Other CFI & CFF items -485 -166 -172 -84 -88Changes in Equity 0 1,196 0 0 0Final Cash 780 959 1,130 1,131 1,438Change in Cash 122 179 170 2 307Sources: Company Reports and Credicorp Capital; E Credicorp Capital Estimates
178
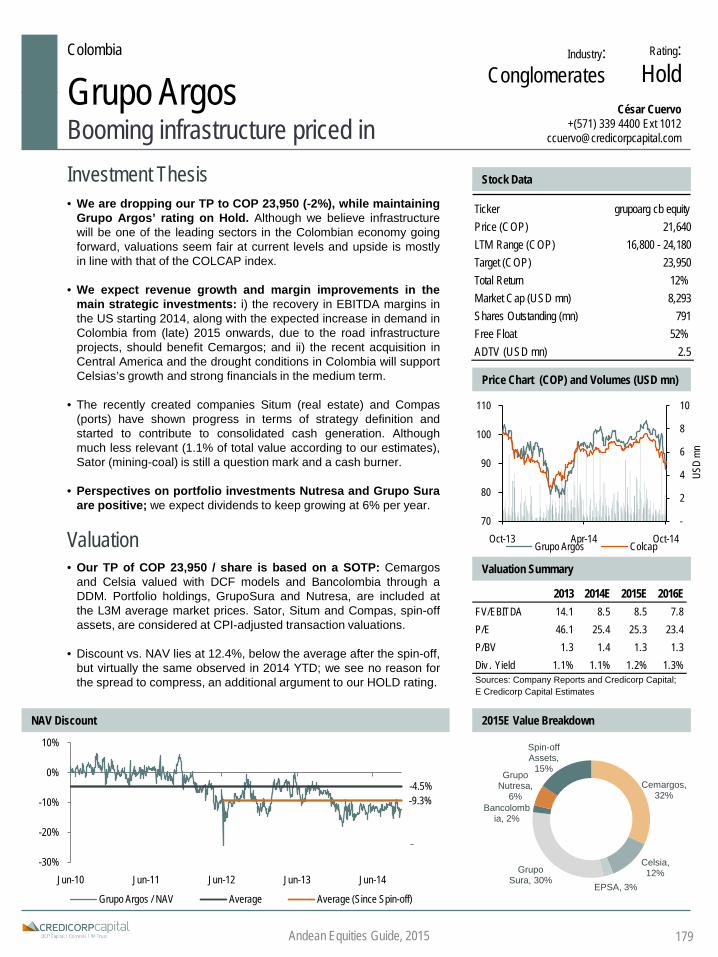
2013 2014E 2015E 2016EFV/EBITDA 14.1 8.5 8.5 7.8P/E 46.1 25.4 25.3 23.4P/BV 1.3 1.4 1.3 1.3Div . Yield 1.1% 1.1% 1.2% 1.3%Sources: Company Reports and Credicorp Capital; E Credicorp Capital Estimates
Colombia Industry:Conglomerates
Rating:HoldGrupo Argos
Booming infrastructure priced inCésar Cuervo
+(571) 339 4400 Ext 1012 [email protected]
Investment Thesis Stock Data
• We are dropping our TP to COP 23,950 (-2%), while maintainingGrupo Argos’ rating on Hold. Although we believe infrastructurewill be one of the leading sectors in the Colombian economy goingforward, valuations seem fair at current levels and upside is mostlyin line with that of the COLCAP index.
• We expect revenue growth and margin improvements in themain strategic investments: i) the recovery in EBITDA margins inthe US starting 2014, along with the expected increase in demand inColombia from (late) 2015 onwards, due to the road infrastructureprojects, should benefit Cemargos; and ii) the recent acquisition inCentral America and the drought conditions in Colombia will supportCelsias’s growth and strong financials in the medium term.
• The recently created companies Situm (real estate) and Compas(ports) have shown progress in terms of strategy definition andstarted to contribute to consolidated cash generation. Althoughmuch less relevant (1.1% of total value according to our estimates),Sator (mining-coal) is still a question mark and a cash burner.
• Perspectives on portfolio investments Nutresa and Grupo Suraare positive; we expect dividends to keep growing at 6% per year.
Valuation• Our TP of COP 23,950 / share is based on a SOTP: Cemargos
and Celsia valued with DCF models and Bancolombia through aDDM. Portfolio holdings, GrupoSura and Nutresa, are included atthe L3M average market prices. Sator, Situm and Compas, spin-offassets, are considered at CPI-adjusted transaction valuations.
• Discount vs. NAV lies at 12.4%, below the average after the spin-off,but virtually the same observed in 2014 YTD; we see no reason forthe spread to compress, an additional argument to our HOLD rating.
Price Chart (COP) and Volumes (USD mn)
Valuation Summary
NAV Discount 2015E Value Breakdown
Andean Equities Guide, 2015
-4.5%-9.3%
-30%
-20%
-10%
0%
10%
Jun-10 Jun-11 Jun-12 Jun-13 Jun-14
Grupo Argos / NAV Average Average (Since Spin-off)
-
Cemargos, 32%
Celsia, 12%
EPSA, 3%
Grupo Sura, 30%
Bancolombia, 2%
Grupo Nutresa,
6%
Spin-off Assets,
15%
-
2
4
6
8
10
70
80
90
100
110
Oct-13 Apr-14 Oct-14
USD
mn
Grupo Argos Colcap
Ticker grupoarg cb equityPrice (COP) 21,640LTM Range (COP) 16,800 - 24,180Target (COP) 23,950Total Return 12%Market Cap (USD mn) 8,293Shares Outstanding (mn) 791Free Float 52%ADTV (USD mn) 2.5
179

Grupo ArgosCompany Description
Grupo Argos is an infrastructure holding company with controlling interestsin Cemargos (cement) and Celsia (power generation), and substantialinvestments in ports, real estate and the mining-coal sector. Its totalportfolio, which includes non-strategic investments in the financial (GrupoSura) and food & beverage industries (Nutresa), is worth USD ~11bn.
Investment portfolio
Ownership Income Statement
Management Balance Sheet
CEO: José Alberto VélezCFO: Ricardo SierraIR Manager: Sebastián Velásquezwww.grupoargos.com
Andean Equities Guide, 2015
Grupo Sura, 29%
Grupo Nutresa,
10%Pension Funds, 20%
Foreign Investors,
3%
Others, 40%
COP mn 2012 2013E 2014E 2015E 2016ERevenues 6,681,155 7,629,359 9,466,761 9,962,347 10,814,428EBIT 1,088,447 1,347,517 2,267,534 2,291,127 2,473,526EBITDA 1,615,543 1,907,021 2,631,291 2,649,610 2,866,325Net Income 343,938 294,950 694,231 697,262 752,149EPS 465.8 358.8 844.5 848.2 915.0EBIT Margin 16.3% 17.7% 24.0% 23.0% 22.9%EBITDA Margin 24.2% 25.0% 27.8% 26.6% 26.5%Net Margin 5.1% 3.9% 7.3% 7.0% 7.0%
* Common shares
Grupo Argos
Non-strategic investments Strategic Investments
Grupo Nutresa (Food-processing) Cemargos (Cement) Situm (Real Estate)8.3% 51.3% 100.0%
Grupo Sura (Financials) Celsia (power generation) Compas (Ports)
1.5% 11.9% 100.0%
25.5% 52.4% 50.0%
Bancolombia (Financials) EPSA (Power generation) Sator (Coal)
12.4% *
35.7% *
COP mn 2012 2013E 2014E 2015E 2016ECash & Equivalents 1,468,055 1,526,948 1,180,923 1,209,612 1,261,019Total Assets 26,799,834 27,415,335 27,290,028 27,953,000 29,140,972Financial Debt 6,662,093 5,822,891 5,576,206 5,711,672 5,954,411Total Liabilities 9,148,376 8,233,030 8,096,943 8,293,647 8,646,118Minority Interest 4,870,120 6,741,142 6,265,876 6,418,096 6,690,858Shareholders Equity 12,781,338 12,441,163 12,927,209 13,241,257 13,803,996Total Liabilities + Equity 26,799,834 27,415,335 27,290,028 27,953,000 29,140,972EBITDA / Fin. Expenses 3.8 4.5 6.2 6.3 6.8Financial Debt /EBITDA 4.1 3.1 2.1 2.2 2.1Financial Debt /Equity 0.5 0.5 0.4 0.4 0.4ROAE 3.0% 2.3% 5.5% 5.3% 5.6%ROAA 1.3% 1.1% 2.5% 2.5% 2.6%ROIC 4.6% 5.3% 9.2% 9.1% 9.5%Sources: Company Reports and Credicorp Capital; E Credicorp Capital Estimates
180

Colombia Industry:
BanksRating:
HoldGrupo AvalReturning to a profitable trend
Juan Dominguez+(571) 339 4400 Ext 1026
Investment Thesis Stock Data
• Despite a healthy industry trend, the strong management of thegroup, the likelihood of retaking its leading position in terms ofprofitability among Colombian peers in the long run, and thebetter visibility of the shares after the IPO of the ADR in NYSE,we keep Grupo Aval on HOLD. We remain neutral as i) shares aretrading at the highest 2016 P/E (11.4x) in our Colombian bankingcoverage; ii) after adjusting our 2015YE T.P. to COP 1,530 (fromCOP 1,600) including the tax reform, the expected total return,although attractive, is in line with that of the COLCAP index.
• ROAE will have an inflection point in 2014, with an upwardtrend starting 2015. ROAE will reach a low on 2014 at 13.7% dueto an equity injection of USD 2.6 bn in 2013-2014 and some one-timers. However, we expect expansion in the indicator to improve to15% in 2016 and 18% in the long-term, meaning that Aval will onceagain outperform in terms of profitability in Colombia. Increasingscale, slight positive pressures on NIM, attractive funding, adequaterisk management, and a strategy heavily tilted towards profitabilityand efficiency are the key catalysts for such an expansion in ROAE.
• Risks to our thesis. Anything preventing Grupo Aval from returningto its leading position as the most profitable banking conglomeratein Colombia is a risk. The focus on efficiency could damage qualityof service. Finally, an eventual financial conglomerates law couldimply headwinds for the conglomerate.
Valuation• Our 2015E target price is based on a DDM using a Ke of 12.5% in
COP terms and an exit P/B of 1.8x. Our T.P. at COP 1,530 implies a13.2x 2016E P/E and 2.1x 2015E P/B. Shares are trading at 12.8x2015E P/E, among the highest in our banking coverage and inline with the 5-year average at 13x. EVA-adjusted P/B seemsneutral, while PEG ratio is the highest among Colombian peers.
Price Chart (COP) and Volumes (USD mn)
Valuation Summary
P/B 12M Forward P/E 12M Forward Relative Valuation
Andean Equities Guide, 2015
Ticker pfaval cbPrice (COP) 1,325LTM Range (COP) 1,135 - 1,455Target 1,530Total Return 20%Market Cap (USD mn) 14,446Shares Outstanding (mn) 22,281Free Float 20%ADTV (USD mn) 3.3
2013 2014E 2015E 2016EP/E 15.1 15.2 12.8 11.4P/B 2.2 1.9 1.8 1.7ROAE 15.4% 13.7% 14.4% 15.1%Div . Yield 4.0% 4.0% 4.4% 5.0%Sources: Company Reports and Credicorp Capital
01020304050607080
70
80
90
100
110
Oct-13 Feb-14 Jun-14 Oct-14
USD
mn
PfAval COLCAP
1.0
1.5
2.0
2.5
3.0
3.5
Oct-07 Oct-09 Oct-11 Oct-134
8
12
16
20
Oct-07 Oct-09 Oct-11 Oct-13
Banco de Chile
Santander Chile
Corpbanca
Bogota
DaviviendaBancolombia
Grupo Aval
1.01.21.41.61.82.02.22.42.62.8
12% 14% 16% 18% 20% 22% 24%
2015
E P/
B
2015E ROAE
181

Grupo AvalCompany Description
Grupo Aval is the leading financial conglomerate in Colombia through its 4banks (Banco de Bogotá, Banco de Occidente, Banco Popular and BancoAV Villas). It is also leader in the pensions fund management and merchantbank businesses. Through BAC Credomatic, it is the leading player in theCentral American banking industry. Grupo Aval is controlled by Luis CarlosSarmiento Angulo.
Ownership Income Statement
Loans Breakdown (as of Jun-14) Balance Sheet
Funding structure (as of Jun-14)
Ratios
Management
CEO: Luis Carlos Sarmiento G.CFO: Diego SolanoIR Manager: Tatiana Uribewww.grupoaval.com
Andean Equities Guide, 2015
Corporate57%
Consumer28%
Mortgages7%
Micro-finance
0%
Financial leases
7%
Demand deposits
45%
Time deposits
23%
Interbank and
financial obligations
12%
Bonds 7%
Equity + min. int.
12%
Sarmiento Angulo (directly
and indirectly)
80%
General public20%
(%) 2012 2013 2014E 2015E 2016ENIM 6.7% 6.3% 6.0% 6.3% 6.3%Fee ratio 24.9% 25.3% 26.5% 24.7% 23.8%Cost-to-income ratio -55.3% -54.2% -53.7% -51.5% -51.4%NPL / Loans 1.6% 1.8% 1.9% 1.9% 1.9%LLP / Loans 3.2% 3.2% 3.1% 3.1% 3.1%Cost of credit risk -1.2% -1.5% -1.4% -1.4% -1.4%LLP / NPL 194% 179% 163% 163% 163%Deposit-to-loans ratio 105% 108% 108% 108% 108%Equity / Assets 11.4% 11.8% 12.9% 12.3% 11.6%Tangible ratio 9.3% 8.9% 10.4% 10.2% 9.8%ROAE 17.7% 15.4% 13.7% 14.4% 15.1%ROAA 2.0% 1.9% 1.7% 1.8% 1.8%Sources: Company Reports and Credicorp Capital; E Credicorp Capital Estimates
COP bn 2012 2013 2014E 2015E 2016ENet interest income 6,310 6,981 7,760 9,160 10,430Net fee income 2,383 2,815 3,176 3,420 3,699Operating income 9,566 11,113 11,988 13,825 15,519Prov ision expenses -916 -1,294 -1,392 -1,612 -1,836Operating expenses -5,289 -6,028 -6,443 -7,126 -7,980Net income 1,526 1,601 1,872 2,300 2,585EPS (COP) 82.3 84.7 87.4 103.2 116.0
COP bn 2012 2013 2014E 2015E 2016ECash & interbank deposits 13,399 16,097 18,084 20,508 23,291Investment portfolio 23,296 27,299 33,029 37,478 42,344Gross loans 80,029 96,514 108,187 122,685 139,338Total assets 127,663 154,287 174,988 197,092 222,252Total deposits 81,463 101,190 113,223 128,396 145,824Financial obligations 25,306 28,257 31,451 35,666 40,507Total Liabilities 113,172 136,087 152,473 172,906 196,375Minority interest 5,408 6,472 7,001 7,671 8,242Shareholders' equity 9,083 11,728 15,514 16,516 17,635Total liabilities + equity 127,663 154,287 174,988 197,092 222,252
182

Colombia Industry:Conglomerates
Rating:HoldGrupo Sura
Exposing to the young and wealthierJuan Dominguez
+(571) 339 4400 Ext 1026 [email protected]
Investment Thesis Stock Data
• We keep our Hold, due to challenges from integrating the assetmanagement business. Guidance on SUAM’s ROAE is at a stable12%-13% in coming years (adjusting for amortizations ofintangibles), as opex and reserve formation will offset a healthygrowth in fees and L&H premiums (annuities). Still, net profits fromSUAM should grow at a 15% average in 2014-2017, favored fromhealthy demographics in the region and cross-selling opportunitiesbetween mandatory pensions and voluntary savings / L&H products.
• The strategy seems sound. Both SUAM and Suramericana(insurance subholding) focus on high-worth individuals, aiming toattract clients with a better-quality service allowing a relatively higherprice. This should shield results despite price wars in some P&Clines, and strong competition in the savings industry.
• The long-term fundamentals remain solid. A young population(around 37% below 20 years old in the countries where SUAM haspresence) with an increasing salary base is the main driver forSUAM. Also, the low penetration of the banking and insuranceservices in Colombia implies room for growth in Bancolombia /Suramericana.
• Risks to our thesis. The most relevant risks are regulation (fees,capital requirements for insurance companies, etc.) and competition,especially in some operations such as Mexico. Future M&A activityis possible given the strong cash flows of GrupoSura.
Valuation• Our 2015E target price is based on a SOTP. Bancolombia was
included at our 2015E T.P.; Suramericana was estimated with aSOTP of the P&C, L&H, workers’ compensation and health servicessubsidiaries, using 2015E EVA-adjusted P/B and forward P/E.SUAM was valued through an EVA-adjusted P/B, using a ROAE of13% in 15E. Total return is in line with COLCAP, we keep on Hold.
Price Chart (COP) and Volumes (USD mn)
Valuation Summary
NAV Discount 2015E Value Breakdown
Andean Equities Guide, 2015
Bancolombia29%
SUAM23%Suramericana
13%
Grupo Argos19%
Nutresa15%
Other1%
Ticker gruposur cbPrice (COP) 39,680LTM Range (COP) 29,800 - 44,300Target 46,400Total Return 18%Market Cap (USD mn) 11,171Shares Outstanding (mn) 575Free Float 58%ADTV (USD mn) 5.5
2013 2014E 2015E 2016EP/E 24.8 30.1 27.6 23.8P/BV 1.0 1.0 0.9 0.9ROAE 3.8% 3.6% 3.6% 3.8%Div . Yield 1.0% 1.0% 1.1% 1.2%Sources: Company Reports and Credicorp Capital
0
10
20
30
40
50
60
70
80
90
100
110
120
Oct-13 Feb-14 Jun-14 Oct-14
USD
mn
GrupoSura COLCAP
-25%-20%-15%-10%-5%0%5%
10%15%
Oct
-09
Feb-
10
Jun-
10
Oct
-10
Feb-
11
Jun-
11
Oct
-11
Feb-
12
Jun-
12
Oct
-12
Feb-
13
Jun-
13
Oct
-13
Feb-
14
Jun-
14
Oct
-14
Grupo Sura vs NAV Discount/Premium (%) Average
183

Grupo SuraCompany Description
Grupo Sura is a financial holding which controls local and regional leadingcompanies in banking (largest shareholder of Bancolombia), assetmanagement (Sura Asset Management ) and insurance (Suramericana).Additionally, it holds non-strategic stakes in food processing (Nutresa) andinfrastructure (Grupo Argos). Grupo Sura, Grupo Argos and Grupo Nutresadisplay a cross-holding ownership as a result of measures taken decadesago to prevent hostile take-overs.
Investment portfolio
Ownership Income Statement and Main Operating Cash Flows
Management
CEO: David BojaniniCFO: Ignacio CalleIR Manager: Luis Eduardo Martínezwww.gruposuramericana.com
Andean Equities Guide, 2015
Grupo Argos31%
Grupo Nutresa
10%Pension funds26%
Foreign funds14%
Retail6%
Institutional investors
11%
Grupo Suramericana
Grupo NutresaFood-processing
35.1%
Grupo Argos
Suramericana# 1 insurance company in Colombia
81.1%
Strategic InvestmentsNon-strategic investments
35.5% of common shares
Bancolombia# 2 banking group in Colombia
44.1% of common shares
SUAM# 1 pension manager in Latam
67.1%Infrastructure
10.3%
31.4%
COP mn 2012 2013 2014E 2015E 2016EDiv idend income 265,721 385,134 322,994 341,933 392,291Equity method income 323,097 437,433 587,538 652,530 746,178Operating income 668,879 924,511 916,718 1,005,196 1,152,315Operating expenses -122,962 -45,986 -51,286 -55,310 -59,734EBIT 545,917 878,525 865,432 949,886 1,092,581Net income 546,100 781,794 757,503 825,787 958,179EPS (COP) 949 1,359 1,317 1,435 1,665ROAE 2.8% 3.8% 3.6% 3.6% 3.8%ROAA 2.5% 3.7% 3.4% 3.4% 3.6%
Main operating cash flows (Dividends received)Bancolombia 160,856 171,305 197,091 208,061 249,997SUAM 118,937 150,759 196,390 218,909Suramericana 42,793 81,018 69,269 82,371 92,155Nutresa 52,924 62,555 68,617 72,116 75,722Grupo Argos 36,709 51,974 57,286 61,755 66,572Div idends paid -248,140 -262,680 -255,498 -246,189 -268,381Sources: Company Reports and Credicorp Capital; E Credicorp Capital Estimates
184

2013 2014E 2015E 2016EFV/EBITDA 12.7 12.3 10.3 8.9 P/E 81.9 27.0 23.1 17.7 PEG 1.0 0.2 1.3 0.8 P/BV 1.6 1.8 1.7 1.6 Div . Yield 0.0% 0.0% 0.0% 0.0%Sources: Company Reports, Bloomberg and Credico
Peru Industry:
RetailRating:
BuyInRetail PeruRefinanced, defensive, & more efficient
Christopher DiSalvatore+(562) 2446 1724
Investment Thesis Stock Data
• Although we appreciate the risk in recommending shares in a periodof economic moderation, we believe a defensive sales mix (Food,Real Estate, Pharma) coupled with improved efficiency andcommercial strategy should drive results in the coming quarters.Moreover, we expect the slowdown in economic activity to revertheading into 2H14 and 2015, resulting in 5% average GDP growth(2015 & 2016), supporting continued dynamism in the consumersector. We maintain our Buy rating on shares.
• Reverting macro current to remain a lynchpin for consumptionin Peru. Our economic teams expects recent moderation to be shortlived thanks to favorable fiscal policy and private investment headingin 2015. Based on C.C. projections growth should rebound to 5 -5.5% in 2015. Increased scale and improved efficiency shouldcontinue driving margin/ROIC improvements over ntm. Moreover,refinancing should account for ~20% of EPS growth 2014-2016.
• Risks. Downside risks include a slower recuperation in economicactivity, PEN/USD depreciation, competitive pressure, and executionrisk. The possibility of the InRetail vehicle integrating assetscurrently controlled by its controlling group could drive further upsidein a best case scenario.
Price Chart (CLP) and Volumes (USD mn)
Valuation• In terms of 2015e P/E, shares a trading at an 10% premium to
regional peers, which we view as fair considering 20% EPS growthbetween 2015 and 2017. In terms of 2015e EV/EBITDA shares aretrading in line, despite higher expected EBITDA growth (+18% 14 –16) versus regional peers (10%).
• Our 2015E target increases 6% to $24.3 ($23 previous), primarilyreflecting a lower cost of debt (-100bps) assumed in our WACCcalculation. Our target is based on a 50/50 mix between a 10 year,nominal DCF and EV/EBITDA target multiple by business segment.
Valuation Summary
P/E 12M Forward FV/EBITDA 12M Forward Relative Valuation
Andean Equities Guide, 2015
Ticker inretc1 pePrice (USD$) 18.5LTM Range 19 - 142015E Target (USD$) 24.3Total Return 31.4%Market Cap (USD mn) 1,902Shares Outstanding (mn) 103Free Float 28%ADTV (USD mn) 0.7
0
2
4
6
8
10
70
80
90
100
110
120
Oct-13 Jan-14 Apr-14 Jul-14 Oct-14
USD
mn
InRetail IGBVL
15
20
25
30
35
Oct-13 Feb-14 Jun-14 Oct-148
9
10
11
12
Oct-13 Feb-14 Jun-14 Oct-14
Walmex
Cencosud
Falabella
Ex ito
InRetailSoriana
ComerciChedraui
10131619222528
8 10 12 14
P / E
2015
E
EV / EBITDA 2015E
185

InRetail PeruCompany Description
InRetail Peru is a multi-format retailer with operations includingsuper/hypermarkets, pharmacies, and real estate. The company is the 2ndlargest player in food retail, as well as the largest pharmacy and real estateoperator in Peru. Under 6 retail/real estate banners, the company operates98 super/hypermarkets, 754 pharmacies, and 18 shopping centers in Peru.
Ownership Income Statement
Sales by Segment (LTM) Balance Sheet
EBITDA by Segment (LTM)
Cash Flow
Management
CEO: Juan Carlos VallejoCFO: Augusto ReyIR Manager: Gonzalo Rosellwww.inretail.pe
Andean Equities Guide, 2015
PEN mn 2012 2013 2014E 2015E 2016ERevenues 4,784 5,324 6,093 6,810 7,497EBIT 367 409 491 535 623EBITDA 410 478 575 687 798Net Income 217 56 204 239 311EPS 25.4 0.5 2.0 2.3 3.0Gross Margin 28.1% 28.5% 29.2% 29.1% 29.4%EBITDA Margin 8.6% 9.0% 9.4% 10.1% 10.6%Net Margin 4.5% 1.0% 3.3% 3.5% 4.1%
PEN mn 2012 2013 2014E 2015E 2016EInitial Cash 373 1,097 283 183 183Cash Flow From Operations 614 -17 440 466 621CAPEX -615 -816 -780 -701 -574Changes in Financial Debt 106 99 330 329 86Div idends (Paid) Received 0 0 0 0 0Taxes -91 -80 -89 -94 -133Changes in Shareholders Equity 710 0 0 0 0Final Cash 1,097 283 183 183 184Change in Cash Position 724 -814 -99 0 0Sources: Company Reports and Credicorp Capital; E Credicorp Capital Estimates
Food 61.0%
Pharma 34.0%
Real Estate 4.6%
Intercorp & Subs 71.8%NG
Pharma 6.3%
Float 22.0%
Food 41.0%
Pharma 33.0%
Real Estate 26.0%
186
PEN mn 2012 2013 2014E 2015E 2016ECash & Equivalents 1,097 283 181 179 178Total Current Assets 2,019 2,019 1,507 1,514 1,626Total Assets 6,050 6,494 7,144 7,806 8,321Current Liabilities 1,344 1,688 1,813 1,946 2,086Financial Debt 1,668 1,767 2,109 2,421 2,501Total Liabilities 3,150 3,542 3,988 4,411 4,611Minority Interest 0 0 0 0 0Shareholders Equity 2,901 2,952 3,156 3,394 3,709Total Liabilities + Equity 6,050 6,494 7,144 7,806 8,321EBITDA / Fin. Expenses 2.6 2.7 3.2 3.3 4.1Financial Debt /EBITDA 4.1 3.7 3.7 3.5 3.1Financial Debt /Equity 0.6 0.6 0.7 0.7 0.7ROAE 9.4% 1.9% 6.7% 7.3% 8.8%ROAA 3.6% 0.9% 3.0% 3.2% 3.9%ROIC 8.1% 4.3% 7.2% 7.0% 7.5%

Colombia Industry:
UtilitiesRating:
UperfISAWaiting for the compensation in Brazil
Jaime Pedroza+(571) 339 44 00 ext. 1025
Investment Thesis Stock Data
• We are launching our 2015E TP of COP 8,910 (down 3.4% from2014 TP) while maintaining our UNDERPERFORM rating in ISA.
• The uncertainty about compensation in Brazil remains. As partof the renegotiation of contracts in Brazil that took place in 2013, ISAis waiting for part of the compensation agreed upon with theBrazilian Government. According to a study filed by ISA before theBrazilian power regulator (ANEEL), the value of this part of thecompensation should be BRL 5,186mn (USD ~2.3bn) using pricesas of December 31st, 2012. We expect ANEEL to provide an officialresponse regarding this study in January, 2015.
• Future opportunities. ISA’s main growth opportunities will comefrom participating in new toll-road concessions in Colombia, andnew power transmission concessions in Colombia, Chile and Peru.Furthermore, the company is implementing a new strategic planfocused on reaching operating efficiencies.
• Ecopetrol’s stake in ISA on sale. Ecopetrol’s BoD approved toadvance in the process of a possible sale of its interest (5.2%) inISA, worth USD 230 mn at current prices. Even though no date hasbeen set, this could generate downside pressures in the short term.
Price Chart (COP) and Volumes (USD mn)
Valuation• Our 2015 TP of COP 8,910/share comes from a fair value of COP
9,380/share adjusted by a 5% discount coming from the overhangrisk due to the sale of Ecopetrol’s stake in the company.
• Our model is based on a DCF at a 9.0% discount rate (WACC).Perpetuity growth stands at 3.0%, reflecting long-term forecasts onweighted-average inflations of the countries in which ISA is currentlyoperating. Also, our target price includes the present value of thecompensation from Brazil estimated by the company, risked at 70%.
Valuation Summary
P/E 12M Forward FV/EBITDA 12M Forward Relative Valuation
Andean Equities Guide, 2015
Ticker isa cbPrice (COP) 8,230LTM Range (COP) 9,800 - 7,330Target (COP) 8,910Total Return 12%Market Cap (USD mn) 4,447Shares Outstanding (mn) 1,108Free Float 31%ADTV (USD mn) 1.4
2013 2014E 2015E 2016EFV/EBITDA 11.4 10.0 10.1 10.5P/E 23.3 15.6 17.9 20.6P/CF n.a. 4.4 4.0 5.1P/BV 1.4 1.2 1.1 1.1Div . Yield 2.1% 2.6% 3.5% 3.1%Sources: Company Reports and Credicorp Capital
-
2
4
6
8
10
70
80
90
100
110
Oct-13 Apr-14 Oct-14
USD
mn
ISA Colcap
56789
1011121314
Jan-08 Jan-10 Jan-12 Jan-1410
20
30
40
50
60
Jan-08 Jan-10 Jan-12 Jan-14
Red Electrica
Terna
Elia
ITC Holdings
ISA
9
10
11
12
13 15 17 19
P/E
2015
E
EV/EBITDA 2015E
187

COP mn 2012 2013 2014E 2015E 2016ECash & Equivalents 1,676,906 1,820,189 2,205,206 956,556 363,521Total Current Assets 4,895,065 4,348,011 4,956,703 4,771,916 4,827,588Total Assets 25,770,989 25,567,362 26,095,495 25,122,646 25,415,745Current Liabilities 2,823,877 2,037,304 2,649,173 2,426,432 2,440,905Financial Debt 9,392,247 8,698,468 9,102,676 7,987,388 8,149,885Total Liabilities 15,487,053 14,411,340 14,528,919 13,307,336 13,386,712Minority Interest 4,173,321 3,704,545 3,768,837 3,827,923 3,879,148Shareholders Equity 6,110,615 7,451,477 7,797,739 7,987,388 8,149,885Total Liabilities + Equity 25,770,989 25,567,362 26,095,495 25,122,646 25,415,745EBITDA / Fin. Expenses 3.1 2.2 3.9 4.4 4.3Financial Debt /EBITDA 3.2 4.3 4.2 3.8 3.8Financial Debt /Equity 1.5 1.2 1.2 1.0 1.0ROAE 4.5% 5.2% 6.7% 6.9% 5.9%ROAA 1.1% 1.4% 2.0% 2.1% 1.9%ROIC 8.6% 9.3% 8.9% 8.2% 7.3%
ISACompany Description
ISA is dedicated to the construction, operation and maintenance of systems of linearinfrastructure. including: 1) Power transmission, 2) Toll road concessions, 3)Telecommunications transmission, and 4) Real-Time Systems intelligent management. Thecompany operates in Colombia, Chile, Peru, Brazil, Bolivia, Argentina, and Central America.
Ownership Income Statement
Revenue Breakdown (Jun-14) Balance Sheet
Revenues by Country
Cash Flow
Management
CEO: Luis Fernando AlarcónCFO: Carlos Alberto RodríguezIR Manager: Gloria Velásquezwww.isa.com.co
Andean Equities Guide, 2015
Power 67%
Toall road concessions
23%
Telecoms 6%
Other 4%
Brazil 23%
Colombia 41%
Peru 12%
Chile 23%
Other 1%
Colombian Government
51%
EPM 10%
Ecopetrol 5%
Pension Funds 15%
Other 18%COP mn 2012 2013 2014E 2015E 2016ERevenues 4,303,075 3,601,326 3,647,046 3,633,358 3,669,292EBIT 2,002,717 1,551,098 1,792,124 1,731,813 1,648,897EBITDA 2,903,106 2,011,674 2,151,854 2,120,633 2,120,142Net Income 272,938 433,048 583,572 509,447 441,674EPS (COP) 246.4 391.0 526.8 459.9 398.7EBIT Margin 46.5% 43.1% 49.1% 47.7% 44.9%EBITDA Margin 67.5% 55.9% 59.0% 58.4% 57.8%Net Margin 6.3% 12.0% 16.0% 14.0% 12.0%
COP mn 2012 2013 2014E 2015E 2016EInitial Cash 1,412,951 1,676,906 1,820,189 2,205,206 956,556Cash from Operations -1,004,271 -5,225,797 2,055,936 2,274,594 1,781,900CAPEX 2,236,054 6,362,751 -1,506,467 -1,756,770 -1,970,953Changes in Financial Debt -103,063 -693,779 404,208 -1,115,288 162,497Div idends (Paid) Received -198,277 -208,244 -237,310 -319,798 -279,177Taxes -666,488 -91,648 -331,350 -331,388 -287,303Changes in Equity 0 0 0 0 0Final Cash 1,676,906 1,820,189 2,205,206 956,556 363,521Change in Cash 263,955 143,283 385,017 -1,248,650 -593,035Sources: Company Reports and Credicorp Capital; E Credicorp Capital Estimates
188
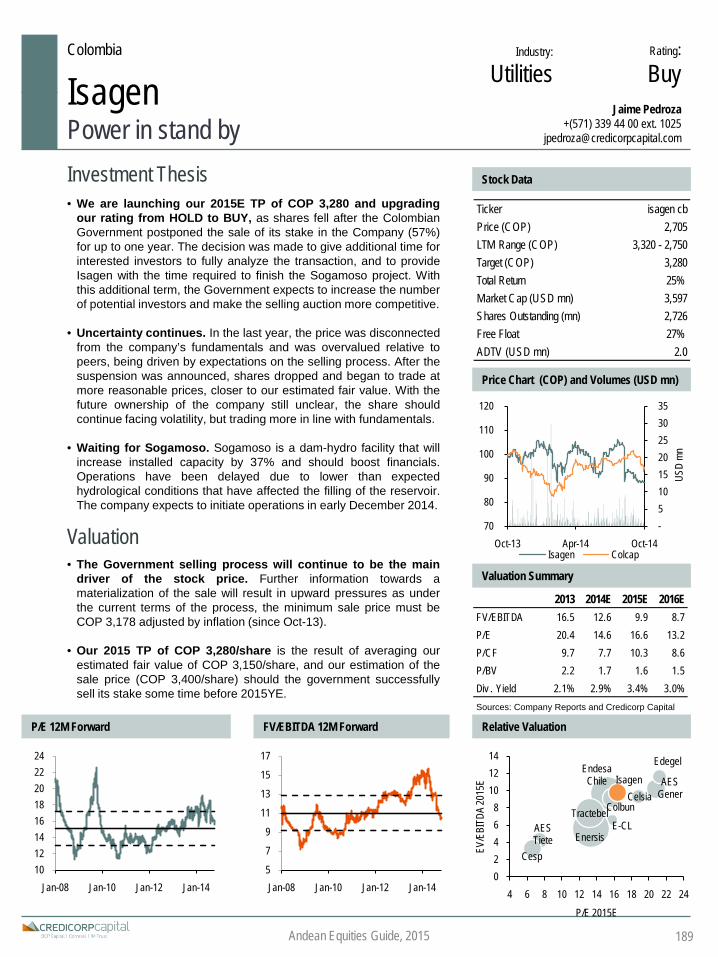
2013 2014E 2015E 2016EFV/EBITDA 16.5 12.6 9.9 8.7P/E 20.4 14.6 16.6 13.2P/CF 9.7 7.7 10.3 8.6P/BV 2.2 1.7 1.6 1.5Div . Yield 2.1% 2.9% 3.4% 3.0%Sources: Company Reports and Credicorp Capital
Colombia Industry:
UtilitiesRating:BuyIsagen
Power in stand byJaime Pedroza
+(571) 339 44 00 ext. [email protected]
Investment Thesis Stock Data
• We are launching our 2015E TP of COP 3,280 and upgradingour rating from HOLD to BUY, as shares fell after the ColombianGovernment postponed the sale of its stake in the Company (57%)for up to one year. The decision was made to give additional time forinterested investors to fully analyze the transaction, and to provideIsagen with the time required to finish the Sogamoso project. Withthis additional term, the Government expects to increase the numberof potential investors and make the selling auction more competitive.
• Uncertainty continues. In the last year, the price was disconnectedfrom the company’s fundamentals and was overvalued relative topeers, being driven by expectations on the selling process. After thesuspension was announced, shares dropped and began to trade atmore reasonable prices, closer to our estimated fair value. With thefuture ownership of the company still unclear, the share shouldcontinue facing volatility, but trading more in line with fundamentals.
• Waiting for Sogamoso. Sogamoso is a dam-hydro facility that willincrease installed capacity by 37% and should boost financials.Operations have been delayed due to lower than expectedhydrological conditions that have affected the filling of the reservoir.The company expects to initiate operations in early December 2014.
Price Chart (COP) and Volumes (USD mn)
Valuation• The Government selling process will continue to be the main
driver of the stock price. Further information towards amaterialization of the sale will result in upward pressures as underthe current terms of the process, the minimum sale price must beCOP 3,178 adjusted by inflation (since Oct-13).
• Our 2015 TP of COP 3,280/share is the result of averaging ourestimated fair value of COP 3,150/share, and our estimation of thesale price (COP 3,400/share) should the government successfullysell its stake some time before 2015YE.
Valuation Summary
P/E 12M Forward FV/EBITDA 12M Forward Relative Valuation
Andean Equities Guide, 2015
-5 10 15 20 25 30 35
70
80
90
100
110
120
Oct-13 Apr-14 Oct-14
USD
mn
Isagen Colcap
E-CL
Endesa Chile AES
GenerColbun
Enersis
Edegel
Celsia Isagen
AES Tiete
Tractebel
Cesp
02468
101214
4 6 8 10 12 14 16 18 20 22 24
EV/E
BITD
A 20
15E
P/E 2015E
Ticker isagen cbPrice (COP) 2,705LTM Range (COP) 3,320 - 2,750Target (COP) 3,280Total Return 25%Market Cap (USD mn) 3,597Shares Outstanding (mn) 2,726Free Float 27%ADTV (USD mn) 2.0
1012141618202224
Jan-08 Jan-10 Jan-12 Jan-145
7
9
11
13
15
17
Jan-08 Jan-10 Jan-12 Jan-14
189

IsagenCompany Description
Isagen is a power generation company in Colombia. It has 2,212 MW of installed capacity(14% thermal, 86% Hydro) which makes it the third largest power generator in Colombia.The company is developing the Sogamoso hydroelectric project which will add 820 MW ofinstalled capacity. Currently the project is waiting for the filling of the dam and it is expectedto be operating in December 2014.
Ownership Income Statement
Revenues Breakdown (Jun-14) Balance Sheet
Installed Capacity (Dec-14)
Cash Flow
Management
CEO: Luis Fernando Rico PinzónCFO: Juan Fernando VásquezIR Manager: Bertha Libia Suarezwww.isagen.com.co
Andean Equities Guide, 2015
COP mn 2012 2013 2014E 2015E 2016ECash & Equivalents 178,391 249,490 823,486 269,996 316,277Total Current Assets 782,073 876,386 1,033,577 973,514 979,595Total Assets 6,742,265 7,555,341 8,910,488 8,392,685 8,445,110Current Liabilities 492,841 558,530 727,434 615,306 570,293Financial Debt 2,180,497 2,679,478 3,454,672 2,701,130 2,422,481Total Liabilities 3,111,208 3,525,891 4,592,148 3,884,307 3,600,148Minority Interest 0 0 0 0 0Shareholders Equity 3,631,057 4,029,450 4,318,340 4,508,377 4,844,962Total Liabilities + Equity 6,742,265 7,555,341 8,910,488 8,392,685 8,445,110EBITDA / Fin. Expenses 14.6 20.1 20.6 3.4 4.6Financial Debt /EBITDA 3.6 3.9 4.3 2.7 2.2Financial Debt /Equity 0.6 0.7 0.8 0.6 0.5ROAE 12.7% 11.7% 11.3% 10.8% 10.7%ROAA 6.8% 6.3% 5.7% 5.5% 6.0%ROIC 8.1% 7.4% 7.2% 8.4% 9.8%
Colombian Government
58%
EPM 13%
EEB 3%
Pension funds 12%
Other 15%
Hydro 90%
Thermal 10%
National contracts
77%
International contracts
1%
Spot market 15%
Other 8%
COP mn 2012 2013 2014E 2015E 2016EInitial Cash 568,892 178,391 249,490 823,486 269,996Cash from Operations 496,879 914,120 961,816 718,649 861,750CAPEX -1,239,668 -1,022,898 -793,904 -116,771 -127,849Changes in Financial Debt 610,877 498,981 775,194 -753,542 -278,649Div idends (Paid) Received -209,908 -188,917 -217,266 -253,407 -222,010Taxes -48,682 -130,187 -151,844 -148,419 -186,960Changes in Equity 0 0 0 0 0Final Cash 178,391 249,490 823,486 269,996 316,277Change in Cash -390,501 71,099 573,996 -553,490 46,282Sources: Company Reports and Credicorp Capital; E Credicorp Capital Estimates
COP mn 2012 2013 2014E 2015E 2016ERevenues 1,731,539 2,002,813 2,282,263 2,533,580 2,628,209EBIT 501,455 581,013 677,545 858,383 959,746EBITDA 610,270 689,828 799,226 997,231 1,100,930Net Income 460,903 433,964 506,156 443,444 558,595EPS (COP) 169.1 159.2 185.7 162.7 205.0EBIT Margin 29.0% 29.0% 29.7% 33.9% 36.5%EBITDA Margin 35.2% 34.4% 35.0% 39.4% 41.9%Net Margin 26.6% 21.7% 22.2% 17.5% 21.3%
190
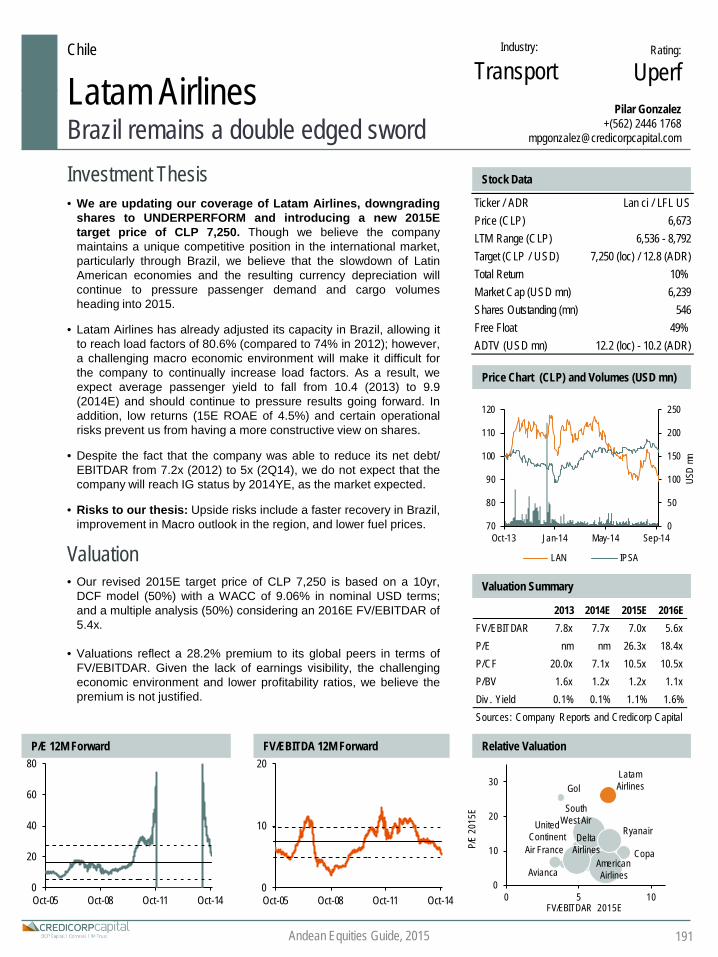
Avianca
Gol
Copa Delta
AirlinesAmerican Airlines
South West Air
Latam Airlines
United Continent Ryanair
Air France
0
10
20
30
0 5 10
P/E
2015
E
FV/EBITDAR 2015E
0
20
40
60
80
Oct-05 Oct-08 Oct-11 Oct-140
10
20
Oct-05 Oct-08 Oct-11 Oct-14
2013 2014E 2015E 2016EFV/EBITDAR 7.8x 7.7x 7.0x 5.6xP/E nm nm 26.3x 18.4xP/CF 20.0x 7.1x 10.5x 10.5xP/BV 1.6x 1.2x 1.2x 1.1xDiv . Yield 0.1% 0.1% 1.1% 1.6%Sources: Company Reports and Credicorp Capital
Chile Industry: Rating:
UperfLatam AirlinesBrazil remains a double edged sword
Pilar Gonzalez+(562) 2446 1768
Investment Thesis Stock Data
• We are updating our coverage of Latam Airlines, downgradingshares to UNDERPERFORM and introducing a new 2015Etarget price of CLP 7,250. Though we believe the companymaintains a unique competitive position in the international market,particularly through Brazil, we believe that the slowdown of LatinAmerican economies and the resulting currency depreciation willcontinue to pressure passenger demand and cargo volumesheading into 2015.
• Latam Airlines has already adjusted its capacity in Brazil, allowing itto reach load factors of 80.6% (compared to 74% in 2012); however,a challenging macro economic environment will make it difficult forthe company to continually increase load factors. As a result, weexpect average passenger yield to fall from 10.4 (2013) to 9.9(2014E) and should continue to pressure results going forward. Inaddition, low returns (15E ROAE of 4.5%) and certain operationalrisks prevent us from having a more constructive view on shares.
• Despite the fact that the company was able to reduce its net debt/EBITDAR from 7.2x (2012) to 5x (2Q14), we do not expect that thecompany will reach IG status by 2014YE, as the market expected.
• Risks to our thesis: Upside risks include a faster recovery in Brazil,improvement in Macro outlook in the region, and lower fuel prices.
Price Chart (CLP) and Volumes (USD mn)
Valuation• Our revised 2015E target price of CLP 7,250 is based on a 10yr,
DCF model (50%) with a WACC of 9.06% in nominal USD terms;and a multiple analysis (50%) considering an 2016E FV/EBITDAR of5.4x.
• Valuations reflect a 28.2% premium to its global peers in terms ofFV/EBITDAR. Given the lack of earnings visibility, the challengingeconomic environment and lower profitability ratios, we believe thepremium is not justified.
Valuation Summary
P/E 12M Forward FV/EBITDA 12M Forward Relative Valuation
Andean Equities Guide, 2015
Transport
0
50
100
150
200
250
70
80
90
100
110
120
Oct-13 Jan-14 May-14 Sep-14
USD
mn
LAN IPSA
191
Ticker / ADR Lan ci / LFL USPrice (CLP) 6,673LTM Range (CLP) 6,536 - 8,792Target (CLP / USD) 7,250 (loc) / 12.8 (ADR)Total Return 10%Market Cap (USD mn) 6,239Shares Outstanding (mn) 546Free Float 49%ADTV (USD mn) 12.2 (loc) - 10.2 (ADR)

Latam AirlinesCompany Description
Latam Airlines is the largest South American airline, offering passenger andcargo air transport services. It has international and domestic operations inChile, Argentina, Brazil, Paraguay, Peru, Ecuador and Colombia. Itcurrently owns more than 300 aircrafts, flying to more than 116 destinationsand transporting more than 60 mn passengers annually.
Ownership Income Statement
Revenue Breakdown by Format (LTM) Balance Sheet
Passenger ASKs breakdown (LTM)
Cash Flow
Management
Latam VP: Enrique Cueto PlazaLan CEO: Ignacio Cueto PlazaTam CEO: Marco Antonio BolognaLatam CFO: Andrés OsorioIR Manager: Gisella Escobarwww.latamairlinesgroup.net
Controller 51%
Float 49%
Domestic 12%
Internac. 43%
Brazil 27%
Cargo 14%
Other 3%
Regional 17%
Long Haul 35%
Brazil 33%
Chile 7%
Argentina 2%
Colombia 2%
Ecuador 1% Peru
3%
Andean Equities Guide, 2015
USD mn 2012 2013 2014E 2015E 2016ERevenues 9,942 13,266 12,684 13,136 13,122EBIT 317 644 556 787 952EBITDAR 1,415 2,127 2,065 2,220 2,782Net Income 26 -281 -9 237 340EPS (CLP) 32 -301 -10 254 363EBIT Margin 3.2% 4.9% 4.4% 6.0% 7.3%EBITDAR Margin 14.2% 16.0% 16.3% 16.9% 21.2%Net Margin 0.3% -2.1% -0.1% 1.8% 2.6%
USD mn 2012 2013 2014E 2015E 2016EInitial Cash 374 650 1,985 2,038 1,965Cash from Operations -4,190 1,683 1,073 1,280 3,803CAPEX -2,389 -1,382 -1,183 -1,546 -2,063Changes in Financial Debt 6,055 154 198 362 -1,495Div idends (Paid) Received -125 -8 -4 -71 -102Taxes -102 0 -32 -97 -146Changes in Equity 1,027 888 0 0 0Final Cash 650 1,985 2,038 1,965 1,963Change in Cash 276 1,335 53 -72 -2Sources: Company Reports and Credicorp Capital; E Credicorp Capital Estimates
192
USD mn 2012 2013 2014E 2015E 2016ECash & Equivalents 650 1,985 2,038 1,965 1,963Total Current Assets 3,348 4,980 4,972 4,927 4,913Total Assets 20,593 22,631 22,666 23,299 23,957Current Liabilities 5,780 6,509 6,336 6,424 6,364Financial Debt 9,746 9,900 10,109 10,480 10,951Total Liabilities 15,424 17,305 17,349 17,813 18,231Minority Interest 27 88 88 90 93Shareholders Equity 5,142 5,239 5,230 5,396 5,633Total Liabilities + Equity 20,593 22,631 22,666 23,299 23,957EBITDAR / Fin. Expenses 6.5 5.5 5.1 4.7 5.8Financial Debt /EBITDAR 6.9 4.7 5.0 4.7 3.9Financial Debt /Equity 1.9 1.9 1.9 1.9 1.9ROAE 0.5% nm nm 4.5% 6.1%ROAA 0.1% nm 0.0% 1.0% 1.4%ROIC 3.7% 2.1% 2.4% 2.2% 1.8%

Peru Industry:
UtilitiesRating:
BuyLuz del SurSympathy for generation
Fernando Pereda+(511) 416 3333 - Ext: 37856
Investment Thesis Stock Data
• We are setting a Buy rating on the shares and a 2015YE TP ofPEN 10.97, while dropping our 2014YE TP of PEN 10.07. LdS isactively seeking growth in the energy generation segment throughthe development of new projects (hydro and/or thermal generation);while maintaining its sustainable growth policy in the distributionbusiness, which focuses on managing effectively its operational risk.
• Inroads into generation as a new source of value that LdS isexpected to increase in time. The company’s Santa Teresa hydroplant began operations in 4Q14 (98 MW; USD 154mn), the first ofpotentially several generation projects that should add value.
• Vigorous growth in the household energy consumption marketwill continue to be the main driver of Luz del Sur’s energy sales,which will grow 5.1% in 2015 and 5.7% in 2016.
• Current regulatory framework and Peru’s economic stabilitywill mitigate operational risk. Moreover, the company continues tosign long-term contracts to afford greater stability in its future cashflows, since energy purchases represent more than 80% of COGS.
• Risks to our thesis: Slower pace in the concession area.
Price Chart (PEN) and Volumes (USD mn)
Valuation• LdS trades at 9.0x FV/EBITDA and 13.3x P/E, which is justified
since Santa Teresa hydro plant will enhance margins through 2015.
• The Capex spent in recent years has allowed the company toefficiently meet growing electric demand in its concession area. Thisimproved street lighting and reduced energy losses to 7.2%.
• We assessed our TP with a DCF model that considers higherenergy consumption in the concession area; nevertheless, energycosts have been revised upward, which will increase revenues whilereducing margins in the distribution business.
Valuation Summary
P/E 12M Forward FV/EBITDA 12M Forward Relative Valuation
Andean Equities Guide, 2015
0
5
10
15
Oct-05 Oct-08 Oct-11 Oct-140
5
10
Oct-05 Oct-08 Oct-11 Oct-14
0
1
2
3
4
80
90
100
110
120
Oct-13 Feb-14 Jun-14 Oct-14
USD
m
Luz del Sur IGBVL
CPFL
Luz del Sur
Coelce
Edelnor
0
5
10
15
20
25
0 5 10 15
P/E
2015
E
FV/EBITDA 2015E
193
Ticker lusurc1 pePrice (PEN) 9.82LTM Range (USD) 8.3 - 10.0Target (PEN) 10.97Total Return 17%Market Cap (USD mn) 1,668Shares Outstanding (mn) 487Free Float 17%ADTV (USD mn) 0.4
2013 2014E 2015E 2016EFV/EBITDA 10.2 10.0 9.0 8.4P/E 14.2 14.3 13.3 12.5
P/CF 103.0 21.9 23.8 21.8P/BV 2.9 2.8 2.7 2.5Div . Yield 6.1% 4.8% 5.0% 5.4%Sources: Company Reports and Credicorp Capital

Luz del SurCompany Description
Luz del Sur distributes electricity to the southern area of Lima with morethan 940.000 customers and a concession territory of 3,000 km2. Thecompany distributes 30% of the electricity in Peru, covering 30 of the mostimportant districts of Lima (4 million residents) with a 100% electrificationrate and the lowest energy losses in Peru. Controlled by Sempra Energy.
Ownership Income Statement
Sales Breakdown (% of MW.h in 2015) Balance Sheet
COGS Breakdown (2015)
Cash Flow
Management
CEO: Mile CacicCFO: Luis Fernando de las CasasIR Manager: -
Andean Equities Guide, 2015
Pension Funds 10%
Ontario Quinta 61%
Peruvian Opportun
ity Company
13%
Others 16%
Regulated 93%
Non-regulated
7%
Non-cash charges
5%
Energy purchase
s 83%
Labour 4%
Services 4%
Others 3%
PEN mn 2012 2013 2014E 2015E 2016ERevenues 2,078 2,201 2,516 2,747 2,963EBIT 478 485 510 549 588EBITDA 550 560 594 659 706Net Income 309 321 339 364 387EPS (PEN) 0.64 0.66 0.70 0.75 0.79EBIT Margin 23.0% 22.0% 20.3% 20.0% 19.9%EBITDA Margin 26.5% 25.4% 23.6% 24.0% 23.8%Net Margin 14.9% 14.6% 13.5% 13.3% 13.1%
PEN mn 2012 2013 2014E 2015E 2016ECash & Equivalents 29 19 60 127 188Total Current Assets 368 407 500 605 701Total Assets 2,884 3,466 3,804 4,065 4,331Current Liabilities 455 619 620 647 675Financial Debt 835 1,159 1,306 1,442 1,578Total Liabilities 1,496 1,869 2,098 2,240 2,381Minority Interest 0 0 0 0 0Shareholders Equity 1,388 1,597 1,705 1,825 1,950Total Liabilities + Equity 2,884 3,466 3,804 4,065 4,331EBITDA / Fin. Expenses 13.9 14.3 14.8 14.4 13.1 Financial Debt /EBITDA 1.5 2.1 2.2 2.2 2.2Financial Debt /Equity 0.6 0.7 0.8 0.8 0.8ROAE 22.3% 21.5% 20.6% 20.6% 19.8%ROAA 10.7% 10.1% 9.3% 9.3% 9.2%ROIC 15.3% 13.8% 12.5% 12.6% 12.7%
PEN mn 2012 2013 2014E 2015E 2016EInitial Cash 24 29 19 60 127Cash from Operations 318 262 433 442 474CAPEX -296 -322 -306 -267 -288Changes in Financial Debt -158 292 147 137 136Div idends (Paid) Received -234 -257 -231 -244 -262Other CFI & CFF Items 374 14 -2 0 0Changes in Equity 0 0 0 0 0Final Cash 29 19 60 127 188Change in Cash 5 -10 41 67 60Sources: Company Reports and Credicorp Capital; E Credicorp Capital Estimates
194

2013 2014E 2015E 2016EFV/EBITDA 3.6 3.9 3.2 2.6P/E 12.8 8.1 6.1 4.6P/CF 4.8 4.0 3.4 2.4P/BV 1.5 1.7 1.3 1.0Div . Yield 0.0% 1.4% 0.4% 5.1%Sources: Company Reports and Credicorp Capital
Minmetals
Sumitomo Metal Mining
Boliden Volcan
Milpo0
5
10
15
20
25
0 5 10
P/E
2015
E
FV/EBITDA 2015E
0
5
10
15
Oct-05 Oct-08 Oct-11 Oct-140
1020304050607080
Oct-05 Oct-08 Oct-11 Oct-14
Peru Industry:
MiningRating:BuyMilpo
Rust proof the copper plateHector Collantes
+(511) 416 3333 Ext 33052 [email protected]
Investment Thesis Stock Data
• We are increasing our 2015YE TP to PEN3.25 and upgrading toBUY on near term 20% capacity expansion of its largest mine.
• Milpo’s largest mine expanded in 2013, and will do so again in2015. Milpo is about to deploy USD40mn in capex (33% cheaperthan comparable expansions due to previous plant replacements) ifit gets permission –which is very likely- to start a new expansion atCerro Lindo by 3Q15 (to 18,000 tpd, +20%) boosting revenues by14%. This Zn, Cu, Ag, Pb mine is 60% of Milpo’s EBITDA.
• Pasco unit operating integration continues. The El Porvenir andAtacocha mines further integration of tailings dams will be definedby 4Q14. Final permits need to be overcome. Hence, savingsresulting from the stoppage of tailings pumping (USD4.5/MT oftreated ore) and the avoidance of annual construction of ever tallerdams (USD6.5mn) are still not factored in.
• Risks to our thesis: Unfavorable final studies or permits for CerroLindo expansion or Pasco integration, higher cost pressures. Upsiderisk comes from a successful restart of copper mines in Chile andPeru that we now consider off the base case.
Price Chart (PEN) and Volumes (USD mn)
Valuation• Our new 2015YE target price is based on a 18-year (as per life of
mine in global reserves), DCF valuation and 56% of Atacocha’s 7-year DCF.
• Despite 2014 notorious outperformance, shares still trade atrelatively low 6.5x 2015E P/E. In a related note, FV/EBITDA 2015Eof 3.8x imply a 40% discount to peers as the market seems to notprice in upcoming strong growth from the still unapproved mineexpansion.
Valuation Summary
P/E 12M Forward FV/EBITDA 12M Forward Relative Valuation
Andean Equities Guide, 2015
0
1
2
3
4
5
80
100
120
140
160
180
200
Oct-13 Feb-14 Jun-14 Oct-14
USD
m
Milpo IGBVL
195
Ticker milpoc1 pePrice (PEN) 2.50LTM Range (PEN) 1.51 - 2.79Target (PEN) 3.25Total Return 30%Market Cap (USD mn) 1,145Shares Outstanding (mn) 1,324Free Float 55%ADTV (USD mn) 0.5

USD mn 2012 2013 2014E 2015E 2016ECash & Equivalents 88 327 418 536 719Total Current Assets 857 1,110 1,254 1,462 1,696Total Assets 857 1,110 1,254 1,462 1,696Current Liabilities 198 152 149 161 154Financial Debt 179 368 368 368 368Total Liabilities 372 557 561 580 568Minority Interest 0 0 0 0 0Shareholders Equity 486 553 694 882 1,128Total Liabilities + Equity 857 1,110 1,254 1,462 1,696EBITDA / Fin. Expenses 57.0 18.5 20.0 22.2 27.7Financial Debt /EBITDA 0.9 1.5 1.2 1.0 0.8Financial Debt /Equity 0.4 0.7 0.5 0.4 0.3ROAE 4.1% 12.6% 22.6% 23.9% 24.5%ROAA 2.3% 6.7% 11.9% 13.9% 15.6%ROIC 3.7% 12.6% 22.6% 23.9% 24.5%
USD mn 2012 2013 2014E 2015E 2016EInitial Cash 151 88 327 418 536Cash from Operations 53 102 191 260 292CAPEX -190 -87 -100 -142 -109Changes in Financial Debt 46 189 0 0 0Div idends (Paid) Received -7 0 -16 -5 -59Financial&Investing, others 34 36 16 5 59Changes in Equity 0 0 0 0 0Final Cash 88 327 418 536 719Change in Cash -64 239 91 118 183Sources: Company Reports and Credicorp Capital; E Credicorp Capital Estimates
MilpoCompany Description
Milpo directly operates the polymetallic (zinc, lead and silver) mines ofCerro Lindo (expanding to 18,000 tpd) and El Porvenir (5,600 tpd) andindirectly, Atacocha (56% of equity) in Peru. It also maintains rights buthave suspended production in the copper mines of Chapi (Peru) and Iván(Chile). Milpo is majority owned by the Brazilian Votorantim.
Ownership Income Statement
Revenue Breakdown by Metal Balance Sheet
Revenue Breakdown by Mine
Cash Flow
Management
CEO: Víctor GobitzCFO: Persio MorassuttiIRO: Henry Aragónwww.milpo.com.pe
Andean Equities Guide, 2015
Votoran tim 45%
Peruv ian Pension Funds 18%
Others 37%
Zinc 52%
Copper 29%
Silv er 11%
Lead 7%Gold 1%
Cerro Lindo 67%
El Porvenir
19%
Atacocha 14%
USD mn 2012 2013 2014E 2015E 2016ERevenues 520 615 679 791 868EBIT 155 184 231 285 368EBITDA 206 247 300 360 448Net Income 20 65 141 188 246EPS (USD) 0.02 0.05 0.13 0.17 0.00EBIT Margin 29.8% 29.9% 34.0% 36.1% 42.4%EBITDA Margin 39.6% 40.1% 44.2% 45.5% 51.6%Net Margin 3.9% 10.6% 20.7% 23.8% 28.4%
196

2013 2014E 2015E 2016EFV/EBITDA 2.3 4.2 4.5 4.6P/E 6.0 8.2 8.2 8.5P/CF 3.3 3.9 4.3 4.4P/BV 0.6 0.6 0.5 0.4Div . Yield 1.9% 2.9% 2.5% 2.4%Sources: Company Reports and Credicorp Capital
Peru Industry:
MiningRating:BuyMinsur
Tin resilience is maturingHéctor Collantes
+(511) 4163333 – Ext 33052 [email protected]
Investment Thesis Stock Data
• We maintain our 2015YE TP of PEN 2.20 and a BUY rating due tooutput stabilization, better cost control and improvements insubsidiaries. The most important variable to look at is tin output.
• Tin output may recede slightly, gold may remain steady.Refined tin output may go back to 23,000 MT/year in 2015 (-2% y/y).Tin head grade has fallen to 2.24%, but that in resources is still at4%. Pucamarca will surpass 100,000 Au oz (75,000 Au oz originallyexpected) thanks to a capacity expansion to 17,500 tpd (+21%).
• Cost was controlled sooner than expected. The transitiontowards long hole drilling in narrow vein mining finished withoutimpacting costs in 1H14. The cost increase is linked to higherexplorations that have already started to expand reserves.
• Brazil resurfaced, no news from Chile. Taboca added positiveEBITDA in 2014, and expansions are studied for the first time.Melón is still covering its debt payments.
• Risks to our thesis: Tin reserves may not be replaced. Tin gradesmay fall faster than expected. Indonesia’s restrictions may ease andbring down the tin price.
Price Chart (PEN) and Volumes (USD mn)
Valuation• Tin and copper potential still not considered. We sum a 9-year
DCF for the San Rafael Sn and Pucamarca Au operations (50% ofTP) and subsidiaries at 0.75x P/BV (50% of TP). Neither Bofedal II’sexpected tin (prefeasibility 1H15) nor Mina Justa’s copper (start in2020) are included due to their early stages.
• Conglomerate discount seems to hold. Minsur continues to tradebelow peers despite its higher margins. New management’s higheremphasis in disclosure may drive a rerate.
Valuation Summary
P/E 12M Forward FV/EBITDA 12M Forward Relative Valuation
Malasysia Smelting
CorpMetals X Ltd
Minsur
Timah Persero Tbk
0
5
10
15
20
25
0 5 10 15
P/E
2015
E
FV/EBITDA 2015E
0
5
10
15
20
25
30
Oct-05 Oct-08 Oct-11 Oct-140
5
10
Oct-05 Oct-08 Oct-11 Oct-14
Andean Equities Guide, 2015 197
0
2
4
6
8
10
60
80
100
120
140
160
180
Oct-13 Feb-14 Jun-14 Oct-14
USD
m
Minsur IGBVL
Ticker minsuri1 pePrice (PEN) 1.75LTM Range (PEN) 1.20 - 1.97Target (PEN) 2.20Total Return 28%Market Cap (USD mn) 1,738Shares Outstanding (mn) 2,883Free Float 33%ADTV (USD mn) 0.6
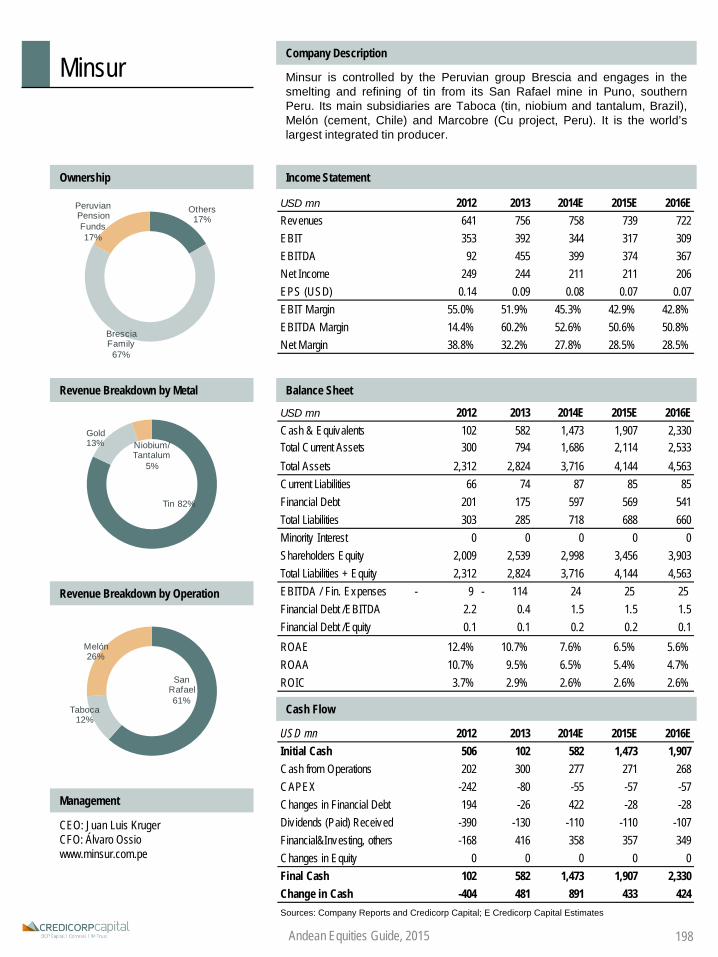
USD mn 2012 2013 2014E 2015E 2016ECash & Equivalents 102 582 1,473 1,907 2,330Total Current Assets 300 794 1,686 2,114 2,533Total Assets 2,312 2,824 3,716 4,144 4,563Current Liabilities 66 74 87 85 85Financial Debt 201 175 597 569 541Total Liabilities 303 285 718 688 660Minority Interest 0 0 0 0 0Shareholders Equity 2,009 2,539 2,998 3,456 3,903Total Liabilities + Equity 2,312 2,824 3,716 4,144 4,563EBITDA / Fin. Expenses 9- 114- 24 25 25 Financial Debt /EBITDA 2.2 0.4 1.5 1.5 1.5Financial Debt /Equity 0.1 0.1 0.2 0.2 0.1ROAE 12.4% 10.7% 7.6% 6.5% 5.6%ROAA 10.7% 9.5% 6.5% 5.4% 4.7%ROIC 3.7% 2.9% 2.6% 2.6% 2.6%
MinsurCompany Description
Minsur is controlled by the Peruvian group Brescia and engages in thesmelting and refining of tin from its San Rafael mine in Puno, southernPeru. Its main subsidiaries are Taboca (tin, niobium and tantalum, Brazil),Melón (cement, Chile) and Marcobre (Cu project, Peru). It is the world’slargest integrated tin producer.
Ownership Income Statement
Revenue Breakdown by Metal Balance Sheet
Revenue Breakdown by Operation
Cash Flow
Management
CEO: Juan Luis KrugerCFO: Álvaro Ossiowww.minsur.com.pe
Andean Equities Guide, 2015
Others 17%
Brescia Family 67%
Peruvian Pension Funds 17%
Tin 82%
Gold 13% Niobium/
Tantalum 5%
San Rafael 61%
Taboca 12%
Melón 26%
198
USD mn 2012 2013 2014E 2015E 2016ERevenues 641 756 758 739 722EBIT 353 392 344 317 309EBITDA 92 455 399 374 367Net Income 249 244 211 211 206EPS (USD) 0.14 0.09 0.08 0.07 0.07EBIT Margin 55.0% 51.9% 45.3% 42.9% 42.8%EBITDA Margin 14.4% 60.2% 52.6% 50.6% 50.8%Net Margin 38.8% 32.2% 27.8% 28.5% 28.5%
USD mn 2012 2013 2014E 2015E 2016EInitial Cash 506 102 582 1,473 1,907Cash from Operations 202 300 277 271 268CAPEX -242 -80 -55 -57 -57Changes in Financial Debt 194 -26 422 -28 -28Div idends (Paid) Received -390 -130 -110 -110 -107Financial&Investing, others -168 416 358 357 349Changes in Equity 0 0 0 0 0Final Cash 102 582 1,473 1,907 2,330Change in Cash -404 481 891 433 424Sources: Company Reports and Credicorp Capital; E Credicorp Capital Estimates

2013 2014E 2015E 2016EFV/EBITDA 16.5 13.2 12.6 11.9P/E 31.9 43.5 42.0 38.3P/CF -45.7 40.7 18.6 17.6P/BV 1.6 1.6 1.6 1.6Div . Yield 1.5% 1.6% 1.7% 1.8%Sources: Company Reports and Credicorp Capital
Colombia Industry: Rating:
BuyNutresaFundamentals remain strong
Carlos E Rodríguez.+(571) 339 4400 ext. 1365
Investment Thesis Stock Data
• We maintain Nutresa’s rating on Buy while cutting our TP toCOP 32,000 / share (-1.8%). Fundamentals remain strong and eventhough multiples remain high, they lie below historical figures.
• We expect that the relative stability on commodity prices in thecoming quarters should not bring pressure to EBITDA margins,which we expect to continue in the upper limit of the management’s12%-14% guidance range.
• The Venezuela effect (new exchange rate SICAD II) meant lessrevenues in USD-terms in 2014, but reduced the exposure to thiscountry significantly. Thus, future political or economic changes inVenezuela would be less relevant to Nutresa; this country nowcontributes with a mere 1.4% of revenues.
• Nutresa is a play on Colombian local demand, which we expectto remain robust (5.1% in 2014 and 4.6% in 2015). The LatinAmerican middle class continues supporting revenue growth andsound cash generation, but we are conservative in the short term aswe expect lower economic growth outside Colombia. Better thanexpected economic outlook in Chile could have a positive impact inTMLUC and Nutresa’s consolidated figures.
Price Chart (COP) and Volumes (USD mn)
Valuation• Our fundamental value of COP 31,100/share is based on a DCF
model at an 8.3% discount rate, a long-term EBITDA margin of13.4% and a real perpetuity growth of 1%. We arrive at our TP of32,000 / share by factoring in investor’s appetite to gain exposure torobust fundamentals and consumption dynamics in Colombia.
• Our TP implies a 12.2x 2015E FV/EBITDA, in line with peers, anda 33.8x 2015E P/E. Given the size of the company’s investmentportfolio (USD 2.1bn) relative to the operating business, thesemultiples are clean from this effect (different from tables and graphsin this document) to reflect the valuations of the core business.
Valuation Summary
P/E 12M Forward FV/EBITDA 12M Forward Relative Valuation
Food & Beverages
- 2 4 6 8 10 12 14
80
85
90
95
100
105
110
Oct-13 Apr-14
USD m
n
Nutresa Colcap
199Andean Equities Guide, 2015
Ticker nutresa cb equityPrice (COP) 27,000LTM Range (COP) 23,400 - 28,700Target (COP) 32,000Total Return 20.2%Market Cap (USD mn) 6,017Shares Outstanding (mn) 460Free Float 47%ADTV (USD mn) 2.1
20
25
30
35
40
45
50
Mar-10 Mar-11 Mar-12 Mar-13 Mar-1410
15
20
25
Mar-10 Mar-11 Mar-12 Mar-13 Mar-14
NestleBimbo Hershey
Nutresa
McCormickMondelez
KraftSmucker
Alicorp10
15
20
25
30
35
40
45
50
9 11 13 15 17
P/E
201
5E
EV/EBITDA 2015E
César Cuervo, CFA+(571) 3394400 Ext 1012

NutresaCompany Description
Grupo Nutresa is a leading company in the LatAm food processing industrywith presence in 7 segments, through 70 brands: cold cuts, biscuits,chocolate, coffee, ice cream, pastas and Tresmontes Lucchetti. It is numberone in Colombia in almost all segments with a consolidated market share of60%.
Ownership Income Statement
Revenues Breakdown Balance Sheet
EBITDA Breakdown
Cash Flow
Management
CEO: Carlos Ignacio GallegoCFO: José D. PenagosIR Manager: Alejandro Jiménezhttp://www.gruponutresa.com/en/relacion_inversionistas
Grupo Sura, 35%
Grupo Argos,
8%Pension Funds, 15%
Others, 42%
Cold Cuts, 25%
Biscuits, 20%
Chocolates, 16%
Coffee, 13%
Ice Cream,
9%
Pastas , 4%
TMLUC, 12%
Others, 2%
Cold Cuts, 25%
Biscuits, 19%
Chocolates, 14%
Coffee, 19%
Ice Cream,
10%
Pastas , 3%
TMLUC, 10%
200Andean Equities Guide, 2015
COP mn 2012 2013 2014E 2015E 2016EInitial Cash 193.087 291.812 415.478 211.657 225.423Cash from Operations 768.982 552.526 810.875 777.005 825.005CAPEX -378.683 -1.383.555 -580.620 -386.700 -411.698Changes in Financial Debt 10.756 1.306.383 -108.754 -37.254 -26.989Div idends (Paid) Received -163.873 -177.201 -196.348 -205.460 -221.433Taxes -138.457 -174.487 -128.974 -133.826 -146.999Changes in Equity 0 0 0 0 0Final Cash 291.812 415.478 211.657 225.423 243.310Change in Cash 98.725 123.666 -203.821 13.766 17.887Sources: Company Reports and Credicorp Capital; E Credicorp Capital Estimates
COP mn 2012 2013 2014E 2015E 2016ECash & Equivalents 291,812 639,105 211,657 225,423 243,310Total Current Assets 1,547,411 2,294,205 1,983,935 2,108,520 2,263,911Total Assets 8,951,564 10,580,498 10,694,805 10,816,229 10,979,768Current Liabilities 757,672 1,348,361 1,188,618 1,201,023 1,225,080Financial Debt 690,354 1,996,737 1,890,483 1,856,032 1,832,279Total Liabilities 1,526,312 3,150,427 2,971,544 3,002,556 3,062,701Minority Interest 16,294 19,209 16,643 16,730 16,814Shareholders Equity 7,408,958 7,410,862 7,706,617 7,796,943 7,900,253Total Liabilities + Equity 8,951,564 10,580,498 10,694,805 10,816,229 10,979,768EBITDA / Fin. Expenses 11.5 9.4 5.2 5.4 5.7Financial Debt /EBITDA 1.0 2.4 2.1 1.9 1.8Financial Debt /Equity 0.1 0.3 0.2 0.2 0.2ROAE 5.0% 5.1% 3.8% 3.8% 4.1%ROAA 4.1% 3.9% 2.7% 2.8% 3.0%ROIC 4.6% 4.6% 4.0% 4.1% 4.4%
COP mn 2012 2013 2014E 2015E 2016ERevenues 5,305,782 5,898,466 6,426,793 6,827,697 7,352,340EBIT 521,112 650,229 556,284 573,016 618,594EBITDA 671,095 832,827 920,117 962,875 1,022,145Net Income 345,506 380,237 287,719 298,545 327,930EPS (COP) 750.9 826.4 625.3 648.8 712.7EBIT Margin 9.8% 11.0% 8.7% 8.4% 8.4%EBITDA Margin 12.6% 14.1% 14.3% 14.1% 13.9%Net Margin 6.5% 6.4% 4.5% 4.4% 4.5%

Colombia Industry:
Oil & GasRating:BuyPacific Rubiales
Will ALFA take-over the company?César Cuervo, CFA
+(571) 3394400 Ext [email protected]
Investment Thesis Stock Data
• We establish our 2015 T.P to CAD 21.5 per share (COP 40,300)and reiterate our BUY rating. PREC has demonstrated its abilityto deliver growth and profitability. From 2007 to 2013, thecompany has been able to post a 36% CAGR on 2P reserves, and a59% CAGR on production (2007-1H14). The aforementioned, alongwith a diversified exploration portfolio, initiatives to reduce costs, andan attractive relative valuation, support a BUY rating. We placePREC as our top pick in the sector; however, we reiterate a neutral-to-negative short-term stance towards the local O&G sector undercurrent conditions.
• ALFA could be a game changer. The Mexican company will seekapproval from its BoD to issue equity up to USD 1 bn, whilemanagement called for an extraordinary shareholders meeting onNovember 4th - 2014. This event may provide upside on valuation.Even though ALFA’s intention are not clear for the market, we do notrule out a potential JV or other kind of agreements.
• CPE-6 and Rio Ariari expected to drive production growth in2015. We estimate a contribution of these fields of 13.9 kboepd and4.9 kboepd towards the company’s total production. Heavy rains in2014 caused delays on the construction of facilities; however,Pacific expects to ramp up production in the upcoming months.
Price Chart and Volumes (USD mn)
Valuation• Our 2015E T.P of is based on a 10 year - DCF model with a 12.4%
WACC. We have decided not to include the 5% discount observedin other O&G players given higher expectations in the operatingfront.
• Our new T.P implies a EV/2P and EV/EBITDA 2015E of 16.5x and2.9x (12x and 4.4x from peers). The addition of reserves in 2014and significant production growth, especially from CPE-6 and Ariaricould add more value for the company.
Valuation Summary
P/E 12M Forward FV/EBITDA 12M Forward Relative Valuation
0
10
20
30
40
50
Dec-09 Feb-11 Apr-12 Jun-13 Aug-141
2
3
4
5
6
Mar-10 Jul-11 Nov-12 Mar-14
Canadial Oil
Encana Canadian Natural
Bay tex
Bankers Petro.
Rosetta Resources
Pacific Rubiales Canacol
Parex
4
6
8
10
12
14
2 3 4 5 6 7 8
P/E
2015
E
EV/EBITDA 2015E
Andean Equities Guide, 2015
0
20
40
60
80
40
60
80
100
120
Oct-13 Feb-14 Jun-14 Oct-14
USD
mn
Pacific Rubiales Colcap
Sebastián Gallego+(571) 3394400 Ext 1594
201
Ticker prec cb / pre cnPrice (COP) 34,600LTM Range (COP) 27,380 - 41,880Target 40,300 (loc) / 21.5 (TSX)Total Return (loc) 20%Market Cap (USD mn) 5,321Shares Outstanding 314Free Float 77.5%ADTV (USD mn) 9.1(loc) / 44.5 (TSX)
2013 2014E 2015E 2016EFV/EBITDA 3.7 3.2 2.7 2.8P/E 13.5 9.3 8.0 15.6P/BV 1.2 1.2 1.1 1.1Div. Yield 3.1% 3.9% 3.9% 3.9%Sources: Company Reports and Credicorp Capital

Pacific RubialesCompany Description
The Company is the largest independent O&G exploration and productioncompany in Colombia. Pacific Rubiales owns 100% of Pacific Stratus andMeta Petroleum Limited, two Colombian oil & gas operators which owninterests in, amongst others, the Rubiales and Piriri oil fields in Colombia’sLlanos Basin and the La Creciente natural gas field.
Oil & Gas production– 2Q14 Income Statement
Costs breakdown – 2Q14 Balance Sheet
CAPEX breakdown – 1H14
Cash Flow
Management
CEO: Ronald PantinCFO: Carlos PérezIR Manager: Frederick Kozakwww.pacificrubiales.com
Andean Equities Guide, 2015
Rubiales 42.6%
Quifa15.1%
Light & medium31.0%
Gas6.9%
Other4.4%
Production22.5%
Ex ploration25.5%
Drilling 38.3%
Projects5.5%
Other8.3%
Production 49.7%
Transportation43.9%
Diluent6.4%
202
USD mn 2012 2013 2014E 2015E 2016ERev enues 3,885 4,627 5,283 6,307 6,129EBIT 1,034 1,148 1,164 1,377 834EBITDA 2,020 2,567 2,929 3,514 3,337Net Income 528 421 580 680 347EPS (USD/share) 1.8 1.3 1.9 2.1 1.1EBIT Margin 26.6% 24.8% 22.0% 21.8% 13.6%EBITDA Margin 52.0% 55.5% 55.5% 55.7% 54.4%Net Margin 13.6% 9.1% 11.0% 10.8% 5.7%
USD mn 2012 2013 2014E 2015E 2016ECash & Equiv alents 265 649 742 881 880Total Current Assets 1,238 2,262 2,099 2,499 2,458Total Assets 7,076 11,207 12,064 12,724 12,642Current Liabilities 1,247 1,683 1,749 2,075 2,075Financial Debt 1,288 4,438 3,897 4,277 4,158Total liabilities 3,102 6,980 7,420 7,566 7,345Minority interest 0 31 31 31 31Shareholder's equity 3,974 4,196 4,612 5,127 5,265Total liabilities + Equity 7,076 11,207 12,064 12,724 12,642EBITDA / Fin. Ex penses 21.8x 15.8x 11.9x 14.9x 14.6xFinancial Debt / EBITDA 0.6x 1.7x 1.3x 1.2x 1.2xFinancial Debt / Equity 0.3x 1.1x 0.8x 0.8x 0.8xROE 13.3% 10.0% 12.6% 13.3% 6.6%ROA 7.5% 3.8% 4.8% 5.3% 2.7%ROIC 12.0% 5.6% 7.5% 8.3% 5.0%
USD mn 2012 2013 2014E 2015E 2016EInitial Cash 733 265 649 742 881Cash from Operation 634 -44 3,706 2,774 3,039CAPEX -1,548 -2,066 -2,599 -2,424 -2,489Changes in Financial Debt 256 3,150 -541 380 -119Div idends (Paid) Receiv ed -130 -196 -209 -219 -261Tax es -290 -505 -319 -425 -217Changes in Equity 610 45 54 52 46Final Cash 265 649 742 881 880Change in Cash -468 385 92 139 0Sources: Company Reports, Bloomberg and Credicorp Capital; E Credicorp Capital Estimates

2013 2014E 2015E 2016EFV/EBITDA 16.3 16.3 14.8 13.8P/E 12.3 18.8 16.3 15.2P/CF -10.3 -14.1 -170.3 32.2P/BV 1.3 1.4 1.3 1.3Div . Yield 2.3% 3.1% 2.7% 3.1%Sources: Company Reports and Credicorp Capital
Chile Industry: Rating:
BuyParque AraucoGood time to be in land
Christopher DiSalvatore+(562) 2446 1724
Investment Thesis Stock Data
• Although we appreciate the slowing macro trend in Chile, we believethat revenue growth will remain resilient and that shares shouldpositively reflect a low interest rate environment expected in Chile,heading into 2015. Moreover, future GLA expansion should continueto surprise to the upside as the company maintains a healthybalance sheet with a sizable land bank to execute future projects,which are likely not considered in our numbers. We maintain ourBuy rating and update our TP to $ 1,285 (+2.8% from previous).
• More attractive in a lower interest rate environment. Oureconomics team expects local rates to remain low ntm, reflectinguncertainty in economic activity. Low rates coupled with upside riskto GLA expansion should drive share outperformance. Furthermore,if rates were to adjust upwards due to inflation pressure, thecompany could be viewed as compelling, still, based on inflationprotection characteristics.
• Risks to our thesis: downside risks include delays in projectdevelopment, increased competition, and a sharp deterioration inthe macro environment. Upside risks include material additions tothe company’s current project pipeline.
Price Chart (CLP) and Volumes (USD mn)
Valuation• Trading at a discount to Latam peers. On a valuation front, shares
trade at a 3% discount to Latam peers in terms of P/FFO. In cap rateterms, shares are trading at an attractive 2015E 5.6% real, adjustedspread versus local bonds, an indicator we would expect to narrowas future growth becomes fully priced in.
• We value shares using a 10 year, SOTP (by country) DCFdiscounted in nominal, CLP terms (average WACC of 8.2%). Ourtarget equity implies a 15x P/FFO, implying a 9% upward re-rating.
Valuation Summary
P/E 12M Forward FV/EBITDA 12M Forward Relative Valuation
Andean Equities Guide, 2015
0
5
10
15
20
80
90
100
110
120
Oct-13 Feb-14 Jun-14 Oct-14
USD
mn
Parauco IPSA
Real Estate
203
0
20
40
60
80
Oct-02 Oct-06 Oct-10 Oct-14 0
5
10
15
20
25
Oct-02 Oct-05 Oct-08 Oct-11 Oct-14
Parauco
BR MallsMultiplan
Iguatemi
AliansceSonae Sierra Brasil
BR Properties
9
11
13
15
17
19
8 10 12 14 16
P/FF
O 20
15E
FV/EBITDA 2015E
Ticker parauco ciPrice (CLP) 1,099LTM Range (CLP) 905 - 1,1522015E Target (CLP) 1,285Total Return 20%Market Cap (USD mn) 1,540Shares Outstanding (mn) 818Free Float 65%ADTV (USD mn) 1.8
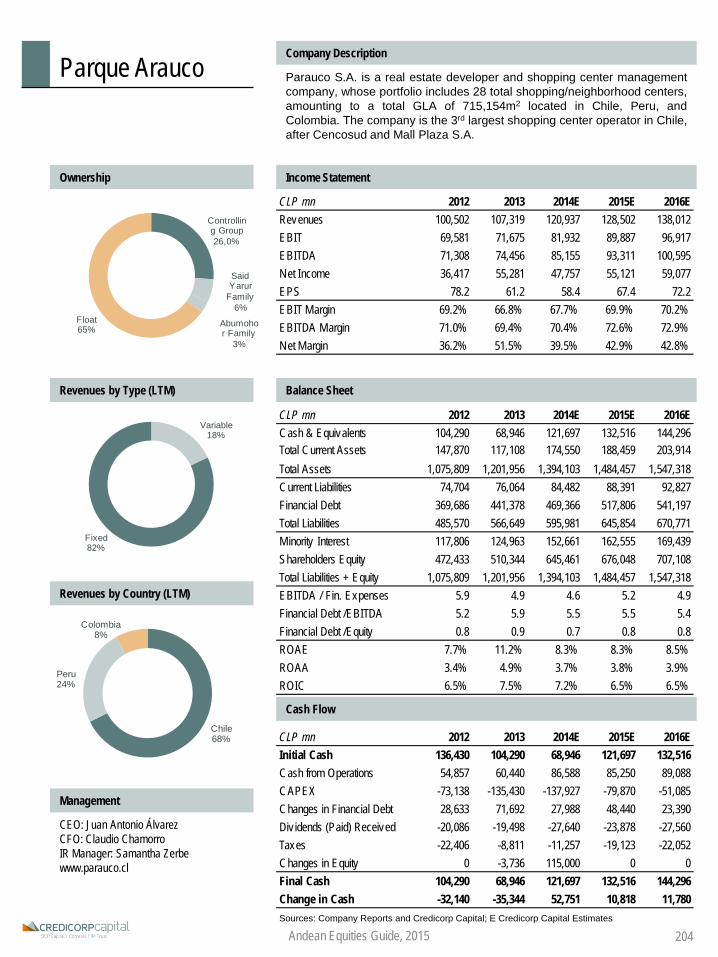
Parque AraucoCompany Description
Parauco S.A. is a real estate developer and shopping center managementcompany, whose portfolio includes 28 total shopping/neighborhood centers,amounting to a total GLA of 715,154m2 located in Chile, Peru, andColombia. The company is the 3rd largest shopping center operator in Chile,after Cencosud and Mall Plaza S.A.
Ownership Income Statement
Revenues by Type (LTM) Balance Sheet
Revenues by Country (LTM)
Cash Flow
Management
CEO: Juan Antonio ÁlvarezCFO: Claudio ChamorroIR Manager: Samantha Zerbewww.parauco.cl
Andean Equities Guide, 2015
Controlling Group 26,0%
Said Yarur
Family6%
Abumohor Family
3%
Float65%
CLP mn 2012 2013 2014E 2015E 2016ERevenues 100,502 107,319 120,937 128,502 138,012EBIT 69,581 71,675 81,932 89,887 96,917EBITDA 71,308 74,456 85,155 93,311 100,595Net Income 36,417 55,281 47,757 55,121 59,077EPS 78.2 61.2 58.4 67.4 72.2EBIT Margin 69.2% 66.8% 67.7% 69.9% 70.2%EBITDA Margin 71.0% 69.4% 70.4% 72.6% 72.9%Net Margin 36.2% 51.5% 39.5% 42.9% 42.8%
CLP mn 2012 2013 2014E 2015E 2016ECash & Equivalents 104,290 68,946 121,697 132,516 144,296Total Current Assets 147,870 117,108 174,550 188,459 203,914Total Assets 1,075,809 1,201,956 1,394,103 1,484,457 1,547,318Current Liabilities 74,704 76,064 84,482 88,391 92,827Financial Debt 369,686 441,378 469,366 517,806 541,197Total Liabilities 485,570 566,649 595,981 645,854 670,771Minority Interest 117,806 124,963 152,661 162,555 169,439Shareholders Equity 472,433 510,344 645,461 676,048 707,108Total Liabilities + Equity 1,075,809 1,201,956 1,394,103 1,484,457 1,547,318EBITDA / Fin. Expenses 5.9 4.9 4.6 5.2 4.9Financial Debt /EBITDA 5.2 5.9 5.5 5.5 5.4Financial Debt /Equity 0.8 0.9 0.7 0.8 0.8ROAE 7.7% 11.2% 8.3% 8.3% 8.5%ROAA 3.4% 4.9% 3.7% 3.8% 3.9%ROIC 6.5% 7.5% 7.2% 6.5% 6.5%
CLP mn 2012 2013 2014E 2015E 2016EInitial Cash 136,430 104,290 68,946 121,697 132,516Cash from Operations 54,857 60,440 86,588 85,250 89,088CAPEX -73,138 -135,430 -137,927 -79,870 -51,085Changes in Financial Debt 28,633 71,692 27,988 48,440 23,390Div idends (Paid) Received -20,086 -19,498 -27,640 -23,878 -27,560Taxes -22,406 -8,811 -11,257 -19,123 -22,052Changes in Equity 0 -3,736 115,000 0 0Final Cash 104,290 68,946 121,697 132,516 144,296Change in Cash -32,140 -35,344 52,751 10,818 11,780Sources: Company Reports and Credicorp Capital; E Credicorp Capital Estimates
Chile68%
Peru24%
Colombia8%
Variable18%
Fixed82%
204

Chile Industry: Rating:
HoldQuiñencoDiversification priced in
Pilar Gonzalez+(562) 2446 1768
Investment Thesis Stock Data
• We are updating our coverage of Quiñenco with a HOLDrecommendation and 2015E target price of CLP 1,355, implyinga total return of 14%. Although, the company’s discount versus itsfundamental value is slightly deeper than its historical averages(38% vs. 31.9%), we believe that most of the strong fundamentals ofits underlying assets are already priced in.
• We like the company’s management and its business diversification,which includes operations in different sectors, such as financialservices, food and beverages, manufacturing, energy, transportationand port and shipping services. Moreover, according to ourestimates its main underlying assets, Banco de Chile and SM ChileB are among shares with the highest potential upsides in ourcoverage universe.
• However, we are cautious on the risk profile of Quiñenco, which haschanged after the recapitalization in CSAV (+8.47% y/y) and therecent partial divestment from Banco de Chile (-3.6% y/y). Thetransportation sector has been negatively impacted by low tariffsglobally and the slowdown of the Chinese economy, while thebanking sector has been one of the most profitable in the Chileaneconomy during this year.
• Risks to our thesis: Downside risks include a continued change inthe company's risk profile, going forward.
Price Chart (CLP) and Volumes (USD m)
Valuation• Our 2015E target price is derived from a NAV valuation model,
considering our 2015 target prices for each of the underlying assets.We applied the average historical discount vs. NAV to obtain our2015YE target price.
• Shares are trading at 15x LTM P/E and at 0.8x P/B or a 1.3% and17.2% discounts to historical averages, respectively. We believe it isnot justified due to its underlying asset's expected earnings visibility.
Historical valuation summary
Historical Discount to NAV Main underlying asset sensitivity
Andean Equities Guide, 2015
-38%
-60%
-50%
-40%
-30%
-20%
-10%
0%
Oct-07 Oct-08 Oct-09 Oct-10 Oct-11 Oct-12 Oct-13 Oct-14
Discount Average 1.5 STDV 1.5 STDV
0
2
4
6
8
10
12
80
90
100
110
120
Oct-12 Feb-13 Jun-13 Oct-13
USD
mn
CLP
Quiñenco IPSA
2011 2012 2013 LTMP/E 16.3x 15.2x 14.1x 15.0xP/BV 0.9x 1.1x 0.9x 0.8xDiv . Yield 8.0% 2.5% 3.9% 3.6%Sources: Company Reports and Credicorp Capital
76 86 9625.0% 1,438 1,492 1,54630.0% 1,342 1,392 1,44331.7% 1,306 1,355 1,40440.0% 1,150 1,193 1,23745.0% 1,054 1,094 1,134
Historical Discount
Banco Chile's 2015 target price
Ticker Quinenc ciPrice (CLP) 1,236LTM Range (CLP) 1,125 - 1,400Target (CLP) 1,355Total Return 14%Market Cap (USD, mn) 3,521Shares Outstanding (mn) 1,663Free Float 19%ADTV (USDm) 0.5
205
Conglomerates
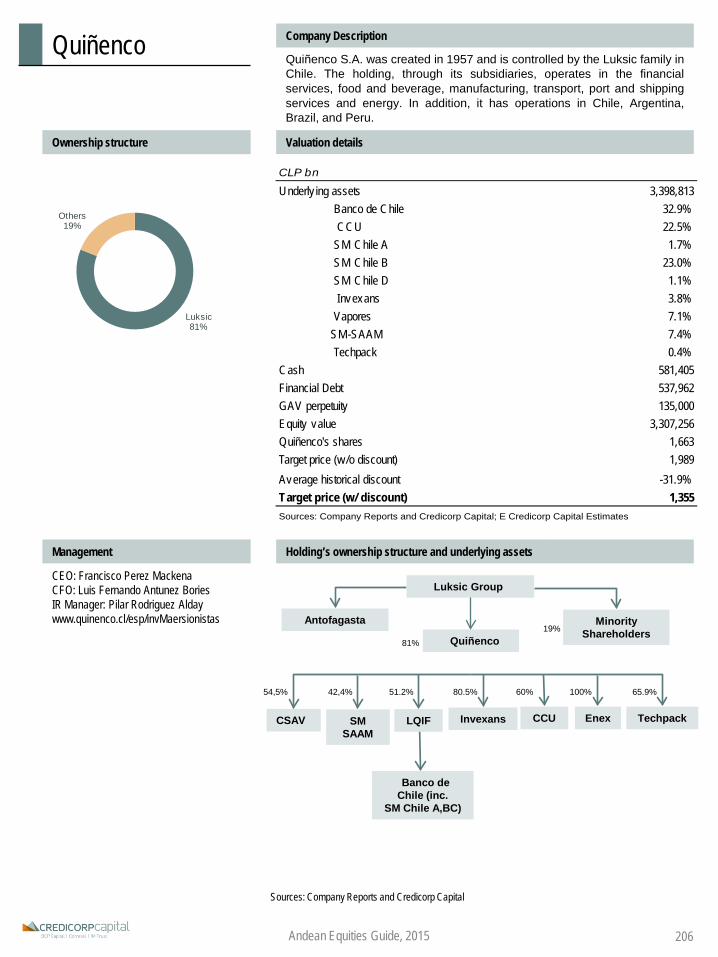
19%
81%
Quiñenco Company Description
Quiñenco S.A. was created in 1957 and is controlled by the Luksic family inChile. The holding, through its subsidiaries, operates in the financialservices, food and beverage, manufacturing, transport, port and shippingservices and energy. In addition, it has operations in Chile, Argentina,Brazil, and Peru.s
Ownership structure Valuation details
Management Holding’s ownership structure and underlying assets
CEO: Francisco Perez MackenaCFO: Luis Fernando Antunez BoriesIR Manager: Pilar Rodriguez Aldaywww.quinenco.cl/esp/invMaersionistas
Andean Equities Guide, 2015
Quiñenco
SM SAAM
Banco de Chile (inc.
SM Chile A,BC)
Antofagasta
Luksic Group
MinorityShareholders
LQIFCSAV Invexans CCU Enex Techpack
80.5%51.2%54,5% 42,4% 60% 100% 65.9%
Luksic81%
Others19%
Sources: Company Reports and Credicorp Capital
CLP bn
Underly ing assetsBanco de Chile 32.9%
CCU 22.5% SM Chile A 1.7% SM Chile B 23.0% SM Chile D 1.1% Invexans 3.8% Vapores 7.1% SM-SAAM 7.4% Techpack 0.4%CashFinancial DebtGAV perpetuityEquity valueQuiñenco's sharesTarget price (w/o discount)Average historical discountTarget price (w/ discount)Sources: Company Reports and Credicorp Capital; E Credicorp Capital Estimates
3,398,813
581,405537,962
1,989
3,307,256135,000
1,663
1,355-31.9%
81%
19%
206
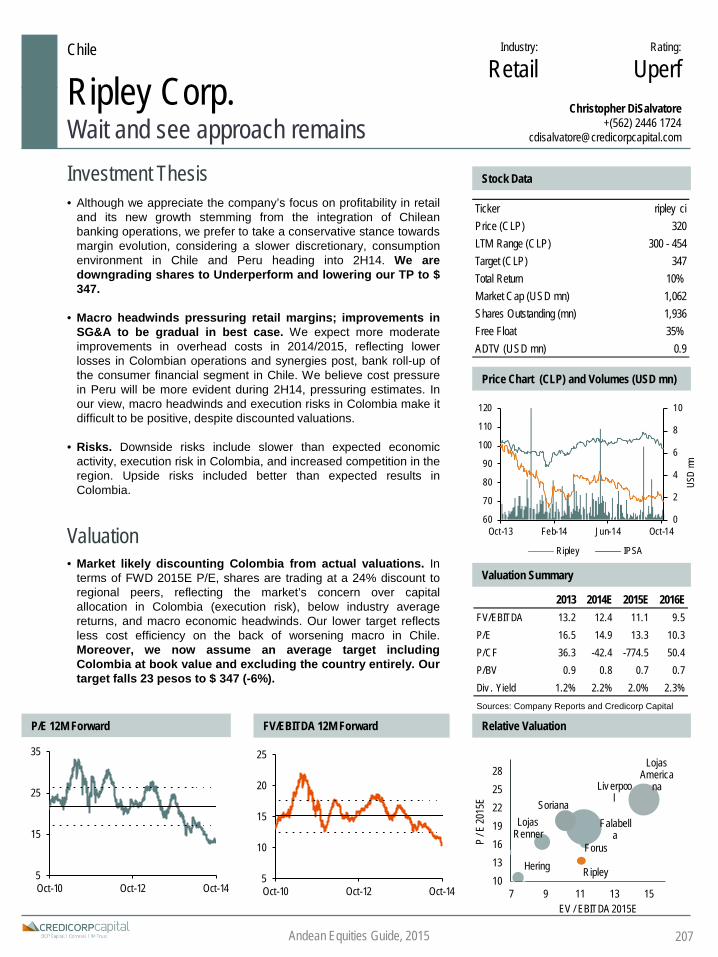
2013 2014E 2015E 2016EFV/EBITDA 13.2 12.4 11.1 9.5P/E 16.5 14.9 13.3 10.3P/CF 36.3 -42.4 -774.5 50.4P/BV 0.9 0.8 0.7 0.7Div . Yield 1.2% 2.2% 2.0% 2.3%Sources: Company Reports and Credicorp Capital
Chile Industry:
RetailRating:
UperfRipley Corp.Wait and see approach remains
Christopher DiSalvatore+(562) 2446 1724
Investment Thesis Stock Data
• Although we appreciate the company’s focus on profitability in retailand its new growth stemming from the integration of Chileanbanking operations, we prefer to take a conservative stance towardsmargin evolution, considering a slower discretionary, consumptionenvironment in Chile and Peru heading into 2H14. We aredowngrading shares to Underperform and lowering our TP to $347.
• Macro headwinds pressuring retail margins; improvements inSG&A to be gradual in best case. We expect more moderateimprovements in overhead costs in 2014/2015, reflecting lowerlosses in Colombian operations and synergies post, bank roll-up ofthe consumer financial segment in Chile. We believe cost pressurein Peru will be more evident during 2H14, pressuring estimates. Inour view, macro headwinds and execution risks in Colombia make itdifficult to be positive, despite discounted valuations.
• Risks. Downside risks include slower than expected economicactivity, execution risk in Colombia, and increased competition in theregion. Upside risks included better than expected results inColombia.
Price Chart (CLP) and Volumes (USD mn)
Valuation• Market likely discounting Colombia from actual valuations. In
terms of FWD 2015E P/E, shares are trading at a 24% discount toregional peers, reflecting the market’s concern over capitalallocation in Colombia (execution risk), below industry averagereturns, and macro economic headwinds. Our lower target reflectsless cost efficiency on the back of worsening macro in Chile.Moreover, we now assume an average target includingColombia at book value and excluding the country entirely. Ourtarget falls 23 pesos to $ 347 (-6%).
Valuation Summary
P/E 12M Forward FV/EBITDA 12M Forward Relative Valuation
Andean Equities Guide, 2015
0
2
4
6
8
10
60
70
80
90
100
110
120
Oct-13 Feb-14 Jun-14 Oct-14
USD
mn
Ripley IPSA
Forus
Ripley
Falabella
Lojas America
naLiv erpool
Lojas Renner
Soriana
Hering10131619222528
7 9 11 13 15
P / E
2015
E
EV / EBITDA 2015E
207
5
15
25
35
Oct-10 Oct-12 Oct-145
10
15
20
25
Oct-10 Oct-12 Oct-14
Ticker ripley ciPrice (CLP) 320LTM Range (CLP) 300 - 454Target (CLP) 347Total Return 10%Market Cap (USD mn) 1,062Shares Outstanding (mn) 1,936Free Float 35%ADTV (USD mn) 0.9

Ripley Corp.Company Description
Ripley Corp. S.A. operates department stores, which offers apparel,electronics and housing goods in Chile, Peru and Colombia. The companyoperates a proprietary credit division, as well as a bank in all countries ofoperations serving over 3.3 million active clients. Today, the company is the3rd largest department store operator in Chile and 2nd largest in Peru.
Ownership Income Statement
Sales by Country (LTM) Balance Sheet
EBITDA by Country (LTM)
Cash Flow
Management
CEO: Lázaro CalderónCFO: Juan DiuanaIR Manager: Alberto Corona / Esteban
Cortazarwww.ripley.cl
Andean Equities Guide, 2015
CLP mn 2012 2013 2014E 2015E 2016ERevenues 1,299,155 1,374,317 1,533,366 1,658,544 1,788,813EBIT 58,726 67,037 59,307 68,900 83,920EBITDA 92,035 104,222 101,601 113,694 133,461Net Income 37,020 44,615 41,444 46,690 59,866EPS 23.0 21.7 21.4 24.1 30.9EBIT Margin 4.5% 4.9% 3.9% 4.2% 4.7%EBITDA Margin 7.1% 7.6% 6.6% 6.9% 7.5%Net Margin 2.8% 3.2% 2.7% 2.8% 3.3%
CLP mn 2012 2013 2014E 2015E 2016ECash & Equivalents 139,238 153,254 162,194 182,926 200,915Total Current Assets 898,658 969,432 1,065,748 1,147,458 1,229,518Total Assets 1,809,116 1,969,522 2,104,750 2,213,616 2,318,556Current Liabilities 563,892 739,883 812,366 870,544 926,066Financial Debt 718,024 795,140 882,104 935,203 967,838Total Liabilities 1,450,120 1,179,819 1,286,967 1,361,560 1,417,083Minority Interest 500 301 322 339 355Shareholders Equity 755,847 789,401 819,035 853,292 899,150Total Liabilities + Equity 1,809,116 1,969,522 2,104,750 2,213,616 2,318,556EBITDA / Fin. Expenses 5.7 4.8 6.4 8.0 9.1Financial Debt /EBITDA 7.8 7.6 8.7 8.2 7.3Financial Debt /Equity 0.9 1.0 1.1 1.1 1.1ROAE 4.9% 5.8% 5.2% 5.6% 6.8%ROAA 2.0% 2.4% 2.0% 2.2% 2.6%ROIC 4.0% 4.3% 3.3% 3.4% 3.7%
CLP mn 2012 2013 2014E 2015E 2016EInitial Cash 60,573 139,238 153,254 162,194 182,926Cash from Operations -237,831 33,008 26,689 68,056 92,299CAPEX -73,138 -76,888 -81,206 -71,951 -72,421Changes in Financial Debt 418,754 77,117 86,963 53,099 32,636Div idends (Paid) Received -16,589 -10,960 -13,385 -12,433 -14,007Taxes -12,531 -8,261 -10,122 -16,039 -20,518Changes in Equity 0 0 0 0 0Final Cash 139,238 153,254 162,194 182,926 200,915Change in Cash 78,665 14,016 8,940 20,731 17,989Sources: Company Reports and Credicorp Capital; E Credicorp Capital Estimates
Calderon Volochinksy
53%
Calderon Kohon 12%
Float 35%
Chile 67%
Peru 32%Colombia
1%
Chile 79%
Peru33%
Colombia-13%
208

Besalco
ICA
Carso
Conconcreto
Obrascon
KBR
Fluor
Jacobs
Granite
Salfacorp
6
11
16
21
26
0 5 10 15
P/E
2015
E
FV/EBITDA 2015E
Chile Industry: Rating:
HoldSalfacorpPilar Gonzalez
+(562) 2446 1768 [email protected]
Investment Thesis Stock Data
• We are maintaining our HOLD recommendation on shares andintroducing a 2015YE target price of CLP 500, implying a totalreturn of 10%. Despite recent improvements in it’s A/R turnover andefficiency ratios, we do not see clear positive catalysts for shares inthe near term, as we believe current macro conditions couldcontinue to challenge the company’s operation.
• Salfacorp maintains CLP 1.7 bn in its pipe-line of projects, which arecurrently challenged by higher energy costs, uncertainty regardinglabor reform, and a general slowdown in economic activity. On theother hand, backlog, house promises, and contracts as of June 2014were below last year’s figures (CLP 483.339 mn, -24% y/y, UF 2.4mn, -22.6% y/y and UF 1.8 mn, -18.2% y/y, respectively).
• Based on our estimates, Salfacorp should post a considerableincrease in its EBITDA (2015-2016), providing for a healthy balancesheet and liquidity to pay debt obligations; however, we believe thatmacro conditions could continue to challenge operations.
• Risks to our thesis: Upside risks include faster recovery in theconstruction sector and economic activity. Downside risks include adecrease in project pipe-line, backlogs, house promises andcontracts.
Price Chart (CLP) and Volumes (USD mn)
Valuation• Our 2015E target price of CLP 500 is based on SOTP 10-year DCF
model, with an average WACC of 13.3%, in nominal CLP terms.
• Salfacorp’s shares are trading at 9.9x and 9.6x 2015E FV/EBITDAand P/E respectively (24% premium and 31% discount to globalpeers, respectively). Compared to its 5 years historical average,shares are trading at 33% and 56% discount, in terms of FV/EBITDAand P/E respectively, reflecting operational risks and the currentmacro environment.
Valuation Summary
P/E 12M Forward FV/EBITDA 12M Forward Relative Valuation
Andean Equities Guide, 2015
0
1
2
0
40
80
120
Oct-13 Feb-14 Jun-14 Oct-14
USD
m
Salfacorp Ipsa
Cement & Construction
Challenged by macro risks
209
Ticker salfacorp ci equityPrice (CLP) 465LTM Range (CLP) 410 - 624Target (CLP) 500Total Return 11%Market Cap (USD mn) 359Shares Outstanding (mn) 450Free Float 32%ADTV (USD mn) 0.4
2013 2014E 2015E 2016EFV/EBITDA 10.1 10.4 9.9 9.4P/E 9.3 11.2 9.6 8.4P/CF nm 1.7 7.8 2.8P/BV 0.8 0.7 0.6 0.6Div . Yield 3.2% 2.7% 3.1% 3.6%Sources: Company Reports and Credicorp Capital
0
30
60
90
Oct-05 Oct-08 Oct-11 Oct-140
10
20
30
Oct-05 Oct-08 Oct-11 Oct-14

SalfacorpCompany Description
Salfacorp is the largest construction company in Chile, with 2 mainbusiness lines: Engineering & Construction (68% of revenues) and RealEstate (32% of revenues). The company operates in Chile, Peru, Uruguay,Colombia and Panama, with joint ventures with local partners.
Ownership Income Statement
Revenue per division (LTM) Balance Sheet
EBITDA per division (LTM)
Cash Flow
Management
Andean Equities Guide, 2015
CEO: Francisco GarcésCFO: Jorge MeruaneDeputy CFO: Juan Pablo Reitzewww.salfacorp.com
CLP mn 2012 2013 2014E 2015E 2016ERevenues 1,103,681 1,059,715 903,715 958,895 1,031,703EBIT 45,817 48,366 47,060 52,206 56,066EBITDA 58,158 64,067 61,423 65,087 68,107Net Income 23,182 25,034 18,753 21,804 24,944EPS (CLP) 53.0 52.7 41.7 48.5 55.4EBIT Margin 4.2% 4.6% 5.2% 5.4% 5.4%EBITDA Margin 5.3% 6.0% 6.8% 6.8% 6.6%Net Margin 2.1% 2.4% 2.1% 2.3% 2.4%
CLP mn 2012 2013 2014E 2015E 2016ECash & Equivalents 33,523 30,473 54,223 57,534 61,902Total Current Assets 565,908 595,825 504,474 535,198 524,403Total Assets 976,645 993,377 922,420 932,857 930,172Current Liabilities 409,019 418,859 331,576 343,052 355,266Financial Debt 406,929 422,870 388,060 370,283 333,466Total Liabilities 671,584 660,101 582,317 576,326 555,303Minority Interest 23,461 26,575 22,159 22,409 22,345Shareholders Equity 281,599 306,701 317,944 334,122 352,524Total Liabilities + Equity 976,645 993,377 922,420 932,857 930,172EBITDA / Fin. Expenses 4.0 4.5 4.7 5.6 6.6Financial Debt /EBITDA 7.0 6.6 6.3 5.7 4.9Financial Debt /Equity 1.4 1.4 1.2 1.1 0.9ROAE 8.2% 8.5% 6.0% 6.7% 7.3%ROAA 2.4% 2.5% 2.0% 2.4% 2.7%ROIC 8.1% 4.1% 3.8% 4.0% 4.1%
CLP mn 2012 2013 2014E 2015E 2016EInitial Cash 45,271 33,523 30,473 54,223 57,534Cash from Operations -114,364 4,094 82,088 47,366 70,051CAPEX -34,071 -13,878 -8,000 -8,000 -8,000Changes in Financial Debt 144,190 15,940 -34,810 -17,777 -36,816Div idends (Paid) Received -4,781 -7,510 -5,626 -6,541 -7,483Taxes -2,722 -9,636 -9,902 -11,737 -13,383Changes in Equity 0 7,939 0 0 0Final Cash 33,523 30,473 54,223 57,534 61,902Change in Cash -11,748 -3,050 23,750 3,311 4,369Sources: Company Reports and Credicorp Capital; E Credicorp Capital Estimates
Real Estate 32%
Engineering &
Construction 68%
Real Estate 34%
Engineering &
Construction 66%
210
Controlling Group
41%
Others 32%
Inst. inv estors
18.1%
Pension Funds
9%

Chile Industry:
BanksRating:BuySantander Chile
Betting on a transformed franchiseJuan Dominguez
+(571) 339 4400 Ext 1026 [email protected]
Investment Thesis Stock Data
• We maintain our BUY rating and our CLP 40.0 2015YE T.P. inSantander Chile, as valuation metrics seem attractive after asharp correction in 3Q14. Santander has proved that itstransformation project (mainly through its new CRM and SantanderSelect) is a success, considering the healthy change in trend inclient addition and the growth in its targeted segments with betterrisk-adjusted returns. This transformation of the franchise will allow agood performance despite a challenging macro outlook, with anormalization in inflation rates and a modest growth in credit.
• Lower inflation and the tax reform will impact results in 2015.However, the franchise will remain as a very profitable onecompared to global and regional peers as i) spreads are attractivegiven the focus on retail lending, and post-provision NIM will remainhealthy given change in mix towards affluent individuals; ii) scaleand the transformation project is improving the productivity andefficiency of the bank. ROAE should be in the 19.5%-20.0% range inthe long-run, while efficiency will oscillate around 40%.
• Risks to our thesis: Downside risks include negative surprises ininflation, as the leading position in mortgages structurally exposesSantander’s NIM to fluctuation of the UF. Moreover, its strong shareon retail lending could reflect on impairment in asset quality,considering the moderation of GDP and employment in Chile.
Valuation• Our 2015E target price is based on a 10-year DDM valuation
using a Ke of 11.3% in CLP terms and an exit P/B of 2.3x. Our T.P.at CLP 40 implies a 13.5x 2016E P/E and 2.7x 2015E P/B.
• Shares are trading at 11.4x 2015E P/E, which we view asattractive considering the 5-year average average. In terms of P/B,shares are trading with a slight discount in EVA-adjusted termscompared to Latam peers.
Price Chart (CLP) and Volumes (USD mn)
Valuation Summary
P/B 12M Forward P/E 12M Forward Relative Valuation
Andean Equities Guide, 2015
Ticker bsan ci / bsac usPrice (CLP) 31.6LTM Range (CLP) 26.8 - 37.3Target 40.0 (loc) - 28.0 (ADR)Total Return 32%Market Cap (USD mn) 10,204Shares Outstanding (mn) 188,446Free Float 27%ADTV (USD mn) 6.1 (loc) - 9.0 (ADR)
2013 2014E 2015E 2016EP/E 13.0 11.3 11.4 10.6P/B 2.5 2.3 2.1 2.0ROAE 19.8% 21.5% 19.5% 19.3%Div . Yield 4.1% 4.5% 5.3% 5.3%Sources: Company Reports and Credicorp Capital
0
5
10
15
20
25
30
70
80
90
100
110
120
Oct-13 Feb-14 Jun-14 Oct-14
USD
mn
Santander IPSA
1
2
3
4
5
Oct-03 Oct-06 Oct-09 Oct-125
10
15
20
25
Oct-03 Oct-06 Oct-09 Oct-12
Banco de Chile
Santander Chile
Corpbanca
DaviviendaBancolombia
Grupo AvalBogota
1.01.21.41.61.82.02.22.42.62.8
12% 14% 16% 18% 20% 22% 24%
2015
E P/
B
2015E ROAE
211

Santander ChileCompany Description
Santander is one of the largest, private financial institutions in Chile, withUSD 39 bn in loans and a 19% market share. The bank has historicallymaintained among the highest levels of profitability in the Chilean industrydue to important costs control derived from its large scale and its higherspread portfolio, more focused on consumer lending and SMEs.
Ownership Income Statement
Loans Breakdown (as of Jun-14) Balance Sheet
Funding structure (as of Jun-14)
Ratios
Management
CEO: Claudio MelandriCFO: Miguel MataIR Manager: Robert Moreno / Cecil Díazwww.santander.cl
Andean Equities Guide, 2015
Santander Group67%
Pension funds6%
Free-float27%
CLP bn 2012 2013 2014E 2015E 2016ECash & interbank deposits 1,771 2,176 1,991 2,186 2,424Investment portfolio 3,472 3,510 3,928 4,274 4,679Gross loans 18,876 20,935 22,983 25,234 27,981Total assets 24,761 27,017 29,145 31,953 35,363Total deposits 14,082 15,296 15,836 17,387 19,281Financial obligations 6,202 7,071 7,807 8,571 9,505Total Liabilities 22,592 24,663 26,543 29,142 32,315Minority interest 34 29 29 30 31Shareholders' equity 2,135 2,326 2,574 2,781 3,017Total liabilities + equity 24,761 27,017 29,145 31,953 35,363
(%) 2012 2013 2014E 2015E 2016ENIM 5.3% 5.0% 5.5% 5.2% 5.2%Fee ratio 18.4% 16.1% 13.7% 14.1% 14.2%Cost-to-income ratio -42.2% -43.0% -40.3% -40.5% -40.5%NPL / Loans 3.2% 2.9% 3.0% 2.9% 2.9%LLP / Loans 2.9% 2.9% 3.0% 3.0% 3.0%Cost of credit risk -2.0% -1.8% -1.6% -1.5% -1.5%LLP / NPL 92% 99% 98% 102% 102%Deposit-to-loans ratio 77% 75% 71% 71% 71%Tier 1 ratio 10.7% 10.6% 10.7% 10.6% 10.3%BIS ratio 13.7% 13.8% 13.7% 13.2% 12.9%ROAE 18.8% 19.8% 21.5% 19.5% 19.3%ROAA 1.6% 1.7% 1.9% 1.7% 1.7%Sources: Company Reports and Credicorp Capital; E Credicorp Capital Estimates
Commercial 55%
Consumer 17%
Mortgages 28%
Demand deposits
23%
Time deposits
and saving accounts
38%
Interbank and
financial obligations
8%
Bonds22%
Equity + min. int.
10%
CLP bn 2012 2013 2014E 2015E 2016ENet interest income 1,043 1,077 1,275 1,318 1,450Net fee income 258 232 224 240 265Operating income 1,402 1,443 1,639 1,701 1,871Prov ision expenses -367 -364 -355 -367 -406Operating expenses -592 -620 -660 -689 -757Net income 388 442 526 521 560EPS (CLP) 2.06 2.35 2.79 2.76 2.97
212

2013 2014E 2015E 2016EFV/EBITDA 7.3 7.6 8.2 8.2P/E nm 11.0 13.2 13.5P/CF 1.9 nm 7.2 3.3P/BV 0.4 0.3 0.3 0.3Div . Yield 0.0% 0.0% 0.0% 0.0%Sources: Company Reports and Credicorp Capital
Peru Industry: Rating:HoldSiderperu
Still cleaning up the houseOmar Avellaneda
+(511) 416 3333 Ext 36065 [email protected]
Investment Thesis Stock Data
• After a 30% underperformance against the local index in thelast five months, we are upgrading our recommendation onSiderperu to Hold, with a 2015YE target price of PEN 0.35.Although we expect an annual price decline of 8% in steel products,we expect a annual increase of 5% in sales volume over the period2014-16, with a gross margin close to 10.7% in the next years.
• Expansion plans still on hold. Plans to increase its steelmakingand long steel rolling capacity are unlikely to be developed in a nearfuture. The limited steelmaking and rolling capacity will increaseimports of finished products in the sales mix.
• Improvement in production process and working capital.Siderperu has improved its gross margin since 4Q12, reaching10.5% in 2Q14. We expect 10.8% and 10.5% for 2015 and 2016,respectively. Regarding the cash conversion cycle (205 days), wedo not see room for improvement in the short term due to the lowerexpected growth of the construction sector.
• Risks to our thesis: Slowdown in the self-construction sector andmining sector. Volatility in input prices (billets); higher competitionwith imports in the local market.
Price Chart (PEN) and Volumes (USD mn)
Valuation• Valuations seems fair after a significant underperformance. Our
10-year DCF model provides a 2015YE P/E of 13.2x and a 2015YEFV/EBITDA of 8.2x; above comparable peers.
• Gerdau’s backup provides financial support. The support of itscontrolling group permits the company to benefit from lowerfinancing rates. Also, the capital infusion made in 2013 (USD120mn) improved financial ratios and reduced significantly financialexpenses.
Valuation Summary
P/E 12M Forward FV/EBITDA 12M Forward Relative Valuation
Gerdau
Cia Siderurgica
Nacional
Aceros Arequipa
Usiminas
Ternium
SiderperúGrupo Simec
0
5
10
15
20
25
2 7 12
P/E
2015
E
FV/EBITDA 2015E
0
10
20
30
40
50
60
Oct-05 Oct-08 Oct-11 Oct-140
1020304050607080
Oct-05 Oct-08 Oct-11 Oct-14
Andean Equities Guide, 2015
Cement & Construction
0.0
0.5
1.0
80
100
120
140
160
180
Oct-13 Feb-14 Jun-14 Oct-14
USD
m
Siderperu IGBVL
213
Ticker siderc1 pePrice (PEN) 0.31LTM Range 0.28 - 0.47Target 0.35 Total Return 13%Market Cap (USD, mn) 131Shares Outstanding (mn) 1,228Free Float 10%ADTV (USD, mn) 0.04

Long steel, 78.5%
Flat steel and
others, 21.5%
Local, 90.0%
Exports, 10.0%
Gerdau, 90.0% Others,
10.0%
SiderperuCompany Description
Siderperu is a Peruvian steel company controlled by the Brazilian Gerdau,a leading producer of long steel in the Americas. The company has acurrently shut down blast furnace (400,000 MT/year) and an electricfurnace (300,000 MT/year) for steel production and a rolling capacity forlong steel products of 500,000 MT/year.
Ownership Income Statement
Revenue Breakdown by region (2015E) Balance Sheet
Revenue Breakdown by product
Cash Flow
Management
CEO: Juan Pablo García BayceCFO: Diogo Espellet Dockhornwww.sider.com.pe
Andean Equities Guide, 2015
PEN mn 2012 2013 2014E 2015E 2016ERevenues 1,681 1,738 1,654 1,579 1,512EBIT -150 68 62 50 49EBITDA -78 127 121 113 113Net Income -99 -2 35 29 28EPS (PEN) -0.08 0.00 0.03 0.02 0.02EBIT Margin -8.9% 3.9% 3.7% 3.2% 3.2%EBITDA Margin -4.7% 7.3% 7.3% 7.1% 7.5%Net Margin -5.9% -0.1% 2.1% 1.8% 1.9%
PEN mn 2012 2013 2014E 2015E 2016ECash & Equivalents 24 72 19 26 30Total Current Assets 1,014 1,061 975 989 942Total Assets 2,053 2,061 1,998 1,982 1,903Current Liabilities 486 413 163 151 135Financial Debt 955 545 550 513 410Total Liabilities 1,095 793 696 650 544Minority Interest 0 0 0 0 0Shareholders Equity 958 1,268 1,302 1,331 1,359Total Liabilities + Equity 2,053 2,061 1,998 1,982 1,903EBITDA / Fin. Expenses -2.8 7.1 12.0 13.0 12.9Financial Debt /EBITDA -12.2 4.3 4.5 4.6 3.6Financial Debt /Equity 1.0 0.4 0.4 0.4 0.3ROAE -9.9% -0.2% 2.7% 2.2% 2.1%ROAA -4.7% -0.1% 1.7% 1.4% 1.5%ROIC -5.5% 2.6% 2.4% 1.9% 1.9%
PEN mn 2012 2013E 2014E 2015E 2016EInitial Cash 24 24 72 19 26Cash from Operations -8 171 14 76 140CAPEX -66 -26 -93 -32 -33Changes in Financial Debt 75 -410 5 -37 -103Div idends (Paid) Received 0 0 0 0 0Other CFI & CFF items 0 3 20 0 0Changes in Equity 0 310 0 0 0Final Cash 24 72 19 26 30Change in Cash 0 48 -53 7 4Sources: Company Reports and Credicorp Capital; E Credicorp Capital Estimates
214

2013 2014E 2015E 2016EFV/EBITDA 7.5 8.2 7.5 6.8P/E 13.5 12.6 11.6 10.7P/CF 9.2 7.3 12.4 7.5P/BV 1.4 1.4 1.3 1.2Div . Yield 4.2% 4.7% 5.2% 5.6%Sources: Company Reports and Credicorp Capital
Chile Industry:
IndustrialsRating:
BuySigdo KoppersChilean uncertainty affecting results
Arturo Prado+(562) 2450 1688
Investment Thesis Stock Data
• We are maintaining our Buy rating on SK and introducing a new2015YE T.P. of CLP 1,150 per share. Despite the short termslowdown in Chile’s economy and weak results in its Magotteauxsegment, we believe that higher mining industry activity due todecreasing ore grades, coupled with a pipeline of projects of morethan USD 100bn through 2024 and SK´s strong competitiveadvantages should drive share outperformance.
• After extensively discussing the implications of EXSA’s Quantex withmany players in the industry, we have concluded that the impact ofthe commercial success of Quantex on SK is likely to be limited inthe foreseeable future due to: i) Quantex could become a costeffective option to anfo-based alternatives given initial testingperformed by some major mining operations in Peru, ii) initially itseffectiveness seems higher in “niche” hard-rock and humidoperations, and iii) we were not able to conclude whether it implies atechnological innovation that could be patented; competitorsmentioned that they have similar products in their mix.
• Risks to our thesis: i) lower than expected copper prices, ii)environmental issues, and iii) the introduction of a new product suchas, Quantex, which could potentially impact Enaex sales over thelong term.
Price Chart (CLP) and Volumes (USD mn)
Valuation• Our revised 2015E T.P. is based on a 10-year, DCF valuation,
assuming a consolidated WACC of 8.1% in nominal, USD terms.
• In terms of FWD multiples, the company is trading at 11.6x 2015EP/E and 7.5x FV/EBITDA, which seem attractive compared to its 5year average.
Valuation Summary
P/E Forward FV/EBITDA Forward Relative Valuation
Andean Equities Guide, 2015
3
5
7
9
11
13
Oct-05 Oct-08 Oct-11 Oct-140
5
10
15
20
25
30
Oct-05 Oct-08 Oct-11 Oct-14
Ticker / ADR sk ci Price (CLP) 920LTM Range (CLP) 745 - 1,020Target (CLP) 1,150Total Return 30%Market Cap (USD mn) 1,695Shares Outstanding (mn) 1,075Free Float 24%ADTV (USD mn) 0.5
0
1
2
3
4
70
80
90
100
110
120
Oct-13 Feb-14 Jun-14 Oct-14
USD
m
SK IPSA
Orica
Ferreyros
ARRIUM LTD
AIA ENGINEERING
LTDSK
0
5
10
15
20
25
0 2 4 6 8 10 12 14
P/E
2015
E
FV/EBITDA 2015E
215

USD mn 2012 2013 2014E 2015E 2016ECash & Equivalents 220 216 187 191 199Total Current Assets 1,262 1,251 1,131 1,259 1,216Total Assets 3,650 3,599 3,373 3,552 3,573Current Liabilities 1,103 845 742 812 778Financial Debt 1,094 1,074 932 957 949Total Liabilities 2,067 1,994 1,741 1,841 1,795Minority Interest 407 415 389 409 412Shareholders Equity 1,176 1,190 1,244 1,302 1,366Total Liabilities + Equity 3,650 3,599 3,373 3,552 3,573EBITDA / Fin. Expenses 7.5 7.2 7.3 8.6 9.4Financial Debt /EBITDA 2.9 2.6 2.5 2.3 2.1Financial Debt /Equity 0.9 0.9 0.7 0.7 0.7ROAE 12.0% 10.2% 11.0% 11.4% 11.9%ROAA 3.9% 3.3% 3.8% 4.2% 4.5%ROIC 10.6% 12.9% 10.1% 11.0% 11.7%
Sigdo KoppersCompany Description
SK is an engineering and industrial holding which provides services allalong the mining value chain. Its main subsidiaries are: Enaex (explosives),SK Comercial (machinery), Magotteaux (grinding media), SK Engineeringand Construction, Puerto Ventanas & Fepasa (transport & logistics) andSKBerge (car dealership).
Ownership Income Statement
Revenue Breakdown by Segment (LTM) Balance Sheet
EBITDA by Segment (LTM)
Cash Flow
Management
CEO: Juan Pablo AboitizCFO: Gonzalo CavadaIR Manager: Andrés Barriga /Andrés Cristiwww.sigdokoppers.cl
USD mn 2012 2013 2014E 2015E 2016EInitial Cash 143 220 216 187 191Cash from Operations 47 350 365 290 347CAPEX -241 -206 -120 -155 -155Changes in Financial Debt 163 -21 -141 24 -8Div idends (Paid) Received -127 -109 -80 -87 -95Taxes -47 -17 -53 -67 -81Changes in Equity 282 0 0 0 0Final Cash 220 216 187 191 199Change in Cash 77 -3 -29 4 8Sources: Company Reports and Credicorp Capital; E Credicorp Capital Estimates
Enaex 38%
E&C 15%
SK Comercial
18%
Puerto Ventanas
11%
SK CHBB 1%
Magotteaux 18%
Andean Equities Guide, 2015
Controller 76%
Float 24%
Enaex 22.5%
E&C 27.9%
SK Comercial
15.5%
Puerto Ventanas
5.3%
Magotteaux 28%
USD mn 2012 2013 2014E 2015E 2016ERevenues 2,786 2,953 2,671 2,730 2,838EBIT 265 282 258 289 323EBITDA 382 409 377 414 456Net Income 141 121 134 146 159EPS (CLP) 76.8 65.6 72.8 79.1 86.4EBIT Margin 9.5% 9.6% 9.7% 10.6% 11.4%EBITDA Margin 13.7% 13.9% 14.1% 15.2% 16.1%Net Margin 5.1% 4.1% 5.0% 5.3% 5.6%
216

Chile Industry:
BanksRating:
BuySM Chile BLevering on Banco de Chile
Juan Dominguez+(571) 339 4400 Ext 1026
Investment Thesis Stock Data
• We are maintaining our BUY on the shares, setting our 2015YET.P. at CLP 228 after adjusting the fundamental value with the5-year average discount vs NAV (due to lower liquidity). SMChile’s exposure to Banco de Chile, the bank with the strongestfundamentals in our banking coverage, justifies our rating.
• The value of SM Chile B comes from the earnings generation ofBanco de Chile. Thus, considering that we expect the ROAE ofBanco de Chile to remain above peers (around 23% in 2015-2016)and its relatively high dividend yield, we expect a fast performancein terms of the subordinated debt payment to the BCCh (expected tobe fully met in 2019).
• Understanding the holding. SM Chile controls SAOS, responsiblefor paying a subordinated debt with the BCCh that goes back to thebanking crisis in the 80s. SAOS passes-through the dividends itreceives from Banco de Chile (30% stockholding) to meet this debtevery year. After meeting the debt, the holding will fold up, andshareholders of the B series will receive 3.38 shares of the bank(2.38 from SAOS plus 1 from SM’s direct stake in the bank).
• Risks to our thesis: Any downside risks threatening Banco deChile’s earnings generation, such as a sharper deceleration on theeconomy affecting credit demand and asset quality, negativesurprises in inflation and changes in regulation.
Valuation• Our new 2015E target price comes from a SOTP approach which
is estimated as 3.38 shares of Banco de Chile at T.P., deducting thedebt outstanding by the SAOS. This approach throws a 2015Efundamental value of CLP 253. Then, our T.P. was adjusted usingthe average discount during the last 5 years (~10%). SMChile Bcurrently trades at an 10% discount to shares of Banco de Chile. Asupside is attractive even considering the discount, we keep on BUY.
Price Chart (CLP) and Volumes (USD mn)
Valuation Summary (Banco de Chile)
Historical Discount to NAV (excludes outliers in 2008) Relative Valuation (Banco de Chile)
Andean Equities Guide, 2015
Ticker smchileb ciPrice (CLP) 175LTM Range (CLP) 166 - 190Target 228Total Return 33%Market Cap (USD mn) 3,671Shares Outstanding (mn) 12,196Free Float 42%ADTV (USD mn) 1.3
2013 2014E 2015E 2016EP/E 13.8 11.5 11.6 10.9P/B 3.1 2.7 2.5 2.4ROAE 23.9% 24.4% 23.0% 22.9%Div . Yield 4.5% 4.9% 5.4% 5.4%Sources: Company Reports and Credicorp Capital
0
5
10
15
20
80
85
90
95
100
105
110
Oct-13 Feb-14 Jun-14 Oct-14
USD
mn
SMChile B IPSA
-40%-20%
0%20%40%60%80%
100%120%
Oct-05 Oct-06 Oct-07 Oct-08 Oct-09 Oct-10 Oct-11 Oct-12 Oct-13 Oct-1
Banco de Chile
Santander Chile
Corpbanca
DaviviendaBancolombia
Grupo AvalBogota
1.01.21.41.61.82.02.22.42.62.8
12% 14% 16% 18% 20% 22% 24%
2015
E P/
B
2015E ROAE
217

SM Chile BCompany Description
SM Chile was incorporated with the sole purpose to repay the subordinateddebt to the BCCh through its subsidiary SAOS. The debt obligation isguaranteed by 28,593,701,789 shares (30.2%) of Banco de Chile currentlyheld by SAOS. Banco de Chile’s dividends and SM Chile A’s dividend arethe only sources of income for SAOS, and are exclusively used to paydown the outstanding debt owed to the BCCh. When the subordinated debtis repaid, each shareholder of SM Chile B will receive 2.38 shares of Bancode Chile held by SAOS plus 1 share of Banco de Chile directly owned bySM Chile
Ownership Holding Structure
Management Subordinated Debt Evolution
Chairman: Andrónico LuksicCEO: Arturo TagleIR Manager: n.a.www.smchile.cl
Income Statement (Banco de Chile)
Andean Equities Guide, 2015
LQIF58%
Others42%
100%
12.8%57.0%
30.2%
Direct Banco de Chile's Shareholders
SM Chile
SAOS
Banco de Chile
CLP bn 2012 2013 2014E 2015E 2016ENet interest income 953 1,059 1,211 1,284 1,415Net fee income 293 287 270 291 321Operating income 1,327 1,456 1,608 1,689 1,861Prov ision expenses -188 -242 -287 -284 -314Operating expenses -617 -623 -664 -715 -787Net income 468 514 576 586 635EPS (CLP) 5.33 5.53 6.08 6.05 6.42Sources: Company Reports and Credicorp Capital; E Credicorp Capital Estimates
2012 2013 2014E 2015E 2016EEffective installment (UF) 5,633,517 6,139,400 6,327,550 5,869,802 6,245,798Minimum installment (UF) 3,187,364 3,187,364 3,187,364 3,187,364 3,187,364Net debt (UF) 33,048,477 27,865,005 22,950,245 18,227,955 12,893,554Sources: Company Reports and Credicorp Capital; E Credicorp Capital Estimates
218
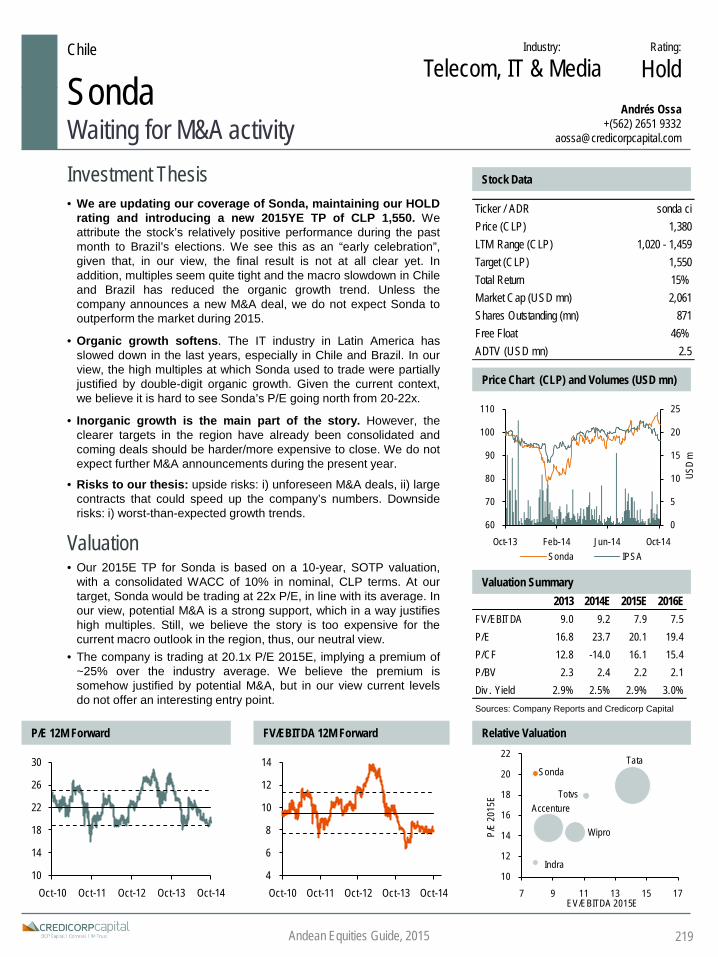
Sonda
Wipro
Tata
Accenture
Indra
Totvs
10
12
14
16
18
20
22
7 9 11 13 15 17
P/E
2015
E
EV/EBITDA 2015E
10
14
18
22
26
30
Oct-10 Oct-11 Oct-12 Oct-13 Oct-144
6
8
10
12
14
Oct-10 Oct-11 Oct-12 Oct-13 Oct-14
2013 2014E 2015E 2016EFV/EBITDA 9.0 9.2 7.9 7.5P/E 16.8 23.7 20.1 19.4P/CF 12.8 -14.0 16.1 15.4P/BV 2.3 2.4 2.2 2.1Div . Yield 2.9% 2.5% 2.9% 3.0%Sources: Company Reports and Credicorp Capital
Chile Industry: Rating:
HoldSondaWaiting for M&A activity
Andrés Ossa+(562) 2651 9332
Investment Thesis Stock Data
• We are updating our coverage of Sonda, maintaining our HOLDrating and introducing a new 2015YE TP of CLP 1,550. Weattribute the stock’s relatively positive performance during the pastmonth to Brazil’s elections. We see this as an “early celebration”,given that, in our view, the final result is not at all clear yet. Inaddition, multiples seem quite tight and the macro slowdown in Chileand Brazil has reduced the organic growth trend. Unless thecompany announces a new M&A deal, we do not expect Sonda tooutperform the market during 2015.
• Organic growth softens. The IT industry in Latin America hasslowed down in the last years, especially in Chile and Brazil. In ourview, the high multiples at which Sonda used to trade were partiallyjustified by double-digit organic growth. Given the current context,we believe it is hard to see Sonda’s P/E going north from 20-22x.
• Inorganic growth is the main part of the story. However, theclearer targets in the region have already been consolidated andcoming deals should be harder/more expensive to close. We do notexpect further M&A announcements during the present year.
• Risks to our thesis: upside risks: i) unforeseen M&A deals, ii) largecontracts that could speed up the company’s numbers. Downsiderisks: i) worst-than-expected growth trends.
Price Chart (CLP) and Volumes (USD mn)
Valuation• Our 2015E TP for Sonda is based on a 10-year, SOTP valuation,
with a consolidated WACC of 10% in nominal, CLP terms. At ourtarget, Sonda would be trading at 22x P/E, in line with its average. Inour view, potential M&A is a strong support, which in a way justifieshigh multiples. Still, we believe the story is too expensive for thecurrent macro outlook in the region, thus, our neutral view.
• The company is trading at 20.1x P/E 2015E, implying a premium of~25% over the industry average. We believe the premium issomehow justified by potential M&A, but in our view current levelsdo not offer an interesting entry point.
Valuation Summary
P/E 12M Forward FV/EBITDA 12M Forward Relative Valuation
Andean Equities Guide, 2015
Telecom, IT & Media
Ticker / ADR sonda ciPrice (CLP) 1,380LTM Range (CLP) 1,020 - 1,459Target (CLP) 1,550Total Return 15%Market Cap (USD mn) 2,061Shares Outstanding (mn) 871Free Float 46%ADTV (USD mn) 2.5
0
5
10
15
20
25
60
70
80
90
100
110
Oct-13 Feb-14 Jun-14 Oct-14
USD
m
Sonda IPSA
219

SondaCompany Description
Founded in 1974, Sonda is the leading provider of IT services in LatinAmerica, with presence in 9 countries throughout the region. It also offersapplications (SW) and platforms (HW) as a way to provide complete andcustomized solutions to its clients, combining its three areas of expertise.
Ownership Income Statement
Revenue Breakdown by Country (1H14) Balance Sheet
EBITDA Breakdown by Country (1H14)
Cash Flow
Management
CEO: Raul VejarCFO: Rafael OsorioIR Manager: Rodrigo PeñaIR: Melissa Vargaswww.sonda.com
Andean Equities Guide, 2015
CLP mn 2012 2013 2014E 2015E 2016ECash & Equivalents 65,814 177,907 87,342 107,636 112,703Total Current Assets 305,564 393,441 394,508 439,142 460,859Total Assets 695,106 743,930 869,422 1,014,247 1,058,335Current Liabilities 170,142 205,023 255,751 295,836 309,757Financial Debt 105,523 94,117 111,463 188,623 192,775Total Liabilities 296,597 268,557 352,718 465,900 483,116Minority Interest 4,737 5,347 5,433 7,290 7,607Shareholders Equity 393,771 470,025 511,271 541,057 567,612Total Liabilities + Equity 695,106 743,930 869,422 1,014,247 1,058,335EBITDA / Fin. Expenses 15.4 -319.2 23.3 15.0 12.9Financial Debt /EBITDA 0.9 0.8 0.8 1.2 1.2Financial Debt /Equity 0.3 0.2 0.2 0.3 0.3ROAE 11.6% 15.2% 10.4% 11.4% 11.2%ROAA 6.6% 9.1% 6.3% 6.3% 6.0%ROIC 13.8% 16.6% 10.6% 10.9% 11.0%
CLP mn 2012 2013 2014E 2015E 2016EInitial Cash 35,125 65,814 177,907 87,342 107,636Cash from Operations 116,173 170,920 85,066 54,209 118,116CAPEX -122,027 -35,890 -139,681 -51,513 -54,153Changes in Financial Debt -18,369 -11,407 17,346 77,160 4,152Div idends (Paid) Received -21,252 -38,639 -30,015 -35,313 -36,534Taxes -19,448 -20,760 -23,281 -24,249 -26,515Changes in Equity 95,612 47,868 0 0 0Final Cash 65,814 177,907 87,342 107,636 112,703Change in Cash 30,689 112,093 -90,565 20,294 5,067Sources: Company Reports and Credicorp Capital; E Credicorp Capital Estimates
Controller47%
Foreign Investors
16%
Pension Funds14%
Others23%
Chile38%
Brazil41%
Mexico8%
ROLA13%
Chile41%
Brazil30%
Mexico10%
ROLA19%
CLP mn 2012 2013 2014E 2015E 2016ERevenues 681,192 672,287 894,104 1,133,010 1,186,352EBIT 85,555 82,836 91,697 106,201 112,093EBITDA 117,349 114,046 134,071 157,714 166,246Net Income 45,590 65,433 50,829 59,801 61,868EPS (CLP) 52.4 75.1 58.4 68.7 71.0EBIT Margin 12.6% 12.3% 10.3% 9.4% 9.4%EBITDA Margin 17.2% 17.0% 15.0% 13.9% 14.0%Net Margin 6.7% 9.7% 5.7% 5.3% 5.2%
220

2013 2014E 2015E 2016EFV/EBITDA 10.7 11.2 10.7 9.9P/E 16.8 21.6 20.9 19.5P/CF 22.8 16.2 21.5 27.3P/BV 3.3 2.8 2.6 2.4Div . Yield 1.9% 3.4% 2.3% 2.4%Sources: Company Reports and Credicorp Capital
Chile Industry:
MaterialsRating:
HoldSQMNegative momentum already priced in
Arturo Prado+(562) 2450 1688
Investment Thesis Stock Data
• We are upgrading our recommendation on SQM to HOLD,introducing a new 2015YE T.P. of CLP 15,000. We like thefundamentals of the business, it’s competitive advantages, withaccess to quality resources, and its leading position in the Iodine,Lithium, and SPN markets. After a recent correction (-17% MTD),we believe that current prices already reflect the decrease in Iodineand potash prices; however we still see downside risk in theseprices, as oversupply remains a concern. The latter prevents usfrom having a more constructive view on shares.
• The lithium business should have a flat performance going forward.Lithium prices have been affected by a surplus in global markets.SQM has a restriction regarding the exploitation of Lithium (2030 or180k tons lithium metallic), and it currently has exploited 50% of itsquota. The company will offset lower prices with increasing volumesin 2015 (7%). In addition, Industrial Chemicals will post a strongrecovery in volumes in 2015 (50k), due to the entrance of new solarsalt contracts (totaling 240k until 2017).
• Risks to our thesis: i) Reunification of BCP cartel, ii) lower-than-expected Iodine and Lithium prices, iii) weaker-than-expectedgranular potash demand in Brazil due to poor pricing, and iv) noisesurrounding corporate governance issues.
Price Chart (CLP) and Volumes (USD mn)
Valuation• Our revised 2015E target price is based on a 10-yr, SOTP DCF
model, assuming a consolidated WACC of 8.1% in nominal, USD.
• When compared to peers, SQM has always traded at, in our view, ajustified premium due to its quality resources. Multiples show thispremium has narrowed during previous months. SQM is trading atsignificantly lower multiples than its historical average, justified bythe decline in its profitability ratios and corporate governance issues.
Valuation Summary
P/E 12M Forward FV/EBITDA 12M Forward Relative Valuation
Andean Equities Guide, 2015
0
10
20
30
40
50
Oct-99 Oct-02 Oct-05 Oct-08 Oct-11 Oct-140
5
10
15
20
25
Oct-99 Oct-02 Oct-05 Oct-08 Oct-11 Oct-14
0
5
10
15
20
25
30
80
90
100
110
120
130
Oct-13 Feb-14 Jun-14 Oct-14
USD
m
SQM/B IPSA
Ticker / ADR sqm/b ci / sqm usPrice (CLP) 13,565LTM Range (CLP) 12,126 - 18,781Target (CLP) 15,000 (loc) / 26.5 (ADR)Total Return 13%Market Cap (USD mn) 6,813Shares Outstanding (mn) 263Free Float 68%ADTV (USD mn) 4.3
SQM-B
Potash
MOSAIC UralkaliICL
K + S
0
5
10
15
20
25
0 5 10 15
P/E
2015
E
FV/EBITDA 2015E
221

USD mn 2012 2013 2014E 2015E 2016ECash & Equivalents 640 937 633 677 737Total Current Assets 2,247 2,455 2,203 2,370 2,584Total Assets 4,416 4,768 4,421 4,546 4,782Current Liabilities 609 723 734 775 831Financial Debt 1,599 1,819 1,347 1,254 1,245Total Liabilities 2,229 2,335 1,911 1,865 1,913Minority Interest 55 56 52 53 56Shareholders Equity 2,133 2,377 2,459 2,627 2,813Total Liabilities + Equity 4,416 4,768 4,421 4,546 4,782EBITDA / Fin. Expenses 44.7 18.1 15.4 20.8 24.2Financial Debt /EBITDA 1.4 2.2 1.9 1.7 1.6Financial Debt /Equity 0.7 0.8 0.5 0.5 0.4ROAE 30.4% 20.7% 13.1% 12.8% 12.8%ROAA 14.7% 10.2% 6.9% 7.3% 7.5%ROIC 22.8% 15.2% 11.5% 11.6% 11.9%
SQMCompany Description
SQM is the world’s largest integrated producer of potassium nitrate, iodineand lithium carbonate. The company also produces other specialty plantnutrients, potassium chloride and certain industrial chemicals. SQM minesand processes caliche ore and brine deposits in northern Chile and runs aglobal distribution operation.
Ownership Income Statement
Revenue Breakdown by Segment (LTM) Balance Sheet
Gross Profit by Segment (LTM)
Cash Flow
Management
CEO: Patricio ContesseCFO: Ricardo RamosIR Manager: Kelly O´Brienwww.sqm.com
SPN 33%
Iodine 19%
Lithium 10%
IndustrailChemical
5%
Potash 28%
Others 4%
Grupo Pampa
32%
Potash Corp 32%
Float 36%
Andean Equities Guide, 2015
USD mn 2012 2013 2014E 2015E 2016EInitial Cash 614 640 937 633 677Cash from Operations 820 881 662 614 653CAPEX -444 -386 -150 -200 -285Changes in Financial Debt 201 220 -472 -92 -9Div idends (Paid) Received -335 -279 -234 -158 -163Taxes -216 -139 -110 -120 -136Changes in Equity 0 0 0 0 0Final Cash 640 937 633 677 737Change in Cash 26 296 -304 44 60Sources: Company Reports and Credicorp Capital; E Credicorp Capital Estimates
SPN 23%
Iodine 32%
Lithium 15%
IndustrailChemical
5%
Potash 23%
222
USD mn 2012 2013 2014E 2015E 2016ERevenues 2,429 2,203 2,109 2,257 2,457EBIT 922 616 468 477 510EBITDA 1,118 833 702 736 796Net Income 649 467 316 326 349EPS (CLP) 3,147.8 2,265.2 1,530.7 1,583.0 1,694.1EBIT Margin 38.0% 28.0% 22.2% 21.1% 20.7%EBITDA Margin 46.0% 37.8% 33.3% 32.6% 32.4%Net Margin 26.7% 21.2% 15.0% 14.5% 14.2%

Colombia Industry:
Fuel retailRating:
HoldTerpelComing to fuel the Colombian market
Jaime Pedroza+(571) 339 44 00 ext. 1025
Investment Thesis Stock Data
• Slow but stable expected growth. We are expecting the companyto show moderate growth in the next years as fuel consumption isexpected to post a low but stable growth of around 3% per year. Inthis way, our model assumes that revenues of Terpel will increase ata 6.4% CAGR between 2014 and 2024, explained by a 4.5% CAGRin sales volumes and a 2.0% CAGR in prices.
• We assume operating enhancements and efficiency gains as aresult from the strategic plan of the company to increasethroughputs by investing in improving the customer experience andoffering low prices.
• Potential growth opportunities in the long term. Our model doesnot include additional growth from the 4G road concessions inColombia (as the beginning of the operational phase of the projectsis uncertain, and so is their impact on fuel demand), nor majorinternational investments. However, we identify significant growthopportunities in these two fronts in the long term, which representupward risks to our thesis and TP.
• Liquidity uncertainty. We are expectant for the development of theshares’ liquidity as we believe that volumes should normalize giventhat Terpel is a new share in the BVC with just 2 months of history.Nevertheless, an inclusion in the Colcap index in the January, 2015review seems likely.
ValuationOur 2015 target price of COP 20,000 is based on a 10 year DCFmodel, using an 8.7% WACC (COP-nominal) and a 2.0% perpetuitygrowth rate. Our target price implies a total return of 13.5%, assuminga 2.9% dividend yield. Target multiples include a 2015 EV/EBITDA of7.6x and a 2015 P/E of 21.3x.
Price Chart (COP) and Volumes (USD mn)
Valuation Summary
P/E 12M Forward FV/EBITDA 12M Forward Relative Valuation
Andean Equities Guide, 2015
Ticker terpel cbPrice (COP) 17,800LTM Range (COP) 18,400 - 14,760Target (COP) 20,000Total Return 15%Market Cap (USD mn) 1,565Shares Outstanding (mn) 181Free Float 41%ADTV (USD mn) 2.2
2013 2014E 2015E 2016EFV/EBITDA n.a. 7.1 6.5 6.1P/E n.a. 17.2 16.7 13.7P/CF n.a. 7.0 5.7 5.3P/BV n.a. 1.8 1.7 1.6Div . Yield n.a. 1.8% 2.9% 3.0%Sources: Company Reports and Credicorp Capital
-
5
10
15
20
90
95
100
105
110
115
Aug-14 Sep-14 Oct-14
USD
mn
Terpel Colcap
16
17
18
19
Aug/14 Sep/146.4
6.6
6.8
7.0
7.2
Aug/14 Sep/14
Terpel
World Fuel Svcs
Global Partners
Sprague Resource
Susser Petroleum
Parkland Fuel Co
Ow Bunker A/S
Z Energy Ltd
Pak State Oil
Attock Petroleum
Copec
456789
1011
4 9 14 19
EV/E
BITD
A 20
15E
P/E 2015E
223
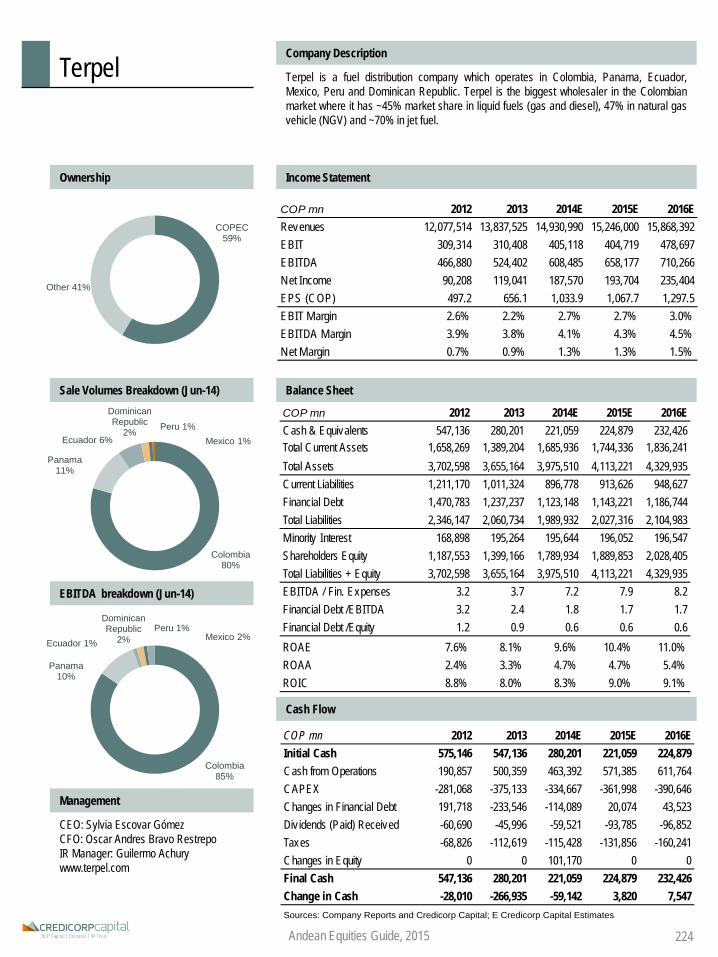
COP mn 2012 2013 2014E 2015E 2016ECash & Equivalents 547,136 280,201 221,059 224,879 232,426Total Current Assets 1,658,269 1,389,204 1,685,936 1,744,336 1,836,241Total Assets 3,702,598 3,655,164 3,975,510 4,113,221 4,329,935Current Liabilities 1,211,170 1,011,324 896,778 913,626 948,627Financial Debt 1,470,783 1,237,237 1,123,148 1,143,221 1,186,744Total Liabilities 2,346,147 2,060,734 1,989,932 2,027,316 2,104,983Minority Interest 168,898 195,264 195,644 196,052 196,547Shareholders Equity 1,187,553 1,399,166 1,789,934 1,889,853 2,028,405Total Liabilities + Equity 3,702,598 3,655,164 3,975,510 4,113,221 4,329,935EBITDA / Fin. Expenses 3.2 3.7 7.2 7.9 8.2Financial Debt /EBITDA 3.2 2.4 1.8 1.7 1.7Financial Debt /Equity 1.2 0.9 0.6 0.6 0.6ROAE 7.6% 8.1% 9.6% 10.4% 11.0%ROAA 2.4% 3.3% 4.7% 4.7% 5.4%ROIC 8.8% 8.0% 8.3% 9.0% 9.1%
TerpelCompany Description
Terpel is a fuel distribution company which operates in Colombia, Panama, Ecuador,Mexico, Peru and Dominican Republic. Terpel is the biggest wholesaler in the Colombianmarket where it has ~45% market share in liquid fuels (gas and diesel), 47% in natural gasvehicle (NGV) and ~70% in jet fuel.
Ownership Income Statement
Sale Volumes Breakdown (Jun-14) Balance Sheet
EBITDA breakdown (Jun-14)
Cash Flow
Management
CEO: Sylvia Escovar Gómez CFO: Oscar Andres Bravo RestrepoIR Manager: Guilermo Achurywww.terpel.com
Andean Equities Guide, 2015
COP mn 2012 2013 2014E 2015E 2016EInitial Cash 575,146 547,136 280,201 221,059 224,879Cash from Operations 190,857 500,359 463,392 571,385 611,764CAPEX -281,068 -375,133 -334,667 -361,998 -390,646Changes in Financial Debt 191,718 -233,546 -114,089 20,074 43,523Div idends (Paid) Received -60,690 -45,996 -59,521 -93,785 -96,852Taxes -68,826 -112,619 -115,428 -131,856 -160,241Changes in Equity 0 0 101,170 0 0Final Cash 547,136 280,201 221,059 224,879 232,426Change in Cash -28,010 -266,935 -59,142 3,820 7,547Sources: Company Reports and Credicorp Capital; E Credicorp Capital Estimates
Colombia 85%
Panama 10%
Ecuador 1%Mexico 2%
Peru 1%Dominican Republic
2%
COPEC 59%
Other 41%
Colombia 80%
Panama 11%
Ecuador 6%
Dominican Republic
2% Peru 1%Mexico 1%
COP mn 2012 2013 2014E 2015E 2016ERevenues 12,077,514 13,837,525 14,930,990 15,246,000 15,868,392EBIT 309,314 310,408 405,118 404,719 478,697EBITDA 466,880 524,402 608,485 658,177 710,266Net Income 90,208 119,041 187,570 193,704 235,404EPS (COP) 497.2 656.1 1,033.9 1,067.7 1,297.5EBIT Margin 2.6% 2.2% 2.7% 2.7% 3.0%EBITDA Margin 3.9% 3.8% 4.1% 4.3% 4.5%Net Margin 0.7% 0.9% 1.3% 1.3% 1.5%
224

2013 2014E 2015E 2016EFV/EBITDA 13.2 10.4 9.2 8.4P/E 30.4 16.8 14.2 12.5P/CF n.m 14.1 37.8 20.1P/BV 1.8 1.3 1.2 1.1Div . Yield 1.6% 1.3% 1.8% 2.1%Sources: Company Reports and Credicorp Capital
Peru Industry:
CementRating:BuyUnacem
The goal is elevationFernando Pereda
+(511) 416 3333 - Ext: [email protected]
Investment Thesis Stock Data
• We are maintaining our rating on Unacem at Buy with anestimated 2015YE T.P. of PEN 3.72, while dropping ourprevious 2014YE TP of PEN 4.20. The company will benefit fromeconomic growth, infrastructure projects and the expansion of thePeruvian housing market over 2015-2016.
• The Condorcocha plant will be expanded and we expectUnacem to elevate production. We expect the company willincrease gradually its total capacity from current 7.6mn MT to 8.4mnMT by 2S15 and to 9.4mn MT by the end of 2017. This new capacitywill allow the company to meet future growth without the need ofimporting clinker, resulting in higher and more stable margins.
• Unacem acquired 98.6% stake of Lafarge Cementos (USD553mn FV). The Ecuadorian subsidiary of French-based Lafargethat operates an integrated plant of 1.4mn MT in Otavalo, north ofEcuador (22% market share). Unacem is financing this acquisitionwith a syndicated bridge loan. The transaction multiple implied anFV/capacity of USD 395/MT vs Unacem's USD 403/MT.
• Risks to our thesis: Slowdown of self-construction. Highercompetition of cement imports and construction of new plants in thecentral area of Peru. Lower liquidity of the stock.
Price Chart (PEN) and Volumes (USD mn)
Valuation• Our recommendation is based on a sum of parts DCF model broken
down by plant. In our view, the company is a value play, with solidfundamentals and competitive cost structure. Our current TP doesnot include the operations in Ecuador since we do not have enoughinformation about the financing scheme.
• The company should increase production through 2015 and thenremain stable while demand continues to grow. EBITDA margin inthe cement units will rise to 34.4% through 2015. Unacem trades at9.1x FV/EBITDA and 13.9x P/E, which are below comparables.However, multiples are in line with historical performance.
Valuation Summary
P/E 12M Forward FV/EBITDA 12M Forward Relative Valuation
Andean Equities Guide, 2015
0
1
2
3
4
5
70
80
90
100
110
120
Oct-13 Feb-14 Jun-14 Oct-14
USD
m
Unacem IGBVL
05
101520253035
Oct-06 Oct-08 Oct-10 Oct-12 Oct-145
10
15
Oct-06 Oct-08 Oct-10 Oct-12 Oct-14
Cementos Argos
CRH CLH
Italcementi Ords
UnacemCementos Pacasmayo
05
10152025303540
0 5 10 15 20
P/E
2015
E
FV/EBITDA 2015E
225
Ticker unacemc1 pePrice (PEN) 2.83LTM Range (PEN) 2.83 - 3.85Target (PEN) 3.72Total Return 33%Market Cap (USD mn) 1,633Shares Outstanding (mn) 1,647Free Float 11%ADTV (USD mn) 0.3

UnacemCompany Description
Unacem, the result of the merger of Cementos Lima and Cementos Andinoin 2012, is the leader cement producer in Peru with operations in Lima andcentral highlands. The company is part of the Peruvian group Rizo Patronand has more than 100 years experience in the local market. It has an90%-owned participation in the hydroelectric company Celepsa.
Ownership Income Statement*
Cement Capacity** Breakdown (2015) Balance Sheet*
COGS* Breakdown (2015)
Cash Flow*
Management
CEO: Carlos UgásCFO: Álvaro MoralesIR Manager: -
(*) Non-consolidated financial information.(**) Subsidiaries valuated separately
Andean Equities Guide, 2015
Pension Funds 22%
Sindicato de
Invers. y Admin. S A 68%
Others 10%
Condor corcha 2100 k
MT
Atocongo 5500 k
MT
Production Inputs
39%
Fuels 22%
Electricity 16%
Materials 13%
Non-cash charges
10%
PEN mn 2012 2013 2014E 2015E 2016ECash & Equivalents 74 196 266 271 358Total Current Assets 704 931 1,030 1,080 1,232Total Assets 6,075 6,485 6,739 7,108 7,521Current Liabilities 1,170 898 923 1,013 1,110Financial Debt 1,943 2,321 2,418 2,596 2,774Total Liabilities 2,773 3,082 3,173 3,357 3,548Minority Interest 0 0 0 0 0Shareholders Equity 3,303 3,403 3,566 3,751 3,974Total Liabilities + Equity 6,075 6,485 6,739 7,108 7,521EBITDA / Fin. Expenses 8.8 7.2 4.8 4.3 4.5 Financial Debt /EBITDA 3.3 3.7 4.0 3.9 3.8Financial Debt /Equity 0.6 0.7 0.7 0.7 0.7ROAE 10.9% 6.1% 7.2% 7.1% 7.6%ROAA 5.9% 3.2% 3.8% 3.8% 4.1%ROIC 6.7% 6.8% 6.1% 6.2% 6.6%
PEN mn 2012 2013 2014E 2015E 2016ERevenues 1,726 1,785 1,804 1,913 2,066EBIT 495 517 491 524 592EBITDA 590 632 612 658 731Net Income 360 204 252 261 300EPS (PEN) 0.22 0.12 0.15 0.16 0.18EBIT Margin 28.7% 29.0% 27.2% 27.4% 28.6%EBITDA Margin 34.2% 35.4% 33.9% 34.4% 35.4%Net Margin 20.8% 11.4% 14.0% 13.6% 14.5%
PEN mn 2012 2013 2014E 2015E 2016EInitial Cash 64 74 196 266 271Cash from Operations 220 451 382 354 388CAPEX -321 -266 -237 -452 -400Changes in Financial Debt 159 254 96 179 178Div idends (Paid) Received -86 -84 -104 -76 -78Other CFI & CFF Items 39 -233 -68 0 0Changes in Equity 0 0 0 0 0Final Cash 74 196 266 271 358Change in Cash 11 122 70 4 87Sources: Company Reports and Credicorp Capital; E Credicorp Capital Estimates
226

0
5
10
15
20
Oct-05 Oct-08 Oct-11 Oct-140
5
10
15
20
25
30
Oct-05 Oct-08 Oct-11 Oct-14
Minmetals
Sumitomo Metal Mining
Boliden
Milpo
Volcan
0
5
10
15
20
25
0 5 10
P/E
2015
E
FV/EBITDA 2015E
2013 2014E 2015E 2016EFV/EBITDA 7.0 12.4 7.5 6.9P/E 11.7 20.7 8.6 7.8P/CF nm nm 4.7 4.0P/BV 1.4 1.1 1.0 0.9Div . Yield 0.9% 1.9% 0.9% 2.3%Sources: Company Reports and Credicorp Capital
Peru Industry:
MiningRating:
HoldVolcanZinc surge brings silver relief
Héctor Collantes+(511) 416 3333 Ext 33052
Investment Thesis Stock Data
• We reduce our 2015YE TP to PEN 1.10 but keep our HOLDrating, because the low silver prices and delayed mine start affectedresults, but the stock price drop was somewhat overdone.
• 2015 will get full contribution of the two new mines started in2Q14. Alpamarca ramped up smoothly, but the metallurgical silverplant, Oxides, has to stabilize oxidation levels and cyaniderequirements to reach its full capacity by 1Q15 (started at 30%).Volcan will peak silver output at 27.2mn oz in 2015 (+ 11% y/y) from22.9mn oz in 2014 (+18% y/y). Zinc now explains half of revenues.
• We include new short term direct growth, such as a 7% capacityexpansion (towards 11,000 tpd) in Yauli, Volcan’s largest unit, by1Q16; 11 additional years of life of mine in Pasco thanks to Vinchosand oxides stock piles (but treating 60% less ore).
• Hydro power plants to allow for energy self sufficiency. Acombined 60MW will be added to the existing 43MW (100MWforecasted needs towards 2016).
• Risks to our thesis: the brownfield projects might result infeasible;or require more capex.
Price Chart (PEN) and Volumes (USD mn)
Valuation• Our DCF takes 17 years as a stressed life of mine in reserves and
resources at cost of equity of 12.5%. 13% of the value comes fromthe hydroelectric projects. The West Wall projects, are taken at insitu value because they still expect final approvals.
• Beaten multiples, particularly after Volcan’s exclusion from FTSEindexes due to its reduced liquidity and misperceived less clarity onnear term growth.
Valuation Summary
P/E 12M Forward FV/EBITDA 12M Forward Relative Valuation
Andean Equities Guide, 2015
Ticker volcabc1 pePrice (PEN) 0.94LTM Range (PEN) 0.92 - 1.21Target (PEN) 1.10Total Return 18%Market Cap (USD mn) 1,742Shares Outstanding (mn) 2,443Free Float 82%ADTV (USD mn) 0.7
0
1
2
3
4
5
70
80
90
100
110
120
Oct-13 Feb-14 Jun-14 Oct-14
USD
m
Volcan IGBVL
227

USD mn 2012 2013 2014E 2015E 2016ECash & Equivalents 575 183 116 156 362Total Current Assets 1,102 901 758 903 1,099Total Assets 2,639 2,915 2,990 3,201 3,410Current Liabilities 427 560 500 508 493Financial Debt 706 816 866 866 866Total Liabilities 1,262 1,438 1,428 1,437 1,422Minority Interest 0 0 0 0 0Shareholders Equity 1,376 1,477 1,561 1,765 1,988Total Liabilities + Equity 2,639 2,915 2,990 3,201 3,410EBITDA / Fin. Expenses 16 33 12 30 33 Financial Debt /EBITDA 1.6 2.1 3.1 1.9 1.7Financial Debt /Equity 0.5 0.6 0.6 0.5 0.4ROAE 15.1% 12.3% 5.5% 12.2% 11.9%ROAA 7.9% 6.3% 2.8% 6.6% 6.8%ROIC 17.0% 10.2% 9.4% 8.9% 9.4%
VolcanCompany Description
Volcan is the largest producer of zinc, silver and lead in Peru and a top tenworldwide producer of these metals. Volcan operates in the historic miningarea of Central Peru. The company renewed its management four yearsago bringing in professionals with more experience in silver mining. Volcanis listed on the Lima, Santiago and Madrid SE.
Ownership Income Statement
Revenue Breakdown by Metal Balance Sheet
Revenue Breakdown by Mine
Cash Flow
Management
CEO: Ignacio RosadoCFO: Jorge MurilloIRO: David Gleitwww.volcan.com.pe
Zinc 45%
Silver 40%
Lead 11%
Copper 4%
Andean Equities Guide, 2015
USD mn 2012 2013 2014E 2015E 2016ERevenues 1,168 1,179 1,104 1,321 1,309EBIT 333 271 155 314 346EBITDA 434 380 282 466 509Net Income 208 175 84 203 223EPS (USD) 0.07 0.04 0.02 0.05 0.07EBIT Margin 28.5% 23.0% 14.0% 23.8% 26.4%EBITDA Margin 37.2% 32.2% 25.6% 35.3% 38.9%Net Margin 17.8% 14.8% 7.6% 15.4% 17.1%
Yauli 47%
Chungar 31%
Pasco -Paragsha
8%
Pasco -Oxides
7%
Alpa marca
7%
Intl. Inst. Invest. 11%
Letts Family 18%
Peruvian Pension Funds 25%
Others 46%
228
USD mn 2012 2013 2014E 2015E 2016EInitial Cash 154 575 183 116 156Cash from Operations 188 283 248 290 392CAPEX -362 -351 -355 -323 -153Changes in Financial Debt 645 110 50 0 0Div idends (Paid) Received -97 -40 -34 -16 -39Financial&Investing, others 46 -393 23 89 6Changes in Equity 0 0 0 0 0Final Cash 575 183 116 156 362Change in Cash 421 -392 -67 40 207Sources: Company Reports and Credicorp Capital; E Credicorp Capital Estimates
Important DisclosuresThis report is property of IM Trust S.A. and/or Credicorp Capital Colombia S.A. Sociedad Comisionista de Bolsa and/or CredicorpCapital Perú S.A.A. and/or its subsidiaries (hereinafter jointly referred to as “Credicorp Capital”), therefore, no part of this the materialor its content, nor any copy of it, may be altered in any way, transmitted, copied or distributed to any third party without prior andexpress written consent of Credicorp Capital.
In making this report, Credicorp Capital has relied on public information. Credicorp Capital has not verified the truthfulness,completeness or accuracy of the information accessed, nor has audited the information in any way. Accordingly, this report does notconstitute a statement, assertion or guarantee (express or implied) as to the truth, accuracy or completeness of the informationcontained herein or any other written or oral information furnished to any person and/or their advisors.
Unless otherwise stated, the information used in this report is not confidential, nor constitutes privileged information that may meanthe violation of the rules of the stock market, or that could mean failure to comply with copyright legislation.
This report is not intended and shall not be understood in any way as to: a) predict the future or guarantee a specific financial result;b) ensure the fulfillment of the scenarios described in it; c) be an investment advice or opinion that could be considered as CredicorpCapital recommendations.
The information contained in this report is only for referential purposes. While reading it, you should consider that the informationcontained in this report may be oriented to a specific segment of clients or investors, with a certain risk profile that may not be yours.
Unless otherwise stated, this report does not contain investment recommendations or other suggestions that may be understood tobe given under the stock market intermediaries’ special duty to clients classified as investors. When recommendations are made, thereport will clearly specify the investors risk profile to which the recommendation is intended. Credicorp Capital can seek and/orconduct business with companies that are mentioned in the report, and they can also execute buying and selling transactions ofshares that are mentioned.
It is important to state that the fluctuation in exchange rates can have adverse effects on investments values.
It is client responsibility to determine how to use the information contained in this report. Hence, the client is the sole responsible forinvestment decisions or any other operation he/she might perform in the stock market based on this report. In other words, theinvestment or operation result made by the client using the information contained in this report is of her/his sole responsibility.Credicorp Capital does not assume any responsibility, obligation or duty for any action or omission derived from the use of thisdocument.
Credicorp Capital recommends to their clients to ask for professional advice from financial, legal, accounting, tax experts before adopting an investment decision. Under no circumstances the information contained in this report may be considered as a financial, legal, accounting or taxation opinion, neither as a recommendation or investment advice.
Rating System
Rating DefinitionN° of Companies
covered with this ratingCompanies covered with this rating (% )
BuyExpected returns of 5 percentage points or more in excess over the expected return of the local index, over the next 12-18 months.
36 44%
HoldExpected returns of +/- 5% in excess/below the expected return of the local index over the next 12-18 months.
35 43%
UnderperformExpected to underperform the local index by 5 percentage points or more over the next 12-18 months.
7 9%
Under Review / Restricted
Company coverage is under rev iew or restricted. 4 5%
Total 82 100%