alfredo ergas cfo -...
TRANSCRIPT

Alfredo ErgasCFO

» Who are we?
» What are we facing today?
» What do you think we should do in the future?
» What we are really doing and what we are committed to.
» What is our regulatory framework?

Total Customers: 11.9 millionTotal Sales: 61,610 GWh Total Assets: US$B 12,177
Colombia
Customers 2.2 MillionSales 11,441 GWhMarket Share 23%
Peru
Customers 1 MillionSales 5,201 GWhMarket Share 23%
Chile
Customers 1.5 MillionSales 12,923GWhMarket Share 44%
Argentina
Customers 2.2 MillionSales 15,833 GWhMarket Share 17%
Brazil
Customers 2.7 MillionSales 7,227 GWhMarket Share 6%
Customers 2.4 MillionSales 8,985 GWh
As of December 2007
Leading Distribution Company in South America

Total Capacity: 13,707 MWTotal Sales: 62,567 GWh Total Assets: US$B 10,842
ChileCapacity 4,779 MWProduction 18,773 GWhHydro 13,179 GWhThermo 5,591 GWh
Market Share 37%
ArgentinaCapacity 3,644 MWProduction 12,117 GWhHydro 3,696 GWhThermo 8,421 GWhMarket Share 15%
BrazilCapacity 987 MWProduction 3,954 GWhHydro 3,888 GWhThermo 66 GWh
Market Share 1%
PeruCapacity 1,468 MWProduction 7,654 GWhHydro 4,385 GWhThermo 3,270 GWh
Market Share 28%
ColombiaCapacity 2,829 MWProduction 11,942 GWhHydro 11,427 GWhThermo 515 GWh
Market Share 21%
Leading Generation Company in South America
As of December 2007
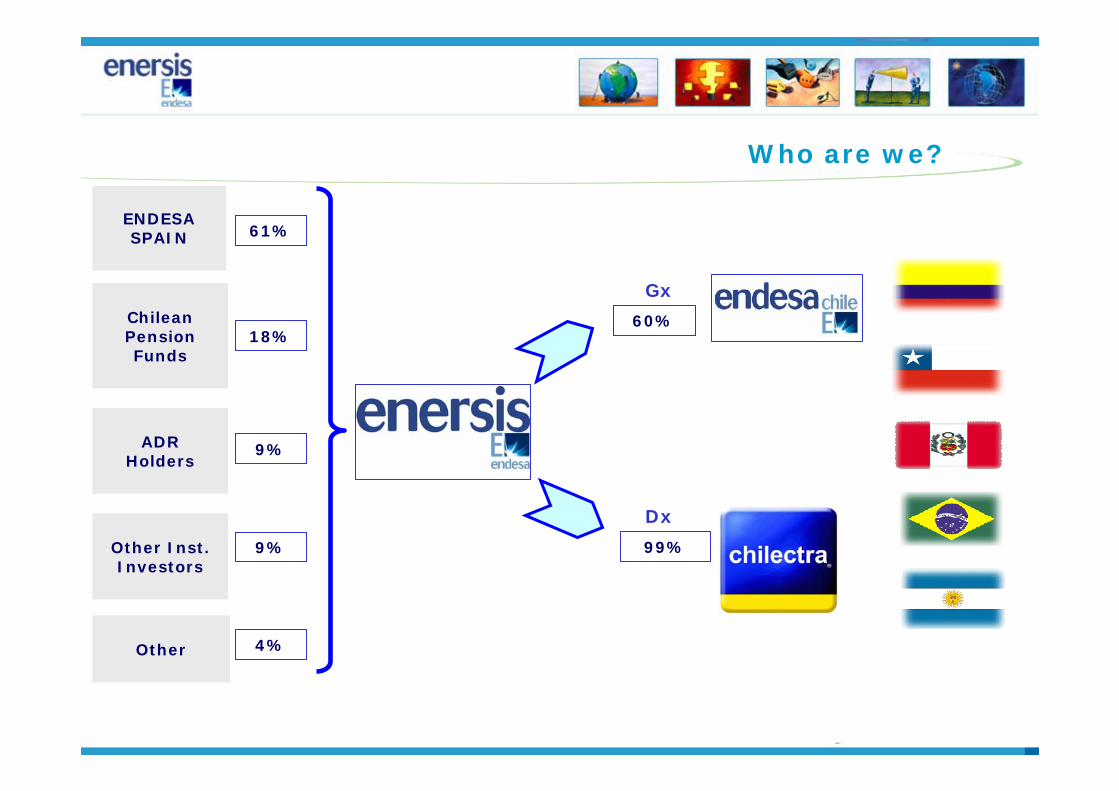
ENDESA SPAIN
ChileanPensionFunds
ADRHolders
Other
Gx
Other Inst. Investors
61%
18%
9%
9%
4%
Who are we?
99%
60%
Dx

Operating Income
Millions Ch$
11%
2007 Results
1,131,631
1,255,567
1,060,000
1,080,000
1,100,000
1,120,000
1,140,000
1,160,000
1,180,000
1,200,000
1,220,000
1,240,000
1,260,000
1,280,000
2006 2007

2007 Results
Millions Ch$
Non-Operating Income
27.3%
Effect BT64 year 2006
Effect BT64 year 2007
Gas Atacama provision
(439,029)
(558,859)(600,000)
(500,000)
(400,000)
(300,000)
(200,000)
(100,000)
-2006 2007

Millions Ch$
Net Income and Homogeneous Terms
13.3%
38.7%307.122
166.287
Net Income, as of December 2007
188,376
-
50,000
100,000
150,000
200,000
250,000
300,000
2006 2007

Fin. Debt / Equity
EBITDA / Fin. Expenses
2005 2006 2007
135%
3.3 4.8
128% 116%
4.0
ENERSIS
Fin. Debt / EBITDA 3.0 2.02.5
Financial Results
Source: Enersis

(*) As of December 31st, 2007
2003US$ 4,475
millionShare: $ 86
2004US$ 5,557
millionShare: $ 94
2005US$ 7,177
millionShare: $ 111
2006US$ 10,448
millionShare: $ 170
2007US$ 10,504
millionShare: $ 160
CAGR*: 17%
Strong Profits for our Shareholders
Apr 30, 2008US$ 12,243
millionShare: Ch$ 173

Positive Perception of Rating Agencies
Date: 07-03-2007Date: 07-05-2007 Date: 12-14-2006
BBB-
BBB
Ba1
Baa3
BBB-
BBB AA- AA-
A+A+
Date: 07-06-2007 Date: 07-20-2007
Domestic MarketInternational Market
…DUE TO A OF GROWTH INCREASING SCENARIO, GREATER FINANCIAL FLEXIBILITY AND FEWER REGULATORY UNCERTANTIES

» Who are we?
» What are we facing today?
» What do you think we should do in the future?
» What we are really doing and what are we committed to.
» What is our regulatory framework?

Generation Distribution & Supply
Transmission End User
PRICE REGULATION
Long term contracting w/ distribution companies for regulated customers
Free bilateral contracting with eligible customers
Short-term markets covering variable cost
Regulated operation of distribution networks
Guaranteed access where suppliers exist (Colombia)
Prices based on investment and capital costs plus recovery of energy costs
Guaranteed access at regulated prices, based on investment and capital costs
Investor selection through competitive bidding
New project definition through technical studies

DISTRIBUTION AND SUPPLY BUSINESS
Wholesale energy costs
Supply costsInvestment
and O&M costs
Competitive bidding for long term contracts
Stabilized spot price
Competitive bidding for long term contracts
Competitive bidding for long term contracts
Competitive bidding for long term contracts and spot price
Optimal NRV and O&M costs for a model company
Under
Optimal NRV and O&M costs for a model company
O&M model company, depreciation costs, amortized NRV
NRV at regulated infrastructure prices, O&M costs
Included in distribution
Included in distribution
Included in distribution
Included in distribution
Optimal customer administration costs
Wholesale Energy Costs
Supply CostsInvestment
and O&M Costs
Competitive bidding for long-term contracts
Stabilized spot price
Competitive bidding for long-term contracts
Competitive bidding for long-term contracts
Competitive bidding for long-term contracts and spot price
Optimal NRV and O&M costs for a model company
Under review
Optimal NRV and O&M costs for a model company
O&M model company, depreciation costs, amortized NRV
NRV at regulated infrastructure prices, O&M costs
Included in distribution
Included in distribution
Included in distribution
Included in distribution
Optimal customer administration costs

ENERGY AND POWER PURCHASES
- Pass Through of auction prices
- Purchases through spot market or through public auctions.Pass through:
- Weighted average cost of own purchase prices and market prices for the last 12 months.
- Energy purchases at bidding process for the regulated customers demand. Distributor may include free customers demand in the regulated auctions
Auction prices are passed on to final tariffs at close to +/-3% band of.
- Energy purchases at bidding processes for the regulated customers demand. For the free customers demand, bilateral contracting or auctions- Pass Through of auction prices
2. Energy: Average marginal cost of energy.3. Power: Costs of reserve and ancillary services.
- all the distributors needs are covered together. Pass-Through
Energy and Power Purchases
Colombia
Brasil
Argentina
Chile
Perú
- Energy and power purchases made at seasonal price- Pass Through to final tariffs at seasonal prices.
Seasonal Price:1. Calculated every 3 months with a 3-year operation simulation.
- Pass Through of auction prices
- Purchases through spot market or through public auctions.Pass through:
- Weighted average cost of own purchase prices and market prices
- Energy purchases at bidding process for the regulated customerscustomers demand in the regulated auctions
-3% band of real demand.
- Energy purchases at bidding processes for the regulated customers demand. For the free customers demand, bilateral contracting or auctions- Pass Through of auction prices
2. Energy: Average marginal cost of energy.3. Power: Costs of reserve and ancillary services.
- Energy purchases through auctions organized by ANEEL in whichPass-Through
Energy and Power Purchases
Colombia
Brazil
Argentina
Chile
Peru
- Energy and power purchases made at - Pass Through to final tariffs .
Seasonal Price:

REGULATORY AND POLITICAL STRUCTURE
End User Tariff =
Generation + Transmission + VAD
Distribution Added Value (VAD) =
Optimal [NRV @ 10% + O&M costs]
GENERATION
TRANSMISSION DISTRIBUTION
End User Tariff =
Generation + Transmission + VAD
Distribution Added Value (VAD) =
Optimal [NRV @ 10% + O&M costs]
GENERATION
TRANSMISSION DISTRIBUTION

» Who are we?
» What are we facing today?
» What do you think we should do in the future?
» What we are really doing and what we are committed to.
» What is our regulatory framework?

» Price of oil is US$62/barrel
» Average natural gas coming from Argentina: 16 million cubic meters daily
» Good hydrology
» Reservoirs at normal levels
» US dollar exchange rate of $532.4
» 2.9% Inflation
2006 2007
Energy Scenario
2007 2008
» Price of oil is US$91/barrel
» Average natural gas coming from Argentina: 7 million cubic meters daily
» Low hydrology
» Reservoirs at low levels
» US dollar exchange rate of $489.9
» 7.8% Inflation
» Price of oil is US$116/barrel
» Average natural gas coming from Argentina: 8 million of cubic meters daily
» Low hydrology
» Reservoirs at low levels
» US dollar exchange rate of $437.7
» 8.1% Inflation

GDP Forecasts*
* Latin American Consensus Forecasts, March 2008
What we can expect in terms of demand?
4.2%
6.9% 7.0%
4.6%
5.4%
4.7%4.4%
5.0%5.0%
6.4%
0.0%
1.0%
2.0%
3.0%
4.0%
5.0%
6.0%
7.0%
8.0%
Chile Argentina Peru Brazil Colombia
2008 2009

» Who are we?
» What are we facing today?
» What do you think we should do in the future?
» What we are really doing and what we are committed to.
» What is our regulatory framework?

What do you think about…
» What is your view of the energy situation in the region?» How would you address the energy scenario in the region?
» What do you think about the use of our FCF?» Should we make more investments?» Should we pay more dividends?» Should we prepay debts?
» What do you think about our assets?» Should we keep the current level?» Should we develop further any specific country?» Should we venture into other countries?

» Who are we?
» What are we facing today?
» What do you think we should do in the future?
» What we are really doing and what we are committed to.
» What is our regulatory framework?

What can we do with our FCF?…
Free Cash Flow
Investments Dividends Debt

» Increase generation capacity
» Expansion of grids and distribution assets
» Strong prevention maintenance investment
Our Answer: 2008 – 2012 Investment Plan
US$ 10 billion
US$ 4.4 billion
in Distribution
US$ 5.6 billion
in Generation

We invest around US$ 900 billion yearly to
keep our service standards in line with international levels.
12 millioncurrent customers
» We decrease the number of shortages per year;
» We decrease the duration of shortages;
» We significantly enhance the reliability of our grids;
Investing in quality of service
+
In order to enhance our ratios:
And efficiently serve a growing customer base:
Annual incorporationof 400,000 new
customers

• 377 MW Installed Capacity• Combined Cycle Thermal Plant
• 32 MW Installed Capacity• Run of the river Hydro Plant
• 18 MW Installed Capacity• Wind Farm Power Station
We help increase the energy supply
• 2,750 MW Hydro Plant• Investments under study• Operation: 2012-2020

2007 *70%
US$ 259 billion
2006 70%
US$ 368 billion
200562%
US$ 64 billion
2007
Div. Yield: 3.4%Payout: 70% Div: $ 5.4 per share
200450%
US$ 24 billion
(*) As of December 2007
Increased Dividend

Capturing expansion opportunities
The Action Plan consists of:

» Our concession areas total approximately 202,000 Km2 in distribution.
» We serve 12 million customers.
We invest more than US$ 900
billion
We have been able to maintain our grids and incorporate more than
400,000 new customers annually.
Equivalent to purchasing a new midsize distribution company.
As a result of our constant concern
» We have decreased the number of shortages per year.
» We have decreased the duration of shortages.
» We have significantly enhanced the availability of our plants.

Taking Advantage of our Customer Base

