introduction - agri exchange profile/moa/product/grapes.… · indian scenario there is sizeable...
TRANSCRIPT

GRAPES
1. Introduction
Grape (Vitis vinifera) is basically a sub- tropical crop. However, in India, grapes are cultivated for their excellence also
under tropical conditions. In India, Grapes are cultivated in an area of 111.4 thousand ha with a total production
1,234.9 thousand tons and productivity of 11.1 tons/ha. Because of special arbour training systems provided for
grape cultivation in India, productivity is highest among the grape growing countries of the world.
Maharashtra is a leading state in production of grapes in the whole country. With regard to agricultural land under
grape cultivation and grapes production, Nasik and Sangli districts are at forefront in the state. Apart from these,
grapes are also grown in the district of Ahmednagar, Pune, Satara, Solapur and Osmanabad. Nowadays, grapes are
produced in Latur district of Marathwada also. However, Nasik and Sangli districts are ahead in the production of
grapes in a scientific manner.
Area under grapes in Maharashtra is 86 thousand ha and production is around 774 thousand tons of grapes annually.
Total export of grapes from India is 108.58 thousand tons during 2011-12 valuing of Rs. 602.88 crores, out of which,
nearly 80% is exported from Maharashtra.
World Scenario
According to FAO data (2010), the leading grape producing countries in the world in terms of production are China
(8,651.83 thousand tons), Italy (7,787.80 thousand tons), USA (6,777.73 thousand tons) and Spain (6,107.20
thousand tons).
India’s high productivity in grape has made it to reach 18th position in the world as far as production (total world
production 67,116.25 thousand tons) is concerned.
Major producing countries of grapes in world (2010)
Country
Production
(tonnes)
Area (ha) Yield
(Hg/Ha)
%age share of World
in Production
China 8651831 533137 134263 12.89
Italy 7787800 777500 59316 11.60
United States of America 6777730 8001 195000 10.10
Spain 6107200 14942 174616 9.10
France 5848960 787133 100997 8.71
Turkey 4255000 19000 15625 6.34
Chile 2755700 188200 162282 4.11
Argentina 2616610 223685 116977 3.90
Iran (Islamic Republic of) 2255670 220836 100165 3.36
Australia 1684350 163785 102839 2.51
Other Countries 18375404 4168293 6575047 27.38
World total 67116255 7104512 7737127 100.00
Source: FAO

Indian Scenario
There is sizeable increase in acreage and production of grapes in India. In acreage, there is an increase from 47.5
thousand ha in 2001-02 to 111.4 thousand ha in 2010-11.Similarly the production has increased from 1,184.2
thousand tons in 2001-02 to 1,234.9 thousand tons in 2010-11.The details are given in table.
Area, production, and productivity of grapes in India
Year Area ( 000’ha) Production ( 000’tons)
Productivity ( tons/ha)
2001-02 47.50 1184.20 24.90
2002-03 52.10 1247.80 24.00
2003-04 57.80 1474.80 25.50
2004-05 60.50 1564.70 25.90
2005-06 66.00 1649.60 25.00
2006-07 65.00 1685.00 25.90
2007-08 68.00 1735.00 25.50
2008-09 80.00 1878.00 23.50
2009-10 106.40 880.70 8.30
2010-11 111.00 1235.00 11.10
Source: National Horticulture Board, Government of India
2. Major producing states with production of last 3 years
Maximum grape production takes place in Maharashtra (774 thousand tons) state followed by southern states like
Karnataka (330.3 thousand tons), Tamil Nadu (53 thousand tons) and Andhra Pradesh (27.6 thousand tons). The
details are given below in table.
Area in ‘000’ ha; Production in ‘000’ MT; Pdy. (ha/MT)
State 2008-09 2009-10 2010-11
Area Production Pdy. Area Production Pdy. Area Production Pdy.
Maharashtra 55.7 1415.0 25.4 82.0 440.0 5.4 86.0 774.0 9.0
Karnataka 14.9 269.0 18.0 17.4 317.6 18.3 18.1 330.3 18.3
Tamil Nadu 3.1 91.0 29.8 2.6 44.1 16.8 2.7 53.0 19.3
Andhra
Pradesh
3.0 62.2 21.0 1.4 29.8 21.0 1.3 27.6 21.0
Other 3.0 41.1 13.8 2.9 49.2 16.7 3.3 49.69 15.06
Total 79.6 1878.3 23.6 106.4 880.7 8.3 111.4 1234.9 11.0
Source: National Horticulture Board, Government of India

3. Description of commercially grown varieties
Shows the varietal characteristics of commercially grown grapes
Name of the
variety
Description Berry
diameter
Thompson
Seedless
Berries are oval to oblong in shape with T.S.S.18-22o Brix,
acidity 0.5 to 0.7%
16 mm to 18
mm
Sonaka Berries are elongated, cylindrical and amber
coloured,T.S.S. around 22 o Brix,acidity 0.4- 0.7%
16 mm to 19
mm
Sharad Seedless Berries are oblong to elliptical in shape and bluish black in
colour with T.S.S. 18-21 oBrix and acidity 0.5-0.7%
18mm to 22
mm
Tas-e-Ganesh Berries are ovoid shaped and green to amber in colour with
T.S.S. 20-22 o Brix and acidity 0.5- 0.65%
15 mm 20mm
4. Good Agricultural Practices (GAP)
Selection of improved varieties for cultivation
Identification of exact nature of problems in difficult soils and providing solutions.
Adoption of suitable training system and high planting density and canopy management
Integrated nutrient and water management of vineyards
Treatment with chemical growth regulants for quality improvement
Weed management
Integrated pest and disease management practices
5. Harvesting season of crop
Harvest season of grapes is depicted below (for 12 months)
-Lean Period -Peak Period
States Jan Feb Mar Apr May Jun Jul Aug Sep Oct Nov Dec
Maharashtra
Karnataka
Andhra Pradesh
Tamil Nadu
Punjab
Haryana
Source: Indian Horticulture Database

6. Arrival pattern in the market
Grapes start coming to the market in middle of January and peak time of availability is during Feburary-
March.Availability season is extended further to April – May by keeping the produce in cold stores. The details are
given below in table:
Details of arrival pattern of grapes in leading states
S.No. States Period Of Availability Peak Season
1 Maharashtra,Karnataka and Andhra Pradesh Middle of December - May February-March
2 Tamil Nadu** Mid of December – Mid of April February – March
3 Punjab and Haryana 1st week of June to 3rd week of june Mid June
** Grapes are also available in Tamil Nadu during May to July and September to November months.
7 (a) Concentrated pockets
State Districts
Maharashtra Nasik,Sangli,Solapur,Pune,Ahmednagar,Satara,Osmanabad
Karnataka Belgaum,Bijapur,Bagalkot, Kolar, Bangalore
Tamil Nadu Theni,Coimbatore,Dindigul, Dharampuri
Punjab Bhatinda,Ferozpur,Muktsar,Sangrur
Andhra Pradesh Rangareddy,Mehboobnagar
Haryana Fatehabad,Sirsa,Hisar

(b) Catchment areas of market
Showing the details of catchment areas of market of grapes in leading states
States Districts (Market) Blocks
Maharashtra
Solapur Karmala,Barsi,Madha,Mohol,Mangalwedha,Sangole,Malsiras,Pandharpur,Akalkot.
Nashik Kalvan,Peint,Igatpuri,Sinnar,Niphad,Yeola,Nandgaon,Satana,Furgana,Dindori,Melgaon,
Sangli Atpadi,Khanapur,Islampur,Shirala,Valva,Tasgaon,Kavathe, Mahankal,Jath, Miraj
Ahmednagar Srirampur,Sangamner,Akola,Rahusi,Nevasa,Parner,Pathardi, Srigonda,Karjat
Pune Junnar, Ambegaon, Ghod, Rajgurunagar, Wadgaonsirur, Mulshi, Welhe, Purandhar, Bhor, Baramati, Indapur, Daund, Saswad.
Satara Mahabaleshwar, Khandala, Wai, Phaltan, Koregaon ,Khata, Patan, Karad, Vadug.
Karnataka
Bijapur Indi,Sindgi,Basavna Bagevadi,Muddebihal,Tikota.
Belgaum Athni,Arkali,Chikodi,Mukeri,Bailhongal,Ramdurg,Khauapur.
Bagalkot Jamkhandi,Mudhol,Hungund,Badami.
Kolar Bagepalli,Gauribidanur,Gudibanda,ChikBallapur,Mulbagal, Malur,Bangarapet
Bangalore
Amekal, Sonnenahalti, Kannur, Bagalur, Nagarur, Marangondahalli, Haralur, Mantapa, Solurur, Chandapur.
Andhra Pradesh
Rangareddy
Marpali, Vikarabad, Tandur, Pargi, Ibranimpatan, Shahabad, Doma, Maisaram, Miryan, Nancherla.
Mehbubnagar
Kollur, Keshampat, Mughalgidda, Karnul, Wanparti, Atmakur, Gadwall, Alampur, Kolhapur, Achampet, Kondangol.
Tamil Nadu
Theni Periyakulam, Andipatti, Uttammapalayam, Bodimayakkanur, Kamban, Megamali, Vadugapatti,
Coimbatore Muttuppalaiyam, Avinashi, Tiruppur, Palladam, Udumallaippettai, Pollachi,Valparai.
Dindigul Palani, Kodaikkanal, Oddanchatran, Vedasandur, Naltam, Nilakkotai, Palaiyan
Punjab
Bhatinda Rampura Phul, Talwani Sabo, Bhagra, Jalal, Nathana, Bandi, Jaisinghwala, Shergarh, Sangat, Malkana, Lahri, Teona.
Ferozpur Zira, Fazilla ,Abohar, Jalalbad, Fatehgarh, Panjeke, Ladhuka, Lakhawall, Ramsara, Wahabwala.
Muktsar Kanianwali, Malaut, Baruwali, Sotha, Doda, Bhadar, AbulKharana, Bhagu, Waring, Khera
Haryana
Fatehabad Ratiya, Tohana, Badalgarh, Bhattu, Sampla, Pirthala, Samiyana, Kharihajan, Bhattukalan
Sirsa Fatehpur, Dabwali, Ellenabad, Banwala, SalamKhera, Nathohar, Mangl a,Jamal, Gushalyana.
Hisar Bithmara, Adampur, Narnaund, Hansi, Budak, Mangal, Umra, Sultanpur, Babal, Baria, Agroha, Kanoh, Khedar, Budak.

8 Criteria and description of grades
According to Agmark standards grapes are classified into following classes:
Table below Showing criteria for grade designation as per AGMARK standards
Grade designation Grade requirements
Provision concerning sizing Grade tolerances
1 2 3 4
Extra class
Grapes must be of superior quality. The bunches must be typical of variety in shape, development and coloring and have no defects. Berries must be firm, firmly attached to the stalk, evenly spaced along the stalk and have their bloom virtually intact.
As per table ‘A’
5% by weight of bunches not satisfying the requirements of the grade, but meeting those of class I grade or exceptionally coming within the tolerances of that grade.
Class I
Grapes must be of good quality. The bunches must be typical of variety in shape, development and coloring. Berries must be firm, firmly attached to the stalk and, as far as possible, have their bloom intact. They may, however, be less evenly spaced along the stalk than in the extra class. Following slight defects may be there, providing these do not affect the general appearance of the produce and keeping quality of the package. - a slight defect in shape. - a slight defect in coloring -do-
10% by weight of bunches not satisfying the requirements of the grade, but meeting those of class II grade or exceptionally coming within the tolerance of that grade.
Class II
The bunches may show defects in shape, development and coloring provided these do not impair the essential characteristics of the variety. The berries must be sufficiently firm and sufficiently attached. They may be less evenly spaced along the stalk than Class I grade. Following defects may be there, provided these do not affect the general appearance of the produce and keeping quality of the package. - defects in shape - defects in coloring - slight sun scorch affecting the skin only, - slight bruising, - slight skin defects -do-
10% by weight of bunches not satisfying the requirements of the grade, but meeting the minimum requirements.

Size is determined by the weight of bunches (in gms). The following minimum (in gms) requirements per bunch are
laid down for large and small berries grapes.
Provision concerning size
Specification details of Corrugated Fibre Board boxes are given in the following table.
Grade Large berries Small berries
Extra class 200 150
Class I 150 100
Class II 100 75
Size tolerance:
Extra Class, Class I, Class II: 10% by weight of bunches not satisfying the size requirements for
the grade, but meeting the size requirements for the grade immediately below.
9 Packaging and its details
(A) For exports:
Packaging is normally done in Corrugated or Solid Fibre board cartons. A layer of double pad or protective liner is
placed at the bottom of the carton to protect the grapes from bruising and a polyethylene lining is placed over it. The
detailed specifications are given below in table 3.10 and table.
Specification details for Corrugated Fiber Board (CFB) Boxes for packing (2Kg box) {Dimension:
270X150X100 mm}
S.No. Specification Slide Type Ring *Flap Tuck-In-Type
RSC(REGULAR SLOTTED
Tray with LID CONTAINER)
1
Material for construction 3-ply CFB 3-ply CFB 3-ply CFB 3-ply CFB
2
Grammage (g/m sq.)(outer to inner) *230X140X140 *230X140X140 *230X140X140 *230X140X140
3
Bursting strength kg/cm sq. Min. 6.00 Min. 6.00 Min. 6.00 Min. 6.00
4
Puncture resistance inches/teat inch Min.10.00 Min.10.00 Min.10.00 Min.10.00
5
Compression strength Kg. Min.225 Min.225 Min.225 Min.225
6
Cobb (30 minutes g/m sq.) Min.130 Min.130 Min.130 Min.130
Source: Post- Harvest Manual for Export of Grapes, APEDA, New Delhi.

Specification details for Corrugated Fiber Board (CFB) Boxes for packing(5 Kg Box ) {Dimension:
480X300X100 mm}
S.No. Specification Slide Type
Ring *Flap
Tuck-In-
Type
RSC(REGULAR
SLOTTED Tray with LID
1
Material for
construction 5-ply CFB 5-ply CFB 5-ply CFB 5-ply CFB
2
Grammage
(g/m
sq.)(outer to
inner) *230X140X140X140
*230X140
X140X140
*230X140
X140X140 *230X140X140X140
3
Bursting
strength
kg/cm sq. Min. 10.00 Min. 10.00 Min..250 Min..250
4
Puncture
resistance
inches/teat
inch Min..250 Min..250 Min..250 Min..250
5
Compression
strength Kg Min.350 Min.350 Min.350 Min.350
6
Cobb (30
minutes g/m
sq.) Max.130 Max.130 Max.130 Max.130
*Outer ply of white duplex board
Source: Post- Harvest Manual for Export of Grapes, APEDA, New Delhi.
(B) For domestic markets:
For domestic markets also, grapes are packed in Corrugated Fibre Board boxes.
10 Distribution of produce from primary to terminal market
Grapes grown in different parts of country are transported to the big cities for marketing.
The fruits produced in Maharashtra, Karnataka, Andhra Pradesh and Tamil Nadu find market in Mumbai, Nagpur and Kolkata.
The important whole sale markets of grapes in India are Kolkata, Delhi, Mumbai, Chennai, Bangalore, Nagpur, Pune and Ahmedabad. Grapes for these big arkets are usually collected at the central places in all grapes growing areas.
From Mumbai port grapes are exported to the destination markets.
11 Export and export potential
A. Domestic strengths for exports of grapes
Domestic strengths for exporting grapes are enumerated in following paragraphs:
Grapes in India are mainly cultivated in tropical region of the country where vines are pruned twice. Fruit pruning can be adjusted to harvest the crop as per the demand of the importing country.
Technology for production of Extra Class or Class I table grapes is available in the country.
The grape growers of the country are very innovative and very much receptive to new technologies and have registered with GLOBALGAP certification.
Yields of grapes in India are highest in the world.
Farmers of different regions have organized themselves by forming association/cooperatives and thus transfer of technology is easy.
Agri Export Zones for enhancing exports of grapes have been established.
Farmers of Maharashtra state in cooperation with MSAMB have branded their product as MAHA GRAPE.
The grape cultivators have research support from NRC for grapes, Pune, IIHR, Bangalore and State Agricultural Universities.
Grape growers in cooperation with MSAMB and APEDA have set up modern packhouses for handling and packing of grapes for exports.
APEDA has already set up a residue analysis laboratory at Pune for grape growing area of Maharashtra in order to cater to phytosanitary requirements of mporting countries.
Geographically India is at an advantageous position as compared to Chile, South Africa and Israel for exporting grapes to South East Asian countries like Hong Kong, Singapore etc.
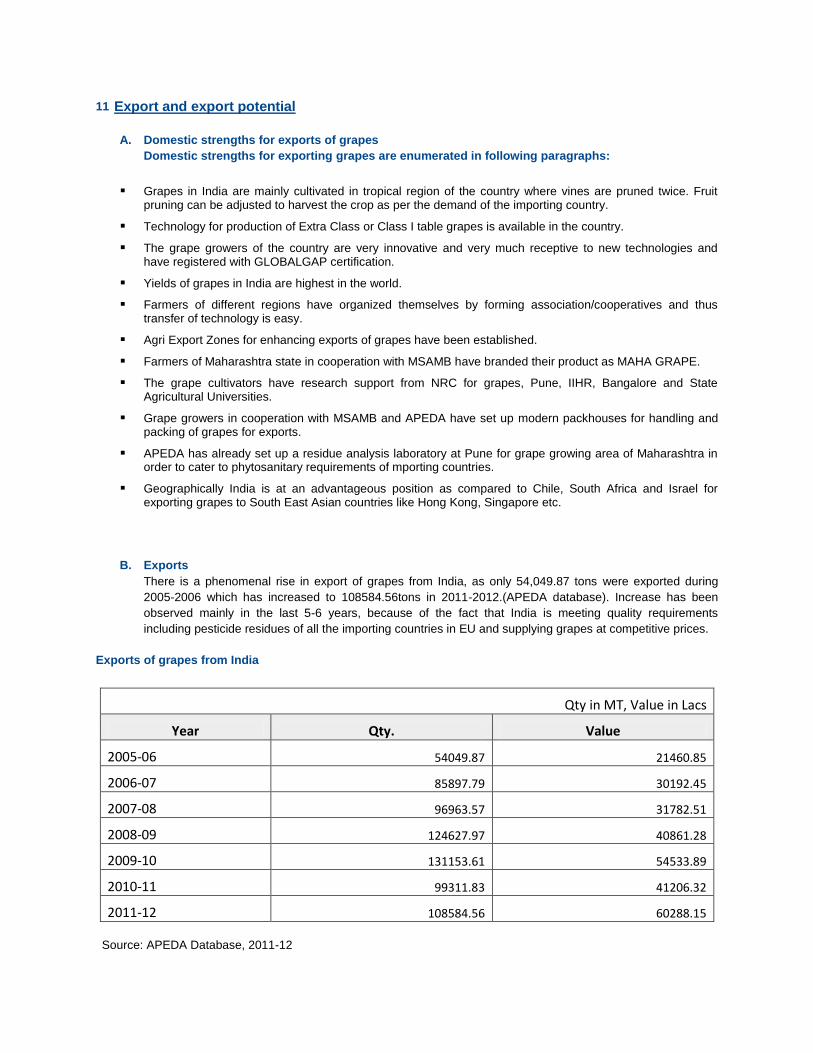
B. Exports
There is a phenomenal rise in export of grapes from India, as only 54,049.87 tons were exported during
2005-2006 which has increased to 108584.56tons in 2011-2012.(APEDA database). Increase has been
observed mainly in the last 5-6 years, because of the fact that India is meeting quality requirements
including pesticide residues of all the importing countries in EU and supplying grapes at competitive prices.
Exports of grapes from India
Qty in MT, Value in Lacs
Year Qty. Value
2005-06 54049.87 21460.85
2006-07 85897.79 30192.45
2007-08 96963.57 31782.51
2008-09 124627.97 40861.28
2009-10 131153.61 54533.89
2010-11 99311.83 41206.32
2011-12 108584.56 60288.15
Source: APEDA Database, 2011-12

India is the major exporter of Grapes in the world, the country has exported 108584.56 MT of Fresh Grapes worth Rs.
60288.15 Lacs during the year 2011-12. The major destinations of India’s grapes were Netherland , Bangladesh,
UAE, U.K, Russia and Sudi Arbia respectively. These countries have imported more than 50 per cent of India’s
grapes during 2010.
The detail of the major importing countries of India’s Grapes is given below:
Major Importing countries of India's Grapes Qty in MT, Value in Lacs
Country
2009-10 2010-11 2011-12 %age
growth
Share in
%age Qty Value Qty Value Qty Value
Netherland 29074.40 16883.63 17700.20 11809.86 18511.46 14296.52 21.06 23.71
Bangladesh 45656.02 6275.73 38562.78 5495.93 39646.54 12440.29 126.35 20.63
UA E 13205.45 7285.65 10384.29 5331.84 10359.26 6448.44 20.94 10.70
United Kingdom 14359.53 8210.77 7749.39 4847.62 6841.01 5490.48 13.26 9.11
Russia 745.81 598.24 2548.46 1934.86 4936.60 4092.24 111.50 6.79
Saudi Arabia 5098.85 2725.91 4058.26 1768.87 5735.26 3531.10 99.62 5.86
Thailand 875.64 741.16 1451.52 1335.54 1807.15 1850.94 38.59 3.07
Sweden 276.68 145.16 932.27 620.87 2196.27 1604.20 158.38 2.66
Sri Lanka 1506.50 461.53 1472.85 469.73 2171.38 1584.16 237.25 2.63
Nepal 4499.04 506.42 4435.74 492.06 4712.94 846.45 72.02 1.40 Other countries 15855.72 10699.66 10016.08 7099.15 11666.71 8103.35 -852.67 13.44
Total 131153.64 54533.86 99311.84 41206.33 108584.58 60288.17 46.31 100.00
Source: DGCIS
0
10000
20000
30000
40000
50000
60000
70000
2005-06 2006-07 2007-08 2008-09 2009-10 2010-11 2011-12
Va
lue
in R
s. L
acs
.Export of Grapes from India

Region-wise Export of India's Grapes Quantity in MT; Value in Rs.Lacs
Region Name 2009-10 2010-11 2011-12
Quantity Value Quantity Value Quantity Value
EU_27 51669.01 29490.62 30284.62 19999.35 32122.43 23864.08
South Asia 51674.93 7254.63 44472.90 6459.67 46589.45 14911.46
WANA 23277.61 14298.76 15919.09 8141.32 17584.28 10934.24
CIS Countries 921.62 706.96 3275.38 2397.24 5930.93 4783.08
ASEAN 2121.60 1679.32 3112.51 2632.84 3621.89 3667.15
NE Asia 175.59 122.95 929.96 716.55 1053.59 878.18
Latin America 192.07 191.23 166.93 83.61 885.71 630.82
Other We Countries 799.36 600.91 666.93 565.01 582.35 468.52
East Africa 186.01 126.98 178.22 106.07 168.52 112.07
East Europe 36.00 23.43 18.00 11.91 20.00 15.62
East Asia 18.20 8.22 30.03 8.04 11.37 10.11
North America 9.58 6.32 96.55 43.36 6.67 6.55
West Africa 23.19 13.35 122.85 29.05 6.33 5.45
Southern Africa 1.16 0.84 4.25 3.24 0.94 0.74
Central Africa 0.00 0.00 0.30 0.15 0.12 0.07
UNSPECIFIED 47.68 9.36 33.30 8.90 0.00 0.00
Total 131153.61 54533.88 99311.82 41206.31 108584.58 60288.14
Source: DGCIS Annual Export

i) European Union
Exports of grapes from India are maximum to European Union during 2011-2012. As much as 32,122 tons were
exported during the year. Largest importers were Netherlands (18,511 tons) and UK (6,841 tons). It must be noted
that India produces grapes mainly during January to April months, where as countries like U.S.A, Argentina, Italy,
Spain etc. produce grapes during September to December months. Since India is meeting quality requirements
including pesticide residues of all the importing countries in EU and supplying grapes at competitive prices, there is
no reason why we cannot penetrate in the markets of Belgium, Germany, Spain and have larger share of imports in
Netherlands and UK.
ii) South Asia
South Asia stood at second position with the import of 46589 MT Grapes from India during 2011-12. The major
market of India’s Grapes in South Asia region were Bangladesh, Sri Lanka and Nepal with 39646 MT, 2171 MT and
4743 MT respectively during the period.
iii) WANA Countries
As per DGCIS database, nearly, 17584 tons of India’s Grapes were exported to WANA Region of the world during
2011-12. The major market of India’s Grapes in WANA region was UAE and Saudi Arbia with 10359 tons and 5735
tons respectively, during the period.

The major competition of India Grapes export in WANA countries was South Africa and Chile. There is no reason why
we cannot penetrate more in WANA countries especially in Saudi Arabia, when we have quality grapes, are meeting
stringent quality control requirements of importing countries and are offering grapes at competitive prices. Moreover,
India location wise is nearer to WANA countries.
12. Storage
Temperature: 0 ± 0.5°C.
Relative Humidity:. 93 ± 2 %
Storage Period:. 3-8 weeks
Freezing Point:. -1°C.
13. Documents required for exports
a).Documents related to goods
Invoice
Packing List
Certificate of origin
b).Documents related to shipment
Mate Receipt
Shipping Bill
Bill of handing
Airway Bill
c) Documents related to Payment
Letter of Credit (L/C)
Bill of Exchange
d) Documents related to quality of goods
Phytosanitary Certificate
GLOBALGAP Certification
Health Certificate
e) Organic Certification
Certificate indicating material produce is based on organic farming
f) Documents related to Foreign Exchange Regulations
GR Form: Documents required by RBI which assures to RBI that the exporter will realize the proceeds of goods
within 180 days from the date of Shipment.
g) Other Document
Bank Realization Certification (BRC): This is the advice given by Foreign Exchange Bank after the realization of
money from Importer.
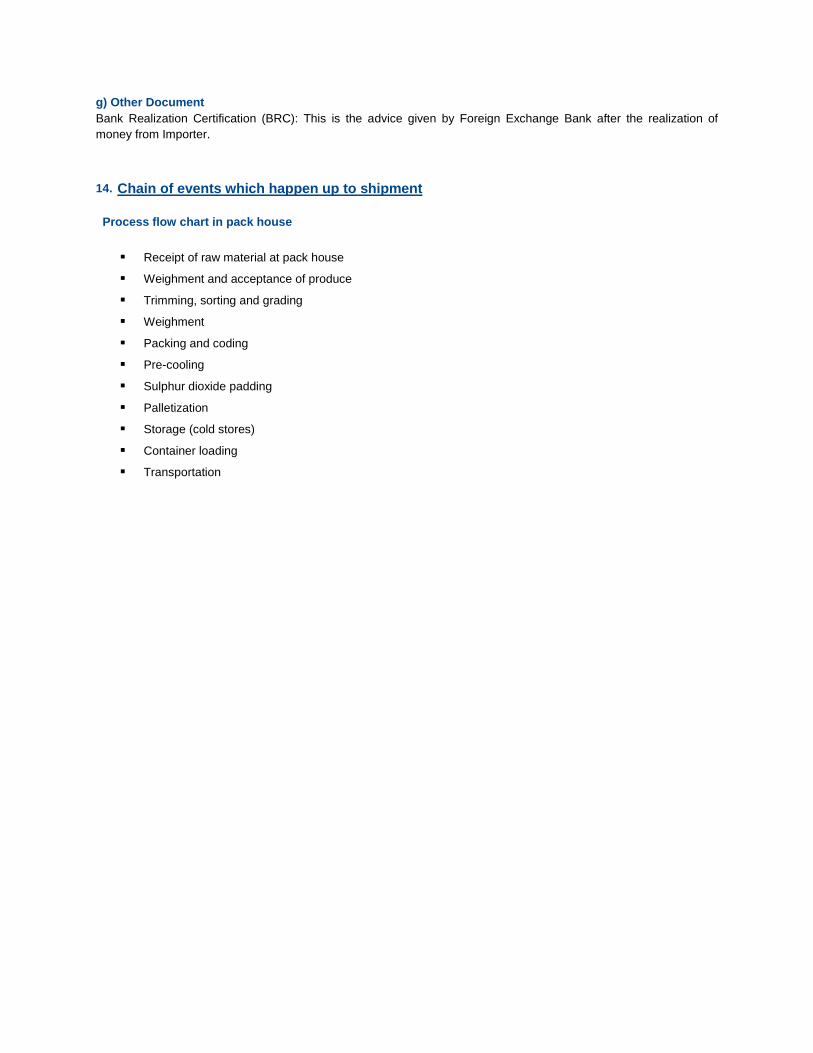
14. Chain of events which happen up to shipment
Process flow chart in pack house
Receipt of raw material at pack house
Weighment and acceptance of produce
Trimming, sorting and grading
Weighment
Packing and coding
Pre-cooling
Sulphur dioxide padding
Palletization
Storage (cold stores)
Container loading
Transportation