introducing the etheridge integrated agriculture project
TRANSCRIPT

Introducing the
Etheridge Integrated Agriculture Project
A Large‐scale, World‐class, Vertically Integrated,
Agribusiness Development
Page 1
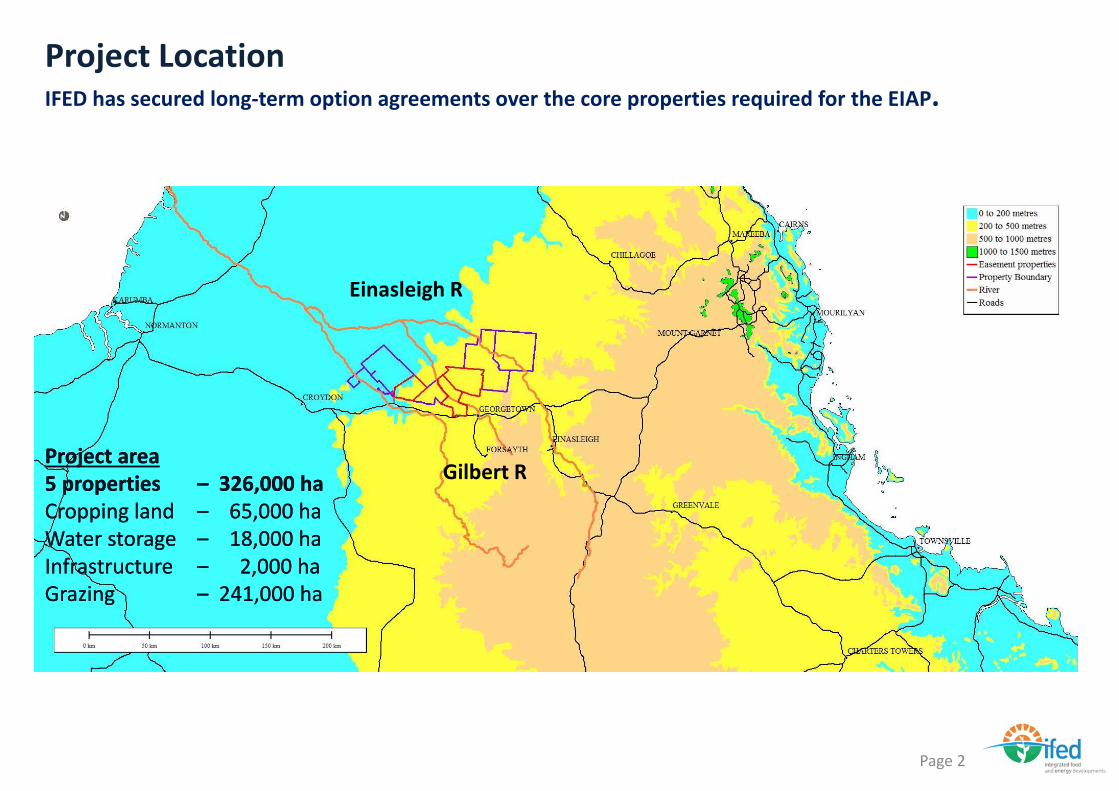
Project LocationIFED has secured long‐term option agreements over the core properties required for the EIAP.
Page 2
Project area5 properties – 326,000 haCropping land – 65,000 haWater storage – 18,000 haInfrastructure – 2,000 haGrazing – 241,000 ha
Project area5 properties – 326,000 haCropping land – 65,000 haWater storage – 18,000 haInfrastructure – 2,000 haGrazing – 241,000 ha
Einasleigh R
Gilbert R

Off‐ river water Storage ~2m/ML
The Project VisionA sustainable, world class, large scale, vertically integrated, farming and processing enterprise.
Page 3
Existingcattle
operations
Existingcattle
operations
Cogen – 90MWBagasse/biogas
Gum Plant
Sugar MillSugar, bagasse
Farm – 65,000haSugar ‐ 40,000 haGuar ‐ 25,000 ha
Feed Mill400 kt/y
Hull and germ 65 kt/y
Cane Tops
Raw sugar – 698 kt/y
Steam andElectricity ‐ 43MW
Guar gum ‐ 32 kt/y
Meat Processing
Plant
ngcattle
operations
Existingcattle
operations
Existingcattle
operations
From external local cattle producers
Cattle – 200,000Purchased from Others
Meat products 50 kt/yHides and offal
Molasses and bagasse from the sugar mill
Molasses and bagasse from the sugar mill
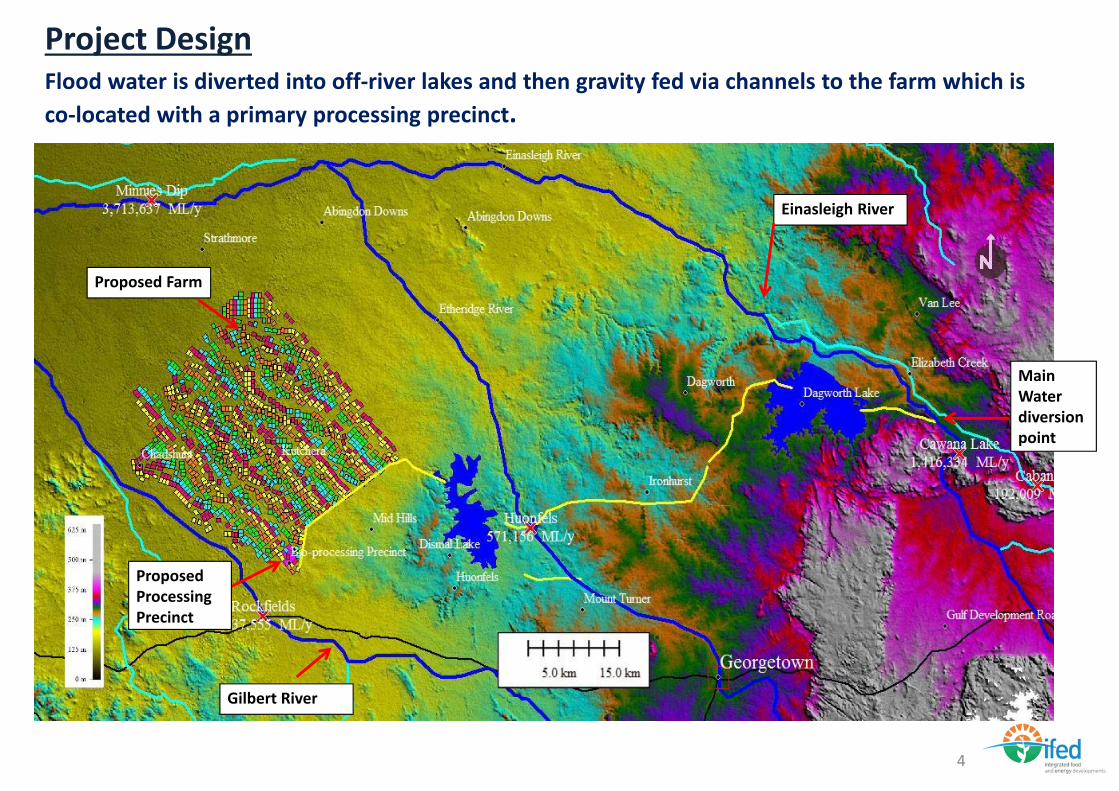
Flood water is diverted into off‐river lakes and then gravity fed via channels to the farm which is co‐located with a primary processing precinct.
4
Project Design
Main Water diversion point
Proposed Processing Precinct
Proposed Farm
Einasleigh River
Gilbert River

Project Cost Estimate Construction costs are estimated at A$1.989B and construction will take approximately 36 months.
Item Cost
Estimate $AUDm
Water diversion, storage and supply 484
Land preparation and irrigation 520
Farming and farm equipment 100
Sugar mill 515
Guar mill 52
Stock feed 36
Power station 161
Meat processing 64
Infrastructure 55
Overheads 2
Capital expenditure 1,989
Page 5

Rivers flowing into the Gulf of CarpentariaDiversion from the Gilbert River reduces flows into the Gulf of Carpentaria by 0.55 of 1% from 90,050 to 89,560 megalitres per year.
Gilbert River excl diversionDiversion from the Gilbert RiverOther Rivers discharging into the Gulf
93.8%
Source: Australia's Tropical Rivers ‐ Data Audit by NGIS Australia
5.65% 0.55 of 1%
Page 6

Water ReliabilitySimulation using government models (IQQM) combining climate, river and forecast water usage demonstrated 100% “Historical No Failure” at mean annual diversion of only 8.8%.
7

Transport LogisticsHigh capacity road trains deliver raw sugar to the Port of Townsville or Karumba to minimise inland transport costs.
Page 8
Port Distance,km Cost,$/tonneTownsville 630 35Karumba 320 18
___ Road Train___ B double
1. Secured the Land: Reached negotiated agreements with five land owners that secures the core properties under long term option agreements;
2. Feasibility: Preliminary technical and commercial feasibility analysis, including independent hydrology analysis & GIS modelling;
3. Secured the Water: Negotiated a “Development Protocol” with the Queensland Government and secured a substantial, conditional water allocation;
4. Approval Process: Lodged an Initial Advice Statement (IAS) and been declared “Co‐ordinated Project” by the Queensland government;
5. Commenced EIS: Completed public consultation process and finalised Terms of Reference for the Environmental Impact Study. Completed end of wet season studies and commenced dry season studies; and
6. Capital: Well progressed with $15m Pre‐Construction Phase capital raising and encouraging market soundings for the Construction Phase funding.
Page 9
The Journey So Far – Key Milestones

Page 10
The Wold Sugar Market
June 2014

11
Source: QSL – 22/10/14
Source: ABARES Outlook 2014
Source: ISO World Sugar Balance May 2014, updated Aug 2014
Sugar Price Indicators

12

13

Page 14
Thank You
June 2014