introducing a public option or capped provider payment
TRANSCRIPT
John Holahan and Michael Simpson
March 2021
This brief updates a previous report on the impacts of a public option or capped
provider payment rate health reform proposals published in March 2020 (Blumberg et
al. 2020). In this update, we provide estimates for 2022, using a revised current-law
baseline in the Health Insurance Policy Simulation Model (HIPSM) that reflects changes
in economic conditions resulting from the COVID-19 pandemic. In this and two
accompanying papers (Holahan and Simpson 2021a, 2021b), we analyze public option
and capped provider payment rate proposals that apply to the nongroup health
insurance market only and some that would apply both in the nongroup and employer
health insurance markets. We show the anticipated impacts on premiums in both the
nongroup and employer markets, the number of people uninsured, and spending by
employers, households, and the federal government. We also show the effect on
national health expenditures.
We first consider a public option and capped provider payment rates introduced in the nongroup
market alone. This is the most frequently proposed approach for such reforms (Blumberg et al. 2019,
2020; Blumberg, Simpson, and Buettgens 2019). However, other proposals would also extend a public
option to the employer market.1 Because the number of people enrolled in employer coverage is more
than nine times that in nongroup coverage and employer-based plans tend to pay health care
providers higher rates than do nongroup insurers, introducing the public option or capping provider
payment rates in both markets will have much greater effects than if the policies are introduced in the
nongroup market alone.
H EA L T H P O L I C Y C EN T ER
Introducing a Public Option or Capped Provider Payment Rates into Private Insurance Markets Updated Estimates
2 P U B L I C O P T I ON A N D C A P PE D R A T E R E F O R MS I N P R I VA T E I N S U RA N C E MA R K E T S
What Is a Public Option?
A public option is a government-sponsored insurance plan that pays providers (doctors, hospitals,
prescription drug manufacturers) according to a defined payment schedule and set of benefits. As an
insurer, the federal government ultimately bears the risk associated with the plan. Payment rates
under a public option are generally assumed to be lower than those typical of commercial insurers,
with the federal government using its purchasing and/or negotiating power to lower health care
spending for enrollees. A public option could be available in nongroup or employer markets or both,
and one or multiple public options could be offered in a particular market, with multiple plans offering
different actuarial values or cost-sharing structures. Here, we simply discuss a single public option.
A public option could be made available either nationally or in particular geographic areas. It could
be implemented alone or in conjunction with regulated limits on rates paid by competing private
insurers in the same markets (hereafter called “capped provider payment rates”). Combined, the
approaches would be similar to the Medicare program’s structure, or more specifically, the offering of
private Medicare Advantage plans that compete with the traditional Medicare fee-for-service plan (a
type of public option). Taking advantage of a public option introduced alone would require consumers
(e.g., households and/or employer groups) to enroll in a newly established insurance plan. However,
depending on how the public option’s provider payment schedule is set relative to that for commercial
plans in a given market, competition from the public option may result in more aggressive negotiation
between private insurers and providers for lower rates, possibly lowering private insurance premiums
as well. But, if private insurers cannot maintain sufficient market share because of (1) an inability to
negotiate lower payment rates with providers or (2) other consumer preferences for a public option,
competition from a public option may reduce the number of private insurers competing in at least
some areas.
How Would Capping Provider Payment Rates Work?
Capping provider payment rates for all private insurers in particular markets or nationwide has been
proposed as an alternative to a public option (or, as noted above, in conjunction with one).2 This
approach would limit the payment rates insurers could pay health care providers in the applicable
markets. Generally, payment rates would be capped at lower levels than those typical of private
insurers today, or the growth rate of such caps would be constrained to lower premiums and health
care spending over time. The capped rates could apply to insurers in nongroup or employer markets or
both. A central advantage of capped provider payment rates over a public option is that consumers
could obtain the full benefit of lower provider payment rates while being enrolled with their preferred
insurer. In addition, capped provider payment rates likely result in more private insurers entering or
staying in markets, compared with a public option implemented alone. Under capped payment rates,
insurers would not need large numbers of enrollees to leverage and achieve competitive payment
rates with providers.
P U B L I C O P T I ON A N D C A P PE D R A T E R E F O R MS I N P R I VA T E I N S U RA N C E MA R K E T S 3
Policy Approaches Modeled
The updated analyses presented here rely on the same methodology as our earlier work (Blumberg et
al. 2020); estimates are produced for 2022, using the Urban Institute’s Health Insurance Policy
Simulation Model (Buettgens and Banthin 2020).
We first look at public option proposals implemented only in the nongroup market. As noted, this
would be a new, qualified health plan that would compete with private insurance plans already in
these markets. It would follow the same rules applied to private plans in those markets, including
participating in risk adjustment. The public option would likely become the lowest-priced silver plan or
the benchmark plan (the second-lowest-premium silver plan) in many rating regions, particularly if it
pays providers Medicare-like rates.3 However, it may not become either low-priced offering if its
provider payment rates are set above Medicare levels. If the nongroup public option becomes the
lowest-priced silver option or second-lowest-priced option, the benchmark premium will drop, thereby
reducing the cost of federal premium subsidies and costs for some households.
Next, we analyze approaches that would extend the public option or capped provider payment
rates to employer insurance markets, too. To take advantage of potential savings from a public option,
an employer would have to switch coverage for the firm’s workers into that new plan. Consistent with
our earlier work, we assume a firm’s decision to switch into the public option varies by its wages and
size; the lower the average wage and the smaller the firm, the more likely they will switch from their
current insurance to the public option. Large and high-wage firms would be more likely to remain with
their current coverage, because they could vary benefit packages, cost sharing, and out-of-pocket
limits. Some may view paying somewhat higher provider payment rates as worthwhile, because it
allows them to tailor benefits and provider networks to employees’ needs or wishes. We also assume
employers would have to save at least 20 percent in premiums to make switching sufficiently
attractive.
We analyze several levels of provider payment rates. The following reforms are modeled in
nongroup markets alone:
◼ Public option 1 sets provider payment rates at Medicare levels.
◼ Public option 2 sets provider payment rates at Medicare levels plus 10 percent for
professionals and plus 25 percent for hospitals.
◼ Public option 3 sets provider payment rates at Medicare levels plus 15 percent for
professionals and plus 60 percent for hospitals.
4 P U B L I C O P T I ON A N D C A P PE D R A T E R E F O R MS I N P R I VA T E I N S U RA N C E MA R K E T S
In the next two simulations, a public option is introduced into employer markets in addition to
nongroup markets. All simulations including the employer markets assume provider payment rates
above Medicare levels, because the impact on health care providers would be much larger, and we
assume using Medicare rates would be too disruptive to the health care system, at least in the near
term.
◼ Public option 4 sets provider payment rates at Medicare levels plus 10 percent for
professionals and plus 25 percent for hospitals.
◼ Public option 5 sets provider payment rates at Medicare levels plus 15 percent for
professionals and plus 60 percent for hospitals.
The next two reforms simulated introduce capped provider payment rates into both the nongroup
and employer markets:
◼ Capped rates 1 sets provider payment rates at Medicare levels plus 10 percent for
professionals and plus 25 percent for hospitals.
◼ Capped rates 2 sets provider payment rates at Medicare levels plus 15 percent for
professionals and 60 percent for hospitals.
In each reform, we also assume federal implementation of prescription drug reforms that would
require prescription drug manufacturers to provide the public option or private insurers operating
under regulated payment limits rebates halfway between those currently provided to the Medicare
and Medicaid programs. This health-care-cost-containment policy and its rebate levels would be set
nationally, because drugs are sold in a national market. We estimate these increased rebates would
reduce average current prescription drug prices facing commercial insurers by approximately 30
percent (Hwang and Kesselheim 2020).
Highlights of Findings
Table 1 and figure 1 summarize our main findings; supplementary tables at the end of the paper show
additional details. All estimates assume reforms are fully implemented in 2022. We acknowledge
considerable uncertainty surrounding these estimates, which we detail in the methods section. Our
primary limitation is the absence of ideal data sources, which forces us to make assumptions and use
proxy measures in some areas.
P U B L I C O P T I ON A N D C A P PE D R A T E R E F O R MS I N P R I VA T E I N S U RA N C E MA R K E T S 5
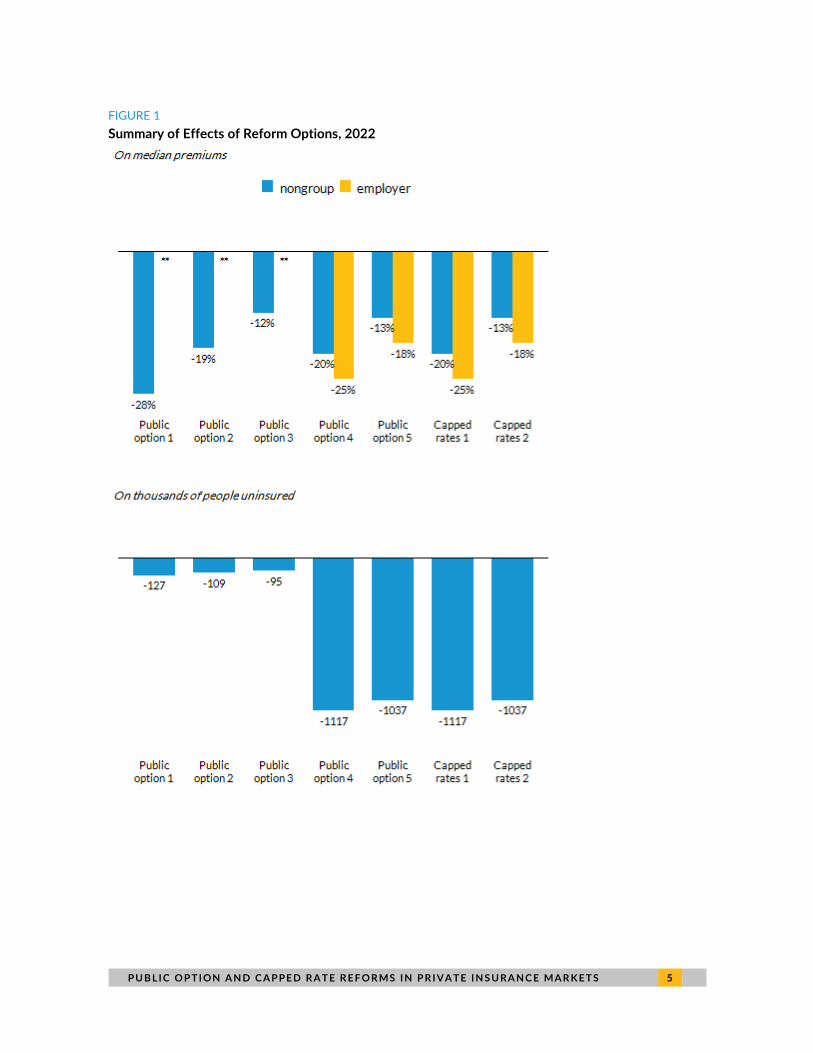
FIGURE 1
Summary of Effects of Reform Options, 2022
6 P U B L I C O P T I ON A N D C A P PE D R A T E R E F O R MS I N P R I VA T E I N S U RA N C E MA R K E T S
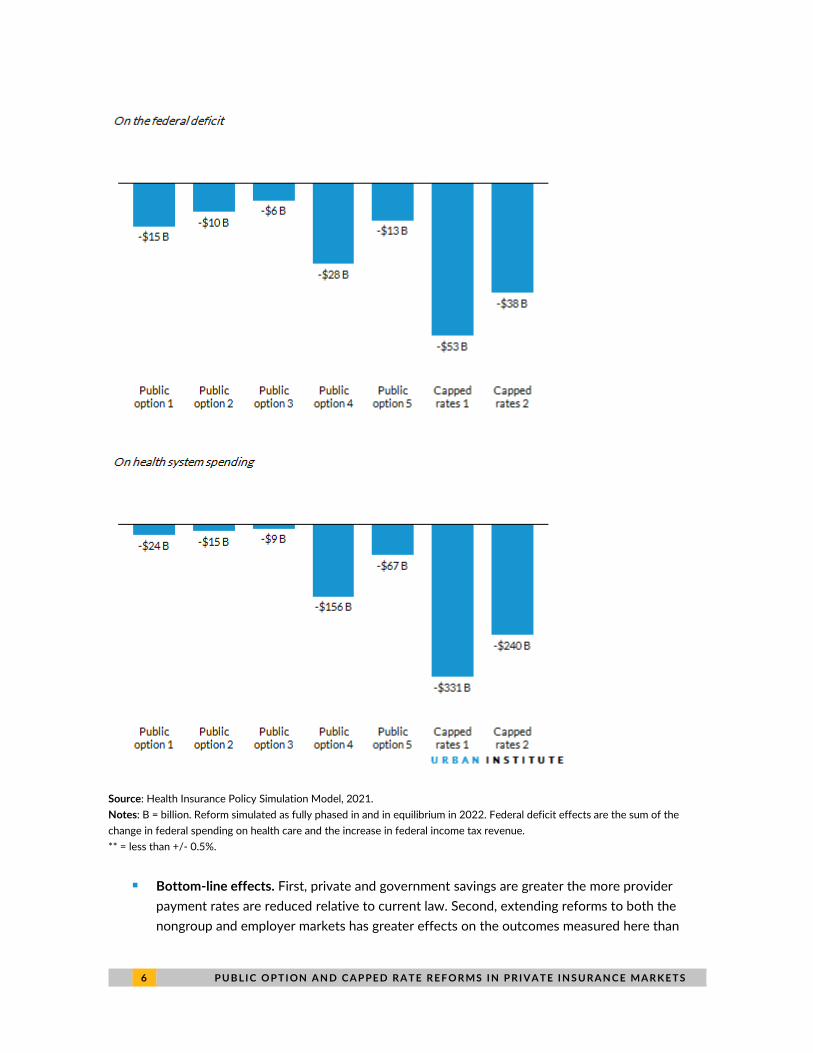
Source: Health Insurance Policy Simulation Model, 2021.
Notes: B = billion. Reform simulated as fully phased in and in equilibrium in 2022. Federal deficit effects are the sum of the
change in federal spending on health care and the increase in federal income tax revenue.
** = less than +/- 0.5%.
◼ Bottom-line effects. First, private and government savings are greater the more provider
payment rates are reduced relative to current law. Second, extending reforms to both the
nongroup and employer markets has greater effects on the outcomes measured here than
P U B L I C O P T I ON A N D C A P PE D R A T E R E F O R MS I N P R I VA T E I N S U RA N C E MA R K E T S 7
does limiting the reforms to the nongroup market. Third, capped provider payment rates have
more significant impacts than public options.
◼ Premiums and coverage in the nongroup market. We estimate a nongroup public option using
the specified provider payment rates could lower premiums by 12 to 28 percent. The greatest
reduction in premiums occurs under reforms that reduce provider payment rates the most.
We estimate the effects on insurance coverage to be very small. Policies that enhance and
expand subsidies are needed to significantly increase insurance coverage, but we do not
consider them here.4
◼ Federal, household, and employer health spending in the nongroup market. Because
nongroup premiums are lower, federal spending on premium tax credits declines by $6 to $15
billion. Household spending falls by $3 to $8 billion, about 1 percent of household spending;
the effects are, however, fully concentrated among nongroup enrollees, so their savings are
larger. Employer spending is virtually unaffected. National health spending declines slightly.
◼ Premiums and coverage in the employer market. A public option or capped provider payment
rates tend to lower premiums more in employer markets than nongroup markets, because
provider payment rates in employer markets tend to be higher today. When the public option
is extended to employer markets using the payment rates analyzed, we estimate premiums for
participating employers fall by 18 to 25 percent. Nongroup premiums in these same
simulations fall by 13 to 20 percent. Reductions in premiums are larger for options with
greater reductions in provider payment rates, which we assume are directly related. We
estimate offering the public option or capped provider payment rates in the employer market
could reduce the number of people uninsured by more than 1 million. Far more people in
employer markets would be affected by capped provider rates than by the public options,
because we estimate many employers would choose not to participate in the public option.
◼ Employer and household spending in the employer market. Extending the public option or
capped rates to the employer market significantly affects spending. Employers save $32 to
$86 billion under public option–only reforms, but their savings under capped rates range from
$145 to $202 billion. Household spending falls by $27 to $58 billion under public options
reforms but by $87 to $118 billion under capped rates.
◼ Federal spending and income tax revenue in the employer market. As employers spend less
on premiums, economic research indicates they convert the savings into higher wages for
their workers. Because those higher wages are taxable, the federal deficit decreases. The
federal deficit falls by $13 to $28 billion when a public option is introduced into the employer
market but declines by $38 to $53 billion under capped rates.
◼ National health spending. National health spending on the nonelderly falls by less than 1
percent under the public option reforms limited to the nongroup market. If a public option is
available in the nongroup and employer markets, total health spending falls by as much as 7
percent, depending on the payment rates used. Under the capped rate reforms, national
health spending could fall by as much as 16 percent.
8 P U B L I C O P T I ON A N D C A P PE D R A T E R E F O R MS I N P R I VA T E I N S U RA N C E MA R K E T S
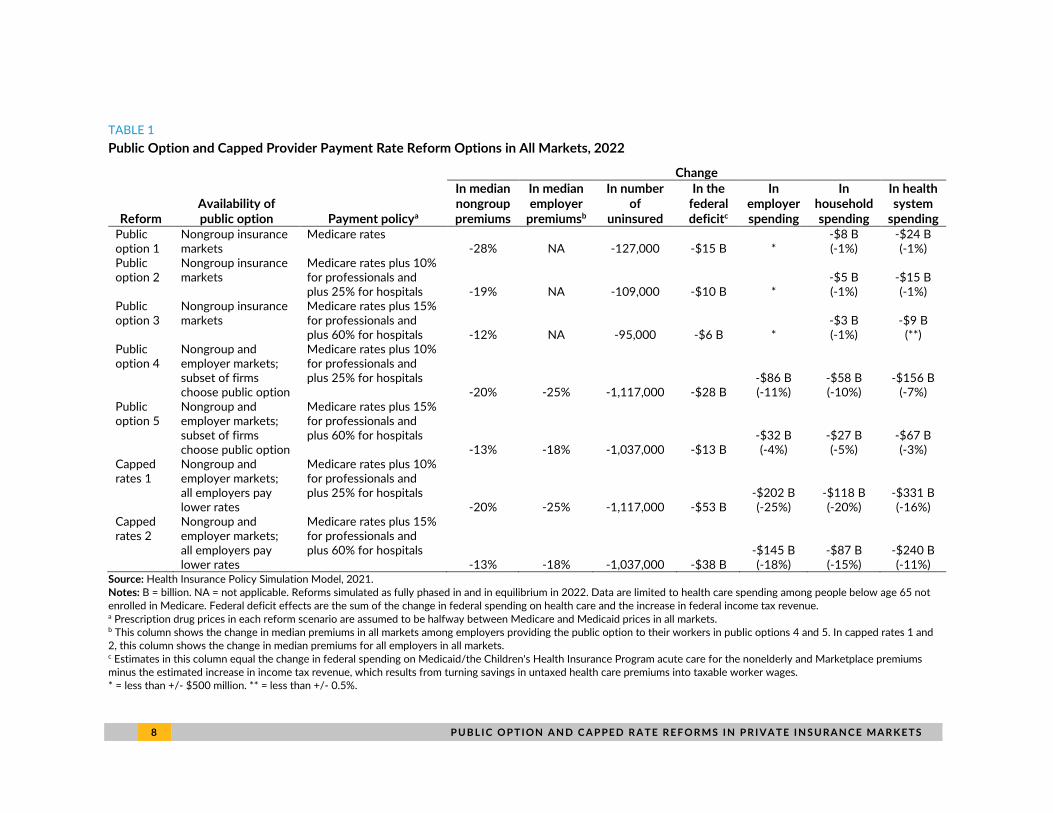
TABLE 1
Public Option and Capped Provider Payment Rate Reform Options in All Markets, 2022
Change
Reform Availability of public option Payment policya
In median nongroup premiums
In median employer
premiumsb
In number of
uninsured
In the federal deficitc
In employer spending
In household spending
In health system
spending Public option 1
Nongroup insurance markets
Medicare rates -28% NA -127,000 -$15 B *
-$8 B (-1%)
-$24 B (-1%)
Public option 2
Nongroup insurance markets
Medicare rates plus 10% for professionals and plus 25% for hospitals -19% NA -109,000 -$10 B *
-$5 B (-1%)
-$15 B (-1%)
Public option 3
Nongroup insurance markets
Medicare rates plus 15% for professionals and plus 60% for hospitals -12% NA -95,000 -$6 B *
-$3 B (-1%)
-$9 B (**)
Public option 4
Nongroup and employer markets; subset of firms choose public option
Medicare rates plus 10% for professionals and plus 25% for hospitals
-20% -25% -1,117,000 -$28 B -$86 B (-11%)
-$58 B (-10%)
-$156 B (-7%)
Public option 5
Nongroup and employer markets; subset of firms choose public option
Medicare rates plus 15% for professionals and plus 60% for hospitals
-13% -18% -1,037,000 -$13 B -$32 B (-4%)
-$27 B (-5%)
-$67 B (-3%)
Capped rates 1
Nongroup and employer markets; all employers pay lower rates
Medicare rates plus 10% for professionals and plus 25% for hospitals
-20% -25% -1,117,000 -$53 B -$202 B (-25%)
-$118 B (-20%)
-$331 B (-16%)
Capped rates 2
Nongroup and employer markets; all employers pay lower rates
Medicare rates plus 15% for professionals and plus 60% for hospitals
-13% -18% -1,037,000 -$38 B -$145 B (-18%)
-$87 B (-15%)
-$240 B (-11%)
Source: Health Insurance Policy Simulation Model, 2021. Notes: B = billion. NA = not applicable. Reforms simulated as fully phased in and in equilibrium in 2022. Data are limited to health care spending among people below age 65 not enrolled in Medicare. Federal deficit effects are the sum of the change in federal spending on health care and the increase in federal income tax revenue. a Prescription drug prices in each reform scenario are assumed to be halfway between Medicare and Medicaid prices in all markets. b This column shows the change in median premiums in all markets among employers providing the public option to their workers in public options 4 and 5. In capped rates 1 and 2, this column shows the change in median premiums for all employers in all markets. c Estimates in this column equal the change in federal spending on Medicaid/the Children's Health Insurance Program acute care for the nonelderly and Marketplace premiums minus the estimated increase in income tax revenue, which results from turning savings in untaxed health care premiums into taxable worker wages. * = less than +/- $500 million. ** = less than +/- 0.5%.
P U B L I C O P T I ON A N D C A P PE D R A T E R E F O R MS I N P R I VA T E I N S U RA N C E MA R K E T S 9
Projected Impacts of Public Option and Capped Provider
Payment Rate Proposals
In this section, we present our detailed estimates of each of the seven reforms modeled. We include
estimates of changes in median nongroup and employer premiums, health insurance coverage, and
health care spending by households, employers, and the federal government. For federal spending
effects, we show the impact on the federal deficit, which is a combination of the direct reduction in
federal government spending on health care programs (primarily from lower spending on Marketplace
premium tax credits) and the increased income tax revenue from lower employer spending on
nontaxable health insurance benefits.
All estimates assume the reforms are fully phased in and in equilibrium in 2022. This means the
supply of services is assumed to expand to meet any increased demand for services. In reality, it is
more likely the reforms would require a multiyear phase-in, over which payment rates would decrease
toward target levels. How long the phase-in would take would determine the underlying savings to
households, employers, and the federal government. The slower the pace of payment rate reductions,
the less potentially disruptive to the health system and the more politically feasible a reform will likely
be. But, the resulting savings will be lower as well.
1 0 P U B L I C O P T I ON A N D C A P PE D R A T E R E F O R MS I N P R I VA T E I N S U RA N C E MA R K E T S
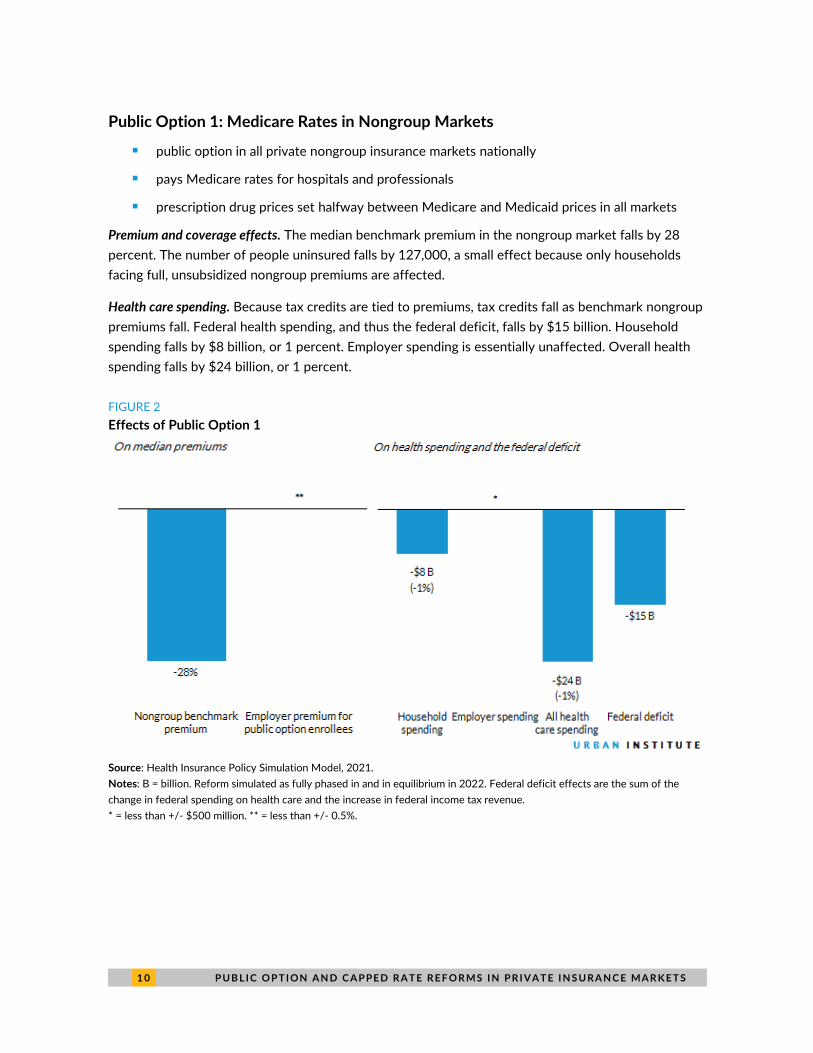
Public Option 1: Medicare Rates in Nongroup Markets
◼ public option in all private nongroup insurance markets nationally
◼ pays Medicare rates for hospitals and professionals
◼ prescription drug prices set halfway between Medicare and Medicaid prices in all markets
Premium and coverage effects. The median benchmark premium in the nongroup market falls by 28
percent. The number of people uninsured falls by 127,000, a small effect because only households
facing full, unsubsidized nongroup premiums are affected.
Health care spending. Because tax credits are tied to premiums, tax credits fall as benchmark nongroup
premiums fall. Federal health spending, and thus the federal deficit, falls by $15 billion. Household
spending falls by $8 billion, or 1 percent. Employer spending is essentially unaffected. Overall health
spending falls by $24 billion, or 1 percent.
FIGURE 2
Effects of Public Option 1
Source: Health Insurance Policy Simulation Model, 2021.
Notes: B = billion. Reform simulated as fully phased in and in equilibrium in 2022. Federal deficit effects are the sum of the
change in federal spending on health care and the increase in federal income tax revenue.
* = less than +/- $500 million. ** = less than +/- 0.5%.
P U B L I C O P T I ON A N D C A P PE D R A T E R E F O R MS I N P R I VA T E I N S U RA N C E MA R K E T S 1 1
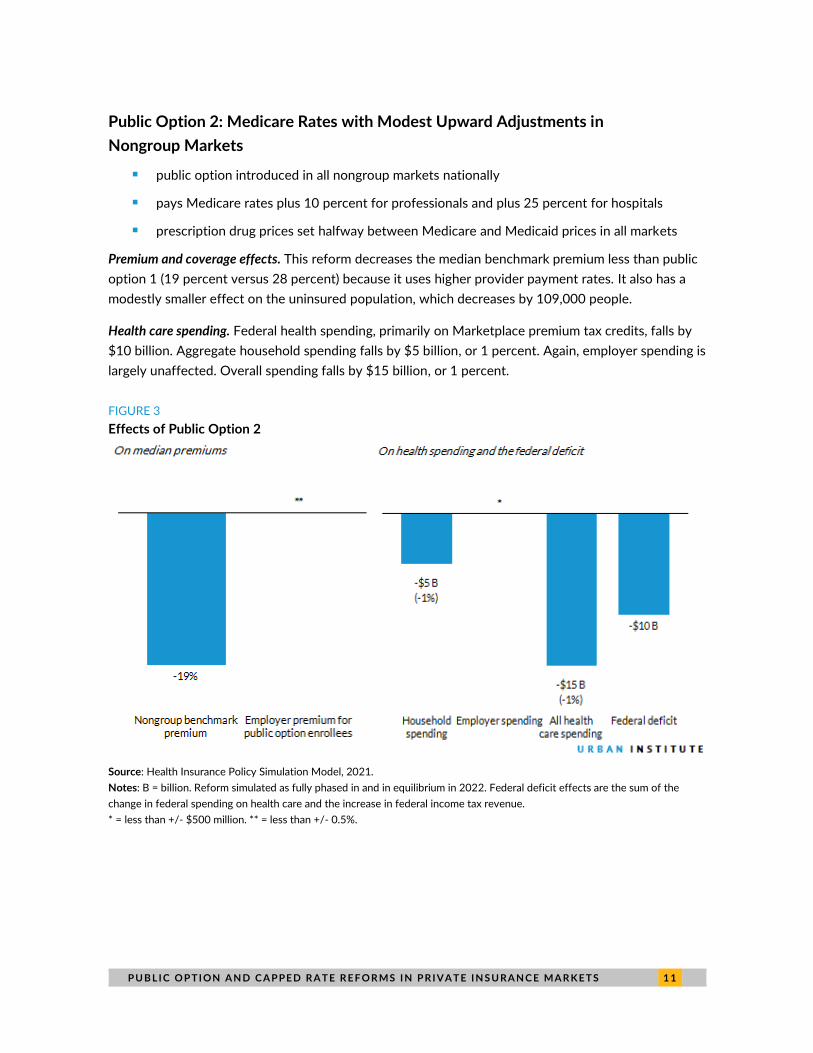
Public Option 2: Medicare Rates with Modest Upward Adjustments in
Nongroup Markets
◼ public option introduced in all nongroup markets nationally
◼ pays Medicare rates plus 10 percent for professionals and plus 25 percent for hospitals
◼ prescription drug prices set halfway between Medicare and Medicaid prices in all markets
Premium and coverage effects. This reform decreases the median benchmark premium less than public
option 1 (19 percent versus 28 percent) because it uses higher provider payment rates. It also has a
modestly smaller effect on the uninsured population, which decreases by 109,000 people.
Health care spending. Federal health spending, primarily on Marketplace premium tax credits, falls by
$10 billion. Aggregate household spending falls by $5 billion, or 1 percent. Again, employer spending is
largely unaffected. Overall spending falls by $15 billion, or 1 percent.
FIGURE 3
Effects of Public Option 2
Source: Health Insurance Policy Simulation Model, 2021.
Notes: B = billion. Reform simulated as fully phased in and in equilibrium in 2022. Federal deficit effects are the sum of the
change in federal spending on health care and the increase in federal income tax revenue.
* = less than +/- $500 million. ** = less than +/- 0.5%.
1 2 P U B L I C O P T I ON A N D C A P PE D R A T E R E F O R MS I N P R I VA T E I N S U RA N C E MA R K E T S
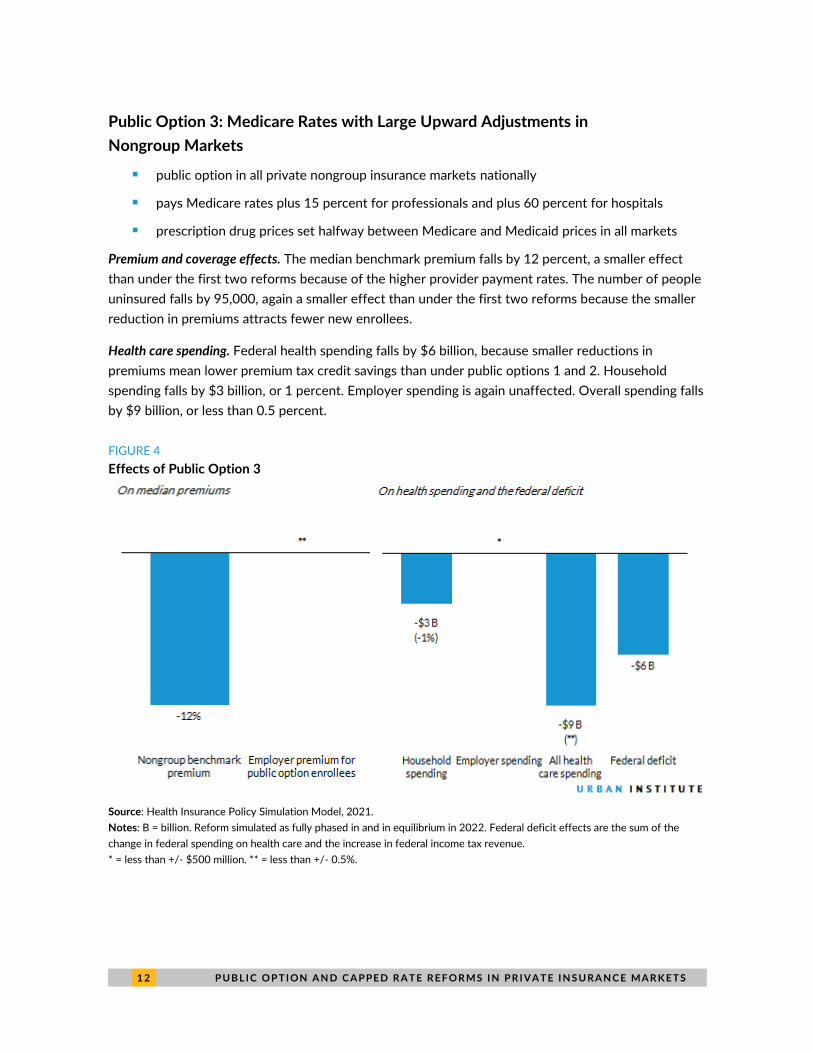
Public Option 3: Medicare Rates with Large Upward Adjustments in
Nongroup Markets
◼ public option in all private nongroup insurance markets nationally
◼ pays Medicare rates plus 15 percent for professionals and plus 60 percent for hospitals
◼ prescription drug prices set halfway between Medicare and Medicaid prices in all markets
Premium and coverage effects. The median benchmark premium falls by 12 percent, a smaller effect
than under the first two reforms because of the higher provider payment rates. The number of people
uninsured falls by 95,000, again a smaller effect than under the first two reforms because the smaller
reduction in premiums attracts fewer new enrollees.
Health care spending. Federal health spending falls by $6 billion, because smaller reductions in
premiums mean lower premium tax credit savings than under public options 1 and 2. Household
spending falls by $3 billion, or 1 percent. Employer spending is again unaffected. Overall spending falls
by $9 billion, or less than 0.5 percent.
FIGURE 4
Effects of Public Option 3
Source: Health Insurance Policy Simulation Model, 2021.
Notes: B = billion. Reform simulated as fully phased in and in equilibrium in 2022. Federal deficit effects are the sum of the
change in federal spending on health care and the increase in federal income tax revenue.
* = less than +/- $500 million. ** = less than +/- 0.5%.
P U B L I C O P T I ON A N D C A P PE D R A T E R E F O R MS I N P R I VA T E I N S U RA N C E MA R K E T S 1 3
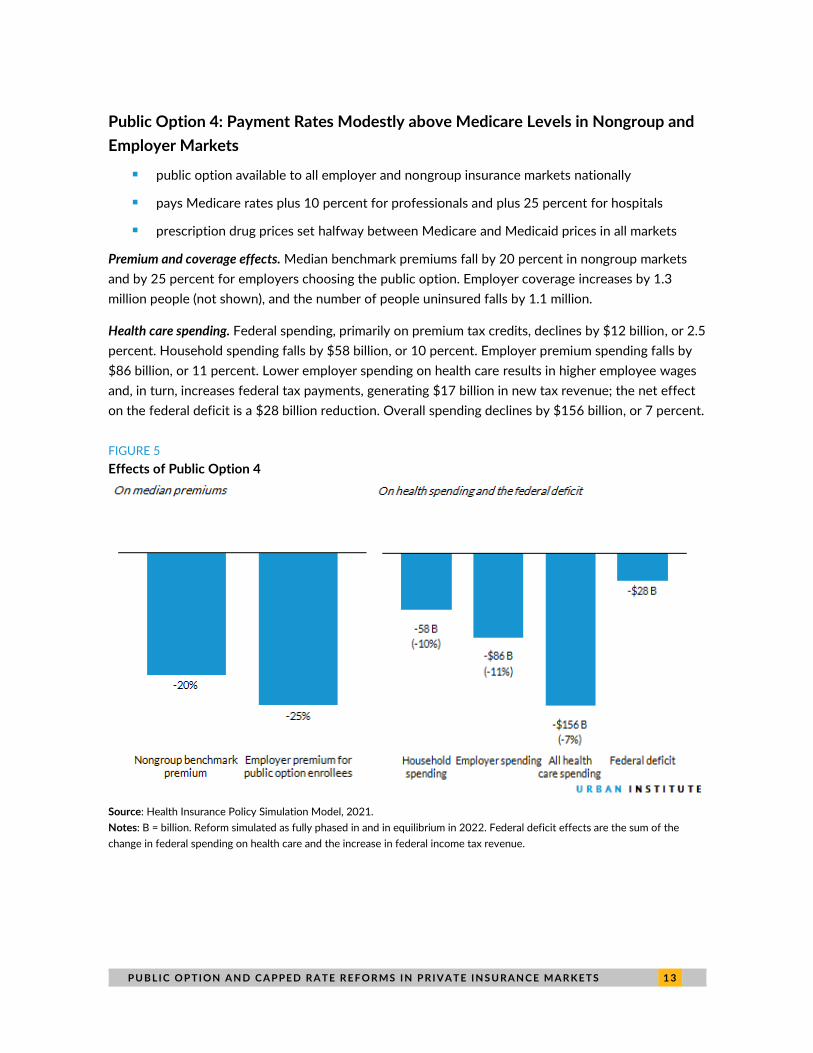
Public Option 4: Payment Rates Modestly above Medicare Levels in Nongroup and
Employer Markets
◼ public option available to all employer and nongroup insurance markets nationally
◼ pays Medicare rates plus 10 percent for professionals and plus 25 percent for hospitals
◼ prescription drug prices set halfway between Medicare and Medicaid prices in all markets
Premium and coverage effects. Median benchmark premiums fall by 20 percent in nongroup markets
and by 25 percent for employers choosing the public option. Employer coverage increases by 1.3
million people (not shown), and the number of people uninsured falls by 1.1 million.
Health care spending. Federal spending, primarily on premium tax credits, declines by $12 billion, or 2.5
percent. Household spending falls by $58 billion, or 10 percent. Employer premium spending falls by
$86 billion, or 11 percent. Lower employer spending on health care results in higher employee wages
and, in turn, increases federal tax payments, generating $17 billion in new tax revenue; the net effect
on the federal deficit is a $28 billion reduction. Overall spending declines by $156 billion, or 7 percent.
FIGURE 5
Effects of Public Option 4
Source: Health Insurance Policy Simulation Model, 2021.
Notes: B = billion. Reform simulated as fully phased in and in equilibrium in 2022. Federal deficit effects are the sum of the
change in federal spending on health care and the increase in federal income tax revenue.

1 4 P U B L I C O P T I ON A N D C A P PE D R A T E R E F O R MS I N P R I VA T E I N S U RA N C E MA R K E T S
Public Option 5: Payment Rates Considerably above Medicare Levels in Employer
and Nongroup Markets
◼ public option available to all employer and nongroup insurance markets nationally
◼ pays Medicare rates plus 15 percent for professionals and plus 60 percent for hospitals
◼ prescription drug prices set halfway between Medicare and Medicaid prices in all markets
Premium and coverage effects. Because this reform uses higher payment rates than public option 4,
median benchmark premiums fall by 13 percent in the nongroup market and by 18 percent among
employers choosing the public option. Introducing the public option, a new and less expensive
insurance option, into the employer market increases employer coverage by 1.2 million people and
reduces the number of people uninsured by 1.0 million.
Health care spending. Federal government spending falls by $8 billion, less than under public option 4
because the higher provider payment rates reduce the reform’s impact on premiums. Households save
$27 billion, or 5 percent. Employers save $32 billion in premiums, or 4 percent. Employer savings
translate to increased taxable wages, thereby generating about $5 billion in new federal revenues. The
federal deficit declines by $13 billion. Overall spending decreases by $67 billion, or 3 percent.
FIGURE 6
Effects of Public Option 5
Source: Health Insurance Policy Simulation Model, 2021.
Notes: B = billions. Reform simulated as fully phased in and in equilibrium in 2022. Federal deficit effects are the sum of the
change in federal spending on health care and the increase in federal income tax revenue.
P U B L I C O P T I ON A N D C A P PE D R A T E R E F O R MS I N P R I VA T E I N S U RA N C E MA R K E T S 1 5
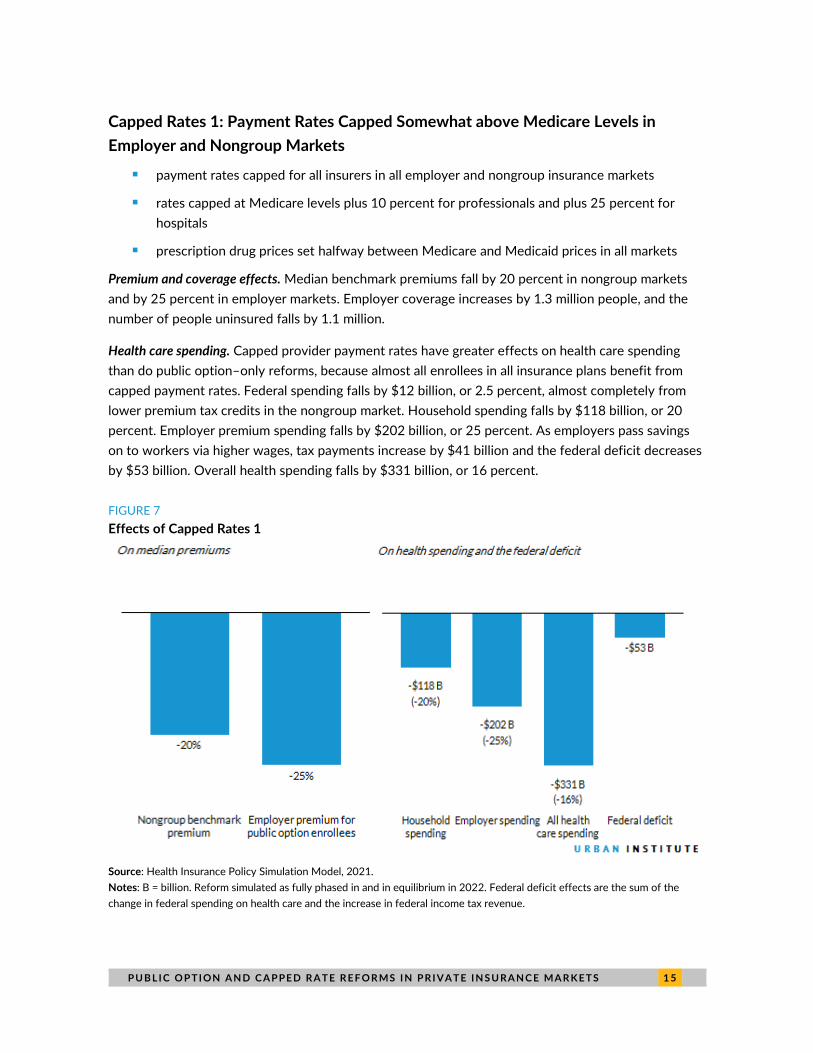
Capped Rates 1: Payment Rates Capped Somewhat above Medicare Levels in
Employer and Nongroup Markets
◼ payment rates capped for all insurers in all employer and nongroup insurance markets
◼ rates capped at Medicare levels plus 10 percent for professionals and plus 25 percent for
hospitals
◼ prescription drug prices set halfway between Medicare and Medicaid prices in all markets
Premium and coverage effects. Median benchmark premiums fall by 20 percent in nongroup markets
and by 25 percent in employer markets. Employer coverage increases by 1.3 million people, and the
number of people uninsured falls by 1.1 million.
Health care spending. Capped provider payment rates have greater effects on health care spending
than do public option–only reforms, because almost all enrollees in all insurance plans benefit from
capped payment rates. Federal spending falls by $12 billion, or 2.5 percent, almost completely from
lower premium tax credits in the nongroup market. Household spending falls by $118 billion, or 20
percent. Employer premium spending falls by $202 billion, or 25 percent. As employers pass savings
on to workers via higher wages, tax payments increase by $41 billion and the federal deficit decreases
by $53 billion. Overall health spending falls by $331 billion, or 16 percent.
FIGURE 7
Effects of Capped Rates 1
Source: Health Insurance Policy Simulation Model, 2021.
Notes: B = billion. Reform simulated as fully phased in and in equilibrium in 2022. Federal deficit effects are the sum of the
change in federal spending on health care and the increase in federal income tax revenue.
1 6 P U B L I C O P T I ON A N D C A P PE D R A T E R E F O R MS I N P R I VA T E I N S U RA N C E MA R K E T S
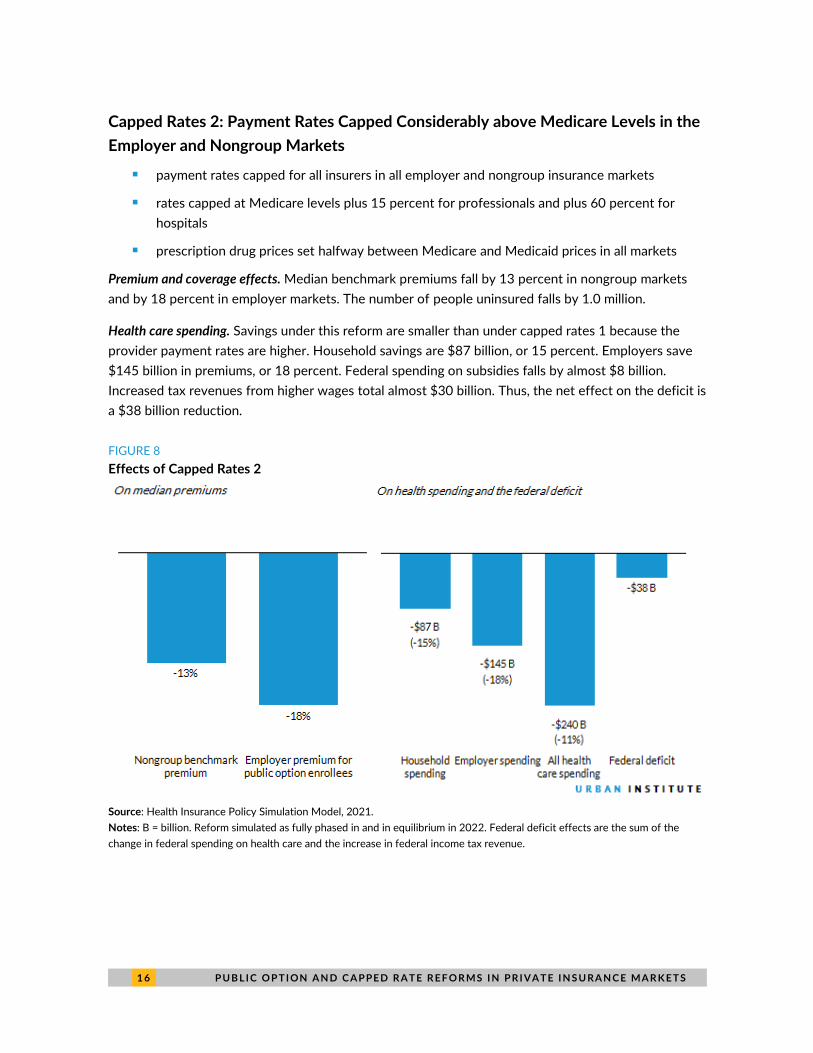
Capped Rates 2: Payment Rates Capped Considerably above Medicare Levels in the
Employer and Nongroup Markets
◼ payment rates capped for all insurers in all employer and nongroup insurance markets
◼ rates capped at Medicare levels plus 15 percent for professionals and plus 60 percent for
hospitals
◼ prescription drug prices set halfway between Medicare and Medicaid prices in all markets
Premium and coverage effects. Median benchmark premiums fall by 13 percent in nongroup markets
and by 18 percent in employer markets. The number of people uninsured falls by 1.0 million.
Health care spending. Savings under this reform are smaller than under capped rates 1 because the
provider payment rates are higher. Household savings are $87 billion, or 15 percent. Employers save
$145 billion in premiums, or 18 percent. Federal spending on subsidies falls by almost $8 billion.
Increased tax revenues from higher wages total almost $30 billion. Thus, the net effect on the deficit is
a $38 billion reduction.
FIGURE 8
Effects of Capped Rates 2
Source: Health Insurance Policy Simulation Model, 2021.
Notes: B = billion. Reform simulated as fully phased in and in equilibrium in 2022. Federal deficit effects are the sum of the
change in federal spending on health care and the increase in federal income tax revenue.
P U B L I C O P T I ON A N D C A P PE D R A T E R E F O R MS I N P R I VA T E I N S U RA N C E MA R K E T S 1 7
Discussion
This analysis shows health reforms that reduce prices insurers pay to hospitals, physicians, and other
professionals to rates similar to those used by the Medicare program and reduce prescription drug
prices below Medicare prices could significantly reduce insurance premiums and government,
employer, and household spending. A public option and capped provider payment rates can also
reduce the number of people uninsured while increasing cash wages and federal income tax revenues.
The magnitude of these reforms’ effects depends on the amount by which provider payment rates
are reduced. For example, reducing payment rates to Medicare levels in the nongroup market would
reduce median benchmark premiums by 28 percent, the number of people uninsured by 127,000, the
federal deficit by $16 billion, and overall health care spending by $24 billion. In contrast, setting
provider payment rates at Medicare levels plus 15 percent for professionals and plus 60 percent for
hospitals reduces median benchmark premiums by 12 percent, the number of people uninsured by
95,000, the federal deficit by $6 billion, and total national health care spending by $9 billion.
Extending the reforms modeled to the employer market as well results in similar differences in
premiums and spending.
We also show extending the public option to both employer and nongroup markets has significant
implications. Median premiums for employers choosing the public option fall by 18 to 25 percent. The
number of people uninsured falls by between 1.0 and 1.1 million, far more than under a policy limited
to the nongroup market but still a small relative increase in the number of people enrolled in
employer-based coverage. Savings to the federal government are considerably higher under reforms
extended to the employer market for two reasons: (1) spending on Marketplace premium tax credits
declines, and (2) federal tax revenues increase as employers switch to the public option and pass the
savings on premiums to their workers via higher wages. Finally, the impact on national health spending
is greater because the scope of the policy is much greater; the health care system would save $67 to
$156 billion under a public option but $240 to $331 billion under capped rates. When implemented in
nongroup markets alone, such reforms result in savings ranging from $9 to $24 billion.
Lastly, we show capping provider payment rates has significantly greater effects than a public
option alone. With the public option, employers can drop their current coverage and enroll workers in
the public option. We assume not all employers would do so: Many smaller, lower-wage firms would
find it attractive to purchase coverage in the public option. Larger, higher-wage firms may be more
likely to prefer providing benefits independently, allowing them to tailor benefit packages, cost
sharing, and provider networks to meet their workers’ needs. Some employers would not find it
prohibitively costly to pay higher premiums for insurance plans using higher provider payment rates.
Capped rates apply to all insurers; thus, most employers would benefit regardless of the insurance plan
in which their workers were enrolled.
Public option–only reforms and capped provider payment rate reforms would have very different
effects on the federal deficit, even if both policies impact both nongroup and employer markets and
set provider payment rates at Medicare levels plus 10 percent for professionals and plus 25 percent
1 8 P U B L I C O P T I ON A N D C A P PE D R A T E R E F O R MS I N P R I VA T E I N S U RA N C E MA R K E T S
for hospitals. Subsidy costs and new tax revenues would reduce the deficit by $28 billion under the
public option and by $53 billion under capped rates. Reductions in national health spending would also
differ markedly, at $156 billion under a public option versus $331 billion under capped rates.
However, options that reduce health care spending the most would also significantly reduce
provider revenues, potentially leading to disruptions in the health care delivery system, at least in the
near term. This partially depends on how fast payment rates are reduced. Policies that provide the
greatest savings to the federal government and health care system overall may be the least politically
feasible. Provider payment rates could be lower if public option policies were limited to the nongroup
market. But if such reforms are extended further to the employer market, provider payment rates
would likely have to be set higher. Future research should explore where the caps could be set and
how to govern their growth over time without significantly disrupting the health care system.
Methods
Our analysis relies on the Urban Institute Health Policy Center’s Health Insurance Policy Simulation
Model, a detailed microsimulation model of the health care system designed to estimate the cost and
coverage effects of a broad array of proposed health care policy reforms for the nonelderly (US
residents below age 65 not enrolled in Medicare). We regularly update the model to reflect published
Medicaid and Marketplace enrollment and costs in each state. For example, the current version
accounts for each state’s Marketplace premiums and enrollment after the 2020 open enrollment
period. Enrollment in each state under current law affects how the model simulates policy alternatives.
We begin each simulation with a current-law baseline in 2022 that includes the estimated effects
of, and a partial recovery from, the COVID-19 recession. For this analysis, we assume the Medicaid
enhanced federal medical assistance percentage and maintenance-of-effort provisions in the Families
First Coronavirus Response Act would have expired before 2022. However, in a letter to governors
sent in late January 2021, the acting secretary of the US Department of Health and Human Services
indicated the department planned to extend its public health emergency declaration through calendar
year 2021.5 This means the maintenance-of-effort requirement, which prohibits states from
disenrolling Medicaid enrollees unless they request it, will last through January 2022, and the
enhanced federal medical assistance percentage will be available through March 2022. Consequently,
Medicaid enrollment will be notably higher in early 2022 than indicated in our estimates, but it will
decline to the levels we show later in the year. Also, the federal government will pay a higher share of
Medicaid costs in the first quarter of 2022 than we indicate.
We then estimate the effects of implementing each of the seven public option or capped rate
reforms. Each reform affects professional and hospital payment rates and prescription drug prices in
all regions. The different simulations vary by the assumed provider payment rates (all expressed
relative to Medicare’s payment rates) and the insurance markets (nongroup, employers) in which the
public option and/or capped provider payment rates are available. All estimates assume reforms are
fully phased in and in equilibrium in 2022.

P U B L I C O P T I ON A N D C A P PE D R A T E R E F O R MS I N P R I VA T E I N S U RA N C E MA R K E T S 1 9
Because Medicare does not provide benefits to nondisabled, nonelderly people, we estimate
possible Medicare payment rates for those people. We assume Medicare rates for people with
nongroup insurance would equal what payment rates would be if the region had a highly competitive
insurance market and reasonably competitive hospital market, and these rates vary significantly by
rating region. We then set payments by provider type (hospitals or professionals, including physicians
and other providers) relative to Medicare rates, according to the assumption for each reform and the
share of spending for each service type within the region.
Our approach differs for people with employer-sponsored insurance. We obtained estimates of
the ratio of commercial insurer payment rates to Medicare rates from FAIR Health for specific
procedures by region and provider type. We then used those ratios to estimate costs for people with
employer-based insurance entering the public option or having provider payments capped. For all
public option or capped payment rate reforms, prices for prescription drugs in all areas are set halfway
between those paid by Medicare and Medicaid after rebates.
Savings in the nongroup market apply to all enrollees under either a public option or capped
provider payment rates. The model implicitly assumes all enrollees are affected by the public option
because we assume the Marketplace benchmark premium would decrease by the percent difference
between the public option and baseline premiums. For people with employer-sponsored insurance,
only those in firms opting in to the public option see savings. We assume firms that are small, pay
lower average wages, and expect significant savings are more likely to choose the public option than
large firms, those paying higher wages, and those expecting small savings from the switch. Capped
rates 1 and 2 limit all provider payments in all areas, reducing payments for everyone with employer-
sponsored coverage. We discuss additional methodological issues in our earlier report (Blumberg et al.
2020).
Limitations
Uncertainty surrounds our estimates of the impacts of a public option or capping provider payment
rates for several reasons: a lack of data on commercial payment rates in the nongroup market, the
relevance of claims data to estimate the ratio of commercial payment rates to Medicare rates in the
employer market, the need to estimate households’ and firms’ decisions to participate in the public
option, and the need to make assumptions about the savings from regulating prescription drug prices.
For each factor, different data can be used and assumptions made. Thus, our results may differ from
actual results or those projected in other analyses.
◼ For the nongroup reform estimates, we lack actual payment rate data. We estimate Medicare
payment rates using regression analyses. We assume markets with a large number of insurers
and low hospital concentration have payment rates that approximate Medicare prices and
thus premiums. Markets without these characteristics tend to have higher premiums. We
estimate high premiums in markets with high insurer and hospital concentration will decrease
to the levels seen in more competitive markets. But, the high premiums we observe in
noncompetitive regions could owe to factors other than higher provider payment rates.
2 0 P U B L I C O P T I ON A N D C A P PE D R A T E R E F O R MS I N P R I VA T E I N S U RA N C E MA R K E T S
◼ We assume the public option is the benchmark plan. We cannot estimate how many people
choose plans that have higher premiums than the benchmark. To the extent individuals enroll
in more expensive plans, we may underestimate household spending in nongroup reform
estimates.
◼ We use data from FAIR Health, which collects data from a large number of firms. However,
the data do not contain all private plans in a state or substate area. Thus, the contributing
insurers may not be entirely representative, despite their very large amount of data. Further,
though the data include plans covering 75 percent of the privately insured population in the
United States, they include some Medicare Advantage plans and plans participating in the
nongroup market.
◼ FAIR Health provided us with data on payments for professional and outpatient facilities
representing 47 percent of total professional spending and 42 percent of total outpatient
facility spending. However, the services may not fully represent the average ratio of
commercial insurer payment rates to Medicare rates. More importantly, FAIR Health does not
release substate data on commercial payment rates for inpatient hospital services; our
estimates include all inpatient services provided in the state, but lacking this information could
lead to some error at the substate level.
◼ We have made assumptions about employer take-up of the public option by firm size, wages,
and expected savings. Take-up of the public option is assumed to be higher for small, low-
wage firms, and we assume a firm chooses the public option only when the resulting savings
exceed 20 percent. Our assumptions are somewhat arbitrary, and different assumptions
would have different results. Our capped rate simulations estimate the extreme case of all
employers choosing the public option.
◼ Employers may gravitate to the public option over time. Our analysis assumes the policy is
fully phased in and in equilibrium and therefore accounts for all long-term employer behavior.
◼ In our estimates of prescription drug savings, we assume drug pricing rebates from various
private payers are the same across the country. If the mix of drugs consumed varies
geographically, our rebates may be estimated with error. Medicare’s pharmacy benefit
manufacturers differ by geography, with some getting better rebates from manufacturers than
others. Thus, Medicare rebates could differ across states, but we do not account for this.
◼ We estimate rebates for the public option would lead to prescription drug prices halfway
between Medicaid and Medicare prices, or 30 percent below commercial insurance prices.
These prices seem reasonable because they are less than those currently achieved in Medicaid
and considerably less than in other western nations. We may also have underestimated the
savings a public option could achieve. However, it has been politically difficult in the US to
achieve lower drug prices, so we are cautious in our estimates. Any differences or errors in our
savings estimates would be tempered by the fact that prescription drug spending accounts for
only 23 percent of the premium dollar nationwide.
P U B L I C O P T I ON A N D C A P PE D R A T E R E F O R MS I N P R I VA T E I N S U RA N C E MA R K E T S 2 1
Supplementary Tables
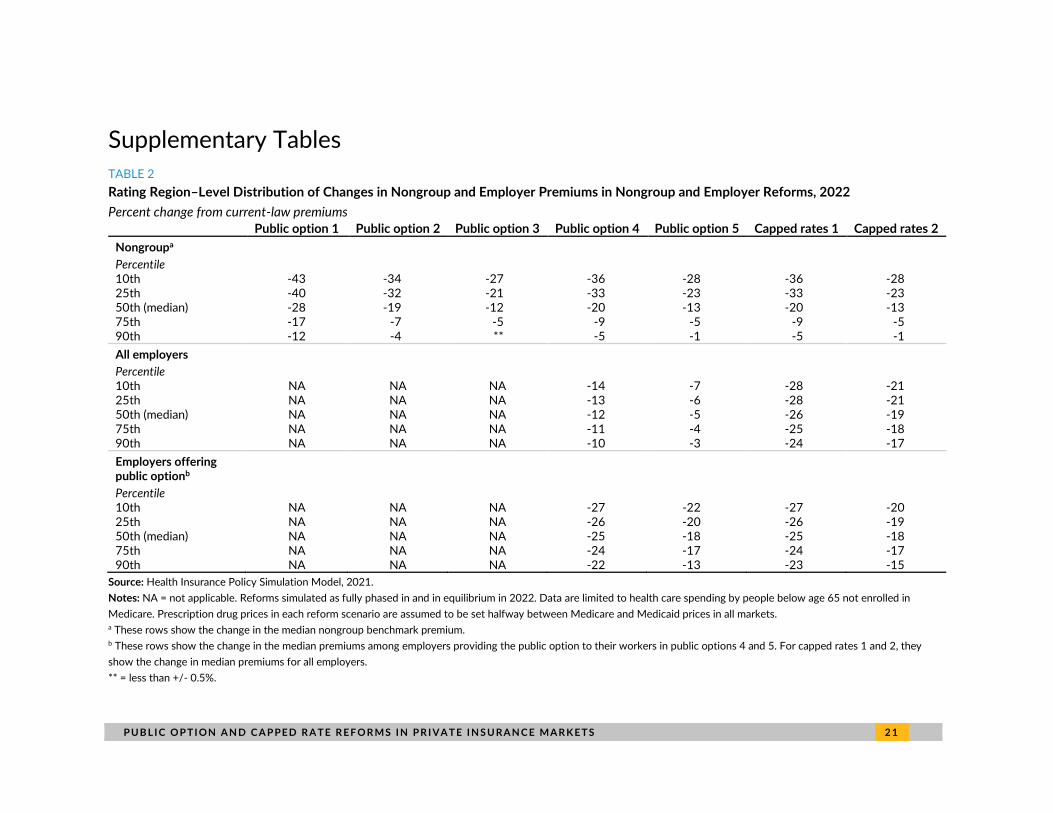
TABLE 2
Rating Region–Level Distribution of Changes in Nongroup and Employer Premiums in Nongroup and Employer Reforms, 2022
Percent change from current-law premiums
Public option 1 Public option 2 Public option 3 Public option 4 Public option 5 Capped rates 1 Capped rates 2
Nongroupa
Percentile 10th -43 -34 -27 -36 -28 -36 -28 25th -40 -32 -21 -33 -23 -33 -23 50th (median) -28 -19 -12 -20 -13 -20 -13 75th -17 -7 -5 -9 -5 -9 -5 90th -12 -4 ** -5 -1 -5 -1
All employers Percentile 10th NA NA NA -14 -7 -28 -21 25th NA NA NA -13 -6 -28 -21 50th (median) NA NA NA -12 -5 -26 -19 75th NA NA NA -11 -4 -25 -18 90th NA NA NA -10 -3 -24 -17
Employers offering public optionb Percentile 10th NA NA NA -27 -22 -27 -20 25th NA NA NA -26 -20 -26 -19 50th (median) NA NA NA -25 -18 -25 -18 75th NA NA NA -24 -17 -24 -17 90th NA NA NA -22 -13 -23 -15
Source: Health Insurance Policy Simulation Model, 2021.
Notes: NA = not applicable. Reforms simulated as fully phased in and in equilibrium in 2022. Data are limited to health care spending by people below age 65 not enrolled in
Medicare. Prescription drug prices in each reform scenario are assumed to be set halfway between Medicare and Medicaid prices in all markets. a These rows show the change in the median nongroup benchmark premium. b These rows show the change in the median premiums among employers providing the public option to their workers in public options 4 and 5. For capped rates 1 and 2, they
show the change in median premiums for all employers.
** = less than +/- 0.5%.
2 2 P U B L I C O P T I ON A N D C A P PE D R A T E R E F O R MS I N P R I VA T E I N S U RA N C E MA R K E T S
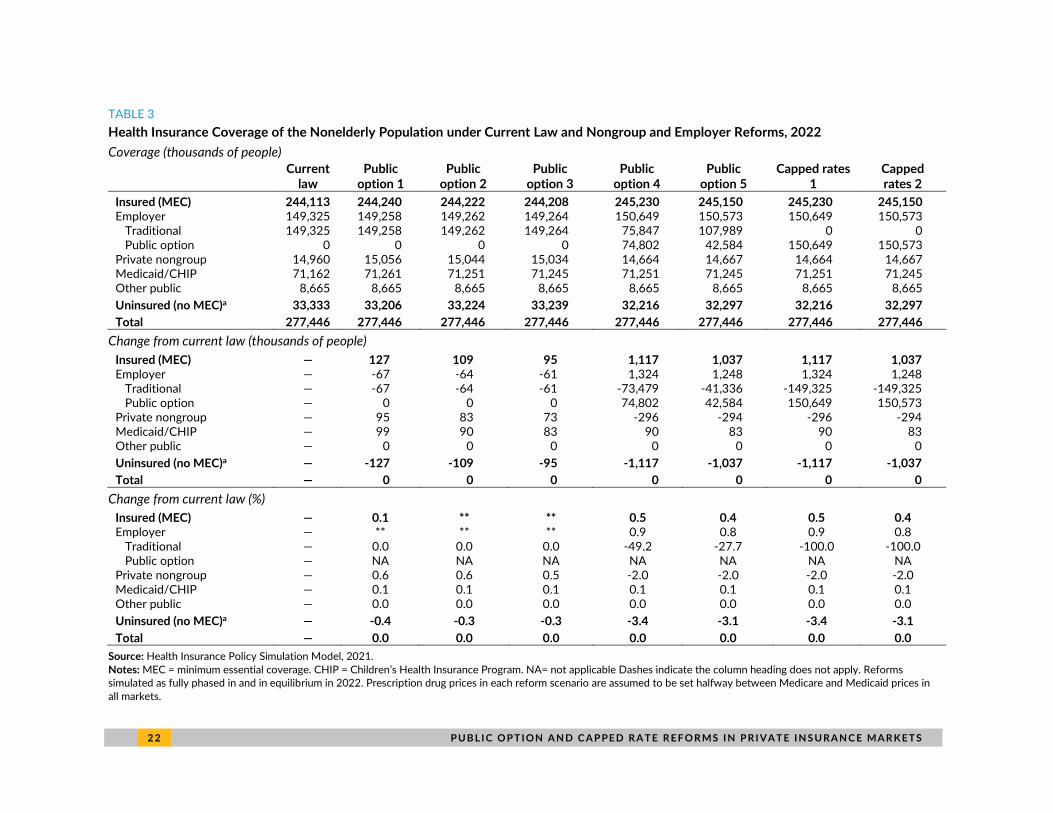
TABLE 3
Health Insurance Coverage of the Nonelderly Population under Current Law and Nongroup and Employer Reforms, 2022
Coverage (thousands of people)
Current law
Public option 1
Public option 2
Public option 3
Public option 4
Public option 5
Capped rates 1
Capped rates 2
Insured (MEC) 244,113 244,240 244,222 244,208 245,230 245,150 245,230 245,150 Employer 149,325 149,258 149,262 149,264 150,649 150,573 150,649 150,573
Traditional 149,325 149,258 149,262 149,264 75,847 107,989 0 0 Public option 0 0 0 0 74,802 42,584 150,649 150,573
Private nongroup 14,960 15,056 15,044 15,034 14,664 14,667 14,664 14,667 Medicaid/CHIP 71,162 71,261 71,251 71,245 71,251 71,245 71,251 71,245 Other public 8,665 8,665 8,665 8,665 8,665 8,665 8,665 8,665
Uninsured (no MEC)a 33,333 33,206 33,224 33,239 32,216 32,297 32,216 32,297
Total 277,446 277,446 277,446 277,446 277,446 277,446 277,446 277,446
Change from current law (thousands of people)
Insured (MEC) — 127 109 95 1,117 1,037 1,117 1,037 Employer — -67 -64 -61 1,324 1,248 1,324 1,248
Traditional — -67 -64 -61 -73,479 -41,336 -149,325 -149,325 Public option — 0 0 0 74,802 42,584 150,649 150,573
Private nongroup — 95 83 73 -296 -294 -296 -294 Medicaid/CHIP — 99 90 83 90 83 90 83 Other public — 0 0 0 0 0 0 0
Uninsured (no MEC)a — -127 -109 -95 -1,117 -1,037 -1,117 -1,037
Total — 0 0 0 0 0 0 0
Change from current law (%)
Insured (MEC) — 0.1 ** ** 0.5 0.4 0.5 0.4 Employer — ** ** ** 0.9 0.8 0.9 0.8
Traditional — 0.0 0.0 0.0 -49.2 -27.7 -100.0 -100.0 Public option — NA NA NA NA NA NA NA
Private nongroup — 0.6 0.6 0.5 -2.0 -2.0 -2.0 -2.0 Medicaid/CHIP — 0.1 0.1 0.1 0.1 0.1 0.1 0.1 Other public — 0.0 0.0 0.0 0.0 0.0 0.0 0.0
Uninsured (no MEC)a — -0.4 -0.3 -0.3 -3.4 -3.1 -3.4 -3.1
Total — 0.0 0.0 0.0 0.0 0.0 0.0 0.0
Source: Health Insurance Policy Simulation Model, 2021.
Notes: MEC = minimum essential coverage. CHIP = Children’s Health Insurance Program. NA= not applicable Dashes indicate the column heading does not apply. Reforms simulated as fully phased in and in equilibrium in 2022. Prescription drug prices in each reform scenario are assumed to be set halfway between Medicare and Medicaid prices in
all markets.
P U B L I C O P T I ON A N D C A P PE D R A T E R E F O R MS I N P R I VA T E I N S U RA N C E MA R K E T S 2 3
a Includes those without insurance and those with short-term, limited-duration plans. ** = less than +/- 0.05%.
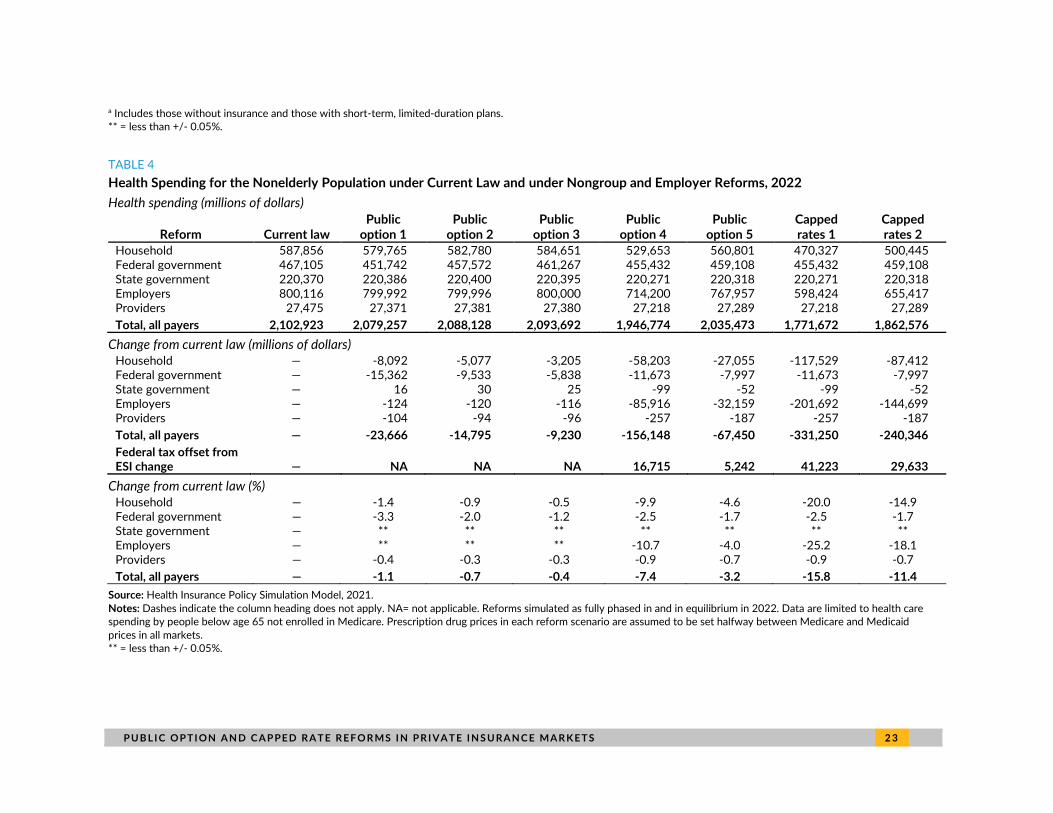
TABLE 4
Health Spending for the Nonelderly Population under Current Law and under Nongroup and Employer Reforms, 2022
Health spending (millions of dollars)
Reform Current law Public
option 1 Public
option 2 Public
option 3 Public
option 4 Public
option 5 Capped rates 1
Capped rates 2
Household 587,856 579,765 582,780 584,651 529,653 560,801 470,327 500,445 Federal government 467,105 451,742 457,572 461,267 455,432 459,108 455,432 459,108 State government 220,370 220,386 220,400 220,395 220,271 220,318 220,271 220,318 Employers 800,116 799,992 799,996 800,000 714,200 767,957 598,424 655,417 Providers 27,475 27,371 27,381 27,380 27,218 27,289 27,218 27,289
Total, all payers 2,102,923 2,079,257 2,088,128 2,093,692 1,946,774 2,035,473 1,771,672 1,862,576
Change from current law (millions of dollars) Household — -8,092 -5,077 -3,205 -58,203 -27,055 -117,529 -87,412 Federal government — -15,362 -9,533 -5,838 -11,673 -7,997 -11,673 -7,997 State government — 16 30 25 -99 -52 -99 -52 Employers — -124 -120 -116 -85,916 -32,159 -201,692 -144,699 Providers — -104 -94 -96 -257 -187 -257 -187
Total, all payers — -23,666 -14,795 -9,230 -156,148 -67,450 -331,250 -240,346
Federal tax offset from ESI change — NA NA NA 16,715 5,242 41,223 29,633
Change from current law (%) Household — -1.4 -0.9 -0.5 -9.9 -4.6 -20.0 -14.9 Federal government — -3.3 -2.0 -1.2 -2.5 -1.7 -2.5 -1.7 State government — ** ** ** ** ** ** ** Employers — ** ** ** -10.7 -4.0 -25.2 -18.1 Providers — -0.4 -0.3 -0.3 -0.9 -0.7 -0.9 -0.7
Total, all payers — -1.1 -0.7 -0.4 -7.4 -3.2 -15.8 -11.4
Source: Health Insurance Policy Simulation Model, 2021.
Notes: Dashes indicate the column heading does not apply. NA= not applicable. Reforms simulated as fully phased in and in equilibrium in 2022. Data are limited to health care spending by people below age 65 not enrolled in Medicare. Prescription drug prices in each reform scenario are assumed to be set halfway between Medicare and Medicaid
prices in all markets.
** = less than +/- 0.05%.
2 4 P U B L I C O P T I ON A N D C A P PE D R A T E R E F O R MS I N P R I VA T E I N S U RA N C E MA R K E T S
Notes 1 Choose Medicare Act, S. 1261, 116th Cong. (2019).
2 See, for example, see Blumberg and colleagues (2019).
3 Under current law, Marketplace premium tax credits are tied to the benchmark plan premium in each geographic premium rating area. Subsidized enrollees can enroll in the benchmark plan without paying more than the applicable percentage-of-income cap. Subsidized enrollees choosing higher-premium options must pay the difference between the benchmark premium and their chosen plan’s premium; those choosing a plan with a lower premium pay less than their percentage-of-income cap.
4 For estimates of the effects of reforms that include enhanced nongroup market subsidies combined with a public option, see Blumberg and colleagues (2019).
5 Norris Cochran (acting secretary, US Department of Health and Human Services), letter to governors regarding extension of COVID-19 public health emergency, January 22, 2021, https://ccf.georgetown.edu/wp-content/uploads/2021/01/Public-Health-Emergency-Message-to-Governors.pdf.
References Blumberg, Linda J., John Holahan, Matthew Buettgens, Anuj Gangopadhyaya, Bowen Garrett, Adele Shartzer,
Michael Simpson, Robin Wang, Melissa M. Favreault, and Diane Arnos. 2019. From Incremental to Comprehensive Health Reform: How Various Reform Options Compare on Coverage and Costs. Washington, DC: Urban Institute.
Blumberg, Linda. J., John Holahan, Matthew Buettgens, and Stephen Zuckerman. 2019. “The Healthy America Program, an Update and Additional Options.” Washington, DC: Urban Institute.
Blumberg, Linda J., John Holahan, Stacey McMorrow, and Michael Simpson. 2020. Estimates of the Implications of Public Option and Capped Provider Payment Rate Reforms. Washington, DC: Urban Institute.
Blumberg, Linda J. Michael Simpson, and Matthew Buettgens. 2019. “A Targeted Affordability Improvement Proposal: The Potential Effects of Two Nongroup Insurance Reforms Designed to Increase Affordability and Reduce Costs.” Washington, DC: Urban Institute.
Buettgens, Matthew, and Jessica Banthin. 2020. The Health Insurance Policy Simulation Model for 2020. Washington, DC: Urban Institute.
Holahan, John, and Michael Simpson. 2021a. “Introducing a Public Option or Capped Provider Payment Rates into Concentrated Insurer and Hospital Markets.” Washington, DC: Urban Institute.
———. 2021b. “Public Option and Capped Provider Payment Rate Proposals That Exempt Rural Areas.” Washington, DC: Urban Institute.
Hwang, Thomas, and Aaron Kesselheim. 2020. Reducing Prescription Drug Costs: Policy Options for Public Plans. PORTAL report for the Urban Institute. Washington, DC: Urban Institute.
P U B L I C O P T I ON A N D C A P PE D R A T E R E F O R MS I N P R I VA T E I N S U RA N C E MA R K E T S 2 5
About the Authors
John Holahan is an Institute fellow in the Health Policy Center at the Urban Institute, where he
previously served as center director for over 30 years. His recent work focuses on health reform, the
uninsured, and health expenditure growth, developing proposals for health system reform most
recently in Massachusetts. He examines the coverage, costs, and economic impact of the Affordable
Care Act (ACA), including the costs of Medicaid expansion as well as the macroeconomic effects of the
law. He has also analyzed the health status of Medicaid and exchange enrollees, and the implications
for costs and exchange premiums. Holahan has written on competition in insurer and provider markets
and implications for premiums and government subsidy costs as well as on the cost-containment
provisions of the ACA. Holahan has conducted significant work on Medicaid and Medicare reform,
including analyses on the recent growth in Medicaid expenditures, implications of block grants and
swap proposals on states and the federal government, and the effect of state decisions to expand
Medicaid in the ACA on federal and state spending. Recent work on Medicare includes a paper on
reforms that could both reduce budgetary impacts and improve the structure of the program. His work
on the uninsured explores reasons for the growth in the uninsured over time and the effects of
proposals to expand health insurance coverage on the number of uninsured and the cost to federal
and state governments.
Michael Simpson is a principal research associate in the Health Policy Center with 25 years of
experience developing economic models and using survey and administrative data. His current work
focuses on using Urban’s Health Insurance Policy Simulation Model to project health insurance
coverage and spending both in the baseline and under policy alternatives. Before joining Urban,
Simpson developed the Congressional Budget Office’s long-term dynamic microsimulation model. He
analyzed numerous policy reform proposals, investigated differences between various projections of
Social Security finances and benefits, quantified the importance of Monte Carlo variation in model
results, and created multiple methods to demonstrate uncertainty in projections.

2 6 P U B L I C O P T I ON A N D C A P PE D R A T E R E F O R MS I N P R I VA T E I N S U RA N C E MA R K E T S
Acknowledgments
This brief was funded by Arnold Ventures. We are grateful to them and to all our funders, who make it
possible for Urban to advance its mission.
The views expressed are those of the authors and should not be attributed to the Urban Institute,
its trustees, or its funders. Funders do not determine research findings or the insights and
recommendations of Urban experts. Further information on the Urban Institute’s funding principles is
available at urban.org/fundingprinciples.
The authors are grateful for comments and suggestions from Linda J. Blumberg and for editorial
assistance from Rachel Kenney.
ABOUT THE URBAN INSTITUTE The nonprofit Urban Institute is a leading research organization dedicated to developing evidence-based insights that improve people’s lives and strengthen communities. For 50 years, Urban has been the trusted source for rigorous analysis of complex social and economic issues; strategic advice to policymakers, philanthropists, and practitioners; and new, promising ideas that expand opportunities for all. Our work inspires effective decisions that advance fairness and enhance the well-being of people and places.
Copyright © March 2021. Urban Institute. Permission is granted for reproduction of this file, with attribution to the Urban Institute.
500 L’Enfant Plaza SW Washington, DC 20024
www.urban.org