intrinsic foot joints adapt a stabilized-resistive
TRANSCRIPT

RESEARCH Open Access
Intrinsic foot joints adapt a stabilized-resistive configuration during the stancephasePaul-André Deleu1,2* , Laurence Chèze1, Raphaël Dumas1, Jean-Luc Besse3, Thibaut Leemrijse2,Bernhard Devos Bevernage2, Ivan Birch4 and Alexandre Naaim1
Abstract
Background: This study evaluated the 3D angle between the joint moment and the joint angular velocity vectorsat the intrinsic foot joints, and investigated if these joints are predominantly driven or stabilized during gait.
Methods: The participants were 20 asymptomatic subjects. A four-segment kinetic foot model was used tocalculate and estimate intrinsic foot joint moments, powers and angular velocities during gait. 3D angles betweenthe joint moment and the joint angular velocity vectors were calculated for the intrinsic foot joints defined asfollows: ankle joint motion described between the foot and the shank for the one-segment foot model (hereafterreferred as Ankle), and between the calcaneus and the shank for the multi-segment foot model (hereafter referredas Shank-Calcaneus); joint motion described between calcaneus and midfoot segments (hereafter referred asChopart joint); joint motion described between midfoot and metatarsus segments (hereafter referred as Lisfrancjoint); joint motion described between first phalanx and first metatarsal (hereafter referred as First Metatarso-Phalangeal joint). When the vectors were approximately aligned, the moment was considered to result inpropulsion (3D angle <60o) or resistance (3D angle >120o) at the joint. When the vectors are approximatelyorthogonal (3D angle close to 90°), the moment was considered to stabilize the joint.
Results: The results showed that the four intrinsic joints of the foot are never fully propelling, resisting or beingstabilized, but are instead subject to a combination of stabilization with propulsion or resistance during the majorityof the stance phase of gait. However, the results also show that during pre-swing all four the joints are subject tomoments that result purely in propulsion. At heel off, the propulsive configuration appears for the Lisfranc joint firstat terminal stance, then for the other foot joints at pre-swing in the following order: Ankle, Chopart joint and FirstMetatarso-Phalangeal joint.
Conclusions: Intrinsic foot joints adopt a stabilized-resistive configuration during the majority of the stance phase,with the exception of pre-swing during which all joints were found to adopt a propulsive configuration. The notionof stabilization, resistance and propulsion should be further investigated in subjects with foot and ankle disorders.
Keywords: Foot kinetics, Multi-segment foot, Inverse dynamics, Walking
© The Author(s). 2020 Open Access This article is licensed under a Creative Commons Attribution 4.0 International License,which permits use, sharing, adaptation, distribution and reproduction in any medium or format, as long as you giveappropriate credit to the original author(s) and the source, provide a link to the Creative Commons licence, and indicate ifchanges were made. The images or other third party material in this article are included in the article's Creative Commonslicence, unless indicated otherwise in a credit line to the material. If material is not included in the article's Creative Commonslicence and your intended use is not permitted by statutory regulation or exceeds the permitted use, you will need to obtainpermission directly from the copyright holder. To view a copy of this licence, visit http://creativecommons.org/licenses/by/4.0/.The Creative Commons Public Domain Dedication waiver (http://creativecommons.org/publicdomain/zero/1.0/) applies to thedata made available in this article, unless otherwise stated in a credit line to the data.
* Correspondence: [email protected] Lyon, Université Claude Bernard Lyon 1, Univ Gustave Eiffel, IFSTTAR,LBMC UMR_T9406, F69622 Lyon, France2Foot & Ankle Institute, Brussels, BelgiumFull list of author information is available at the end of the article
Deleu et al. Journal of Foot and Ankle Research (2020) 13:13 https://doi.org/10.1186/s13047-020-0381-7

BackgroundAdequate measurement of the intrinsic movement of thefoot and ankle complex during walking has been im-peded for decades by the simplified representation offoot as a single functional segment [1]. The developmentof three-dimensional (3D) multi-segment foot modelspartially tackled this major shortcoming of the estab-lished 3D lower limb models and showed their clinicalvalue through the detection of intrinsic foot mobility im-pairments [1]. During the last decade, foot and anklebiomechanics were essentially described through thekinematics of the gait cycle as determined from cadaver,invasive bone pins, biplanar videoradiography and non-invasive surface marker studies, and plantar pressuremeasurements [2–8]. Recently, multi-segment kineticfoot models have received increasing attention in meth-odological and clinical studies providing new insightsinto how the intrinsic joints of the foot can have individ-ual power distributions [9–12]. While kinematic multi-segment foot models can demonstrate the motion of thevarious intrinsic joints of the foot, establishing the kinet-ics of these joints represent a new series of challenges:definition of inter-segment joint centers, estimation ofsegmental shear forces and definition of segment inertialproperties [11]. Despite these technical and methodo-logical challenges, joint moments and powers have beenable to provide new insights into the dynamic contribu-tion of the Chopart and Lisfranc joints during gait, andnew mechanisms of foot dysfunction in specific foot andankle pathologies [11, 13, 14]. The Chopart joint hasbeen described as the inter-segmental joint between thecalcaneus and the midfoot segments whereas the Lis-franc joint was defined as the inter-segmental joint be-tween the midfoot and the forefoot segments [4].Based on the literature, kinetic analysis of intrinsic foot
joints seems to be a valuable way for uncovering the roleof foot and ankle during locomotion. However, the clinicalinterpretation of joint power remains an area of debateand not without controversies in the field of biomechan-ics. Although subject to challenge, joint power has beenreported separately for the frontal, sagittal and transverseplanes, which has revealed inconsistent results at the ankle[15–17]. The scientific community has also associatedjoint power with muscle action and energy transfer whichhas been widely criticized in the literature [18–20]. Thedifficulty is largely in the attribution of energy transfer(e.g. storage in elastic structures, muscle action) and in theallocation of forces to the agonist-antagonist and multi-joint muscles [10, 20]. The nature of the foot and anklefurther increases the complexity of interpretation by thefact that, compared to the other major joints of the lowerlimb, intrinsic foot joints share common ligament andmuscle tendon structures. Further analysis integrating in-vivo medical imaging [21] with musculo-skeletal models
[22] or biplanar videoradiography [6] would be requiredto shed light on the contribution of each of the anatomicalstructures to foot and ankle function. It is therefore pro-posed that the joint power be supplemented by an angle(αMω) which encapsulates a 3D angular relationship be-tween the joint moment (M) and the joint angular velocity(ω) vectors, in an attempt to translate kinetic data into a“simple” functional relationship expressed in an accessibleformat applicable to the lower limb joints (ankle, knee,hip) [20]. When the 3D vectors M and ω are aligned (0° or180°), the moment results in propulsion or resistance.When the 3D vectors M and ω are orthogonal (90°), themoment stabilizes the joint [20]. The 3D angle αMω be-tween the joint moment (M) and the joint angular velocity(ω) revealed that the ankle joint generally adopts a resist-ive configuration (at midstance) followed by a propulsiveconfiguration (at pre-swing) in healthy adults.Based on current knowledge on the estimation of foot
joint kinetics, this study proposes to expand the calcula-tion of αMω to a four-segment kinetic foot model. Ourhypothesis is that intrinsic foot joints are only partiallypropelling, resisting or stabilized due to the complexcontributions of intrinsic and extrinsic foot muscles, lig-aments and multiple joint surfaces. Therefore, the ob-jective of this study was to analyse αMω at the Chopart,Lisfranc and First Metatarso-Phalangeal joints duringthe stance phase of gait and to investigate if these jointsare predominantly propelling, resisting or stabilized. Inaddition, the percentage of propulsive/resistive moment(P/R %) contributing to drive each foot joint was alsocalculated. Angle αMω and P/R% were computed at theankle joint with the foot considered to be a multi-segment system and a single segment for comparison.
MethodsSubjectsTwenty asymptomatic adult subjects participated in thestudy (male/female ratio 14/6; age (mean ± SD): 45.35 ±11.97 years; height (mean ± SD), 1.75 ± 0.08m; weight(mean ± SD): 75.5 ± 9.13 kg; BMI (mean ± SD): 24.62 ±2.50 kg/m2; walking speed (mean ± SD): 1.39 ± 0.15 m/s).Participants were included if 1) they were able to walkbarefooted independently, without support, 2) they hadno history of orthopaedic, neurological or musculoskel-etal problems affecting their gait. All participants werevolunteers and signed the informed consent approved bythe local ethical committee (B200–2017-061).
ProtocolThe simultaneous assessment of kinematics, kinetics,and plantar pressure measurements of each subject wasachieved through the use of an advanced clinical exam-ination platform combining a motion capture system, aforce plate and a plantar pressure plate. The motion
Deleu et al. Journal of Foot and Ankle Research (2020) 13:13 Page 2 of 12
capture system consisted of 8 Miqus cameras (Qualysis,Göteborg Sweden) to capture the kinematic data (200Hz) of the participant while walking over a 10 m walk-way at a self-selected speed [23]. In the middle of thewalkway, a Footscan® pressure plate (dimensions 0.5 m ×0.4 m, 4096 sensors, 2.8 sensors per cm2, RSscan Inter-national, Paal, Belgium) was mounted upon a custommade AMTI-force plate (dimensions 0.5 × 0.4 m, Ad-vanced Mechanical Technology, Inc., Watertown, MA,US). The force plate was custom-made to fit the surfacedimensions of the plantar pressure plate. This set-upallowed for the detection of specific gait events as wellas for a continuous calibration of the pressure plate withthe force plate using a Footscan® 3D interface box(RSscan International, Paal, Belgium). Data from thepressure and force plates were measured at a samplingrate of 200 Hz. The integration and synchronization ofthe three different hardware devices was achievedthrough the use of a Miqus Sync unit interface (Qualysis,Göteborg Sweden).Thirty-two 8mm retro-reflective markers were always
mounted for each subject by the same clinician over ana-tomical landmarks according to the Instituto OrthopedicoRizzoli 3D multi-segment foot model (RFM) [4]. The skinmarkers were mounted using double-sided adhesive tape.After marker placement, the participants were asked towalk barefoot, at a self-selected speed until five valid trialswere recorded. A trial was considered valid when the fol-lowing criteria were met: 1) walking speed had to remainrelatively constant across all trials of a recording session,2) no visual gait adjustment was made by the subject dur-ing a trial to aim at the pressure plate and 3) a clear con-tact of the entire foot of interest within the boundaries ofthe sensor matrix of the pressure plate [24]. All markertrajectories were computed by Qualysis Tracking Manager2.16 (Qualysis, Göteborg Sweden).
Data analysisInter-segment 3D rotations were calculated accordingto an adapted version of Instituto Orthopedico Rizzoli3D multi-segment foot model developed by Deschampset al. (2017) (IOR-4Segment-model 1) following ISB rec-ommendations, where dorsiflexion/plantarflexion (sagittalplane) is defined as rotation about the medio-lateral axisof the proximal segment, adduction/abduction (transversalplane) about the vertical axis of the distal segment and in-version/eversion (frontal plane) about an axis orthogonalto the first two axes (Fig. 1) [4, 25].Joint forces (F) and moments (M) were computed in
the Inertial Coordinate System by a bottom-up inversedynamic method using a Newton-Euler recursive algo-rithm based on a homogeneous matrix formalism duringthe stance phase of gait [26]. Kinematic and force datawere filtered using a low-pass zero-lag, 4th order,
Butterworth filter, with a cut-off frequency of 10 Hz. In-ertia and weight parameters of each foot segment werediscounted as the inertia effects were negligible duringgait compared to the external forces. The force platedata were distributed over each foot segment using theproportionality scheme described by Morlock & Nigg(1991) and validated by Saraswat et al. (2014) based onthe distribution of the vertical ground reaction forces asmeasured by each sensor of the plantar pressure plat-form (i.e. if 15% of the total vertical force acted on theforefoot, it was assumed that 15% of the total horizontalforce and vertical moment also acted on the forefoot)[13, 27]. The estimation of the subarea of each foot seg-ment was achieved for each time frame by projecting theposition of the retro-reflective markers vertically on thesensor matrix of the plantar pressure platform. Theresulting center of pressure (CoP) of each estimated sub-area was then used as the CoP for each foot segment inthe inverse dynamics calculations. The joint momentswere expressed in the proximal segment coordinatesystem.For the computation of foot kinematics and kinetics, a
virtual cuboid marker was created and defined as beingat 2/3 of the distal distance between the peroneal tuber-cle and the base of the fifth metatarsal (Fig. 1). Inter-segment center definitions of the four segment footmodel were based on Deschamps et al. (2017). For bothkinematic and kinetic foot models, the ankle joint centerwas defined as the midpoint between the malleolimarkers. Ankle joint motion was described between thefoot and the shank for the one-segment foot model(hereafter referred as Ankle), and between the calcaneusand the shank for the multi-segment foot model (here-after referred as Shank-Calcaneus) (Figure 1). Calcaneus-Midfoot (hereafter referred as Chopart joint) center wasdetermined as being the midpoint between the cuboidand the navicular bone. Midfoot-Metatarsus (hereafterreferred as Lisfranc joint) center was determined as be-ing on the base of the second metatarsal. FirstMetatarso-Phalangeal joint center was the projection offirst metatarsal head marker vertically at mid distance tothe ground [11].Joint power encapsulates the angular relationship be-
tween the M and the ω vectors and was computed ac-cording to the following equation:
P¼ Mk k� ωk k� cosαMω
In supplement to the joint power, the αMω anglebetween the joint moment (M) and the joint angularvelocity (ω) vectors was calculated as described by Du-mas and Chèze (2008) following the present equation:
Deleu et al. Journal of Foot and Ankle Research (2020) 13:13 Page 3 of 12

αMω ¼ tan−1M� ωk kM:ω
� �
The αMω angle represents a positive value that rangesfrom 0 to 180°. Based on the αMω angle values, the kin-etic behaviour of each joint was classified as followed:
– Propulsion configuration (P) corresponds to αMω
ranging between 0 to 60° (αMω < 60°) where morethan 50% of the 3D joint moment (i.e. cosαMω > 0.5)contributes to positive joint power.
– Stabilization configuration (S) corresponds to αMω
ranging between 60 to 120° (αMω > 60° and < 120°)where less than 50% of the 3D joint moment (i.e.cosαMω < 0.5) contributes to joint power (positive ornegative).
– Resistance configuration (R) corresponds to αMω
ranging between 120 to 180° (αMω > 120°) wheremore than 50% of the 3D joint moment (i.e.cosαMω < − 0.5) contributes to negative joint power.
The closer αMω is reaching 0 or 180°, the more thejoint is almost driven by the joint moment (i.e.cosαMω→ 1 or − 1) resulting in a maximized joint power[20]. In order to complementary illustrate this point, thepercentage of propulsive/resistive moment (P/R % =100.cos(αMω)) contributing to drive the joint is alsogiven in Fig. 5. Inter-segment kinematic and kineticcomputations were performed using an in-house con-structed Matlab program. Joint moments and powerswere normalized by subject-mass and all variables weretime-normalized for the stance phase. The stance phasewas separated on four phases (Table 1) based on theforce and plantar pressure data.
ResultsThe 3D angle αMω and P/R % curves show that the fourjoints are never fully propelling, resisting or stabilized,but adopt a stabilized-resistive configuration duringmost of the stance phase, except at pre-swing with alljoints in a propulsive configuration (Fig. 5). At loadingresponse, all major joints quickly show a peak resistance
Fig. 1 Inter-segment center definitions were defined according to an adapted version of Rizzoli foot model (Leardini et al. 2007) developed byDeschamps et al. (2017) (IOR-4Segment-model 1). Markers name: upper ridge of the posterior surface of the calcaneus (FC); peroneal tubercle(FPT); sustentaculum tali (FST); virtual cuboid marker (FCub), tuberosity of the navicular bone (FNT); first, second and fifth metatarsal base (FMB,SMB, FMT); first, second and fifth metatarsal head (FM1,FM2, FM5); PD6: distal dorso-medial aspect of the head of the proximal phalanx of thehallux; First Metatarso-Phalangeal joint center (FM1; Midfoot-Metatarsus center (SMB); Calcaneus-Midfoot center (ID)
Deleu et al. Journal of Foot and Ankle Research (2020) 13:13 Page 4 of 12
(Ankle, Shank-Calcaneus, Lisfranc) or a stabilizationconfiguration (Chopart) followed by a short period ofstabilization occurring first at Ankle, Shank-Calcaneusand then for Lisfranc joints. The First Metatarso-Phalangeal joint demonstrates a propulsive configurationduring loading response. During midstance, the Ankleand Shank-Calcaneus predominantly show a resistiveconfiguration, whereas the Chopart adopts a stabilized-resistive configuration. In contrast, Lisfranc and FirstMetatarso-Phalangeal joints show a stabilized configur-ation. The propulsive configuration appears for Lisfrancjoint first at terminal stance, then for other foot joints atpre-swing in the following order: Shank-Calcaneus,Ankle, Chopart and First Metatarso-Phalangeal joint.
Ankle versus Shank-Calcaneus jointsThe Ankle and Shank-Calcaneus joint powers remainedlow during the stance phase, except at loading response,when a peak of negative power occurred correspondingto a resistive configuration (both joints αMω ~ 161° & ~92% of resistive moment), and during pre-swing when apeak of positive power occurred corresponding to a pro-pulsive configuration (Shank-Calcaneus ~ 67% of propul-sive moment versus Ankle ~ 87% of propulsive moment)(Fig. 5). The αMω and P/R % of both joints demonstrateda high variability during loading response and at the endof midstance (Fig. 5).At loading response, the moments and angles (Fig. 2, 3
and 4) of both joints showed a predominantly dorsiflexioninter-segmental action, and a combination of plantarflex-ion and eversion movements. At midstance, the joint mo-ments and angles of both joints showed a plantarflexioninter-segmental action and a dorsiflexion movement. Atterminal stance and pre-swing, the joint moments and an-gles of both joints showed a predominantly plantarflexioninter-segmental action combined with a plantarflexionmovement. Both peak power generation and absorptionwere lower in the Shank-Calcaneus joint than in the Anklejoint.
Calcaneus-Midfoot (Chopart)The Calcaneus-Midfoot power remained low during thestance phase, except during terminal stance when a peakof negative power occurred corresponding to a resistive
configuration (αMω ~ 143° & ~ 70% of resistive moment),and during pre-swing when a peak of positive power oc-curred corresponding to a propulsive configuration (αMω
~ 36° & ~ 75% of propulsive moment). The αMω and P/R% demonstrated a high variability during loading re-sponse and midstance (Fig. 5).At loading response, Calcaneus-Midfoot power was
negligible and the moments and angles showed a pre-dominantly plantarflexion inter-segmental action and acombination of dorsiflexion and eversion movements(Fig. 2-4). Calcaneus-Midfoot power was also low duringmidstance and the αMω demonstrated a stabilized-resistive configuration. At terminal stance, the momentsand angles showed a predominantly plantarflexion inter-segmental action combined with a dorsiflexion move-ment. At pre-swing, the moments and angles showed apredominantly plantarflexion inter-segmental actioncombined with a plantarflexion movement.
Midfoot-Metatarsus (Lisfranc)The Midfoot-Metatarsus power remained low during thestance phase, except at the end of terminal stance andthe beginning of pre-swing when a peak of positivepower was seen to occur corresponding to a propulsiveconfiguration (αMω ~ 31°& ~ 78% of propulsive mo-ment). The αMω and P/R % demonstrated a high vari-ability during midstance and terminal stance (Fig. 5).At loading response, Midfoot-Metatarsus power was
negligible and the moments and angles showed a pre-dominantly plantarflexion inter-segmental action and acombination of dorsiflexion and inversion/eversionmovements (Fig. 2-4). Midfoot-Metatarsus power werealso low during midstance and the αMω demonstrated astabilized configuration (~ 90°). At terminal stance, themoments and angles showed a predominantly plantar-flexion inter-segmental action combined with a plantar-flexion movement. The moments and angles at thetransition between terminal stance and pre-swingshowed a predominantly plantarflexion inter-segmentalaction combined with a plantarflexion movement. Incontrast to the Ankle and Chopart joints, the Lisfrancjoint demonstrated a stabilized configuration at the endof pre-swing. The moments and angles showed an ever-sion inter-segmental action combined with an eversionmovement.
First Metatarso-PhalangealThe First Metatarso-Phalangeal power remained lowduring the stance phase, except at pre-swing when apeak of negative power was seen to occur correspondingto a resistive configuration (peak at αMω ~ 146° & ~ 76%of resistive moment). The αMω and P/R % demonstrateda high variability during the entire stance phase, exceptduring pre-swing (Fig. 5).
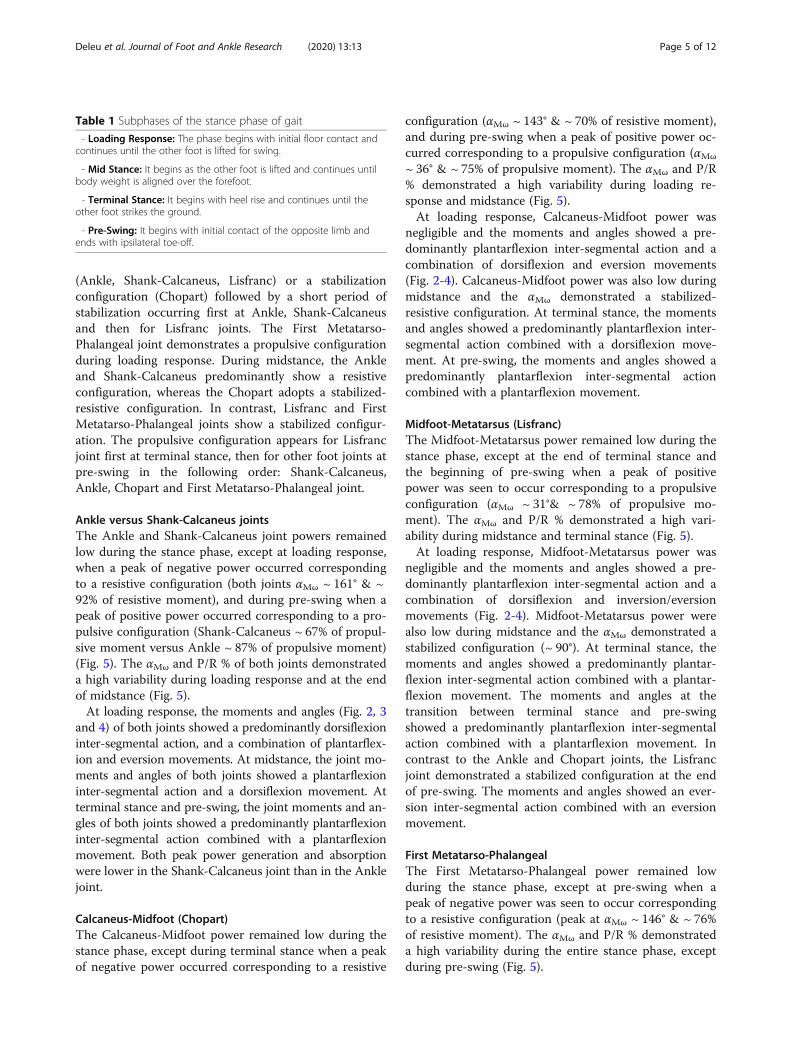
Table 1 Subphases of the stance phase of gait
- Loading Response: The phase begins with initial floor contact andcontinues until the other foot is lifted for swing.
- Mid Stance: It begins as the other foot is lifted and continues untilbody weight is aligned over the forefoot.
- Terminal Stance: It begins with heel rise and continues until theother foot strikes the ground.
- Pre-Swing: It begins with initial contact of the opposite limb andends with ipsilateral toe-off.
Deleu et al. Journal of Foot and Ankle Research (2020) 13:13 Page 5 of 12

The First Metatarso-Phalangeal power was negligiblefrom loading response to terminal stance. 3D angle αMω
and P/R % showed a propulsive configuration at loadingresponse and a stabilized configuration during mid-stance. At terminal stance and pre-swing, the momentsand angles showed a predominantly plantarflexion inter-segmental action combined with a dorsiflexion move-ment (Fig. 2-4).
DiscussionThe current study proposes the use of the αMω, which en-capsulates a 3D angular relationship between the jointmoment (M) and the joint angular velocity (ω) vectors, inan attempt to provide a “simple” measure of the functionof intrinsic foot joints during gait. Our hypothesis wasconfirmed by the results which showed that the intrinsicfoot joints are never fully propelling, resisting or stabilized,
Fig. 2 Mean 3D kinematics (degrees) for the Ankle, Shank-Calcaneus (Sha-Cal), Chopart joint (Cal-Mid), Lisfranc joint (Mid-Met), First Metatarso-Phalangeal joint (1st Metatarso-Phal). Standard deviations are visualized as bands. Abbreviations: LR: loading response; MS: midstance; TS: terminalstance; PSW: preswing phase. Each subphase of the stance phase of gait is delimited by vertical lines in each graph
Deleu et al. Journal of Foot and Ankle Research (2020) 13:13 Page 6 of 12

but instead adopt a stabilized-resistive configuration dur-ing most of the stance phase, with the exception of duringpre-swing when all joints adopt a propulsive configur-ation. This stabilized-resistive configuration keeps the footfrom collapsing while bearing weight, allowingstabilization of the foot and thus accomplishing the stabil-ity requirements of locomotion [28].This study expanded the calculation of αMω from a
lower limb model to a four-segment kinetic foot model.
The αMω pattern of the Ankle joint found in this studywas generally similar to that proposed by Dumas andChèze (2008) [20]. The most notable difference betweenthe results of the two studies was that during loading re-sponse Dumas and Chèze (2008) found a stabilized con-figuration as opposed to the resistive configurationfound in this study. The decomposition of αMω revealedthat this discordance in configuration is likely to arisefrom different kinematic patterns, as Dumas and Chèze
Fig. 3 Mean 3D angular velocities (degrees/second) for the Ankle, Shank-Calcaneus (Sha-Cal), Chopart joint (Cal-Mid), Lisfranc joint (Mid-Met), FirstMetatarso-Phalangeal joint (1st Metatarso-Phal). Standard deviations are visualized as bands. Abbreviations: LR: loading response; MS: midstance;TS: terminal stance; PSW: preswing phase. Each subphase of the stance phase of gait is delimited by vertical lines in each graph
Deleu et al. Journal of Foot and Ankle Research (2020) 13:13 Page 7 of 12

(2008) found a predominant combination of abductionand external rotation movements, whereas this studyshowed a combination of plantarflexion and eversionmovements. It may be concluded that the observed dif-ferences may therefore come from the variation in footkinematics between participants, since both studies usedthe same joint center, anatomical landmarks and refer-ence frame to model the ankle joint.A point of interest which deserves discussion is the
critical role of the method by which the ankle complexis modelled. The simplified representation of the foot asa single functional segment is still widely used to quan-tify ankle joint kinetics in clinical biomechanical studies.The results showed that both peak power generationand absorption were lower in the Shank-Calcaneus joint
than in the Ankle joint (Fig. 5). This is in accordancewith previous gait studies for asympatomatic [29–31]and symptomatic [32] subjects. However, in terms ofαMω and P/R% waveforms, the Shank-Calcaneus jointand the Ankle joint showed similar waveforms duringthe stance phase of gait.As αMω is simply an extension of the joint power, it
not possible to directly relate the propulsion/resistanceor stabilization configuration to a particular anatomicalstructure crossing the joint. For instance, a resistanceconfiguration does not systematically reveal an eccentricaction of the muscles but the tension of tendons, liga-ments, fascias and skin. Still, αMω can be interpretedwith regards to the foot functional anatomy. AddingαMω to the computation of foot kinetics creating a four-
Fig. 4 Mean 3D joint moments (Nm/kg) for the Ankle, Shank-Calcaneus (Sha-Cal), Chopart joint (Cal-Mid), Lisfranc joint (Mid-Met), First Metatarso-Phalangeal joint (1st Metatarso-Phal). Standard deviations are visualized as bands. Abbreviations: LR: loading response; MS: midstance; TS: terminalstance; PSW: preswing phase. Each subphase of the stance phase of gait is delimited by vertical lines in each graph
Deleu et al. Journal of Foot and Ankle Research (2020) 13:13 Page 8 of 12

segment foot model enabled the discovery of new in-sights into how the Chopart and Lisfranc joints are con-tributing to foot function from midstance to pre-swing.However, the interpretation of αMω of both joints duringloading response should be undertaken with care, as theforefoot may not yet be in contact with the ground, andtheir respective joint moments were found to be close tozero. The computed αMω of both joints appear to corres-pond with their respective functional anatomy. The Lis-franc joint shows predominantly a stabilized configurationduring midstance, possibly caused by the anatomical stiff-ness of the tarsometatarsal joints. The passive stability ofthe Lisfranc joint is largely provided by the plantar liga-ments and the second metatarsal with its encased base be-tween the cuneiforms. The peroneus longus tendon,inserted at the plantar aspect of the first metatarsal base,and the first cuneiform further contribute to thestabilization of the first ray in opposition to dorsiflexionmoments that are commonly exerted by ground reactionforces acting plantar to the first metatarsal head [33]. Incontrast to the Lisfranc joint, the Chopart joint has
considerably more freedom of movement and requires aresistive-stabilized configuration to control the deform-ation of the longitudinal arch under load, and to avoid col-lapsing during midstance and propulsion. Recent evidencesuggests that the stability of the longitudinal arch is notonly provided by the passive structures (e.g. plantar liga-ments and plantar fascia), but also by contraction of theplantar intrinsic foot muscles [34]. These muscles act aslocal stabilizers increasing the inter-segmental stability ofthe longitudinal arch. They have small cross-sectionalareas and therefore produce small rotational moments[34]. Flexor hallucis longus and tibialis posterior providefurther substantial dynamic support to the medial longitu-dinal arch. These muscles provide both resistive and pro-pulsive capabilities during gait [35, 36].The foot’s rigidity in late stance is mainly attributed to
the windlass and midtarsal locking mechanisms [37, 38].The stiffening of the foot is required to resist the groundreaction forces and allow efficient propulsion of thebody in late stance. At heel off, αMω and P&R % wave-forms of the Ankle and Lisfranc joints are
Fig. 5 Mean 3D joint power (Watt/kg), mean αMω angle and mean percentage of propulsive/resistive moment for the Ankle, Shank-Calcaneus(Sha-Cal), Chopart joint (Cal-Mid), Lisfranc joint (Mid-Met), First Metatarso-Phalangeal joint (1st Metatarso-Phal). Standard deviations are visualizedas bands. Subphases of the gait cycle. Abbreviations: R: resistance configuration; P: propulsion configuration; S: stabilisation configuration, LR:loading response; MS: midstance; TS: terminal stance; PSW: preswing phase. Each subphase of the stance phase of gait is delimited by verticallines in each graph
Deleu et al. Journal of Foot and Ankle Research (2020) 13:13 Page 9 of 12

simultaneously adopting a propulsive configuration atterminal stance, which means that both joints are pre-dominantly being driven by their respective plantarflex-ion moments, and thus contributing to powergeneration (Fig. 4-5). Recent studies suggest that thispower generation at the Lisfranc joint during terminalstance is the result of the Windlass mechanism [11, 29,39]. The activation of this mechanism results in tensionthe plantar fascia by winding it around the metatarsalheads as the toes dorsiflex in terminal stance [38]. Thepower generated at the Lisfranc joint would then in turnresult in the optimal repositioning of the bones aroundthe Chopart joint [40]. The reorientation of the midfootbones were mainly characterized in our results by aplantarflexion moment combined with a dorsiflexionand inversion movement of the Chopart joint resultingin a resistive configuration. This phenomenon is oftenreferred in the literature as the midtarsal locking mech-anism [37, 41]. However, the term “locking” seems in-appropriate as rotational movement at the Chopart jointwas observed at terminal stance. It has also been sug-gested that the increased tension in the plantar fascia,and possibly other muscle-tendon structures, would re-sult in a shortening and rise of the longitudinal archthrough flexion and adduction of the metatarsals incombination with an inversion of the rearfoot [38, 42].The longitudinal arch raise would then induce a first rayplantarflexion, an inversion of the Chopart joint, an in-version of the rearfoot, and Ankle dorsiflexion [40]. At65% of the stance, the resistive configuration adopted bythe Chopart joint is converted into a propulsive configur-ation where the moments and angles show predominantlya plantarflexion inter-segmental action combined with aplantarflexion movement (Fig. 2-5). This configurationconversion allows the Chopart joint to contribute topower generation. Elastic recoil of the tibialis posterior aswell as of the plantarflexors of the ankle and toes’ furtheradd to power generation at the Chopart and ankle jointsduring terminal stance and pre-swing [11].A last point of interest is the functioning of the First
Metatarso-phalangeal joint during propulsion, whichtends to absorb relatively more power than the jointsdistal to the Ankle joint (Fig. 5). The Ankle and the FirstMetatarso-Phalangeal joints, among all joints of the foot,undergo the largest ranges of motion in the sagittalplane, while moving in opposite directions during themajority of the stance phase of gait. Both joints arecrossed by the tendon of flexor hallucis longus, whichacts as a plantarflexor of the ankle and a joint-stabilizerof the First Metatarso-Phalangeal joint. Further activestabilization of the hallux against the ground is providedby the flexor hallucis brevis, adductor and abductor hal-lux muscles which exert a plantar flexion moment. Evi-dence suggests that this power absorption observed at
the First Metatarso-Phalangeal joint could be the resultof the pressing down action of the intrinsic foot musclesand the flexor hallucis longus to stabilize the halluxagainst the ground and to counteract the dorsiflexionand eversion moments externally produced by theground reaction forces [43, 44]. Kelly et al. (2014) fur-ther suggested that the intrinsic foot muscles also servedto decrease the stress on passive elements, such as theplantar ligaments, plantar fascia and plantar plate, cross-ing the First Metatarso-Phalangeal joint [45]. It maytherefore be concluded that the resistive configurationadopted by the First Metatarso-Phalangeal joint at ter-minal stance and pre-swing is in accordance with earlierfindings describing the mechanisms countering theground reaction forces.There are several limitations to this study. A first issue
concerns the estimation of the center of pressure and re-sultant ground reaction forces for each foot segment, de-rived from combining force and pressure data. The useof a proportionality scheme was originally validated forthe calculation of joint kinetics of a three segment footmodel and not for a four segment foot model [13]. Val-idity of the proportionally scheme was assessed by com-paring the predicted shear forces obtained from thesame experimental setup as the present study with themeasured shear forces obtained by asking the partici-pants to adopt a 3 step controlled foot placement ap-proach on two adjacent force plates during a walkingtrial. Mean differences of less than 3% between the shearforce measured by 2 adjacent force plates and the shearforce predicted by the proportionality scheme in thehindfoot and forefoot segments were found in a paediat-ric population. Recently, Eerdekens et al. (2019) hasfurther investigated the clinical applicability of the pro-portionality scheme in subjects suffering from ankle andhindfoot osteoarthritis [14]. Their results revealed insig-nificant over- and underestimation errors in multi-segment foot kinetics by comparing estimated shearforces with measured shear forces obtained by an adja-cent force plate method. However, these results shouldbe viewed with care as errors in the determination of thepoint of force application have been found towards forceplate edges [46]. Therefore, the results of the currentstudy should be considered as an estimation and furtherresearch is needed.A second limitation is the use of skin markers to esti-
mate joint centers and segmental kinematics. Estimationof movement of foot bones using skin markers, espe-cially in complex joints such as the Chopart and Lisfrancjoints, is a challenging process complicated by the smallsize of the foot bones as well as the relatively small mo-tions occurring at these joints. Over the last decade,multi-segment kinematic foot models using skin markershave been proposed to estimate the kinematic behaviour
Deleu et al. Journal of Foot and Ankle Research (2020) 13:13 Page 10 of 12

of foot joints by grouping foot bones into segments (e.g.hindfoot, midfoot, forefoot), the clinical value of whichhas been shown through the detection of intrinsic footmobility impairments [1, 47]. However, this approachcan lead to inaccuracies in foot joint kinematic and kin-etic estimations as these models do not account for indi-vidual bone-to-bone motion and therefore may violaterigid-body assumptions [2, 8]. In addition, soft-tissue ar-tefacts must be considered in segmental foot analysis [2,6, 8]. To overcome these challenges, methods usingbone-anchored markers and biplanar videoradiographyhave been used to provide more accurate measures offoot joint motion, which can be difficult to discern withskin mounted markers [2, 6–8]. However, the invasive/ionising nature of these alternative methods precludestheir use in routine clinical analysis. To assess the errorsin experimental data due to violation of the rigid-bodyassumption, studies have compared bone-mountedmarkers with skin-mounted markers [2, 8], which foundno systematic error pattern in the degree of skin motionover the underlying foot bones. They also reported thatthe degree of error varied between subjects and betweenanatomical sites and found maximum differences of 3 to9 degrees between skin and bone-mounted marker data[2, 8]. Recently, Kessler et al. (2019) compared foot mo-tion measured by biplanar videoradiography and opticalmotion capture [6]. They found good agreement be-tween the two systems for foot motion in the sagittalplane, and reported soft-tissue artefacts of 3.29 mm onthe surface of the foot [6]. However, the impact of theseerrors on the estimation of foot joint moments, angularvelocity and powers is difficult to assess. Therefore, theresults of the current study should be considered as anestimate, and further research using emerging technolo-gies such as biplanar videoradiography is needed to pro-vide a more detailed insight into the kinetic behavior offoot joints.A third limitation concerns the recruitment of asymp-
tomatic participants, which does not mean that all feetwere entirely free of degenerative changes in foot struc-ture (e.g. clinical osteoarthritic changes). Studies haveshown that a sizeable percentage of asymptomatic indi-viduals may present abnormal findings of soft tissues onmagnetic resonance imaging [48, 49]. Finally, since walk-ing speed results in different foot kinetics, the effect ofwalking speed on αMω should be further investigated infuture studies [11].
ConclusionThis study reports a first attempt to gain additionalinsight into the kinetic behaviour of multiple foot jointsthrough the use of a “simple” variable (αMω) during gait.Intrinsic foot joints adopt a stabilized-resistive configur-ation during the majority of the stance phase. Results of
the current study should be considered with care as skinmarkers and a proportionality scheme were used to esti-mate foot joint kinematics and kinetics. The notion ofstabilization, resistance and propulsion should be furtherinvestigated in subjects with foot and ankle disorders.
Abbreviations3D: three-dimensional; BMI: body mass index; M: joint moment vector;P: propulsion configuration of the joint; P/R %: percentage of propulsive/resistive moment; R: resistance configuration of the joint; S: stabilizationconfiguration of the joint; ω: joint angular velocity vector
AcknowledgementsNot applicable.
Author’s contributionsPAD, AN and LC were responsible for the conception and design of theresearch, reviewing articles, analysing data, interpreting the results, writingand drafting the manuscript, and approving the final version of themanuscript. RD and JLB were responsible for conception and design,reviewing articles, drafting, critically appraising and revising the manuscriptfor intellectual content. TL, BDB and IB were responsible for the conceptionand design, drafting, critically appraising and revising the manuscript forintellectual content. All authors read and approved the final version of themanuscript.
FundingThe research did not receive any specific grant from funding agencies in thepublic, commercial, or not-for-profit sectors.
Availability of data and materialsThe datasets generated during the current study are available from thecorresponding author on reasonable request.
Ethics approval and consent to participateAll participants were volunteers and signed the informed consent approvedby the Academic Ethical Committee Brussels Alliance for Research andHigher Education (B200–2017-061).
Consent for publicationNot applicable.
Competing interestsThe authors do not have any significant conflicts of interest relevant to thismanuscript.
Author details1Univ Lyon, Université Claude Bernard Lyon 1, Univ Gustave Eiffel, IFSTTAR,LBMC UMR_T9406, F69622 Lyon, France. 2Foot & Ankle Institute, Brussels,Belgium. 3Hospices Civils de Lyon, Centre Hospitalier Lyon-Sud, Service deChirurgie Orthopédique et Traumatologique, Lyon, France. 4SheffieldTeaching Hospitals NHS Foundation Trust, Woodhouse Clinic, 3 Skelton Lane,Sheffield S13 7LY, UK.
Received: 24 September 2019 Accepted: 2 March 2020
References1. Deschamps K, Staes F, Roosen P, Nobels F, Desloovere K, Bruyninckx H, et al.
Body of evidence supporting the clinical use of 3D multisegment footmodels: a systematic review. Gait Posture. 2011;33:338–49.
2. Nester C, Jones RK, Liu A, Howard D, Lundberg A, Arndt A, et al. Footkinematics during walking measured using bone and surface mountedmarkers. J Biomech. 2007;40:3412–23.
3. Nester CJ. Lessons from dynamic cadaver and invasive bone pin studies: dowe know how the foot really moves during gait? J Foot Ankle Res. 2009;2:18.
4. Leardini A, Benedetti MG, Berti L, Bettinelli D, Nativo R, Giannini S. Rear-foot,mid-foot and fore-foot motion during the stance phase of gait. GaitPosture. 2007;25:453–62.
Deleu et al. Journal of Foot and Ankle Research (2020) 13:13 Page 11 of 12

5. Nester CJ, Liu AM, Ward E, Howard D, Cocheba J, Derrick T, et al. In vitrostudy of foot kinematics using a dynamic walking cadaver model. JBiomech. 2007;40:1927–37.
6. Kessler SE, Rainbow MJ, Lichtwark GA, Cresswell AG, D’Andrea SE, Konow N,et al. A direct comparison of Biplanar Videoradiography and optical motioncapture for foot and ankle kinematics. Front Bioeng Biotechnol. 2019;7:1–10.
7. Lundgren P, Nester C, Liu A, Arndt A, Jones R, Stacoff A, et al. Invasivein vivo measurement of rear-, mid- and forefoot motion during walking.Gait Posture. 2008;28:93–100.
8. Westblad P, Hashimoto T, Winson I, Lundberg A, Arndt A. Differences inankle-joint complex motion during the stance phase of walking asmeasured by superficial and bone-anchored markers. Foot Ankle Int. 2002;23:856–63.
9. Bruening DA, Takahashi KZ. Partitioning ground reaction forces for multi-segment foot joint kinetics. Gait Posture. 2018;62:111–6.
10. Takahashi KZ, Worster K, Bruening DA. Energy neutral: the human foot andankle subsections combine to produce near zero net mechanical workduring walking. Sci Rep. 2017;7:15404.
11. Deschamps K, Eerdekens M, Desmet D, Matricali GA, Wuite S, Staes F.Estimation of foot joint kinetics in three and four segment foot modelsusing an existing proportionality scheme: application in paediatric barefootwalking. J Biomech. 2017;61:168–75.
12. Bruening DA, Cooney KM, Buczek FL. Analysis of a kinetic multi-segmentfoot model. Part I: model repeatability and kinematic validity. Gait Posture.2012;35:529–34.
13. Saraswat P, MacWilliams BA, Davis RB, D’Astous JL. Kinematics and kineticsof normal and planovalgus feet during walking. Gait Posture. 2014;39:339–45.
14. Eerdekens M, Staes F, Matricali GA, Deschamps K. Clinical applicability of anexisting proportionality scheme in three-segment kinetic foot models. AnnBiomed Eng. 2020;48:247–57.
15. Eng JJ, Winter DA. Kinetic analysis of the lower limbs during walking: whatinformation can be gained from a three-dimensional model? J Biomech.1995;28:753–8.
16. Buczek FL, Kepple TM, Siegel KL, Stanhope SJ. Translational and rotationaljoint power terms in a six degree-of-freedom model of the normal anklecomplex. J Biomech. 1994;27:1447–57.
17. Allard P, Lachance R, Aissaoui R, Duhaime M. Simultaneous bilateral 3-Dable-bodied gait. Hum Mov Sci. 1996;15:327–46.
18. van Ingen Schenau GJ. Positive work and its efficiency are at their dead-end: comments on a recent discussion. J Biomech. 1998;31:195–7.
19. Va ISGJ, Cavanagh PR. Power equations in endurance sports. J Biomech.1990;23:865–81.
20. Dumas R, Cheze L. Hip and knee joints are more stabilized than drivenduring the stance phase of gait: an analysis of the 3D angle between jointmoment and joint angular velocity. Gait Posture. 2008;28:243–50.
21. Péter A, Hegyi A, Finni T, Cronin NJ. In vivo fascicle behavior of the flexorhallucis longus muscle at different walking speeds. Scand J Med Sci Sports.2017;27:1716–23.
22. Wager JC, Challis JH. Elastic energy within the human plantar aponeurosiscontributes to arch shortening during the push-off phase of running. JBiomech. 2016;49:704–9.
23. Caravaggi P, Leardini A, Crompton R. Kinematic correlates of walkingcadence in the foot. J Biomech. 2010;43:2425–33.
24. De Cock A, Willems T, Witvrouw E, Vanrenterghem J, De Clercq D. Afunctional foot type classification with cluster analysis based on plantarpressure distribution during jogging. Gait Posture. 2006;23:339–47.
25. Wu G, Siegler S, Allard P, Kirtley C, Leardini A, Rosenbaum D, et al. ISBrecommendation on definitions of joint coordinate system of various jointsfor the reporting of human joint motion—part I: ankle, hip, and spine. JBiomech. 2002;35:543–8.
26. Legnani G, Casolo F, Righettini P, Zappa B. A homogeneous matrixapproach to 3D kinematics and dynamics — I. Theory Mech Mach Theory.1996;31:573–87.
27. Morlock M, Nigg BM. Theoretical considerations and practical results on theinfluence of the representation of the foot for the estimation of internalforces with models. Clin Biomech. 1991;6:3–13.
28. Shumway-Cook A, Wooll Acott MH. Control of normal mobility. In:Shumway-Cook A, Woollacott MH, editors. Motor control : Translatingresearch into clinical practice. Cambridge: Cambridge University Press; 2012.p. 315–42.
29. Bruening DA, Cooney KM, Buczek FL. Analysis of a kinetic multi-segmentfoot model part II: kinetics and clinical implications. Gait Posture. 2012;35:535–40.
30. MacWilliams BA, Cowley M, Nicholson DE. Foot kinematics and kineticsduring adolescent gait. Gait Posture. 2003;17:214–24.
31. Zelik KE, Honert EC. Ankle and foot power in gait analysis: implications forscience, technology and clinical assessment. J Biomech. 2018;75:1–12.
32. Eerdekens M, Staes F, Matricali GA, Wuite S, Peerlinck K, Deschamps K.Quantifying clinical misinterpretations associated to one-segment kineticfoot modelling in both a healthy and patient population. Clin Biomech.2019;67:160–5.
33. Perez HR, Reber LK, Christensen JC. The effect of frontal plane position onfirst ray motion: forefoot locking mechanism. Foot Ankle Int. 2008;29:72–6.
34. McKeon PO, Hertel J, Bramble D, Davis I. The foot core system: a newparadigm for understanding intrinsic foot muscle function. Br J Sports Med.2015;49:290.
35. Maharaj JN, Cresswell AG, Lichtwark GA. The mechanical function of thetibialis posterior muscle and its tendon during locomotion. J Biomech. 2016;49:3238–43.
36. Thordarson DB, Schmotzer H, Chon J, Peters J. Dynamic support of thehuman longitudinal arch. A biomechanical evaluation. Clin Orthop Relat Res.1995:165–72.
37. Mann RA. Biomechanics of the foot. Atlas Orthot Biomech Princ Appl. 1975:257–66.
38. Hicks JH. The mechanics of the foot. J Anat. 1954;88:25–30.39. Eerdekens M, Deschamps K, Staes F. The impact of walking speed on the
kinetic behaviour of different foot joints. Gait Posture. 2019;68:375–81.40. Fuller EA. The windlass mechanism of the foot. A mechanical model to
explain pathology. J Am Podiatr Med Assoc. 2000;90:35–46.41. Okita N, Meyers SA, Challis JH, Sharkey NA. Midtarsal joint locking: new
perspectives on an old paradigm. J Orthop Res. 2014;32:110–5.42. Caravaggi P, Pataky T, Goulermas JY, Savage R, Crompton R. A dynamic
model of the windlass mechanism of the foot: evidence for early stancephase preloading of the plantar aponeurosis. J Exp Biol. 2009;212:2491–9.
43. Jacob HA. Forces acting in the forefoot during normal gait – an estimate.Clin Biomech. 2001;16:783–92.
44. Péter A, Hegyi A, Stenroth L, Finni T, Cronin NJ. EMG and force productionof the flexor hallucis longus muscle in isometric plantarflexion and thepush-off phase of walking. J Biomech. 2015;48:3413–9.
45. Kelly LA, Cresswell AG, Racinais S, Whiteley R, Lichtwark G. Intrinsic footmuscles have the capacity to control deformation of the longitudinal arch. JR Soc Interface. 2014;11:20131188.
46. List R, Hitz M, Angst M, Taylor WR, Lorenzetti S. Gait & Posture in-situ forceplate calibration : 12 years ’ experience with an approach for correcting thepoint of force application. Gait Posture. 2017;58:98–102.
47. Leardini A, Caravaggi P, Theologis T, Stebbins J. Multi-segment foot modelsand their use in clinical populations. Gait Posture. 2019;69:50–9.
48. O’Neil J, McDonald E, Chapman T, Casper D, Shakked R, Pedowitz D.Anterior Talofibular Ligament Abnormalities on Routine MagneticResonance Imaging of the Ankle. Foot Ankle Orthop. 2017.
49. Culvenor AG, Oiestad BE, Hart HF, Stefanik JJ, Guermazi A, Crossley KM.Prevalence of knee osteoarthritis features on magnetic resonance imagingin asymptomatic uninjured adults: a systematic review and meta-analysis. BrJ Sports Med England. 2018;53:1288–78.
Publisher’s NoteSpringer Nature remains neutral with regard to jurisdictional claims inpublished maps and institutional affiliations.
Deleu et al. Journal of Foot and Ankle Research (2020) 13:13 Page 12 of 12