intracellular lysine (g lys/g dcw) - nature · 2 fluorescence (a.u) 0 5 10 15 20 25 30 wln0 wln1...
TRANSCRIPT

1
Supplementary Figures
Intr
acel
lula
r Ly
sine
(g
Lys/
g D
CW
)
0.0
0.1
0.2
0.3
0.4
0.5
0.6
WL0(M9)
WL1(M9)
WL2(M9)
WL2(CM9)
WL3(CM9)
Supplementary Figure S1. Intracellular lysine concentrations of the constructed variants.
The intracellular lysine concentration of each strain was measured as described in Supplementary
Methods. WL0, WL1, and WL2 strains were cultured in M9 media. For the comparison between
WL2 and WL3 strains, they were cultured in complemented M9 (CM9) media (supplemented
with L-methionine and L-threonine to complement the auxotrophic phenotype of the WL3 strain).
The experiments were replicated twice.

2
Flu
ores
cenc
e (a
.u)
0
5
10
15
20
25
30
WLN0 WLN1
Supplementary Figure S2. The 5’ leader region of lysC in E. coli as a lysine riboswitch. The
fluorescence intensity of two strains with different intracellular concentrations of lysine was
measured when the 5’ leader region of lysC in E. coli was located at the region upstream of sgfp
(see Supplementary Methods for details). The y-axis is fluorescence in arbitrary units. The
experiments were replicated twice.
3
Sp
ecifi
cG
row
thR
ate
(h-1
)
0.00
0.05
0.10
0.15
0.20
WLR0 WLR1
Sp
ecifi
cG
row
thR
ate
(h-1
)
0.00
0.05
0.10
0.15
0.20
0.25
WLN0 WLN1
Sp
ecifi
cG
row
thR
ate
(h-1
)
0.00
0.05
0.10
0.15
0.20
0.25
WLM0 WLM1
Sp
ecifi
cG
row
thR
ate
(h-1
)
0.00
0.05
0.10
0.15
0.20
WLM0 WLM1
a b
c d
NiCl2
NiCl2
NiCl2
Tet
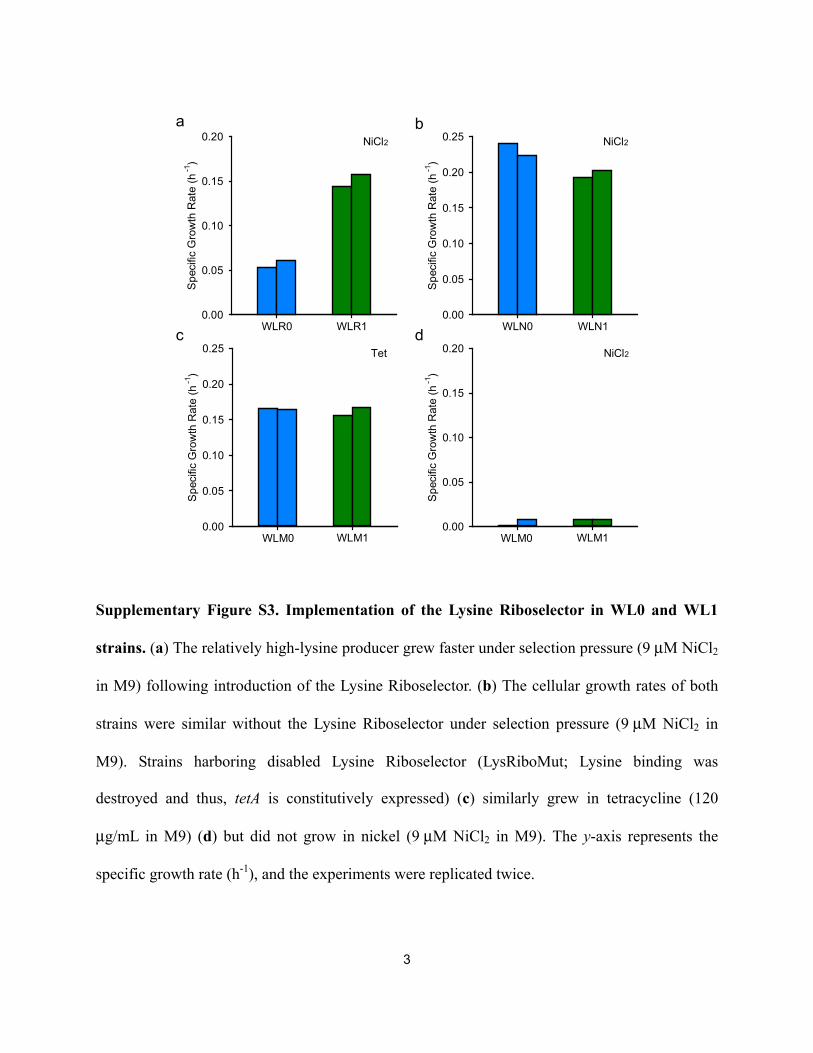
Supplementary Figure S3. Implementation of the Lysine Riboselector in WL0 and WL1
strains. (a) The relatively high-lysine producer grew faster under selection pressure (9 μM NiCl2
in M9) following introduction of the Lysine Riboselector. (b) The cellular growth rates of both
strains were similar without the Lysine Riboselector under selection pressure (9 μM NiCl2 in
M9). Strains harboring disabled Lysine Riboselector (LysRiboMut; Lysine binding was
destroyed and thus, tetA is constitutively expressed) (c) similarly grew in tetracycline (120
μg/mL in M9) (d) but did not grow in nickel (9 μM NiCl2 in M9). The y-axis represents the
specific growth rate (h-1), and the experiments were replicated twice.
4
a b
c d
Tet
NiCl2
NiCl2
Tet
Sp
ecifi
cG
row
thR
ate
(h-1
)
0.00
0.05
0.10
0.15
0.20
WLR1 WLR2
Sp
ecifi
cG
row
thR
ate
(h-1
)
0.00
0.05
0.10
0.15
0.20
WLN1 WLN2
Sp
ecifi
cG
row
thR
ate
(h-1
)
0.00
0.05
0.10
0.15
0.20
WLM1 WLM2
Sp
ecifi
cG
row
thR
ate
(h-1
)
0.00
0.05
0.10
0.15
0.20
WLM1 WLM2
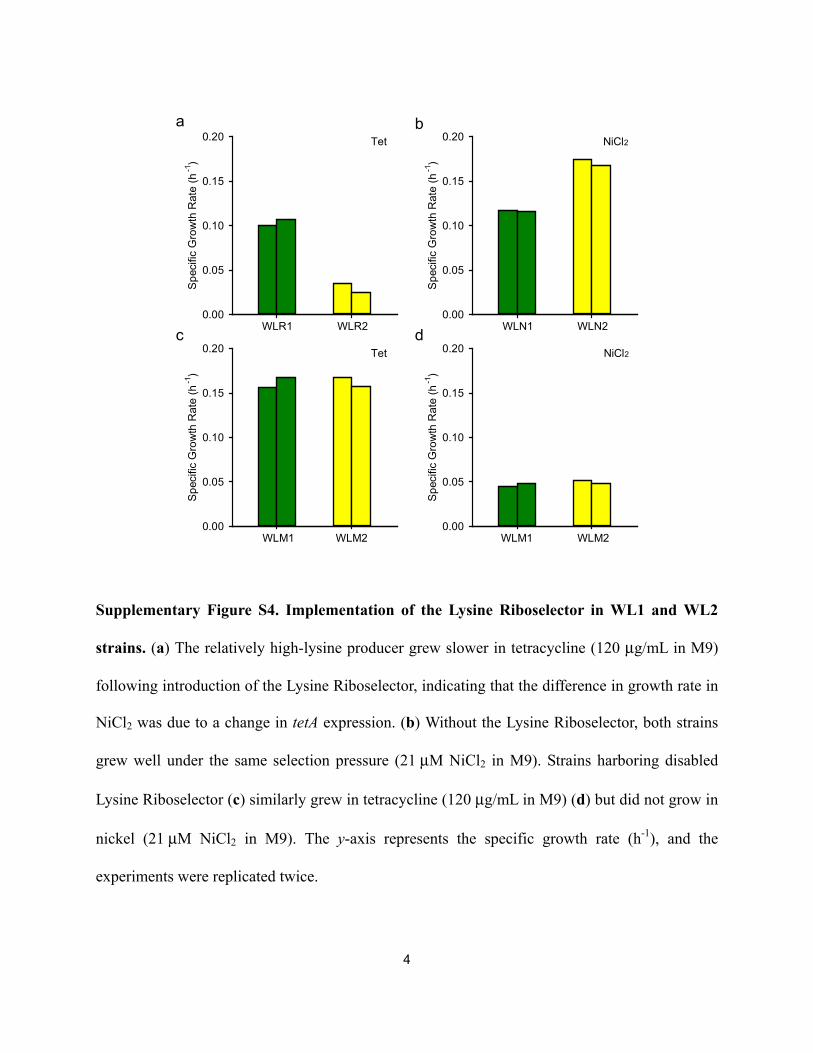
Supplementary Figure S4. Implementation of the Lysine Riboselector in WL1 and WL2
strains. (a) The relatively high-lysine producer grew slower in tetracycline (120 μg/mL in M9)
following introduction of the Lysine Riboselector, indicating that the difference in growth rate in
NiCl2 was due to a change in tetA expression. (b) Without the Lysine Riboselector, both strains
grew well under the same selection pressure (21 μM NiCl2 in M9). Strains harboring disabled
Lysine Riboselector (c) similarly grew in tetracycline (120 μg/mL in M9) (d) but did not grow in
nickel (21 μM NiCl2 in M9). The y-axis represents the specific growth rate (h-1), and the
experiments were replicated twice.

5
a b
c d
Tet
NiCl2
NiCl2
Tet
Sp
ecifi
cG
row
thR
ate
(h-1
)
0.00
0.05
0.10
0.15
0.20
0.25
WLR2 WLR3
Sp
ecifi
cG
row
thR
ate
(h-1
)
0.00
0.05
0.10
0.15
0.20
0.25
WLN2 WLN3
Sp
ecifi
cG
row
thR
ate
(h-1
)
0.00
0.05
0.10
0.15
0.20
0.25
WLM2 WLM3
Sp
ecifi
cG
row
thR
ate
(h-1
)
0.00
0.05
0.10
0.15
0.20
0.25
WLM2 WLM3
Supplementary Figure S5. Implementation of the Lysine Riboselector in WL2 and WL3
strains. (a) The relatively high-lysine producer grew slower in tetracycline (120 μg/mL in
complemented M9) following introduction of the Lysine Riboselector, indicating that the
difference in growth rate in NiCl2 was due to a change in tetA expression. (b) Without the Lysine
Riboselector, both strains grew well under the same selection pressure (240 μM NiCl2 in
complemented M9). Strains harboring disabled Lysine Riboselector (c) similarly grew in
tetracycline (120 μg/mL in complemented M9) (d) but did not grow in nickel (240 μM NiCl2 in
complemented M9). The y-axis represents the specific growth rate (h-1), and the experiments
were replicated twice.

6
Spe
cific
gro
wth
rat
e (h
-1)
0.00
0.05
0.10
0.15WLR3WLN3
60 μMNiCl2
90 μMNiCl2
120 μMNiCl2
Supplementary Figure S6. Setting the selection pressure for enrichment. The cellular growth
rates of the parental strain, with and without lysine riboselector (WLR3 and WLN3), were
measured in different concentrations of NiCl2. The y-axis represents the specific growth rate (h-1),
and the experiments were replicated twice.

7
Time (h)
0 4 8 12 16 20 24
OD
600
0.1
1G
luco
se(g
/L)
0
1
2
3
4
Time (h)
0 4 8 12 16 20 24
Lysine
(g/L)
0.0
0.2
0.4
0.6
0.8WLRE2 WLRE3
Supplementary Figure S7. Lysine production by the enriched strains using Lysine
Riboselector. Culture data for the enriched strains WLRE2 (left panel) and WLRE3 (right panel)
are shown. The left y-offset and right y-axis represent glucose (circles) and lysine (triangles)
concentration (g/L), respectively. The left y-axis represents optical density (rectangles) at 600 nm
in log scale. The x-axis represents the culture time (h). The experiments were replicated twice.

8
Rel
ativ
e ppc
expr
essi
on le
vel
0
1
4
6
8
10
WLR
E1
WL
RE
2
WL
RE
3
WR
3
WLC
P1
WL
CP
2
WLC
P3
Supplementary Figure S8. Comparison of ppc expression levels between enriched (plasmid-
based and chromosome-based) and parental strains. Relative changes in ppc mRNA
expression were monitored by RT-QPCR (Reverse Transcription Quantitative PCR) and
calculated using the comparative CT method (2-ΔΔCt) with gapA as a reference (See
Supplementary Methods for details). The y-axis represents the relative expression level. The
experiments were replicated twice.

9
Time (h)
0 4 8 12 16 20 24
OD
600
0.1
1
Glu
cose
(g/L
)
0
1
2
3
4
Time (h)
0 4 8 12 16 20
Time (h)
0 4 8 12 16 20 24 28
Lysine
(g/L)
0.0
0.2
0.4
0.6
0.8WLCP1 WLCP2 WLCP3
Supplementary Figure S9. Lysine production by the strains whose chromosomal ppc
promoters are switched with the enriched promoters (WLCP1, WLCP2, and WLCP3).
Culture data for the strains WLCP1 (left panel), WLCP2 (middle panel), and WLCP3 (right
panel) are shown. The left y-offset and right y-axis represent glucose (circles) and lysine
(triangles) concentration (g/L), respectively. The left y-axis represents optical density
(rectangles) at 600 nm in log scale. The x-axis represents the culture time (h). The experiments
were replicated twice.

10
Enrichment cycles
1st 2nd 3rd 4th
Per
cent
age
(%)
0
10
20
30
40
WLNE1WLNE2WLNE3WLNE4WLNE5WLNE6WLNE7WLNE8WLNE9WLNE10
Supplementary Figure S10. A population analysis of the enriched strains without Lysine
Riboselector (RiboNULL). Next-generation sequencing was used to examine the promoter
region of each variant for population analysis. The y-axis represents the percentage of each
variant in the total population. The x-axis represents the enrichment cycle, where each
enrichment cycle corresponds to three serial cultures.
11
Time (h)
0 4 8 12 16 20 24
OD
600
0.1
1
Glu
cose
(g/L
)
0
1
2
3
4
Time (h)
0 4 8 12 16 20 24
Time (h)
0 4 8 12 16 20 24
Lysine
(g/L)
0.0
0.2
0.4
0.6
0.8WLNE1 WLNE2 WLNE3
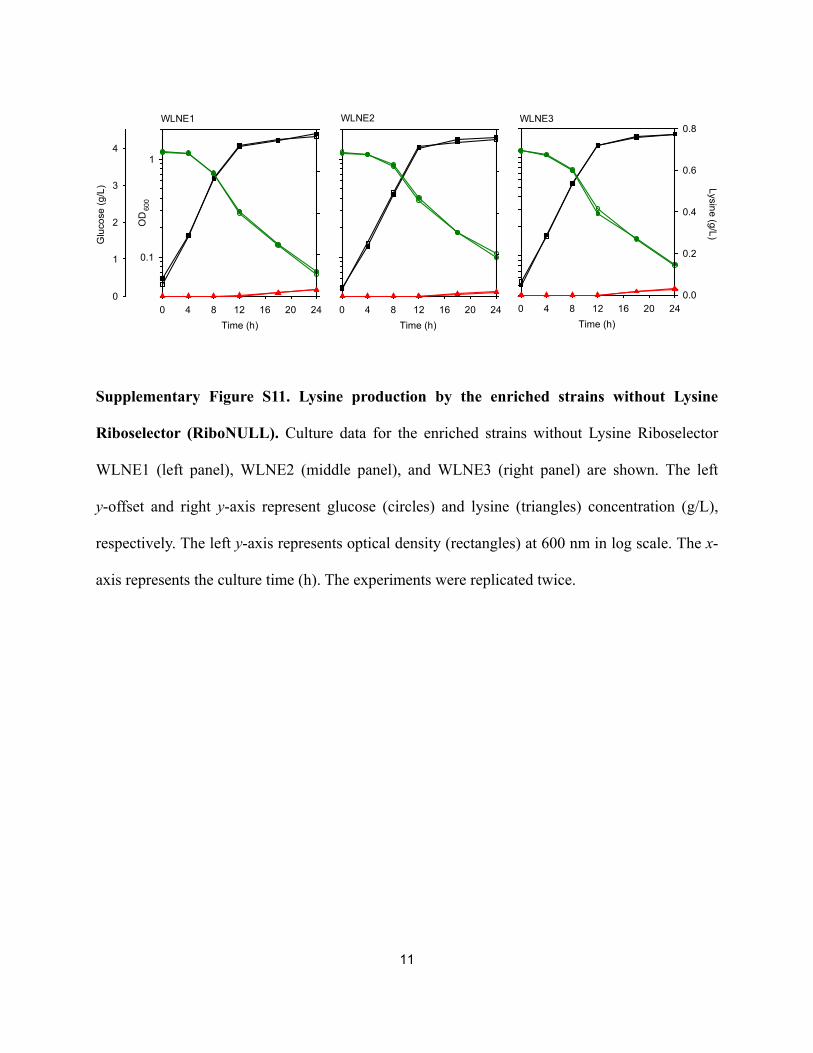
Supplementary Figure S11. Lysine production by the enriched strains without Lysine
Riboselector (RiboNULL). Culture data for the enriched strains without Lysine Riboselector
WLNE1 (left panel), WLNE2 (middle panel), and WLNE3 (right panel) are shown. The left
y-offset and right y-axis represent glucose (circles) and lysine (triangles) concentration (g/L),
respectively. The left y-axis represents optical density (rectangles) at 600 nm in log scale. The x-
axis represents the culture time (h). The experiments were replicated twice.

12
Supplementary Tables
Supplementary Table S1. Sequences of the enriched ppc promoters using LysRibo.
Strains Promoter Sequences (5’-3’)a WLRE1 GAACAAGCTAGCTCAGTCCTAGGCGGCAAGCTAGC WLRE2 CCCCCAGCTAGCTCAGTCCTAGGTAGCGGGCTAGC WLRE3 CAAATTGCTAGCTCAGTCCTAGGAAAAGGGCTAGC
a Bold letters indicate randomized regions.

13
Supplementary Table S2. Sequences of the selected ppc promoters when enriched using RiboNULL.
Strains Promoter Sequences (5’-3’)a WLNE1 GCACCTGCTAGCTCAGTCCTAGGCACAGCGCTAGC WLNE2 AAAGAGGCTAGCTCAGTCCTAGGGGTCCAGCTAGC WLNE3 CTATCTGCTAGCTCAGTCCTAGGCATGGTGCTAGC WLNE4 ACGTAAGCTAGCTCAGTCCTAGGTAATCGGCTAGC WLNE5 TCTAACGCTAGCTCAGTCCTAGGATAACGGCTAGC WLNE6 GCGGTAGCTAGCTCAGTCCTAGGTTTGTCGCTAGC WLNE7 CATACAGCTAGCTCAGTCCTAGGACTGACGCTAGC WLNE8 TGAATCGCTAGCTCAGTCCTAGGAGCTCGGCTAGC WLNE9 ACGAAAGCTAGCTCAGTCCTAGGTGCAGCGCTAGC WLNE10 AGGTAAGCTAGCTCAGTCCTAGGAATAGCGCTAGC
a Bold letters indicate randomized regions.
14
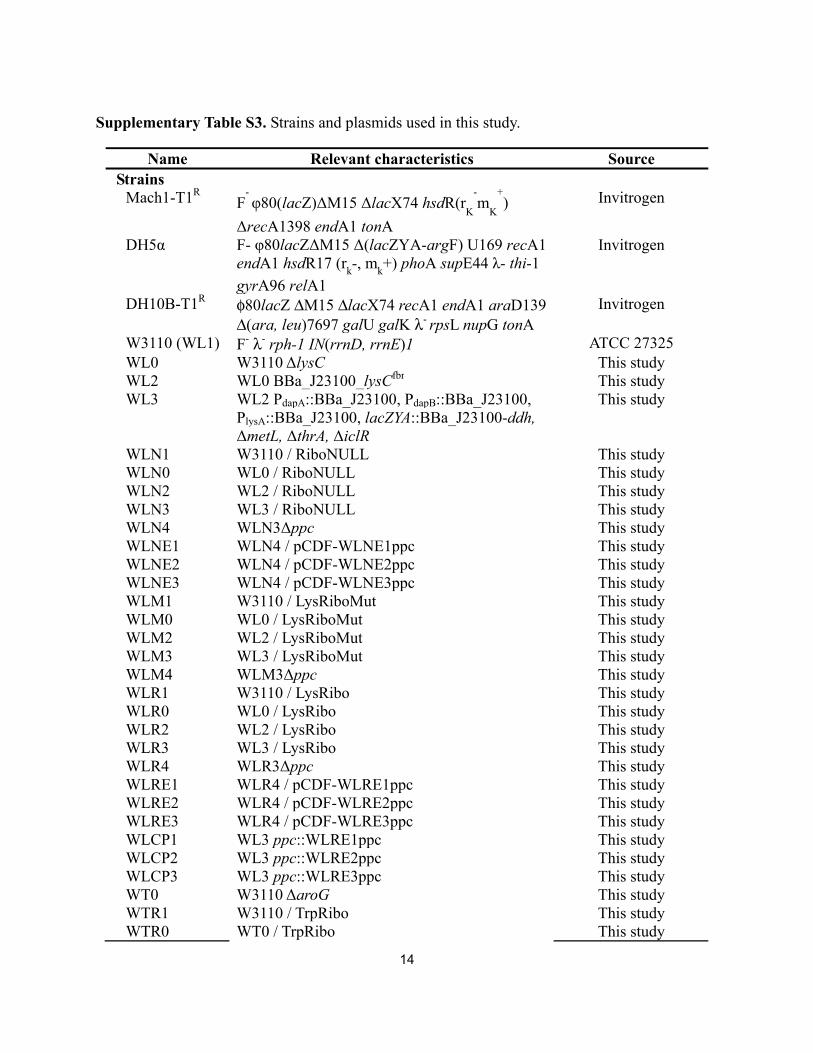
Supplementary Table S3. Strains and plasmids used in this study.
Name Relevant characteristics Source Strains
Mach1-T1R F- φ80(lacZ)ΔM15 ΔlacX74 hsdR(r
K
-m
K
+)
ΔrecA1398 endA1 tonA
Invitrogen
DH5α F- φ80lacZΔM15 Δ(lacZYA-argF) U169 recA1 endA1 hsdR17 (r
k-, m
k+) phoA supE44 λ- thi-1
gyrA96 relA1
Invitrogen
DH10B-T1R φ80lacZ ΔM15 ΔlacX74 recA1 endA1 araD139 Δ(ara, leu)7697 galU galK λ- rpsL nupG tonA
Invitrogen
W3110 (WL1) F- λ- rph-1 IN(rrnD, rrnE)1 ATCC 27325 WL0 W3110 ΔlysC This study WL2 WL0 BBa_J23100_lysCfbr This study WL3 WL2 PdapA::BBa_J23100, PdapB::BBa_J23100,
PlysA::BBa_J23100, lacZYA::BBa_J23100-ddh, ΔmetL, ΔthrA, ΔiclR
This study
WLN1 W3110 / RiboNULL This study WLN0 WL0 / RiboNULL This study WLN2 WL2 / RiboNULL This study WLN3 WL3 / RiboNULL This study WLN4 WLN3Δppc This study WLNE1 WLN4 / pCDF-WLNE1ppc This study WLNE2 WLN4 / pCDF-WLNE2ppc This study WLNE3 WLN4 / pCDF-WLNE3ppc This study WLM1 W3110 / LysRiboMut This study WLM0 WL0 / LysRiboMut This study WLM2 WL2 / LysRiboMut This study WLM3 WL3 / LysRiboMut This study WLM4 WLM3Δppc This study WLR1 W3110 / LysRibo This study WLR0 WL0 / LysRibo This study WLR2 WL2 / LysRibo This study WLR3 WL3 / LysRibo This study WLR4 WLR3Δppc This study WLRE1 WLR4 / pCDF-WLRE1ppc This study WLRE2 WLR4 / pCDF-WLRE2ppc This study WLRE3 WLR4 / pCDF-WLRE3ppc This study WLCP1 WL3 ppc::WLRE1ppc This study WLCP2 WL3 ppc::WLRE2ppc This study WLCP3 WL3 ppc::WLRE3ppc This study WT0 W3110 ΔaroG This study WTR1 W3110 / TrpRibo This study WTR0 WT0 / TrpRibo This study

15
Plasmids
pKD46 Red recombinase expression vector; AmpR pCP20 FLP expression vector; AmpR pACYCDuet Expression vector, CmR, p15A ori Novagen pCDFDuet Expression vector, SmR, cloDF13 ori Novagen pGEM T-Easy Cloning vector, AmpR Promega pMD20 Cloning vector, AmpR Takara pGFKF pGEM-FRT-KanR-FRT-BBa_J23100 This study pGFKF1 pGEM-FRT-KanR-FRT-NdeI-XhoI This study pGFKF2 pGEM-FRT-KanR-FRT-KpnI-SacI This study pGFKF1-ddh pGFKF1-NdeI-BBa_J23100-ddh-XhoI This study pGFKF2-lysC pGFKF2-KpnI-BBa_J23100-lysCfbr-SacI This study pMD20-FKF(f72)
pMD20-FRT(f72)-KanR-FRT(f27) This study
pMD20-FKF(f72)-WLRE1ppc
pMD20- FRT(f72)-KanR-FRT(f27)-KpnI-WLRE1ppc-SacI
This study
pMD20-FKF(f72)-WLRE2ppc
pMD20- FRT(f72)-KanR-FRT(f27)-KpnI-WLRE2ppc-SacI
This study
pMD20-FKF(f72)-WLRE3ppc
pMD20- FRT(f72)-KanR-FRT(f27)-KpnI-WLRE3ppc-SacI
This study
LysRibo pACYCDuet-KpnI-BBa_J23100-lysC UTR-tetA-SacI
This study
LysRiboMut pACYCDuet-KpnI-BBa_J23100-lysC UTR*(G31C)-tetA-SacI
This study
RiboNULL pACYCDuet-KpnI-BBa_J23100-lysC UTR-sgfp-SacI
This study
pCDF-ppc pCDFDuet-KpnI-ppc-SacI This study pCDF-ppc-Lib pCDFDuet- KpnI-N6-gctagctcagtcctagg-N6-
gctagc-UTR-ppc-SacI This study
TrpRibo_Lib pACYCDuet-J23100-TrpApt-UTR-N10-tetA-sgfp
This study
TrpRibo pACYCDuet-J23100-TrpApt-UTR-gagggtaaga-tetA-sgfp
This study

16
Supplementary Table S4. Primers used in this study.
Name Sequence (5’-3’)a,b M-pGFKF2-F ggaactgtcaacgGGTACCtctcgacatcatcac M-pGFKF2-R gtgatgatgtcgagaGGTACCcgttgacagttcc FRT(f72)-Kan-F
gcatgaccggcgcgatgcgaagttcctatactttctacagaataggaacttctcaagatcccctcacgctgccg
FRT(f72)-Kan-R
gctcagcggatctcatgcgcgaagttcctattctgtagaaagtataggaacttcagagcgcttttgaagctggggtgg
FKF(f72)-TA-F agcatgaccggcgcgatgc FKF(f72)-TA-R cctaggactgagctagccgtcaactcgaggctcagcggatctcatgcgc pMD20-FKF(f72)-AD-KpnI-F
gggatccgattgcatggtaccggcgcgatgcg
FKF(f72)-AD-KpnI-R
cgcatcgcgccggtaccatgcaatcggatccc
D-lysC-F gactttggaagattgtagcgccagtcacagaaaaatgtgatggttttagtgcgatgcctcatccgcttctc
D-lysC-R gacaagaaaatcaatacggcccgaaatatagcttccaggccatacagtatgcaacgcagtagctggagtc
S-lysC-up-F acatatgtctgaaattgttgtctccaaatttgg M-lysC-up-R ccggtggtatcaaggattaatgccacgctcac M-lysC-down-F caccacgtcagaagtgagcgtggcattaatccttgataccaccggttcaacctccac S-lysC-down-R actcgagttactcaaacaaattactatgcagtttttgcac
P-lysC-F gactttggaagattgtagcgccagtcacagaaaaatgtgatggttttagtgcgttgctcctgacatggctc
P-lysC-R gacaagaaaatcaatacggcccgaaatatagcttccaggccatacagtatgcatccaacgcgttgggagctcc
ph-DNdeI-F gaatatcctccttagttcctattccgaagttcc ph-DNdeI-R ggatgaacgaaatagacagatcgc
P-dapA-F ggaaagcataaaaaaaacatgcatacaacaatcagaacggttctgtctgcatgggaattagccatggtccatatg
P-dapA-R atcgcgacaatacttcccgtgaacatgggccatcctctgtgcaaacaagtgctagcactgtacctaggactgagc
P-dapB-F gtaacctgtcacatgttattggcatgcagtcattcatcgactcatgccatgggaattagccatggtcc
P-dapB-R ggatgtttgcatcatgcatagctattctcttttgttaatttgcatagaccgctagcactgtacctaggactgagc
P-lysA-F gccattagcgctctctcgcaatccggtaatccatatcatttttgcatagagaatatcctccttagttcctattccgaag
P-lysA-R agattttcggcggtgagatcggtatcggtgctgaacagtgaatgtggcatatgtatatctccttcttaaagttaaacaa
S-ddh-F aCATATGaccaacatccgcgtagctatcgtgg S-ddh-R aCTCGAGctaaattagacgtcgcgtg P-ddh-F ttaaactgacgattcaactttataatctttgaaataatagtgcttatcccgtctatttcgttcatccgaatatc

17
ctcc
P-ddh-R gcggtatggcatgatagcgcccggaagagagtcaattcagggtggtgaatgagctccaaaaaacccctcaagac
D-met-F atgagtgtgattgcgcaggcaggggcgaaaggtcgtcagctgcataaattctagtgctggagcgaactgc
D-met-R aaaccataaacccgaaaacatgagtaccgggcattattaaatttctgaaaggagtactcgcggttgactg
D-thr-F gcgtacaggaaacacagaaaaaagcccgcacctgacagtgcgggctttttgttagcccgtctgtcccaa
D-thr-R tgattcatcatcaatttacgcaacgcagcaaaatcggcgggcagattatgcatactcgctcttgggtcgg
D-iclR-F ctgtggtaaaagcgaccaccacgcaacatgagatttgttcaacattaactcgtagcaccgagtcgtaccag
D-iclR-R gcattccaccgtacgccagcgtcacttccttcgccgctttaatcaccatccggtactggcctaacgcact
D-ppc-F ccagtgccgcaataatgtcggatgcgatacttgcgcatcttatccgaccgttagcccgtctgtcccaa D-ppc-R gcagacagaaatatattgaaaacgagggtgttagaacagaagtaTcatactcgctcttgggtcgg
D-aroG-F gatctcgtttttcgcgacaatctggcgtttttcttgctaattccaggatgagatgggaattagccatggtcc
D-aroG-R cggttgcaaaccagggtaaagcgaagtaaacgtcattcgtttaaaatgaggtgtaggctggagctgcttc
C-lysC-F ctgccaggcagcggtctgc C-lysC-R cgggaattcgtttgcgagcagaac C-lysC-R2 cagctacgctggtgccgccaaatttggag C-dapA-F caacgcagtgatcaccagataatgttg C-dapA-R ttaccggaatgcgcccatcagc C-dapB-F ttaccggaatgcgcccatcagc C-dapB-R cagcgtaccttccggacggg C-lysA-F ggtgtgccgcctcagtcagg C-lysA-R tccactttcacgccctgctc C-ddh-F agtatcagcggcaattacctgatggactgg C-ddh-R cggtggcggcttcgttcatgac C-met-F cgctggcggaatcattaggg C-met-R cgaaaaatgaccaatgatggtg C-thr-F ccaatataggcatagcgcacag C-thr-R gcccgttatgggtcgatatccg C-iclR-F ctgcgcacgcagttgttcc C-iclR-R gtgtgtgaagtgtatgac C-ppc-F ccggtgagcgaacgctggcc C-ppc-R attccttaaggatatctgaagg C-aroG-F ccaggttatgaaacgcagcagagaatcttg C-aroG-R gttcgacgagaatttcaaaccgctgaaacg Pro-LUTR-F attgacggctagctcagtcctaggtacagtgctagcgtactacctgcgctagcgca

18
LUTR-R aactacctcgtgtcaggggatccat
L-sgfp-F ctcttcccttgtgccaaggctgaaaatggatcccctgacacgaggtagttatggctagcaagggcgaggagctgt
sgfp-R acaaaaaacccctcaagacccgtttagaggc KpnI-Pro-F aGGTACCttgacggctagctcagtcctaggtacagtg
L-tetA-F ctcttcccttgtgccaaggctgaaaatggatcccctgacacgaggtagttatgaaatctaacaatgcgctc
tetA-R aGAGCTCgtggccaggacccaacgctgcccga LysRiboMut-G31C-F
gcgcaggccagaagacgcgcgttgcccaag
LysRiboMut-G31C-R
cttgggcaacgcgcgtcttctggcctgcgc
M-pCDL-F ctcgagtctGGTACCgaaaccgctgctgcg M-pCDL-R cgcagcagcggtttcGGTACCagactcgag
S-ppc-F aGGTACCacaggttcagagttctacagtccgacatgagcaaaggtttcagtaggaggaaagaacaatgaacgaacaatattccgcattgcg
S-ppc-R aGAGCTCgagggtgttagaacagaagtatttc
FL-ppc-F gcagacagaaatatattgaaaacgagggtgttagaacagaagtatgagggtgttagaacagaagtatttcag
FL-ppc-R gtcggatgcgatacttgcgcatcttatccgaccgttagcccgtctgtcccggctcagcggatctcatgcgc
ph-UTR-ppc-F gaattcgtatgccgtcttctgcttgtcgaggaggatcccaatgaacgaacaatattccgcattgcg ph-UTR-ppc-R tcggactgtagaactctgaacctgtgg
ph-J23N-F gctagcNNNNNNcctaggactgagctagcNNNNNNcatgtcggactgtagaactctgaacc
ph-J23N-R ttcgtatgccgtcttctgcttgtcg
ph-T-Library-F atatttgacggctagctcagtcctaggtacagtgctagcctggacgacggggacgccactggactaggtaagccaggaccgtacgtcgggagccgtcagaataNNNNNNNNNNaaggagcatctatgaaatctaacaatgcgct
ph-T-Library-R ttaaggtaccgcgcaacgcaattaatgtaagtta T-tetA-F aGGTACCaaggagcatctatgaaatctaacaatgcgctcatcgtca
T-tetA-R gctcccaccgccactcccaccgccggacccaccgcccgacccaccgccggtcgaggtggcccggct
T-sgfp-F ggcggtgggtcgggcggtgggtccggcggtgggagtggcggtgggagcgctagcaagggcgaggagct
T-sgfp-R aGAGCTCtcacttgtacagctcgtccatgcc
a Capital letters indicate restriction sites.
b Underlined letters indicate homologous sequences for recombination and overlap PCR.
c Underlined and capital letters indicate randomized sequences for library construction.
d Primer names beginning with a “C” indicate primers used to check Red recombination.

19
Supplementary Methods
Construction of bacterial strains and plasmids
Phusion polymerase and restriction endonuclease were purchased from New England
Biolabs (Beverly, MA, USA). pGFKF was constructed by subcloning the amplified FRT-KanR-
FRT-BBa_J23100 into the pGEM T-Easy vector. pGFKF1 was constructed by polymerize chain
reaction (PCR)-based blunt-end ligation with ph-DNdeI-F and ph-DNdeI-R primers using
pGFKF as a template. pGFKF2 was constructed by adding a KpnI restriction site through PCR-
based site-directed mutagenesis with M-pGFKF2-F and M-pGFKF2-R primers using pGKF1 as
a template. pMD20-FKF(f72) was constructed by subcloning FRT(f72)-KanR-FRT(f72) fragment
amplified by FRT(f72)-Kan-F and FRT(f72)-Kan-R into the pMD20 vector and adding a KpnI
restriction site through PCR-based site-directed mutagenesis with FKF(f72)-AD-KpnI-F and
FKF(f72)-AD-KpnI-R primers.
All chromosomal work was done using the Red recombination system with pKD46 and
pCP20, as described in previous studies44,45. The WL0 strain was constructed by deleting the
chromosomal lysC gene of E. coli W3110 with an FRT-KanR-FRT fragment amplified by D-
lysC-F and D-lysC-R primers. The WL2 strain was constructed by constitutively overexpressing
the feedback-resistant lysC (lysCfbr) in the WL0 strain. lysCfbr, constructed by overlap PCR using
primers S-lysC-up-F, M-lysC-up-R, M-lysC-down-F, and S-lysC-down-R to introduce a point
mutation at nucleotide 1055 of the lysC gene24, was amplified with S-lysC-up-F and S-lysC-
down-R primers and inserted into the KpnI and SacI restriction sites of pGFKF2. Thereafter,
BBa_J23100-lysCfbr-FRT-KanR-FRT, amplified with P-lysC-F and P-lysC-R primers, was
introduced into the position of lysC in the WL0 strain by recombination. The WL3 strain was
constructed by overexpressing native and heterologous pathway enzymes for lysine production

20
and deleting genes for competing pathways. This was accomplished by amplifying the ddh gene
from Corynebacterium glutamicum with S-ddh-F and S-ddh-R primers and subcloning it into the
NdeI and XhoI restriction sites of pGFKF2. Then, the BBa_J23100-ddh-FRT-KanR-FRT
fragment, amplified with P-ddh-F and P-ddh-R primers, was introduced into the position of the
lac operon of the WL2 strain by recombination. The promoter regions of dapA, dapB, and lysA
of this latter strain were replaced with the BBa_J23100 promoter using P-dapA-F and P-dapA-R,
P-dapB-F and P-dapB-R, and P-lysA-F and P-lysA-R primers. Lastly, metL, thrA, and iclR were
deleted using fragments amplified with D-met-F and D-met-R, D-thr-F and D-thr-R, and D-iclR-
F and D-iclR-R primers, respectively. The WL4 strain was constructed by deleting ppc from the
WL3 strain using a fragment amplified with D-ppc-F and D-ppc-R primers. The WT0 strain was
constructed by deleting the chromosomal aroG of E. coli W3110 with an FRT-KanR-FRT
fragment amplified with D-aroG-F and D-aroG-R primers. Each strain was confirmed by PCR
and sequencing using primers listed in Supplementary Table S4.
LysRiboMut was constructed by site-directed mutagenesis of LysRibo with
LysRiboMut-G31C-F and LysRiboMut-G31C-R primers. The region for the point mutation to
disable lysine binding to the aptamer was selected based on the previous study21. The mutation
that disabled the function of B. subtilis lysine riboswitch (G39C for B. subtilis lysine riboswitch)
was introduced in the corresponding conserved region of E. coli lysine riboswitch (G31C).
RiboNULL was constructed by assembling the BBa_J23100-lysC_UTR-sgfp fragment using
overlap PCR of two fragments: one amplified with Pro-LUTR-F and LUTR-R primers using
genomic DNA of E. coli W3110 as a template, and the other amplified with L-sgfp-F and sgfp-R
using the sgfp gene as a template. The overlap-PCR product, amplified by KpnI-Pro-F and sgfp-
R, was inserted into KpnI and SacI restriction sites of pACYCDuet. LysRibo was constructed as

21
described above for BBa_J23100-lysC_UTR-tetA except using L-tetA-F and tetA-R to amplify
tetA from pBR322 (Fermentas, Glen Burnie, MD, USA).
The promoter library for ppc was constructed by first inserting ppc, amplified with S-
ppc-F and S-ppc-R primers, into the KpnI and SacI restriction sites of a modified pCDFDuet
plasmid. Additionally, adapter sequences for next generation sequencing were added by PCR-
based blunt-end ligation using ph-UTR-ppc-F and ph-UTR-ppc-R primers, resulting in pCDF-
ppc, which is the template for ppc promoter library generation. The ppc promoter library was
generated by PCR-based blunt-end ligation using ph-J23N-F and ph-J23N-R primers, which
fully randomize the -35 and -10 boxes of the BBa_J23100 promoter (pCDF-ppc-Lib). The top 3
enriched ppc promoter sequences were integrated into the genomic region. Each enriched
plasmid was digested by KpnI and SacI restriction sites and ligated into pMD20-FKF(f72). Using
FL-ppc-F and FL-ppc-R primers, each ppc region containing enriched promoter sequences was
amplified and introduced into the position of the genome through Red recombination.
The Tryptophan Riboselector library plasmid (TrpRibo_Lib) was constructed by
combining the tetA fragment (amplified by T-tetA-F and T-tetA-R primers using pBR322 as a
template) and the sgfp fragment (amplified by T-sgfp-F and T-sgfp-R using the sgfp gene as a
template), amplifying the resulting fragment by overlap PCR using T-tetA-F and T-sgfp-R (tetA
and sgfp are fused by a GGGSx4 linker16), and ligating it into KpnI and SacI restriction sites of a
modified pACYCDuet vector. This plasmid was amplified by ph-T-Library-F and ph-T-Library-
R primers and blunt-end ligated to generate the Tryptophan Riboselector library (TrpRibo_Lib)..
Detection of intracellular lysine concentrations
In order to measure the intracellular concentrations of lysine, cells were cultured in

22
same media used for survival tests in mixed culture (WL0, WL1, and WL2 in M9 and WL2 and
WL3 in complemented M9). At mid-exponential phase, cells were harvested and prepared as
described in a previous study46. The detection of intracellular lysine was performed by Korea
Basic Science Institute (KBSI) using phenylisothiocyanate (PITC) derivatization method coupled
with reversed-phase LC column chromatography (Nova-Pak C18; Waters, Milford, MA, USA)
using an Agilent 1100 Series HPLC system (Agilent, Palo Alto, CA, USA) with UV detector at
254 nm.
Fluorescence affected by the leader region of E. coli lysC
The response of the leader region of lysC to intracellular lysine concentration was tested
by inoculating fresh seeds of WLN0 and WLN1 strains in 4 mL of M9 medium containing 34
μg/mL of chloramphenicol and all amino acids, except lysine. After 6 hours of incubation,
fluorescence intensity was measured. Specific SGFP activity was defined as fluorescence
normalized to the OD600 value of the culture after subtracting normalized fluorescence values of
negative controls. The density of E. coli was measured at a wavelength of 600 nm using a UV-
1700 spectrophotometer (Shimadzu, Kyoto, Japan). Fluorescence was detected using a
VICTOR3TM 1420 Multilabel Counter (PerkinElmer, Waltham, MA, USA). The detection was
carried out using a 486-nm excitation filter and a 535-nm emission filter with a 1-sec
measurement time.
23
Supplementary References
44 Lim, S. I., Min, B. E. & Jung, G. Y. Lagging strand-biased initiation of red recombination
by linear double-stranded DNAs. J. Mol. Biol. 384, 1098-1105 (2008).
45 Datsenko, K. A. & Wanner, B. L. One-step inactivation of chromosomal genes in
Escherichia coli K-12 using PCR products. Proc. Natl. Acad. Sci. U. S. A. 97, 6640-6645
(2000).
46 Tweeddale, H., Notley-McRobb, L. & Ferenci, T. Effect of slow growth on metabolism of
Escherichia coli, as revealed by global metabolite pool ("metabolome") analysis. J.
Bacteriol. 180, 5109-5116 (1998).