interrelationship of indoor particulate matter and
TRANSCRIPT

Interrelationship of Indoor particulate matter andRespiratory dust deposition of women in theresidence of Dhanbad City, IndiaSHRAVAN KUMAR
IITISM: Indian Institute of TechnologyManish Kumar Jain ( [email protected] )
IITISM: Indian Institute of Technology https://orcid.org/0000-0001-9898-0382
Research Article
Keywords: Household Air Pollution, Women's health, size segregated PM, RDDs, Exposure Index, HazardQuotient
Posted Date: May 11th, 2021
DOI: https://doi.org/10.21203/rs.3.rs-446710/v1
License: This work is licensed under a Creative Commons Attribution 4.0 International License. Read Full License
Version of Record: A version of this preprint was published at Environmental Science and PollutionResearch on August 19th, 2021. See the published version at https://doi.org/10.1007/s11356-021-15584-w.

1
Interrelationship of Indoor particulate matter and Respiratory dust deposition of women 1
in the residence of Dhanbad City, India. 2
Authors name: Shravan Kumar1, Manish Kumar Jain*2 3
1. Research Scholar, Department of Environmental Science and Engineering, IIT(ISM) 4
Dhanbad, Jharkhand 826004, India 5
2. Associate Professor, Department of Environmental Science and Engineering, IIT(ISM) 6
Dhanbad, Jharkhand 826004, India 7
*Corresponding author's Email id: [email protected] Ph no.: 9431711095 8
9
10
11
12
13
14
15
16
17
18
19
20
21
22
23
24
25

2
Abstract 26
Women spend relatively more time in indoor conditions in developing countries. Exposure to 27
various indoor air pollutants leads them to higher health risks according to Household air 28
quality in which they reside. Particulate matter (PM) exposure with their exposure duration 29
inside the household plays a significant role in women's Respiratory problems. We measured 30
size segregated particulate matter concentrations in 63 residences at different locations. 31
Respiratory dust depositions (RDDs) for 118 women in their different respiratory regions like 32
head-airway (HD), tracheobronchial (TB), and alveolar (AL) region for the three PM size 33
fractions (PM10, PM2.5 & PM1) were investigated. For different positions like Light exercise 34
and the Sitting condition, RDD values found for AL region was 0.091 μgmin−1 (SD: 0.067, 35
0.012-0.408) and 0.028 μgmin−1 (SD: 0.021, 0.003-0.126) for PM10, 0.325 μgmin−1 (SD: 0.254, 36
0.053-1.521) and 0.183 μgmin−1 (SD: 0.143, 0.031-0.857) for PM2.5, 0.257 μgmin−1 (SD: 0.197, 37
0.043-1.04) and 0.057 μgmin−1 (SD: 0.044, 0.009-0.233) respectively for PM1 to females. 38
RDDs values in the AL region significantly increases as PM10 (11%), PM2.5 (68%), and PM1 39
(21%), confirm that for women, the AL region is the most prominent affected zone by fine 40
particles (PM2.5). 41
42
43
44
45
46
47
48
Keywords –Household Air Pollution, Women's health, size segregated PM, RDDs, Exposure 49
Index, Hazard Quotient, 50
List of abbreviations: PM: Particulate matter, HAP: Household air pollution, RDDs: 51
Respiratory dust depositions, HD: Head airway, TB: Tracheobronchial, AL: Alveolar, I/O: 52
indoor-outdoor, EI: Exposure index, HQ: Hazard Quotient 53
54

3
1. INTRODUCTION 55
Household Air Pollution (HAP) is prevalent in developing countries like India, but its resultant 56
impact is detrimental for all, and therefore, it is a significant area of study (Smith 2000; Smith 57
and Mehta 2003). HAP negatively impacts the health and life quality of individuals. The health 58
risks associated with HAP include respiratory problems and premature deaths (Beelen et al. 59
2014a). HAP is among those leading environmental pollutants, which causes risk factors and 60
increases the global burden of disease. It has been accountable for 1.6 million deaths and 59 61
million disability-adjusted life years in 2017 (Stanaway et al. 2018). Africa and Southeast 62
Asian countries are the most affected nations due to the rise of HAP exposure in the developing 63
world (WHO 2011). HAP depends on many variables such as the type of fuel that is being used 64
for cooking, various kitchen facilities, household structural features, house ventilation, 65
smoking history, house location, geographical conditions, and various other activity patterns 66
within that period of exposure (Wu et al. 2007; Begum et al. 2009; Pant et al. 2016; Sidhu et 67
al. 2017; Datta et al. 2017; Rohra et al. 2018; Prabhu et al. 2019a; Benka-Coker et al. 2020). 68
For cooking purposes, people in India use mainly two fuel types (The Census of India 2011). 69
Solid fuels commonly consist of coal, cow dung cake, wood, crop residue, and in clean fuels, 70
primarily electricity and Liquefied Petroleum Gas (LPG) (Pandey and Chaubal 2011; Sidhu et 71
al. 2017). An estimated population of about 28% of India's urban population engages in 72
biomass fuels for cooking (The Census of India 2011; Bhole 2017). A survey by the Health 73
Effect Institute (HEI) estimated 1.8 million premature deaths and 48.7 million disability-74
adjusted life years (DALYs) due to HAP exposure in India (GBD MAPS Working Group, 75
2018) (Sharma and Jain 2019). 76
In the Indian scenario, Particulate Matter (PM) is of significant concern for HAP. PM affects 77
the microenvironment and contributes to escalating a significant particulate dose amount in the 78
ambient atmosphere (Kesavachandran et al. 2015; Kumar and Goel 2016a). In 2010, HAP 79
accounted for 16% of the total ambient PM concentration (Hime et al. 2018). The burning of 80
fuels for cooking purposes generates a substantial PM level, which significantly affects its 81
surrounding population in both urban and rural regions (Smith and Mehta 2003; Fullerton et 82
al. 2008; de la Sota et al. 2018). Aerodynamic diameter is the key point for PM size fractions. 83
Particles classified as thoracic (PM10, particles size<10μm), coarse (PM2.5-10, 2.5μm<particles 84
size<10μm), fine (PM2.5 and PM1, particles size<2.5μm) and ultra-fine particles (particles 85
size<0.1μm) (Daigle et al. 2003; Singh et al. 2015a; Kesavachandran et al. 2015). Exposure of 86
fine particles (PM2.5) to long term reflects the curtailment from 8.5 to 20 months in average life 87

4
expectancy, and increment in the cardiopulmonary mortality risk by 6–13% per 10 mg per 88
cubic meter of PM2.5 (Evans et al. 2013; Datta et al. 2017). Extended exposure to PM, 89
particularly to the fine and ultrafine particles, elevates the risk for health disorders like 90
respiratory infections, aggravation of chronic lung diseases, heart problems, stroke, eye 91
inflammation, tuberculosis, and cancer (Smith 2000; Balakrishnan et al. 2013; Singh et al. 92
2015b; Stanaway et al. 2018). Many studies have linked excessive PM concentrations in 93
households with adverse health effects (Massey et al. 2013; Jindal et al. 2020). In the elderly 94
residents of Sao Paulo (Brazil), PM10 and PM2.5 were measured as 35.2 and 27.4 μg/m3 (Segalin 95
et al. 2017). For Kaohsiung City, Taiwan, household PM10 daily average value exceeds 62 96
μg/m3 (Yen et al. 2020). In various studies, the 24h average PM10 concentration was found in 97
between 200-500 μg/m3 for households using biomass fuels, depending on multiple parameters 98
like type of fuels, different cooking- stoves, housing structure (Barnes et al. 2011; Beelen et al. 99
2014b; Adesina et al. 2020). A study (Smith and Mehta 2003) based on PM2.5 concentration in 100
Guatemalan village showed the value exceeded 5000 μg/m3. In Nepal, the PM2.5 values crossed 101
8000 μg/m3 for households using an open fire, while it exceeded 3000 μg/m3 for homes using 102
Kerosene (Lohani 2011). In Punjab, cooking with biomass fuel resulted in PM2.5 values of up 103
to 697 μg/m3 for the household enclosed kitchen (Sidhu et al. 2017). 104
The vulnerability of different sections of the population to HAP depends on several factors, 105
including their age, gender, surrounding meteorological parameters, socioeconomic conditions, 106
and pre-existing health conditions (Pant et al. 2016; Hime et al. 2018). Previous research 107
(Simoni et al. 2004; Pandey and Chaubal 2011) delineated that women spent unquestionably 108
more time in indoor conditions than men in India. Women are the most vulnerable to HAP as 109
higher levels of exposure due to more residence time in houses (more than 80%). For women's 110
household chores, cooking is considered the highest share in most countries. In developing 111
countries, females, compared to men, contribute more than 75 percent to cooking activities 112
(Mishra 2003). The Exposure assessment of vulnerable individuals is essential in assessing the 113
possible health risk under various Household air pollutants. This evaluation can be achieved 114
either by personal monitoring or by monitoring the specific area, accompanied by 115
questionnaires survey with different time-activity patterns (Gupta and Elumalai 2017; Sidhu et 116
al. 2017; de la Sota et al. 2018). It can further be established in a particulate dose in the lungs 117
and can be used to understand or predict potential health risks (Sharma and Jain 2019). Very 118
few studies have been recorded on Respiration dust deposition due to PM in women, 119
particularly during cooking in urban household settings, where they mostly use LPG (Varghese 120
5
et al. 2005). Health hazards of increasing household PM concentrations have been discussed in 121
several previous studies (Olmo et al. 2011; Arbex et al. 2012; Morris et al. 2012; Weuve et al. 122
2012; Mehta et al. 2016; Bai et al. 2020). Notwithstanding, different particle sizes with their 123
exposure dose, duration, and particle deposition behaviour in human bodies, are still required 124
for a comprehensive review. It gives rise to the need for continuous household air quality 125
monitoring. 126
Air quality is a much-concerned factor for Dhanbad city, popularly known as India's Coal 127
Mining Capital. In the report of the Central Pollution Control Board (CPCB 2009) of India, 128
Dhanbad had been identified as one of the "Critically Polluted Areas." A study (Gupta and 129
Elumalai 2017) of PM conducted found that it can have adverse effects on the people dwelling 130
in the Dhanbad region; also, it gave an alarming result of the respiratory diseases with an 131
average RDD value in the Alveolar region (AL) of 0.288μg min-1, 0.569 μg min-1 and 0.663μg 132
min-1 for PM10, PM2.5 and PM1 respectively for women. 133
Therefore, this present study mainly concentrates on 134
- Correlating HAP and its associated impacts on Respiratory Dust Depositions (RDDs) 135
of women. 136
- Evaluating the Exposure Index (EI) and Hazard Quotient (HQ) to determine exposure. 137
To accomplish these goals, real-time continuous monitoring of the Size segregated PM within 138
the household was carried out, along with different activity patterns records of women within. 139
2. Study area and methodology 140
2.1 Sampling site 141
Dhanbad is popularly known as the coal-mining capital of India. It is situated in Jharkhand 142
state, having the Jharia coalfield range. Its geographical coordinates are 23.79°N and 86.43°E, 143
respectively. Measurement of particulate matter concentration and particle count was 144
conducted in selected households in the various area represents the suburban residential 145
conditions. We measured outdoor ambient PM concentrations in the surrounding regions for 146
indoor-outdoor interaction. Major selected areas comprise Dhaiya Basti (which was primarily 147
a slum area), IIT(ISM) Dhanbad (a national level institution for Science and Engineering), 148
Hirapur (old city area with mixed Socio-Economical status). Fig 1 depicts the study area 149
locations in the Dhanbad city of Jharkhand State. 150

6
151
Fig 1: Study Area 152
2.2 Study population and questionnaire 153
A questionnaire survey was performed to screen and quantify the household and indoor areas 154
such as kitchen conditions, fuel used, cook-stove type, indoor conditions (ventilation, etc.). 155
After a peer literature review and applicability in the study area, the questions were developed 156
in the questionnaire (Bird 2009). For socioeconomic status (SES), we used the modified BG 157
Prasad scale and Kuppuswamy scale in our questionnaire (Bird 2009). The questions asked in 158
the survey appertain to general overview on fundamental attributes (Physical characteristics 159
(age, height, weight) and educational qualification), respiratory health status (cold, cough, 160
headache, chest tightness and breathlessness), number of family members, house structures and 161
residing time in indoor conditions in different locations inside the house (Prabhu et al. 2019b). 162

7
The data collected from women by direct interview and question-answer session. We provided 163
our vacant questionnaire and asked them to fill and return the same. "How many family 164
members are there in the house?" "What kind of fuel do you often use for cooking means?" 165
"How many times spend in the house?" "Do you involve in any light activities during the 166
residing hour?" We finally choose those women for our observation who gives satisfactory 167
replies in 'Yes,' and they were considered under our scrutiny. Several parameters including 168
ambient temperature, outdoor and indoor PM concentrations, socioeconomic status, primary 169
cooking fuel use (Coal, Liquefied petroleum gas (LPG), Electricity), household conditions, 170
kitchen structure, and its area, ventilation, smoking conditions in the house were considered 171
for the study of exposure assessment. Woman's age, education, occupation, and their various 172
activity inside the house are also considered. 173
Initially, we choose 67 households from the study area for our monitoring purposes. Out of 174
this, 4 does not support and permit monitoring. So finally, we had 63 residences in our count. 175
Out of 63 households, 32 are from the slum area comprising 1 or 2 room houses/ hut type 176
structure. 13 were apartments, and the remainder were detached houses, usually 1 or 2 storey 177
buildings. There was no external ventilation/exhaust system in slum areas and detached houses. 178
Window and door provide natural ventilation to them. Apartments have an air-conditioning 179
system in it. Coal is used in a handmade cook stove in the slum area for cooking purposes. LPG 180
cylinders and some electric cook-stoves are used for cooking purposes in the apartment. 181
Various activities by people residing in the home also increase the indoor pollutants there 182
(Ferro et al. 2004; Wu et al. 2007; Segalin et al. 2017; Adesina et al. 2020). In the various 183
household, there is no proper ventilation and windows. In the slum area, there is no separate 184
kitchen inside the household. Women from the study area spend more time than the other age 185
groups inside a residence, so they are more susceptible to indoor exposure and health risk. We 186
choose 125 women ages 19-65 years old (mean: 32±4 years) from the study area of concerned 187
63 household. Out of 125 women, 68 were from slum areas, 28 middle-class family and the 188
rest from the upper class in socioeconomic status with some refusal (N=7). 189
2.3 Instrumentation 190
An optical portable Aerosol Spectrometer (Grimm 1.109) was used for indoor particulate count 191
and mass. For continuous monitoring of particulate matter concentration during the sampling 192
period, we used it at a constant flow rate (1.2L/min) with a controller's help. 31 channel sizes 193
range from 0.25 to 32 μm particle size is measured by the Grimm with the certification issued 194

8
by NIST (National Institute of Standards and Technology). The dual technology principle is 195
used in the portable aerosol meter Grimm, i.e., the principle of light scattering for continuous 196
and real-time measurements and the collection of total particles by the size of the PTFE filters 197
47mm (Burkart et al. 2010; Gupta and Elumalai 2017). Grimm was routinely calibrated with 198
an accuracy of ±2 percent to ensure the precision of the collected data. All the required 199
background measurements and flow checks were performed for the instrument before each 200
monitoring. Q-Trak IAQ monitor (TSI model 7575x) was used for meteorological parameters 201
like temperature and relative humidity measurement. With the help of an anemometer (Kestrel 202
model 4500, Portable type), the wind speed was monitored. 203
2.4 Data collection method 204
Two-season monitoring was done in the study area. From 8 April 2019 to 12 July 2019 (95 205
days) for the summer season and between 30 November 2019 to 26 February 2020 (89 days) 206
for the winter season in different sampling locations of the study area. Different continuous 207
measurements were measured in every household in various places like the kitchen or where 208
cooking took place (In case of no separate kitchen), nearest room to the cooking location, and 209
restroom/bedroom. Instruments were mounted at the standard human breathing zone (1.5 m 210
from the ground) and 1.5 m away from the open doors/windows, where there was less chance 211
of damage to the instrument. Micro meteorological parameters such as temperature, relative 212
humidity, and wind speed were listed in the study area during the monitoring season (Table 213
S1). We used data collected for the meteorological parameter from an installed automation 214
weather station on the campus of IIT(ISM) Dhanbad for the reference site. Along with PM 215
monitoring, Respiratory health symptoms of women in the study area were assessed with the 216
help of a questionnaire. 217
2.5 Assessment of the respiratory dust depositions (RDD) 218
The RDD values for women residing in households were calculated for different day-to-day 219
activities, including sitting/resting and basic household chores with light exercise. The values 220
were calculated using equations given by the International Commission on Radiological 221
Protection (ICRP 1994). The ICRP equations were previously used in many studies(Azarmi 222
and Kumar 2016; Gupta and Elumalai 2017; Segalin et al. 2017; Sharma and Balasubramanian 223
2018). 224
RDD = (VT × f) × DF𝑖 × PM𝑖 …………………………..…………. (1) 225

9
VT represents the tidal volume (m3 per breath), f for the breathing frequency (breath per 226
minute), DFi denotes deposition fraction of a size fraction i, and PMi was the mass 227
concentration of different PM sizes. 228
The deposition fraction for the head airways region (DFHD) is 229 DF = IF × [( 11+exp(6.84+1.183∗ ln (dp))) + ( 11+exp(0.924−1.885∗ln(dp)))]………… (2) 230
Where dp is particle size in μm and IF is the inhalable fraction. 231
From the ICRP model, IF is given by 232 𝐼𝐹 = 1 − [0.5 ∗ (1 − ( 11+0.00076∗(dp)2.8))] ….………………………………….…. (3) 233
The value of deposition fraction for the tracheobronchial region (DFTB) is 234 𝐷𝐹 = (0.00352𝑑𝑝 ) × [exp(−0.234 ∗ (ln (𝑑𝑝) + 3.40)2) + (63.9 ∗ (exp(−0.891 ∗235 (ln (𝑑𝑝) − 1.61)2)))] ………………………………………………………………… (4) 236
The deposition fraction for the alveolar region (DFAL) is calculated by 237 𝐷𝐹 = (0.0587𝑑𝑝 ) × [exp(−0.416 ∗ (ln (𝑑𝑝) + 2.84)2) + (19.11 ∗238 (exp(−0.482 ∗ (ln(𝑑𝑝) − 1.362)2)))] …………………………………………… (5) 239
The total deposition was computed by adding the values of all the regional depositions. The 240
VT and f values were influenced by several factors like the gender of the person and the type 241
of activity being done. For different positions like light exercise and sitting position for 242
females, the VT values were considered 9.9×10⁻⁴ m3 per breath and 4.6×10⁻⁴ m3 per breath, 243
respectively. For females, f values for the above-mentioned two positions were taken as 21 and 244
14 breaths per minute, respectively (Hinds). 245
2.6 Exposure assessment 246
Various types of activities inside the household by the women on a regular basis, with their 247
different time spent, were recorded over 24 hours. Particulate concentrations in a different 248
microenvironment like kitchen, room near the kitchen, living room, etc., associated with time 249
spent pattern, by women were considered for developing the Exposure index. The Exposure 250
index for women based on their time activity was developed as below. 251

10
Exposure index (EI) 252
𝐸𝑖 = ∑ 𝐶𝑖 ∗ 𝑡𝑘𝑖𝐶𝑔 ∗ 𝑡𝑎𝐼𝑖 253
Where 254
Ei: Exposure index 255
Ci: Different PM Concentration in particular microenvironment k. 256
tki: Aggregate time that individual "k" spends in microenvironment I. 257
I: Different micro-environments where for a specified time, individual "k" resides. 258
Cg: PM WHO guideline value (25 & 50μg/m3 for PM2.5 & PM10 respectively). 259
ta: Aggregate time (24 h). 260
2.6.1. Development of Exposure index 261
Exceeding pollutants dose above permissible limits is a significant source of adverse health 262
effects. For the potential health effects of female residents due to indoor particulate, we use the 263
Health Risk Assessment (HRA) approach. This methodology deals with a two-step 264
measurement analysis. First, to assess the particles' toxicity in their exposure process (i.e., 265
inhalation, absorption, and dermal contact) and then measure the particles' exposure level in 266
the receptor. The toxicants, which are non-carcinogenic, give no significant exposure to 267
exposure ranging from zero to acceptable intake daily/reference level. When these average 268
dosage thresholds exceed the reference dose, the receptor is known to be at high risk to health 269
(Chao and Wong 2002; Dolk et al. 2010; Sánchez-soberón et al. 2015; Sidhu et al. 2017). 270
2.6.2 Intake concentration (IC) 271
Exposure can occur by different pathways like ingestion, inhalation, or dermal absorption in 272
the receptor (Kurt-Karakus 2012; Avila-Tang et al. 2013; Chen et al. 2016; Kumar and Goel 273
2016b). The inhalation of particles can originate various respiratory diseases with chronic 274
health risks. International Agency for Research on Cancer (IARC 2013) declares PM as 275
carcinogenic to individuals (Loomis et al. 2014). Here we mainly focus on the women in the 276
study area, which indulge in the cooking process. Women's exposure to fine particles (PM2.5) 277
was determined in previous studies by considering the inhalation tract (Guo et al. 2004; Liao 278
et al. 2019). Exposure duration and frequency with activity patterns were significantly 279
impacted on exposure. The average hour for cooking was evaluated from the total daily time 280

11
pattern. The exposure duration selected 20 years, as women spending more than 15 years 281
cooking are at higher risk of COPD and other respiratory diseases (Alim et al. 2014; Hystad et 282
al. 2015). The USEPA method is used to assess the potential intake concentration of PM10 & 283
PM2.5 (Morris et al. 2012; Bluyssen et al. 2016; Human 2019). With the assistance of an updated 284
methodology, Intake concentration was determined utilizing the modified Eq. (2) (Forum 2019; 285
Human 2019). 286
The chronic Intake concentration has been determined using the following calculation 287
(USEPA, 2009). 288
𝑰𝑪 = (CA × ET × EF × ED)𝐴𝑇 289
Where: 290
IC (μg/m3) = Intake concentration (defined as time weighted average concentration dependent 291
on the exposure pattern); 292
CA (μg/m3) = PM concentration. 293
ET = Exposure time (the period over which a person is supposed to be exposed during a normal 294
day) that was 3.5 h/day for coal users and 4.5 h/day for clean fuel users, in our study. 295
EF (days/year) = Exposure frequency (defined as the amount of exposure events over an 296
exposure duration) taken as 350 days/year. 297
ED (years) = Exposure duration (the period during which a person is exposed to lifetime), taken 298
as 20 years for female residents. 299
AT = Averaging time (period over which exposure is averaged) that equals to ED in years×365 300
days/year×24 h/day for non-carcinogens. 301
All of the default mentioned above values have been added, considering the residential criteria 302
specified in USEPA (2014) and used in Indian study (Sidhu et al. 2017; Deepthi et al. 2019). 303
2.6.3 Toxicological risk 304
Hazard Quotient is used as an indicator of toxicological risk. As per the hazard quotient method 305
recommended by USEPA, 2005 Eq. 3, it is characterized as the proportion between 306
consumption fixation (Intake concentration) and the reference dose (Reference concentration). 307
Here reference concentration for PM10 & PM2.5 was taken the same as the WHO guideline (50 308
& 25 μg/m3). As neither WHO nor NAAQS provides a standard value for PM1 in 309
Ambient/Indoor Air quality, the value of finer particles (PM1) cannot be compared with any 310
given standards. HQ values less than 1 do not impact significant effects on human health. More 311
than 1 HQ value might raise concern for the potential risk of human health. 312
Hazard quotient 313

12
𝐻𝑄 = 𝐼𝐶𝑅𝑓𝐶 Where, 314
IC: Intake concentration (PM10 & PM2.5, μg/m3) 315
RfC: Reference concentration (PM10 & PM2.5, μg/m3) 316
2.7 Statistical analysis 317
All the statistical analyses were performed using the SPSS 26.0 tools, Origin 2019b and 318
Microsoft Excel 2013. Physical characteristics (age, height, weight, BMI) among women in 319
the household were compared by student t-test using mean values. A Chi-square test assesses 320
the significance of respiratory symptoms. Descriptive statistics were initially investigated for 321
continuous PM data and other micro-environmental parameters. In comparison, skewness was 322
used to determine the data distribution is symmetrical or asymmetrical. Variation of seasonal 323
particulate matter and ratios indoor/outdoor were also measured, consistent with 324
meteorological parameters. The Pearson correlation coefficient compared the degree of indoor-325
outdoor PM at the monitoring sites. The Mann-Whitney U test has been used to compare two 326
non-parametric and independent samples (for example, such as a pollutant concentration in two 327
separate fuel types). This test compares with the median in order to assess that there are two 328
samples from the same population. The tests for p < 0.05 were considered as significant. The 329
linear regression analysis was used to predict the trend analysis of RDDs under various 330
household conditions. It compares the values of the RDDs as dependent variables in different 331
regions HD, TB, and AL and different PM fractions (PM10, PM2.5 & PM1) as independent 332
variables. 333
3. Result and discussion 334
3.1 Questionnaire Survey 335
Our investigation's primary objectives were to epitomize the indoor air conditions and their 336
exposures for the women, assess the relationship between PM and RDDs, and thus recognize 337
various factors connected with women's exposure to PM like individual behaviour, household 338
conditions, and indoor micro environmental factors. 339
In IIT(ISM) area, the average participant was found with higher education. In the slum area, 340
mostly completed primary school (81%), and the rest had completed secondary school (19%). 341
Most women (90%) were housewives, although a few engaged in domestic work (7%) in other 342
houses for livelihood. Out of 63 households in the study area, for the vital source of energy, 343

13
traditional fuels (coal) were used in 33 houses (52%), kerosene used in 8 houses (13%), and 344
the remaining 22 houses (35%) used LPG and electricity (clean fuels). Based on our 345
Questionnaire survey, the result found in the study area is summarised in Table 1. Significant 346
differences were found in the physical characteristics of the women in the study area (p<0.01) 347
(Table 1). 348
Table 1: Outcomes of Questionnaire Survey 349
Characteristic Dhaiya
Slum
Hirapur IIT(ISM)
Number of women to response (N) 68 28 22
Number of meals made per day (n) 2±1 3±1 3±1
Fuel use Coal,
Biomass
LPG LPG,
Electricity
Cooking duration (hr) 3±0.5 5±0.5 4±0.5
Residing duration in different locations:
Living room (hr.) 12±0.5 12±0.5 9± 0.5
Kitchen (hr.) 3±0.5 5±0.5 4±0.5
Outdoor within the home (hr.) 5±0.5 4±0.5 6±0.5
Away from home (hr.) 4±0.5 3±0.5 5±0.5
Family size (n) 5±2 7±1 5±2
Total Residing time in that house (years) 13±3 12±5 9±5
Age (yr)(mean)
(min-max)
27±5a
(19-65)
32±6
(23-63)
33±5
(25-60)
Height (cm) 150±5.8 155±6.2 156±8.4
Weight (kg) 40±15 45±15 45±15
Body mass index (kg/m2) 22.6±2.7 22.9±2.6a 23.6±2.3
Smoking history (%) 1.1 0.1 0.6

14
Respiratory health status (number out of total N)*
No symptoms (%)
Breathless (%)
Cold (%)
Cough (%)
Cold & cough (%)
Headache (%)
Chest tightness (%)
Tired/strained eyes (%)
06(8.82)
04(5.88)
12(17.65)
13(19.11)
11(16.17)
10(14.70)
07(10.29)
05(7.35)
10(35.71)
03(10.71)
04(14.29)
02(7.14)
02(7.14)
03(10.71)
03(10.71)
01(3.57)
11(50)
02(9.09)
03(13.64)
02(9.09)
01(4.55)
01(4.55)
01(4.55)
01(4.55)
Ventilation None Some Adequate
ap < 0.05, *Nonsignificant difference 350
3.2 Time activity pattern of Women indoor 351
PM concentration varies significantly, according to multiple activities in an indoor 352
environment. As per the daily time spent and activities of women recorded in the study area, it 353
was found that women spent between 4-5 hours per day for cooking purposes based on various 354
locations (p<0.01) (Fig 2). 355
356

15
Fig 2: Time activity pattern in different locations 357
3.3 Size segregated PM 358
3.3.1 Temporal variation of PM concentration 359
The difference in PM concentrations during cooking and other than cooking periods is 360
significantly high, which depicts that cooking is a significant source of PM concentrations in 361
the study area's household. Data collected for PM shows, morning time in both the winter and 362
summer periods gives significantly higher PM concentrations than the evening period (p<0.01) 363
(Fig 3 a, b). The majority of households used to prepare breakfast and lunch together. So 364
morning cooking time is more in the study area because the number of items cooked in the 365
morning period is more than the evening period, which causes higher exposure to women. PM 366
concentration in the early morning, when human activities start, shows lower value. A gradual 367
increase in PM vales was observed with the onset of household activities like cooking, the 368
peaks being between 9-10 am. A decrease in PM concentration between the noon and evening 369
was noted in all the locations, majorly in IIT(ISM) area. The other areas were affected by 370
outdoor vehicular pollution at the selected time range. At night, indoor PM concentration 371
increases with the cooking period (6-9 pm), and then downturn observes as less outdoor 372
vehicular pollution occurs after 9 pm in the nearby area. The cooking times influenced the 373
indoor air PM concentrations, as seen in Fig. 3 (a, b). During cooking times, PM2.5 and PM10 374
levels reached up to 800 g/m3 and 1000 g/m3, respectively, although they were below 60 g/m3 375
and 100 g/m3 during non-cooking hours in winter. Almost the same trend follows in summer. 376
Seasonal changes in temporal variation are not highly significant inside the household 377
(p<0.05). The same pattern was observed in (Sharma and Jain 2019) as indoor PM varies from 378
morning to noon. 379

16
380
Fig 3 (a): PM variation during Winter time 381
Fig 3 (b): PM variation during Summer time 382
17
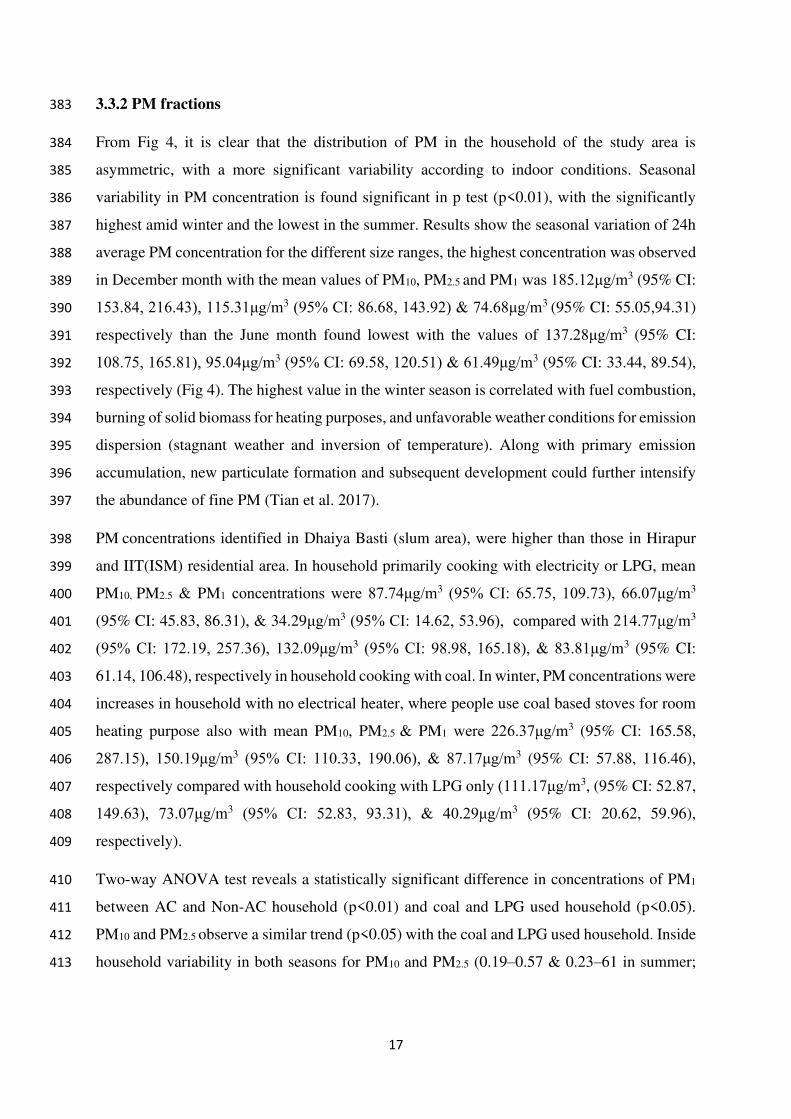
3.3.2 PM fractions 383
From Fig 4, it is clear that the distribution of PM in the household of the study area is 384
asymmetric, with a more significant variability according to indoor conditions. Seasonal 385
variability in PM concentration is found significant in p test (p<0.01), with the significantly 386
highest amid winter and the lowest in the summer. Results show the seasonal variation of 24h 387
average PM concentration for the different size ranges, the highest concentration was observed 388
in December month with the mean values of PM10, PM2.5 and PM1 was 185.12μg/m3 (95% CI: 389
153.84, 216.43), 115.31μg/m3 (95% CI: 86.68, 143.92) & 74.68μg/m3 (95% CI: 55.05,94.31) 390
respectively than the June month found lowest with the values of 137.28μg/m3 (95% CI: 391
108.75, 165.81), 95.04μg/m3 (95% CI: 69.58, 120.51) & 61.49μg/m3 (95% CI: 33.44, 89.54), 392
respectively (Fig 4). The highest value in the winter season is correlated with fuel combustion, 393
burning of solid biomass for heating purposes, and unfavorable weather conditions for emission 394
dispersion (stagnant weather and inversion of temperature). Along with primary emission 395
accumulation, new particulate formation and subsequent development could further intensify 396
the abundance of fine PM (Tian et al. 2017). 397
PM concentrations identified in Dhaiya Basti (slum area), were higher than those in Hirapur 398
and IIT(ISM) residential area. In household primarily cooking with electricity or LPG, mean 399
PM10, PM2.5 & PM1 concentrations were 87.74μg/m3 (95% CI: 65.75, 109.73), 66.07μg/m3 400
(95% CI: 45.83, 86.31), & 34.29μg/m3 (95% CI: 14.62, 53.96), compared with 214.77μg/m3 401
(95% CI: 172.19, 257.36), 132.09μg/m3 (95% CI: 98.98, 165.18), & 83.81μg/m3 (95% CI: 402
61.14, 106.48), respectively in household cooking with coal. In winter, PM concentrations were 403
increases in household with no electrical heater, where people use coal based stoves for room 404
heating purpose also with mean PM10, PM2.5 & PM1 were 226.37μg/m3 (95% CI: 165.58, 405
287.15), 150.19μg/m3 (95% CI: 110.33, 190.06), & 87.17μg/m3 (95% CI: 57.88, 116.46), 406
respectively compared with household cooking with LPG only (111.17μg/m3, (95% CI: 52.87, 407
149.63), 73.07μg/m3 (95% CI: 52.83, 93.31), & 40.29μg/m3 (95% CI: 20.62, 59.96), 408
respectively). 409
Two-way ANOVA test reveals a statistically significant difference in concentrations of PM1 410
between AC and Non-AC household (p<0.01) and coal and LPG used household (p<0.05). 411
PM10 and PM2.5 observe a similar trend (p<0.05) with the coal and LPG used household. Inside 412
household variability in both seasons for PM10 and PM2.5 (0.19–0.57 & 0.23–61 in summer; 413

18
0.17–1.24 & 0.25–1.36 in winter) was lower than inter-house variability (0.68 & 0.74 in 414
summer; 1.26 & 1.31 in winter) (S2). 415
416
Fig 4: Seasonal variation in PM concentration 417
3.3.3 PM Size Distribution 418
This ratio is significant because the time of residence of fine PM is longer than several days, 419
which raises the risk of lung disease (Paulin and Hansel 2016). During the entire sampling 420
period, the PM fractions show a normal fluctuation with the mean ratios of different particle 421
sizes PM2.5/PM10, PM1/PM10, PM1/PM2.5, which is equal to 0.738, 0.487, and 0.524, 422
respectively. Concentrations of indoor PM10 and PM2.5 were moderately correlated (r=0.73, 423
95%CI: 0.60, 0.84) with a stronger summer correlation (r=0.92, 95%CI: 0.84, 0.98) compared 424
to winter (r=0.68 95%CI: 0.46, 0.84) respectively. Comparable values were reported in some 425
previous studies. (de la Sota et al. 2018) found PM2.5/PM10 value equal to 0.625 on average, 426
while this ratio varied from 0.40 to 0.64 in Bangladesh (Begum et al. 2009). 427
The ratio PM2.5/PM10 has lower values in the household using LPG, indicating lower PM2.5 428
mass emissions as compared to coal user. High ratios in Dhaiya slums show the more presence 429
of finer particles inside homes. Coal uses for cooking inside the house, and vehicular pollution 430

19
by attached roads influences the abundance of fine particles loading in those households. 431
PM2.5/PM10 ratio was found higher during cooking periods in all households with an average 432
of 0.85. Low PM2.5/PM10 ratios (0.41 on average) were measured during non-cooking periods. 433
This may be due to various factors such as resuspension of indoor-outdoor dust, residents' 434
activities, household structures like closed and open kitchens, etc. This emphasizes the 435
importance of fine particles in household during cooking times and their coarser nature during 436
non-cooking periods. Different ventilation rates, kitchen structure, and the interval between 437
cooking periods may be the reason for the differences in the PM2.5/PM10 ratio value. 438
3.3.4 Ind-out interaction 439
As slum areas are closer to the road network, heavy traffic generates high loading PM, which 440
directly enters the residence. Weather conditions, tightness of buildings, indoor accessories like 441
air conditioners, exhaust fans, windows, doors, etc., also affect the ind-out air exchange (Chao 442
and Wong 2002). Mean outdoor 24 h average PM10, PM2.5 & PM1 concentrations in study area 443
tabulated in Table 2 based on seasonal variation. The seasonal variation of outdoor air quality 444
between winter and summer was more than the month-to-month variation. 445
Table 2: Ind-out interaction in different locations 446
Monitoring
period
Winter Summer
Dhaiya
PM10 143.21μg/m3(95% CI:112.63,173.48) 123.42μg/m3 (95% CI: 94.79, 151.79)
PM2.5 112.87μg/m3 (95% CI: 79.72, 145.89) 85.69μg/m3 (95% CI: 65.63, 108.63)
PM1 73.68μg/m3 (95% CI: 41.32, 106.14) 57.93μg/m3 (95% CI: 38.26, 78.86)
Hirapur
PM10 129..37μg/m3(95% CI: 78.59, 173.89) 104.42μg/m3 (95% CI: 61.43, 147.42)
PM2.5 103.79μg/m3 (95% CI: 75.96, 129.96) 74.71μg/m3 (95% CI: 35.97, 113.17)
PM1 57.19μg/m3 (95% CI: 39.56, 74.53) 48.17g/m3 (95% CI: 29.24, 67.19)
IITISM
PM10 85.11μg/m3 (95% CI: 63.11, 106.89) 64.23μg/m3 (95% CI: 44.02, 84.57)

20
PM2.5 59.72μg/m3 (95% CI: 39.47, 79.95) 48.97μg/m3 (95% CI: 29.15, 68.62)
PM1 38.94μg/m3 (95% CI: 20.87, 57.64) 29.34μg/m3 (95% CI: 13.89, 46.79)
447
The weighted mean concentrations of PM10 and PM2.5 outside the home indicate that outdoor 448
air is the dominant source of indoor PM10 and PM2.5. As a result, infiltration/ventilation is a 449
key factor in determining indoor PM10 concentrations in the household. Indoor sources such as 450
cooking, smoking, biomass burning for heating, and incense burning lead to particulate matter 451
production. Simultaneously, higher concentrations in monitoring locations can be due to road 452
and soil particles re-suspension in the air. Wide variations in indoor and outdoor PM10, PM2.5, 453
and PM1 were found with skewness of 0.18-0.29 for PM10, 0.23-0.55 for PM2.5, and 0.07-0.95 454
for PM1. Through applying single-way Anova (SPSS 26.0) to mean particulate concentrations 455
in all households in the Dhaiya slum, significant values (p=0.256) for PM10, PM2.5 and PM1 456
were found to be more than 0.05. It implies no substantial variation between the PM 457
concentrations of such houses and thus has common sources that lead to particulate pollutant 458
production in their environment. 459
3.4 Respiratory dust depositions (RDDs) 460
3.4.1 Respiratory dust depositions (RDDs) for Women 461
Estimating RDDs values for size segregated PM illustrates PM's depositions in the various 462
region of the respiratory tract (Sharma and Balasubramanian 2018). Generally, cooking done 463
by the women has in a sitting and standing position. The woman does not carry out heavy 464
exercises at indoor conditions, so we calculated the RDDs by considering two positions like 465
seated position and light exercise for females. PM exposure of the indoor condition was 466
analyzed for the RDDs in all three regions (HD, TB, and AL) for females inside house premises 467
during seated position and light exercise. Particulate deposition in various airways depends 468
mainly on variations in airways' geometric structure (Jaques and Kim 2000). Due to an increase 469
in breathing frequency by light exercise, the accumulation of PM in the respiratory tract's 470
airways increases and thus gives a higher RDD value than the sitting posture (Hinds). 471
In the given expressions for RDDs, we follow the assumption that all particles (100%) infiltrate 472
via nose or mouth to the respiratory tract. The total RDDs are the summation of the value 473
observed in the entire three regions (HD, TB & AL). Figure 4 provides an estimation of RDDs 474

21
due to different particle sizes (PM10, PM2.5 & PM1) during two different positions, i.e., seated 475
and light exercise conditions. 476
The RDDs observed in the HD region is 3.795 μgmin−1 (SD: 2.781, 0.521-17.118) for PM10, 477
2.078 μgmin−1 (SD: 1.625, 0.339-9.706) for PM2.5, and 0.603 μg min−1 (SD: 0.462, 0.101-478
2.446) for PM1 during light exercise. On the other hand, the observed RDDs value in HD region 479
was 1.176 μgmin−1 (SD: 0.862, 0.162-5.303) for PM10, 0.643 μgmin−1 (SD: 0.503, 0.105-3.007) 480
for PM2.5, and 0.187 μgmin−1 (SD: 00143, 0.032-0.758) for PM1 during cooking and seated 481
position. During different positions like Light exercise and the Sitting condition, values found 482
for TB region was 0.071 μg min−1 (SD: 0.052, 0.009-0.320) and 0.022 μg min−1 (SD: 0.016, 483
0.003-0.099) for PM10, 0.101 μg min−1 (SD: 0.079, 0.017-0.471) and 0.057 μg min−1 (SD: 484
0.044, 0.009-0.265) for PM2.5, 0.079 μg min−1 (SD: 0.061, 0.013-0.323) and 0.017 μg min−1 485
(SD: 0.014, 0.003-0.072) respectively for PM1 to females. For different positions like Light 486
exercise and the Sitting condition, values found for AL region was 0.091 μgmin−1 (SD: 0.067, 487
0.012-0.408) and 0.028 μgmin−1 (SD: 0.021, 0.003-0.126) for PM10, 0.325 μgmin−1 (SD: 0.254, 488
0.053-1.521) and 0.183 μgmin−1 (SD: 0.143, 0.031-0.857) for PM2.5, 0.257 μgmin−1 (SD: 0.197, 489
0.043-1.04) and 0.057 μgmin−1 (SD: 0.044, 0.009-0.233) respectively for PM1 to females. Of 490
the three size fractions analyzed, the largest total RDD was observed for coarse particles (PM2.5-491
10), followed by fine particles (PM1.0-2.5 and PM<1) (Fig 5). The RDDs observe in slum areas 492
are quite high as compare to the IIT(ISM) area. Women residing in those areas are more prone 493
to health risks than others part of the study area. Total respiratory tract deposition was 494
estimated to be more in both fine and coarse particle ranges. Collectively, particle Deposition 495
Fraction (DF) was also calculated in three respiratory tract regions, i.e. the head airways 496
(DFHA), tracheobronchial (DFTB), and alveolar (DFAL). DF was highest in the head airways 497
region for coarser particles and in the alveolar region for fine particles. (Jain 2017) also 498
observed similar trends in a study for concentrations in vehicular particles in Delhi. For a study 499
on a variety of kitchen and stove styles, the overall RDDs were high in the enclosed kitchen 500
type household for the coarser and fine particle sizes (Sharma and Jain 2019). The final 501
observed RDDs values confirm that for the woman, the AL region is the most prominent 502
affected zone by the fine particles (PM2.5) as compared to TB region in both positions in all 503
study locations. 504

22
505
Fig 5: Rdds due to different Particles size during two different positions. 506
The HD values are followed the decreasing trend in PM10 (59%), PM2.5 (32%) and PM1 (09%) 507
whereas the RDDs for AL region significantly increases as PM10 (11%), PM2.5 (68%) and PM1 508
(21%) (Fig 6). 509

23
510
Fig 6: Percentage variation of Rdds values for different Particles size (PM10, PM2.5, and 511
PM1) in different regions (HD, TB and AL). 512
To find the effect of the fine particle, we compared the value of PM2.5-10 and the sum of the rest 513
two size groups (PM1-2.5 & PM<1) (Fig 7). In the case of coarser particles, the amount of RDDs 514
during light exercise and sitting positions was slightly higher than the remaining fine particles, 515
up to 11.5%. This finding is significant as these fine particles have an adverse impact on 516
receptor health relative to larger particles (Heal et al. 2012; Kesavachandran et al. 2015; Chen 517
et al. 2016), and these fine particles may help the deposition of endotoxin in the pulmonary 518
alveoli (Jena and Singh 2017; Lewis et al. 2017). RDDs observed and women’s respiratory 519
symptoms, in various indoor microenvironment shows positive correlations between PM 520
values and their symptoms. The health result survey and RDDs values (Tables 1 and Fig 5) in 521
different microenvironments confirmed these results. 522

24
523
Fig 7: Rdds due to Coarser (PM10) and Fine particles (PM2.5+PM1). 524
3.5 Health risk assessment 525
The Exposure Index (EI) was calculated by considering PM10 & PM2.5 concentrations in various 526
microenvironments associated with different time patterns and activity records. An EI was 527
established based on PM concentrations, showing maximum exposure level in coal users 528
succeed by kerosene and LPG users. The average EI in different locations varies as the women 529
in various areas spend different time in cooking and other activities. The EI was calculated 530
with the aim of determining how much exposure will occur inside the house based on the 531
amount of time spent in various microenvironments. 532
The results show that the EI is more in the Dhaiya slum with value 8.23±1.97 & 6.77±1.32 for 533
PM10 & PM2.5 as they use solid fuel and have an enclosed kitchen with a compact living area 534
(Fig 8). The EI demonstrates that the use of coal has a significant effect on the main cook's 535
health in a kitchen. In different time patterns, PM concentrations indicate that exposure affects 536
participants not only during cooking hours but also during non-cooking hours, as particles 537
accumulate in the indoor environment. While the reported EI was lower in the fields of analysis, 538

25
the exposure index was still higher than the WHO's standard guidelines (2014). (Sidhu et al. 539
2017) recorded higher EI values among Indian SBF users than the present study. Detailed 540
information on the EI calculations is provided in Table S3. 541
542
Fig 8: Exposure Index in different locations. 543
Intake concentration for PM2.5 in Dhaiya (132.51 μg/m3, 95% CI: 94.62, 170.39) was almost 544
1.5 times higher than IIT(ISM) Women’s (83.29μg/m3, 95% CI: 50.98, 115.61).The HQ values 545
for PM2.5 found more elevated in the Dhaiya (5.30, 95% CI: 3.79, 6.82), followed by Hirapur 546
(5.09, 95% CI: 3.82, 6.37) and IIT(ISM) areas with a value (3.33, 95% CI: 2.04, 4.62) as shown 547
in Table 3. Whereas Intake concentration for PM10 in Dhaiya (218.28μg/m3, 95% CI: 159.67, 548
276.89) was higher than IIT(ISM) Women's (107.21μg/m3, 95% CI: 70.11, 144.28). The same 549
trend follows for the HQ values for PM10 as PM2.5, which found more in the Dhaiya (4.36, 95% 550
CI: 3.19, 5.53), followed by Hirapur (4.06, 95% CI: 3.01, 5.10) and IIT(ISM) areas with a value 551
(2.14, 95% CI: 1.40, 2.86). 552
Table 3: Intake concentration (IC) and Hazard quotient (HQ) in different Locations 553
Location IC (µg/m3) RfC (µg/m3) HQ

26
PM2.5 PM10 PM2.5 PM10 PM2.5 PM10
Dhaiya 132.51±105.08 218.28±144.33 25 50 5.31±4.21 4.37±2.36
Hirapur 127.37±64.18 202.87±117.87 25 50 5.09±2.57 4.06 ±2.89
IIT(ISM) 83.29±53.47 107.19±61.37 25 50 3.33±2.13 2.14 ±1.23
554
Potential toxicological risk of PM10 & PM2.5 due to fuel use and cooking period was found 555
significant in different study areas. Residents using coal were found to have a higher health 556
risk than residents using clean fuels (LPG) as defined by the hazard ratio of different residential 557
areas (Fig 8). The findings are also confirmed by the outcome of a questionnaire study. A 558
related risk assessment for PM2.5 was performed by (Sidhu et al. 2017) to quantify the health 559
risk from SBF burning among women. The results of that study indicates that women were 560
exposed to higher levels of PM2.5, resulting in them being at a higher toxicological risk. The 561
results of this research suggest that coal users were subject to elevated intake concentrations of 562
PM10 and PM2.5, which may lead to the early development of various respiratory diseases and 563
poses a high risk to those who are already ill with diminished lung capacity (Jena and Singh 564
2017; Li et al. 2017) and premature deaths due to HAP (Suk et al. 2016; Jindal et al. 2020). 565
4. Discussion 566
There is barely any systematic study on the effect of a household's IAQ, conducted in the Indian 567
context that calculated PM1 concentrations in conjunction with PM2.5 & PM10 under different 568
field variables (fuel and cook-stove used, kitchen characteristics, duration of cooking, and time 569
spent in indoor conditions, etc). 570
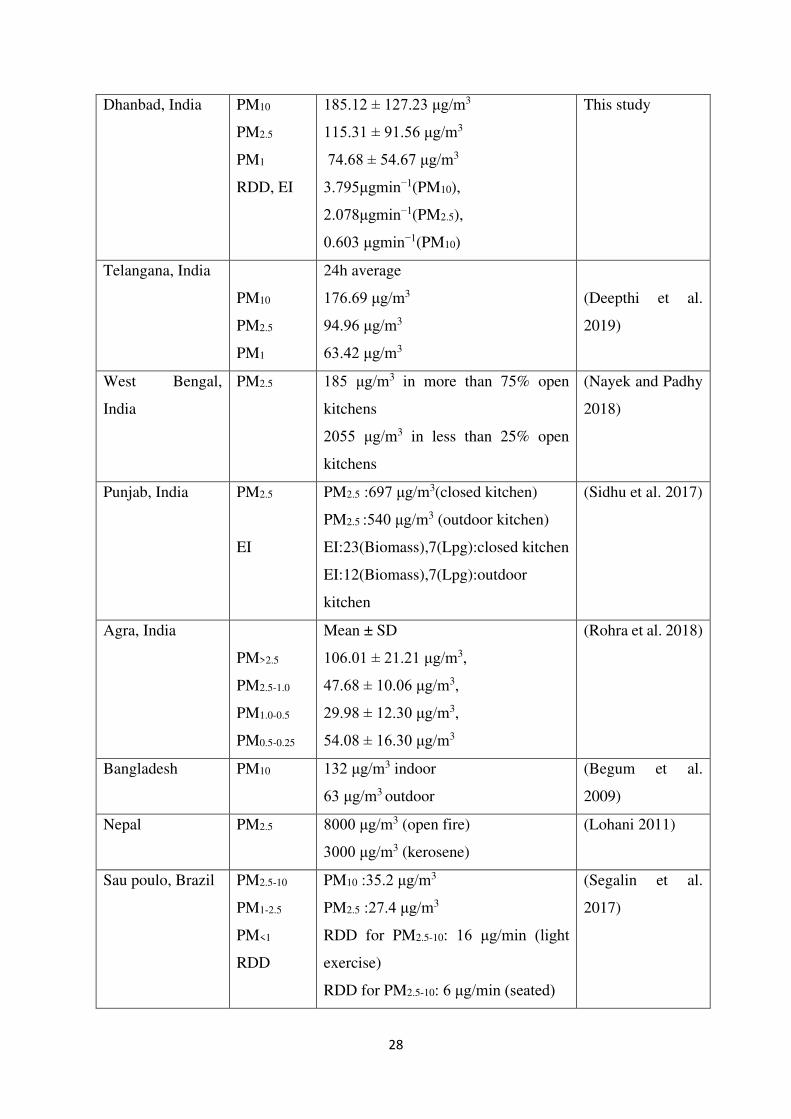
Table 4 indicates the relation of PM concentration of the present study with other previously 571
performed research to approximate the IAQ / HAP. Comparing HAP measurements during 572
actual cooking hours was hardly performed in India, except for a report by (Deepthi et al. 2019) 573
in Telangana and (Sidhu et al. 2017) in Punjab. (Deepthi et al. 2019) recorded 24 h average 574
PM10, PM2.5 and PM1 values of 176.69, 94.96, 63.42 μg/m3, while 1891, 1481 and 767.5 μg/m3 575
for cooking hours. Besides, this study found that the use of Solid Biomass Fuel (SBF) in indoor 576
kitchens raises PM10, PM2.5, PM1 (425, 278, and 176 μg/m3) up to 10 times relative to outdoor 577
kitchens due to inadequate ventilation. (Sidhu et al. 2017) analyzed the concentrations of PM2.5 578
in five different kitchens type using various fuels and recorded the maximum values of 697 579
μg/m3 in the closed kitchen followed by 540 μg/m3 in the outdoor kitchen. (Sharma and Jain 580
2019) reported that the 24 h average PM10 was 908, 542, 479 μg/m3, respectively, in an 581

27
enclosed, semi-enclosed, and open kitchen. Likewise, PM2.5 & PM1 were assessed as 351, 268, 582
112 μg/m3 and 239, 195, 71 μg/m3 respectively. However, (Nayek and Padhy 2018) also 583
recorded that PM2.5 concentrations in different kitchen types and found 185μg/m3 in more than 584
75% of open kitchens compared to 2055 μg/m3 in less than 25% of open kitchens in rural areas 585
of West Bengal. (Ojo et al. 2015) and (Grabow et al. 2013) have validated that improved 586
kitchen ventilation resulted in substantial PM emission reductions. Furthermore, by comparing 587
with NAAQS for PM, (Massey et al. 2013) reported that levels were 3.6–4 times and 4.5–5 588
times higher for PM10 & PM2.5, respectively. PM2.5 concentration was reported 577 μg/m3 and 589
774 μg/m3 for places Rajasthan (Jaipur) and Haryana (Jhajjar), respectively, comparable 590
findings were observed in the presented study. From global studies, a study (Smith and Mehta 591
2003) based on PM2.5 concentration in Guatemalan village showed the value exceeded 5000 592
μg/m3 for open fire whereas (Mishra 2003) reported 2000 μg/m3 values were measured in 593
Zimbabwe village for the same. (Begum et al. 2009) observed that mean PM10 concentrations 594
were 132 μg/m3 and 63 μg/m3 for indoor and outdoor, respectively, during the Bangladesh 595
study, which was roughly two times lower than our research. In Nepal, the PM2.5 values for 596
households using open fire reached 8000 μg/m3, while households using kerosene surpassed 597
3000 μg/m3 (Lohani 2011) which is around two to four times higher than our studies. Similar 598
concentrations were found in this sample with the experiments in Nepal and Kenya recorded 599
concentrations of PM2.5 in cooking hours ranging from 650 to 4200 μg/m3. Variations reported 600
can be clarified by factors such as the sampling method used, regional variation, cooking habits 601
and pattern, kitchen configurations, and household structure with ventilation arrangements. 602
This work also identifies higher concentrations of contaminants in the household throughout 603
cooking periods. However, concentrations were found to be comparable to other research 604
(Balakrishnan et al. 2013; Chakraborty et al. 2014; Muralidharan et al. 2015). Such findings 605
affirm the results of this study and are in good agreement showing substantial effects on 606
household air quality from the fuel used and kitchen functions. 607
Table 4: PM (PM10, PM2.5, and PM1), RDD, and EI identified in different households in 608
previous studies and in this study 609
Place Parameter Major Finding Reference
28
Dhanbad, India PM10
PM2.5
PM1
RDD, EI
185.12 ± 127.23 μg/m3
115.31 ± 91.56 μg/m3
74.68 ± 54.67 μg/m3
3.795μgmin−1(PM10),
2.078μgmin−1(PM2.5),
0.603 μgmin−1(PM10)
This study
Telangana, India
PM10
PM2.5
PM1
24h average
176.69 μg/m3
94.96 μg/m3
63.42 μg/m3
(Deepthi et al.
2019)
West Bengal,
India
PM2.5 185 μg/m3 in more than 75% open
kitchens
2055 μg/m3 in less than 25% open
kitchens
(Nayek and Padhy
2018)
Punjab, India PM2.5
EI
PM2.5 :697 μg/m3(closed kitchen)
PM2.5 :540 μg/m3 (outdoor kitchen)
EI:23(Biomass),7(Lpg):closed kitchen
EI:12(Biomass),7(Lpg):outdoor
kitchen
(Sidhu et al. 2017)
Agra, India
PM>2.5
PM2.5-1.0
PM1.0-0.5
PM0.5-0.25
Mean ± SD
106.01 ± 21.21 μg/m3,
47.68 ± 10.06 μg/m3,
29.98 ± 12.30 μg/m3,
54.08 ± 16.30 μg/m3
(Rohra et al. 2018)
Bangladesh PM10 132 μg/m3 indoor
63 μg/m3 outdoor
(Begum et al.
2009)
Nepal PM2.5 8000 μg/m3 (open fire)
3000 μg/m3 (kerosene)
(Lohani 2011)
Sau poulo, Brazil PM2.5-10
PM1-2.5
PM<1
RDD
PM10 :35.2 μg/m3
PM2.5 :27.4 μg/m3
RDD for PM2.5-10: 16 μg/min (light
exercise)
RDD for PM2.5-10: 6 μg/min (seated)
(Segalin et al.
2017)

29
Honduras PM2.5 Cook stoves type : Mean (SD), 24 h
Justa: 76 (51) μg/m3
Traditional: 263 (386) μg/m3,
(Benka-Coker et
al. 2020)
Sanghai, China PM2.5 Cooking hour
Average: 183.64 (46.51) μg/m3,
Peak: 800–1000 μg/m3
(Zeng et al. 2020)
5. Conclusion 610
Outcomes based on the present study depict the alarming micro-environmental conditions in 611
the study area. The woman in Dhanbad city is susceptible to higher particle doses during the 612
cooking period. Women both in working conditions in household and resting positions suffer 613
asymmetric exposure of PM concentrations. These findings suggest that women in the 614
household within proximity of the main road with heavy vehicular density and lack of proper 615
ventilation conditions are exposed to higher fine particle concentration. These all size 616
segregated PM concentrations result in higher RDDs in all the 3 HD, TB, and AL regions in 617
this vicinity. The average exposure index in different locations varies, as the women in various 618
areas are associated with different time patterns and activity records. The present study based 619
on women within the household of Dhanbad city advised that proper ventilation in houses and 620
the intermittent cooking procedure can lessen the dust deposition. Suitable design for 621
ventilations, household structure, cooking duration and pattern, cooking stoves and fuel 622
selection, indoor-outdoor interaction, Socio-Economical status, and awareness towards Public 623
health are various key areas to be considered for lower respiratory dust depositions in people 624
residing indoor conditions. As the exposed population group (women) in the study area is more 625
susceptible to HAP, remediation actions will be essential. Our findings of indoor PM conditions 626
in the household with their exposure index, and inevitably, their adverse health impact will be 627
helpful for remediation action against poor household quality. This research will help the 628
scientific community and policymakers quantify the extent to which household air pollution is 629
responsible for the most vulnerable section of society, i.e. women, who experience 630
disproportionate exposure to and consequences of air pollution. For specific sources and 631
elemental analysis of size segregated PM, further investigation is recommended. 632
Declarations: 633
Ethics approval and consent to participate: “Not applicable” 634

30
Consent for publication: Informed consent was obtained from all subjects involved in the 635
study. 636
Availability of data and materials: Supplementary data is attached with this manuscript. The 637
data presented in this study are also available on request from the corresponding authors. 638
Competing interests: "The authors declare that they have no competing interests". 639
Funding: “This research received no external funding” 640
Author Contributions: Conceptualization, M. K. J (Manish Kumar Jain) and S.K (Shravan 641
Kumar); methodology, S.K (Shravan Kumar); monitoring, S.K (Shravan Kumar); supervision, 642
M. K. J (Manish Kumar Jain); formal analysis, S.K (Shravan Kumar); data interpretations, S.K 643
(Shravan Kumar) and M. K. J (Manish Kumar Jain) ; writing—original draft preparation, S.K 644
(Shravan Kumar); writing—review and editing, M. K. J (Manish Kumar Jain) and S.K 645
(Shravan Kumar). All authors have read and agreed to the published version of the manuscript. 646
Acknowledgments 647
The authors are very pleased to thanks the Department of Environmental Science and 648
Engineering, IIT(ISM) Dhanbad, for ensuring logistical resources. We acknowledge the 649
regional center of two state agencies, Jharkhand State Pollution Control Board and the 650
Jharkhand Space Association Center, for providing salient meteorological and background 651
data. We also thank the female volunteers in the study area for their assistance and cooperative 652
approach with the questionnaire survey. The authors acknowledge Mr. Vivek Singh and Ms. 653
Silvia Dutta (Research Scholars) from the Department of Environmental Science and 654
Engineering, IIT (ISM) Dhanbad, for their support for study area map development. 655
656
Reference 657
Adesina JA, Piketh SJ, Qhekwana M, et al (2020) Contrasting indoor and ambient particulate 658
matter concentrations and thermal comfort in coal and non-coal burning households at 659
South Africa Highveld. Sci Total Environ 699:134403. 660
https://doi.org/10.1016/j.scitotenv.2019.134403 661
Alim MA, Sarker MAB, Selim S, et al (2014) Respiratory involvements among women 662
exposed to the smoke of traditional biomass fuel and gas fuel in a district of Bangladesh. 663
31
Environ Health Prev Med 19:126–134. https://doi.org/10.1007/s12199-013-0364-4 664
Arbex MA, Santos U de P, Martins LC, et al (2012) A poluição do ar e o sistema respiratório. 665
J Bras Pneumol 38:643–655. https://doi.org/10.1590/S1806-37132012000500015 666
Avila-Tang E, Elf JL, Cummings KM, et al (2013) Assessing secondhand smoke exposure 667
with reported measures. Tob Control 22:156–163. 668
https://doi.org/10.1136/tobaccocontrol-2011-050296 669
Azarmi F, Kumar P (2016) Ambient exposure to coarse and fine particle emissions from 670
building demolition. Atmos Environ 137:62–79. 671
https://doi.org/10.1016/j.atmosenv.2016.04.029 672
Bai L, He Z, Li C, Chen Z (2020) Investigation of yearly indoor/outdoor PM2.5 levels in the 673
perspectives of health impacts and air pollution control: Case study in Changchun, in the 674
northeast of China. Sustain Cities Soc 53:101871. 675
https://doi.org/10.1016/j.scs.2019.101871 676
Balakrishnan K, Ghosh S, Ganguli B, et al (2013) State and national household 677
concentrations of PM2.5 from solid cookfuel use: Results from measurements and 678
modeling in India for estimation of the global burden of disease. Environ Heal A Glob 679
Access Sci Source 12:1–14. https://doi.org/10.1186/1476-069X-12-77 680
Barnes B, Mathee A, Thomas E (2011) The impact of health behaviour change intervention 681
on indoor air pollution indicators in the rural North West Province, South Africa. J 682
Energy South Africa 22:35–44. https://doi.org/10.17159/2413-3051/2011/v22i3a3220 683
Beelen R, Raaschou-Nielsen O, Stafoggia M, et al (2014a) Effects of long-term exposure to 684
air pollution on natural-cause mortality: An analysis of 22 European cohorts within the 685
multicentre ESCAPE project. Lancet 383:785–795. https://doi.org/10.1016/S0140-686
6736(13)62158-3 687
Beelen R, Raaschou-Nielsen O, Stafoggia M, et al (2014b) Effects of long-term exposure to 688
air pollution on natural-cause mortality: An analysis of 22 European cohorts within the 689
multicentre ESCAPE project. Lancet. https://doi.org/10.1016/S0140-6736(13)62158-3 690
Begum BA, Paul SK, Dildar Hossain M, et al (2009) Indoor air pollution from particulate 691
matter emissions in different households in rural areas of Bangladesh. Build Environ 692
44:898–903. https://doi.org/10.1016/j.buildenv.2008.06.005 693

32
Benka-Coker ML, Peel JL, Volckens J, et al (2020) Kitchen concentrations of fine particulate 694
matter and particle number concentration in households using biomass cookstoves in 695
rural Honduras. Environ Pollut 258:113697. 696
https://doi.org/10.1016/j.envpol.2019.113697 697
Bhole DV (2017) Implications of Household Air Pollution in India on Health: Need of health 698
technology. Int J Healthc Educ Med Informatics 4:18–22. 699
https://doi.org/10.24321/2455.9199.201702 700
Bird DK (2009) The use of questionnaires for acquiring information on public perception of 701
natural hazards and risk mitigation - A review of current knowledge and practice. Nat 702
Hazards Earth Syst Sci 9:1307–1325. https://doi.org/10.5194/nhess-9-1307-2009 703
Bluyssen PM, Roda C, Mandin C, et al (2016) Self-reported health and comfort in “modern” 704
office buildings: First results from the European OFFICAIR study. Indoor Air 26:298–705
317. https://doi.org/10.1111/ina.12196 706
Burkart J, Steiner G, Reischl G, et al (2010) Characterizing the performance of two optical 707
particle counters (Grimm OPC1.108 and OPC1.109) under urban aerosol conditions. J 708
Aerosol Sci 41:953–962. https://doi.org/10.1016/j.jaerosci.2010.07.007 709
Chakraborty D, Mondal NK, Datta JK (2014) Indoor pollution from solid biomass fuel and 710
rural health damage: A micro-environmental study in rural area of Burdwan, West 711
Bengal. Int J Sustain Built Environ 3:262–271. 712
https://doi.org/10.1016/j.ijsbe.2014.11.002 713
Chao CY, Wong KK (2002) Residential indoor PM 10 and PM 2.5 in Hong Kong and the 714
elemental composition 715
Chen Y, Shen G, Huang Y, et al (2016) Household air pollution and personal exposure risk of 716
polycyclic aromatic hydrocarbons among rural residents in Shanxi, China. Indoor Air 717
26:246–258. https://doi.org/10.1111/ina.12204 718
Daigle CC, Chalupa DC, Gibb FR, et al (2003) in Humans During Rest and Exercise. 719
Children 15:539–552. https://doi.org/10.1080/08958370390205065 720
Datta A, Suresh R, Gupta A, et al (2017) Indoor air quality of non-residential urban buildings 721
in Delhi, India. Int J Sustain Built Environ 6:412–420. 722
https://doi.org/10.1016/j.ijsbe.2017.07.005 723

33
de la Sota C, Lumbreras J, Pérez N, et al (2018) Indoor air pollution from biomass 724
cookstoves in rural Senegal. Energy Sustain Dev 43:224–234. 725
https://doi.org/10.1016/j.esd.2018.02.002 726
Deepthi Y, Shiva Nagendra SM, Gummadi SN (2019) Characteristics of indoor air pollution 727
and estimation of respiratory dosage under varied fuel-type and kitchen-type in the rural 728
areas of Telangana state in India. Sci Total Environ 650:616–625. 729
https://doi.org/10.1016/j.scitotenv.2018.08.381 730
Dolk H, Armstrong B, Lachowycz K, et al (2010) Ambient air pollution and risk of 731
congenital anomalies in England, 1991-1999. Occup Environ Med 67:223–227. 732
https://doi.org/10.1136/oem.2009.045997 733
Evans J, van Donkelaar A, Martin R V., et al (2013) Estimates of global mortality attributable 734
to particulate air pollution using satellite imagery. Environ Res 120:33–42. 735
https://doi.org/10.1016/j.envres.2012.08.005 736
Ferro AR, Kopperud RJ, Hildemann LM (2004) Elevated personal exposure to particulate 737
matter from human activities in a residence. J Expo Anal Environ Epidemiol 14:. 738
https://doi.org/10.1038/sj.jea.7500356 739
Forum RA (2019) Guidelines for Human Exposure Assessment Guidelines for Human 740
Exposure Assessment 741
Fullerton DG, Bruce N, Gordon SB (2008) Indoor air pollution from biomass fuel smoke is a 742
major health concern in the developing world. Trans R Soc Trop Med Hyg 102:843–743
851. https://doi.org/10.1016/j.trstmh.2008.05.028 744
Grabow K, Still D, Bentson S (2013) Test kitchen studies of indoor air pollution from 745
biomass cookstoves. Energy Sustain Dev 17:458–462. 746
https://doi.org/10.1016/j.esd.2013.05.003 747
Guo H, Lee SC, Chan LY, Li WM (2004) Risk assessment of exposure to volatile organic 748
compounds in different indoor environments. Environ Res 94:57–66. 749
https://doi.org/10.1016/S0013-9351(03)00035-5 750
Gupta SK, Elumalai SP (2017) Size-segregated particulate matter and its association with 751
respiratory deposition doses among outdoor exercisers in Dhanbad City, India. J Air 752
Waste Manag Assoc 67:1137–1145. https://doi.org/10.1080/10962247.2017.1344159 753

34
Heal MR, Kumar P, Harrison RM (2012) Particles, air quality, policy and health. Chem Soc 754
Rev 41:6606–6630. https://doi.org/10.1039/C2CS35076A 755
Hime NJ, Marks GB, Cowie CT (2018) A comparison of the health effects of ambient 756
particulate matter air pollution from five emission sources. Int. J. Environ. Res. Public 757
Health 15 758
Hinds WC Aerosol Technology Properties, Behavior, and Measurement ofAirborne Particles 759
Second Edition 760
Human OOF (2019) HUMAN HEALTH RISK ASSESSMENT ( HHRA ) NOTE NUMBER 761
1. 1–5 762
Hystad P, Villeneuve PJ, Goldberg MS, et al (2015) Exposure to traffic-related air pollution 763
and the risk of developing breast cancer among women in eight Canadian provinces: A 764
case-control study. Environ Int 74:240–248. 765
https://doi.org/10.1016/j.envint.2014.09.004 766
Jain S (2017) Exposure to in-vehicle respirable particulate matter in passenger vehicles under 767
different ventilation conditions and seasons. Sustain Environ Res 27:87–94. 768
https://doi.org/10.1016/j.serj.2016.08.006 769
Jaques PA, Kim CS (2000) MEASUREMENT OF TOTAL LUNG DEPOSITION OF 770
INHALED ULTRAFINE PARTICLES IN HEALTHY MEN AND WOMEN 771
Jena S, Singh G (2017) Human health risk assessment of airborne trace elements in Dhanbad, 772
India. Atmos Pollut Res 8:490–502. https://doi.org/10.1016/j.apr.2016.12.003 773
Jindal SK, Aggarwal AN, Jindal A (2020) Household air pollution in India and respiratory 774
diseases: Current status and future directions. Curr Opin Pulm Med 26:128–134. 775
https://doi.org/10.1097/MCP.0000000000000642 776
Kesavachandran CN, Kamal R, Bihari V, et al (2015) Particulate matter in ambient air and its 777
association with alterations in lung functions and respiratory health problems among 778
outdoor exercisers in national capital region, India. Atmos Pollut Res 6:618–625. 779
https://doi.org/10.5094/APR.2015.070 780
Kumar P, Goel A (2016a) Concentration dynamics of coarse and fine particulate matter at 781
and around signalised traffic intersections. Environ Sci Process Impacts 18:1220–1235. 782
https://doi.org/10.1039/c6em00215c 783
35
Kumar P, Goel A (2016b) Concentration dynamics of coarse and fine particulate matter at 784
and around signalised traffic intersections. Environ Sci Process Impacts 18:1220–1235. 785
https://doi.org/10.1039/c6em00215c 786
Kurt-Karakus PB (2012) Determination of heavy metals in indoor dust from Istanbul, 787
Turkey: Estimation of the health risk. Environ Int 50:47–55. 788
https://doi.org/10.1016/j.envint.2012.09.011 789
Lewis JJ, Hollingsworth JW, Chartier RT, et al (2017) Biogas Stoves Reduce Firewood Use, 790
Household Air Pollution, and Hospital Visits in Odisha, India. Environ Sci Technol 791
51:560–569. https://doi.org/10.1021/acs.est.6b02466 792
Li Q, Jiang J, Wang S, et al (2017) Impacts of household coal and biomass combustion on 793
indoor and ambient air quality in China: Current status and implication. Sci Total 794
Environ 576:347–361. https://doi.org/10.1016/j.scitotenv.2016.10.080 795
Liao J, Ye W, Pillarisetti A, Clasen TF (2019) Modeling the impact of an indoor air filter on 796
air pollution exposure reduction and associated mortality in Urban Delhi household. Int 797
J Environ Res Public Health 16:. https://doi.org/10.3390/ijerph16081391 798
Lohani SP (2011) Biomass as a Source of Household Energy and Indoor Air Pollution in 799
Nepal. Iran J Energy Environ 2:74–78 800
Loomis D, Huang W, Chen G (2014) The International Agency for Research on Cancer 801
(IARC) evaluation of the carcinogenicity of outdoor air pollution: Focus on China. Chin 802
J Cancer 33:189–196. https://doi.org/10.5732/cjc.014.10028 803
Massey DD, Kulshrestha A, Taneja A (2013) Particulate matter concentrations and their 804
related metal toxicity in rural residential environment of semi-arid region of India. 805
Atmos Environ 67:278–286. https://doi.org/10.1016/j.atmosenv.2012.11.002 806
Mehta AJ, Zanobetti A, Bind MAC, et al (2016) Long-term exposure to ambient fine 807
particulate matter and renal function in older men: The veterans administration 808
normative aging study. Environ Health Perspect 124:1353–1360. 809
https://doi.org/10.1289/ehp.1510269 810
Mishra V (2003) Indoor air pollution from biomass combustion and acute respiratory illness 811
in preschool age children in Zimbabwe. Int J Epidemiol 32:847–853. 812
https://doi.org/10.1093/ije/dyg240 813

36
Morris et al. 2012 (2012) 基因的改变NIH Public Access. Bone 23:1–7. 814
https://doi.org/10.1038/jid.2014.371 815
Muralidharan V, Sussan TE, Limaye S, et al (2015) Field testing of alternative cookstove 816
performance in a rural setting of Western India. Int J Environ Res Public Health 817
12:1773–1787. https://doi.org/10.3390/ijerph120201773 818
Nayek S, Padhy PK (2018) Approximation of personal exposure to fine particulate matters 819
(PM2.5) during cooking using solid biomass fuels in the kitchens of rural West Bengal, 820
India. Environ Sci Pollut Res 25:15925–15933. https://doi.org/10.1007/s11356-018-821
1831-7 822
Ojo KD, Soneja SI, Scrafford CG, et al (2015) Indoor particulate matter concentration, water 823
boiling time, and fuel use of selected alternative cookstoves in a home-like setting in 824
rural Nepal. Int J Environ Res Public Health 12:7558–7581. 825
https://doi.org/10.3390/ijerph120707558 826
Olmo NRS, Saldiva PH do N, Braga ALF, et al (2011) A review of low-level air pollution 827
and adverse effects on human health: Implications for epidemiological studies and 828
public policy. Clinics 66:681–690. https://doi.org/10.1590/S1807-59322011000400025 829
Pandey VL, Chaubal A (2011) Comprehending household cooking energy choice in rural 830
India. Biomass Bioenergy - BIOMASS BIOENERG 35:. 831
https://doi.org/10.1016/j.biombioe.2011.09.020 832
Pant P, Guttikunda SK, Peltier RE (2016) Exposure to particulate matter in India: A synthesis 833
of findings and future directions. Environ. Res. 834
Paulin L, Hansel N (2016) Particulate air pollution and impaired lung function. 835
F1000Research 5:1–9. https://doi.org/10.12688/f1000research.7108.1 836
Prabhu V, Gupta SK, Madhwal S, Shridhar V (2019a) Exposure to Atmospheric Particulates 837
and Associated Respirable Deposition Dose to Street Vendors at the Residential and 838
Commercial Sites in Dehradun City. Saf Health Work 10:237–244. 839
https://doi.org/10.1016/j.shaw.2019.01.005 840
Prabhu V, Gupta SK, Madhwal S, Shridhar V (2019b) Exposure to Atmospheric Particulates 841
and Associated Respirable Deposition Dose to Street Vendors at the Residential and 842
Commercial Sites in Dehradun City. Saf Health Work. 843

37
https://doi.org/10.1016/j.shaw.2019.01.005 844
Rohra H, Tiwari R, Khandelwal N, Taneja A (2018) Mass distribution and health risk 845
assessment of size segregated particulate in varied indoor microenvironments of Agra, 846
India - A case study. Urban Clim 24:139–152. 847
https://doi.org/10.1016/j.uclim.2018.01.002 848
Sánchez-soberón F, Mari M, Kumar V, et al (2015) An approach to assess the Particulate 849
Matter exposure for the population living around a cement plant : modelling indoor air 850
and particle deposition in the respiratory tract. Environ Res 143:10–18. 851
https://doi.org/10.1016/j.envres.2015.09.008 852
Segalin B, Kumar P, Micadei K, et al (2017) Size–segregated particulate matter inside 853
residences of elderly in the Metropolitan Area of São Paulo, Brazil. Atmos Environ 854
148:139–151. https://doi.org/10.1016/j.atmosenv.2016.10.004 855
Sharma D, Jain S (2019) Impact of intervention of biomass cookstove technologies and 856
kitchen characteristics on indoor air quality and human exposure in rural settings of 857
India. Environ Int 123:240–255. https://doi.org/10.1016/j.envint.2018.11.059 858
Sharma R, Balasubramanian R (2018) Size-fractionated particulate matter in indoor and 859
outdoor environments during the 2015 haze in Singapore: Potential human health risk 860
assessment. Aerosol Air Qual Res 18:904–917. 861
https://doi.org/10.4209/aaqr.2017.11.0515 862
Sidhu MK, Ravindra K, Mor S, John S (2017) Household air pollution from various types of 863
rural kitchens and its exposure assessment. Sci Total Environ 586:419–429. 864
https://doi.org/10.1016/j.scitotenv.2017.01.051 865
Simoni M, Scognamiglio A, Carrozzi L, et al (2004) Indoor exposures and acute respiratory 866
effects in two general population samples from a rural and an urban area in Italy. J Expo 867
Anal Environ Epidemiol 14 Suppl 1:S144-52. https://doi.org/10.1038/sj.jea.7500368 868
Singh S, Tiwari S, Gond DP, et al (2015a) Intra-seasonal variability of black carbon aerosols 869
over a coal field area at Dhanbad, India. Atmos Res. 870
https://doi.org/10.1016/j.atmosres.2015.03.015 871
Singh S, Tiwari S, Gond DP, et al (2015b) Intra-seasonal variability of black carbon aerosols 872
over a coal field area at Dhanbad, India. Atmos Res 161–162:25–35. 873

38
https://doi.org/10.1016/j.atmosres.2015.03.015 874
Smith K (2000) National burden of disease in India from indoor air pollution. Proc Natl Acad 875
Sci U S A 97:13286–13293. https://doi.org/10.1073/pnas.97.24.13286 876
Smith KR, Mehta S (2003) The burden of disease from indoor air pollution in developing 877
countries: Comparison of estimates. Int J Hyg Environ Health 206:279–289. 878
https://doi.org/10.1078/1438-4639-00224 879
Stanaway JD, Afshin A, Gakidou E, et al (2018) Global, regional, and national comparative 880
risk assessment of 84 behavioural, environmental and occupational, and metabolic risks 881
or clusters of risks for 195 countries and territories, 1990-2017: A systematic analysis 882
for the Global Burden of Disease Stu. Lancet 392:1923–1994. 883
https://doi.org/10.1016/S0140-6736(18)32225-6 884
Suk WA, Ahanchian H, Asante KA, et al (2016) Environmental pollution: An 885
underrecognized threat to children’s health, especially in low- and middle-income 886
countries. Environ Health Perspect 124:A43–A45. https://doi.org/10.1289/ehp.1510517 887
The Census of India (2011) The Census of india 2011 report pdf. Goi 888
Tian J, Ni H, Cao J, et al (2017) Characteristics of carbonaceous particles from residential 889
coal combustion and agricultural biomass burning in China. Atmos Pollut Res 8:521–890
527. https://doi.org/10.1016/j.apr.2016.12.006 891
Varghese SK, Gangamma S, Patil RS, Sethi V (2005) Particulate respiratory dose to Indian 892
women from domestic cooking. Aerosol Sci Technol 39:1201–1207. 893
https://doi.org/10.1080/02786820500444838 894
Weuve J, Puett RC, Schwartz J, et al (2012) Exposure to particulate air pollution and 895
cognitive decline in older women. Arch Intern Med 172:219–227. 896
https://doi.org/10.1001/archinternmed.2011.683 897
WHO (2011) Global database of household air pollution measurements. 2014:1–2 898
Wu F, Jacobs D, Mitchell C, et al (2007) Improving indoor environmental quality for public 899
health: Impediments and policy recommendations. Environ Health Perspect 115:953–900
957. https://doi.org/10.1289/ehp.8986 901
Yen YC, Yang CY, Ho CK, et al (2020) Indoor ozone and particulate matter modify the 902

39
association between airborne endotoxin and schoolchildren’s lung function. Sci Total 903
Environ 705:135810. https://doi.org/10.1016/j.scitotenv.2019.135810 904
Zeng L, Du B, Lv L, et al (2020) Occupant exposure and ventilation conditions in Chinese 905
residential kitchens: Site survey and measurement for an old residential community in 906
Shanghai. J Build Eng 31:101406. https://doi.org/10.1016/j.jobe.2020.101406 907
908

Figures
Figure 1
Study Area. Note: The designations employed and the presentation of the material on this map do notimply the expression of any opinion whatsoever on the part of Research Square concerning the legal

status of any country, territory, city or area or of its authorities, or concerning the delimitation of itsfrontiers or boundaries. This map has been provided by the authors.
Figure 2
Time activity pattern in different locations

Figure 3
(a): PM variation during Winter time (b): PM variation during Summer time

Figure 4
Seasonal variation in PM concentration

Figure 5
Rdds due to different Particles size during two different positions.
Figure 6
Percentage variation of Rdds values for different Particles size (PM10, PM2.5, and PM1) in differentregions (HD, TB and AL).
Figure 7

Rdds due to Coarser (PM10) and Fine particles (PM2.5+PM1).
Figure 8
Exposure Index in different locations.
Supplementary Files
This is a list of supplementary �les associated with this preprint. Click to download.
SupplementaryInformation.docx