interpretation of full blood count parameters in health
TRANSCRIPT

Haematology International JournalISSN: 2578-501XMEDWIN PUBLISHERS
Committed to Create Value for Researchers
Interpretation of Full Blood Count Parameters in Health and Disease Haematol Int J
Interpretation of Full Blood Count Parameters in Health and Disease
Erhabor O1*, Muhammad HA1, Muhammad K1, Onwuchekwa C2 and Egenti NB3
1School of Medical Laboratory Science, Usmanu Danfodiyo University Sokoto, Nigeria2Department of Physiology, Usmanu Danfodiyo University, Nigeria 3College of Health Sciences, University of Abuja, Nigeria *Corresponding author: Erhabor Osaro, School of Medical Laboratory Science, Usmanu Danfodiyo University Sokoto, Nigeria, Email: [email protected]
Research ArticleVolume 5 Issue 1
Received Date: April 06, 2021
Published Date: April 28, 2021
DOI: 10.23880/hij-16000180
Abstract
The full blood count (FBC) or Complete Blood Count (CBC) is one of the most frequently requested haematological investigation performed in patients. It has the potential, when interpreted carefully and in relation to the clinical history can potentially yield very useful clinical information that assist in diagnosis and management of patients by clinicians. It usually comprises 13–19 parameters. The aim of this review was to highlight the evidenced based interpretation of full blood count parameters in health and disease. PubMed, Google Scholar, Science Direct and African Journals Online search was performed in January 2020 and studies on the components of a normal full blood count in health and several disease states was included in the review. Search keywords included full blood count and its clinically significance. FBC is a readily available test whose clinical utility is far reaching and can potentially monitor effect of drug treatment, pre-operative intervention and in the diagnosis of diseases such as anaemia, cancer, clotting issues, infection and immune system disorder. The parameters included in a normal FBC are sometimes under-utilized as most clinicians and nurses rely more on three of the components (HB, WBC and platelet count). FBC determination using either the 3 of 5-part differential haematology analyzer should be based on SOP using certified reagents, validated equipment and quality controlled (IQC and EQA) testing in a Good Laboratory Practice compliant laboratory. All clinically significant analyzer generated flags must be investigated. All results must be technically and clinically validated. Laboratories must identify findings and flags that should warrant the examination of a peripheral blood film as well as results that need to be communicated promptly to the requesting clinician to facilitate the need for immediate remedial action and effective management of patients. It is vital that result is not reviewed in isolation but holistically looking at trends over time and taking into consideration known diagnosis. Keywords: Interpretation; Full Blood Count; Health; Diseases
Abbreviations: FBC: Full Blood Count; CBC: Complete Blood Count; RBC: Red Blood Cell; WBC: White Blood Cell; PLC: Platelet Count; SOP: Standard Operating Procedures; NCCLS: National Committee for Clinical Laboratory Standards; HB:
Haemoglobin; MCV: Mean Cell Volume; PCV: Packed Cell Volume; HCT: Haematocrit; MCHC: Mean Cell Haemoglobin Concentration; ESR: Erythrocyte Sedimentation Rate; CRP: C-Reactive Protein; ACD: Anaemia of Chronic Disorders; GLP:

Haematology International Journal2
Erhabor O, et al. Interpretation of Full Blood Count Parameters in Health and Disease. Haematol Int J 2021, 5(1): 00180.
Copyright© Erhabor O, et al.
Good Laboratory Practice; MPD: Myeloproliferative Disorder; PCR: Polymerase Chain Reaction; PV: Polycythemia Vera; EBV: Epstein Barr Virus; TTP: Thrombotic Thrombocytopenic Purpura; DIC: Disseminated Intravascular Coagulation; ITP: Immune Thrombocytopenia; CMV: Cytomegalovirus; HES: Hyper Eosinophilic Syndrome; AML: Acute Myelogenous Leukaemia; IG: Immature Granulocytes; PLCR: Platelet Large Cell Ratio; MPV: Mean Platelet Volume; M-CSF: Macrophage Colony Stimulating Factor; PDW: Platelet Distribution Width; HIT: Heparin-Induced Thrombocytopenia; RDW: Red Cell Distribution Width; MCH: Mean Corpuscular Haemoglobin; PCV: Packed Cell Volume; PLT: Platelet Count; RPI: Reticulocyte Production Index; G-CSF: Granulocytes Colony Stimulating Factor.
Introduction
Full blood count (FBC) or complete blood count (CBC) is a haematological test used to evaluate the health of a patient. It plays a role in the detection of a wide range of disorders, including anaemia, thrombocytopenia, infection and leukaemia. A complete blood count test measures several cellular components and features of blood (Red blood cells which play a role in tissue perfusion, White cells which in host immunity and platelets which play a role in haemostasis and coagulation). It gives useful information about the production of all blood cells and identifies a patient’s oxygen-carrying capacity through the evaluation of red blood cell (RBC) indices, haemoglobin, and haematocrit. It also provides information about the immune system through the evaluation of the white blood cell (WBC) count with differential. This test is helpful in diagnosing anaemia, certain cancers, infection, acute haemorrhagic states, allergies, and immuno-deficiencies as well as monitoring for side effects of certain drugs [1].
The full blood count (FBC) is perhaps the single most common haematology-related investigation performed in medical patients. It has the potential, when interpreted carefully, correctly and in relation to the clinical history, to provide very useful information to assist in diagnosis, drug monitoring and management of diseases [2]. The parameters included in the FBC can potentially pinpoint the presence of diseases such as anaemia, cancer, clotting issues, infection and immune system disorder. The parameters included in a normal FBC is sometimes under-utilized. A survey on clinicians and nurses revealed that nine of 10 end-users only utilized the WBC, haemoglobin and platelet of the 13-19 parameters reported routinely from the FBC profile because of either a lack of application or interpretation and time constraints [3]. FBC is vital pre-operative test and can help detect presence of pre-operative anaemia, presence of bleeding disorders and risk and potentially the presence of
inherited haemoglobin disorders (haemoglobinopathies) and thus help surgeons to plan the use of blood products and blood salvage techniques in the perioperative period [4] (Figure 1).
Figure 1: Whole blood and its component.
Blood is made up of cellular elements (red blood cells, white blood cells, platelets) contained in plasma. Clinicians are often alerted to the presence of a primary haematological disorder by the presence of abnormalities in the FBC [5]. The FBC can provide a wealth of important information which can assist the physician in patient diagnosis and management. It is essential to assess not only the current laboratory values but also to establish potential trends over time and in relation to known diagnoses, surgical interventions and drug treatment. The cause of many abnormalities will be obvious but any unexpected findings need explanation. Not only will this assist in achieving a prompt diagnosis in many patients but awareness of the common causes for each abnormality might prevent unnecessary investigations in others. The haematology laboratory in large teaching hospitals will often provide up to 1,500 automated FBC analyses each day. Unexpected results (low platelet count and haemoglobin) are often technically validated by checking the integrity of the sample and by ensuring that the sample is not clotted. For raised MCHC, the following remedial action is taken (warm at 37°C for 20 minutes to obviate for the presence of cold agglutinin, check the blood films for presence of spherocytosis and by centrifuging the sample and checking for the presence of lipaemia). The results are also individually checked for the presence of ‘flags’ provided by the analyzer which indicate values outside the normal range. It is clearly essential that clinical information is provided with the request as this will influence the clinical validation of the result by the Biomedical or Medical Laboratory Scientist. Furthermore, significant abnormalities will warrant the

Haematology International Journal3
Erhabor O, et al. Interpretation of Full Blood Count Parameters in Health and Disease. Haematol Int J 2021, 5(1): 00180.
Copyright© Erhabor O, et al.
generation of a blood film (unexplained low platelet count on a sample whose integrity is not compromised, presence of blast, atypical and abnormal lymphocytes flag) request and the report will be most useful when interpreted in light of the patient’s diagnosis. In cases where a diagnosis is not yet known, even brief information on presentation, for example collapse with hypotension, fever, weight loss, vomiting, bleeding, splenomegaly, jaundiced and anorexia will all be important and help the Medical Laboratory Scientist provide Clinicians with guidance [6].
The Constituents of the Full Blood Count and their Clinical Significance
The FBC is not a single test and has numerous (13-19) parameters, in many respects unrelated to each other biologically.
a) The Red Blood Cell Count (RBC).b) The White Blood Cells Count (WBC), with a differential
count of the various types of leukocytes, expressed in absolute numbers, in the same units as the WBC.
c) The Platelet Count (PLC).
These counts represent the balance between production and loss or destruction. The rate of destruction may be normal, increased, or decreased. The balance between production and destruction or loss cannot reliably be assessed with one count only. These three counts were (and are) of mixed usefulness. Diseases of white cells and platelets were fairly well characterized early and relatively straightforward. Diagnosis using these 2 parameters often depend on the counts and the morphological appearances [7].
Test Procedure
To carry out Full blood cell count, Blood sample will be drawn, usually from a vein in the arm or the back of the hand. This is a common procedure, and side effects are rare, but may include lightheadedness, bleeding or infection [5]. Full blood count can be done manually by testing the individual parameters (RBC, WBC, platelet count, haemoglobin, packed cell volume and differential leucocyte count). Other parameters such as MCV, MCH and MCHC are calculated using the HB, PCV and red cell count values while the absolute values are calculated using the percentage differential count and the WBC count. For manual counts, the following materials and reagents are usually required:
a) Light Microscopeb) Counting (Neubauer) chamber.
Dilution fluid (Drabkins solution for haemoglobin estimation; Turk solution for WBC count; - Ammoniun Oxalate for platelet count, Brilliant Cresyl Blue for Reticulocyte count; Wright, Giemsa or Leishman stain for peripheral blood film for deferential leucocyte count [5]. The white cell populations are therefore routinely reported as percentage count (%) while the in absolute counts (x109/L) were calculated as a function of the total white blood cell count. In the past these counts were done by various manually, significantly laborious. These manual counting is still being practiced in level 1 laboratory particularly in rural communities in developing countries. Not only are manual methods subjective and prone to errors, they are laborious and often time-consuming. With advances in technology, white blood cell differentiation became possible on automated analysers. The major advantage that this development brought was speed, improved productivity, efficiency and enhanced accuracy.
Automation in Haematology Laboratory for Full Blood Count
Automated haematology analyzers are frequently used in clinical laboratories in developed countries as well as in secondary and tertiary facilities in developing countries to determine FBC as a way of assess and monitoring the health of patients. There are two different types of haematology analyzer; the 3-part differential haematology analyzers and the 5- part haematology analyzer. Full blood count provides sufficient information for most clinical settings. The white blood cells are comprised of a number of subpopulations with diverse biological function. The white blood cell count (WBC) on its own is not very informative in evaluating the state of health of an individual. The presence of a normal WBC does not necessarily mean that a patient may not have health-related challenges. Enumeration of leucocytes into the various subpopulations (Neutrophils, Eosinophils, Basophils, Lymphocytes, Monocytes) may sometimes be the first subtle pointer to the presence of certain diseases. The traditional way of differentiating white blood cells was based on a manual microscopic review of a thin peripheral blood wedge film which is air dried and stained using a Romanowsky stain (Wright, Leishman or Giemsa). While the 3-part differential analyzers rely on impedance technology to count and separate white blood cells on the basis of size (cells suspended in a sheath fluid displaces fluid equivalent to their size as they pass singly hydrodynamic focusing through an aperture/ when cells suspended in a sheath fluid passes through an aperture, the impedance changes as a cell passes through is proportional to cell volume) [8]. The principle of hydrodynamic focusing further enhances the accuracy ensuring that blood cells pass through the aperture in single file and eliminate false size estimates if multiple cells pass through at the same time [9] (Table 1).

Haematology International Journal4
Erhabor O, et al. Interpretation of Full Blood Count Parameters in Health and Disease. Haematol Int J 2021, 5(1): 00180.
Copyright© Erhabor O, et al.
Conventional Haematology 3-part Differential Analyser
5-part Differential Analyser
Neutrophils Neutrophils
Eosinophils, Basophils, Mono-cytes (Mixed)
LymphocytesNeutrophils
Eosinophils Basophils Monocytes
Lymphocyte Lymphocyte
Table 1: 3 and 5-Differential Haematology Analyzer.
The information provided by a 5-part haematology analyzer is underutilized in most settings particularly in primary care setting. Most clinicians only review basic parameters such as haemoglobin, platelet count and white blood cell count. This practice limits the potential benefits and the huge investment in a 5-part differential analyzer. In such setting 3-part differential analyzers may be a cost-effective option. Unlike 3-part differential analyzer that rely almost on impedance (size) to enumerate blood cells, automated 5-part differential analyzers utilize various technologies for effective cell counting and differential leucocyte count and immature granulocytes determination:a) Impedanceb) Fluorescent flow cytometryc) High frequency electromagnetic energyd) Optical and cytochemical staining techniques
The superiority of a 5-part differential analyzer over a 3-part is not only on the basis of enumeration of the leucocytes into the 5 types (neutrophils, eosinophils, basophils, monocytes and lymphocytes). Other advantages include:1) 5 part-differential analyzers carry out independent
assessment using cell size and fluorescence flow cytometry principles to effectively differentiates white blood cells on the basis of nucleic acid content and internal cytoplasmic and nuclear complexity unlike 3-part analysers that depend almost entirely on cell size [9,10]. Another limitation with enumeration of blood cell based essentially on their size is storage -related changes (low glucose and sodium-potassium pump failure leading to swellings due to flow of fluid from the extracellular into the intracellular space) that occur when blood is collected in EDTA anticoagulated tubes.
2) Fluorescent flow cytometry plays a key role in the identification of immature cells based on the nucleic acid content by determining the forward, side scatter and side fluorescence. Fluorescent flow cytometry technology has facilitated the enumeration of immature granulocytes (promyelocytes, myelocytes and metamyelocytes) (6-part differential). The clinical significance of the
determination of the presence of immature granulocytes is overwhelming except in post-partum period and in neonate <72 hours old due to physiological trauma resulting from normal vagina birth.
3) Most 5-part differential haematology analyzers have wide-ranging flagging system compared to 3 -part for the identification of abnormal cells (blast, abnormal lymphocytes and atypical lymphocytes, immature granulocytes) that can facilitate the diagnosis of leukaemia and infective states [11] (Table 2).
Conventional Haematology 3-part Differential Analyser
5-part Differential Analyser
Uni-dimensional analysis Multi-dimensional analysis
Cell counting essentially based on cell size
Count cells based on a number of factors; cell complexity; DNA/RNA
content; Cellular content and cell size
Limited information Limited specificity
Extensive information Maximum specificity
Table 2: Advantages of 5 over 3 Part Differential Haematology Analyzer.
Manual Differential May Never Go Away For a Number of Reasons
Irrespective of the fact that 5-part haematology analyzers does a 5-part WBC differential, there will continue to be a requirement for a manual differential count/microscopy. Manual microscopy will continue to vital clinically to confirm the presence of abnormal blood cell populations that the automated analyzer has flagged for the Medical Laboratory Scientist attention. The purpose of the manual review of a peripheral blood film include:1) To confirm the presence of abnormal cell populations2) Record any clinically significant morphological features. 3) There is the presence of a flag (blast flag, atypical
lymphocyte and abnormal lymphocyte) on the analyzer on a sample that requires the operator’s attention
4) If the analyzer was unable to determine a differential leucocyte count when the white cell count is too high or there are abnormal cells that could not be enumerated.
5) Pancytopenic blood picture (low HB, WBC and Platelets) to rule out AML or other haematological malignancies
6) Absolute lymphocyte count >5 x10⁹/L, absolute monocyte count >1.8 x 10⁹/L, raised absolute basophil count
7) Unexpected low platelet counts to rule out presence of platelet clumping, satellitism, TTP or malaria.

Haematology International Journal5
Erhabor O, et al. Interpretation of Full Blood Count Parameters in Health and Disease. Haematol Int J 2021, 5(1): 00180.
Copyright© Erhabor O, et al.
Manual differential counting/review is a manual process, is subjective and prone to errors, it is a process for which laboratory haematologist will need to be trained, competency tested and highly skilled on as automated analysis may never be able to accurately identify every possible abnormal blood cell variant. On a manual review it is often difficult to differentiate between a band and a segmented neutrophil or to tell whether a lymphocyte is a T or B cell [12]. The introduction of 5-part differential analyzer has brought about a dramatic reduction in the number of manual differential count/blood film review that is required. These has improved laboratory efficiency (cost and turnaround time) Münster [9] (Figures 2 & 3).
Figure 2: Picture of Beckman-Coulter AcT 3-part differential haematology analyzer [8].
Figure 3: Sysmex XN Series 5-Part differential Haematology Autoanalyzer [13,14].
Validation, Calibration, Maintenance, QC of Haematology Analyzer and use of SOP
Good Laboratory Practice (GLP) principles, the International Committee for Standardization in Haematology (ICSH) [15], National Committee for Clinical Laboratory Standards (NCCLS) [16], accreditation and regulatory agencies requires that laboratory equipment that is intended for testing patients sample to generate result upon to make clinical judgement should be validated on procurement before use, maintained regularly calibrated (following a major maintenance or bias in QC result) [17,18] and quality controlled daily. A quality control sample is a sample of known content. Once an analyzer has been validated at baseline, maintained regularly as prescribed by the manufacturers (daily, weekly, monthly, biannually and annually) its control is based on determination of internal quality control [19] and external quality control methods that will detect loss precision and accuracy respectively. The methods used must be sensitive enough to tell when there is loss of performance that could compromise patient assay values but not oversensitive to signal the presence of errors where no errors exist [20]. Every laboratory must ensure quality patient care by implementing as a minimum intralaboratory QC (internal QC) and be enrolled in an external quality assessment program as a way of monitoring and controlling all the step from collection of blood specimens, through the actual processing/analysis, generation and reporting of laboratory results [21]. Continuing education is key to the effective implementation of a QC program. There are 4 very important aspects of QC in a haematology laboratory; regular proactive maintenance, calibration, monitoring of accuracy (EQA) and precision (IQC) of instruments and procedures and verification of the reliability of test results. A combination of use of commercial controls (three levels) and enrolment and participation in national and/or regional QC programs is recommended by most accreditation and regulatory agencies for monitoring of accuracy and precision on a long- term basis [22]. Usually, the action limits used in the clinical interpretation of FBC depend on established the reference ranges. If a haematology analyzer response changes, some of the produced test values may erroneously be outside the clinically significant reference points and incorrect clinical judgement/conclusions that may have a negative implication on the patients may be made. GLP principle requires that laboratory testing is based on standard operating procedures (SOP). SOP are step by step procedure/protocol for carrying out a laboratory task correctly and repeatedly. The protocol should be written concisely and in an easily understandable language and should contain pertinent information on categories of staff and level of training and competency required to implement the SOP [23].

Haematology International Journal6
Erhabor O, et al. Interpretation of Full Blood Count Parameters in Health and Disease. Haematol Int J 2021, 5(1): 00180.
Copyright© Erhabor O, et al.
Full Blood Count Components
a) White Blood Cells (WBCs)b) Red Blood Cells (RBC)c) Haematocrit (Hct)d) Haemoglobin (Hgb)e) Mean Corpuscular Volume (MCV)f) Mean Corpuscular Haemoglobin (MCH)g) Mean Corpuscular Hemoglobin Concentration (MCHC)h) Red Cell Distribution Width (RDW)i) Differentials (%) and Absolute Values• Neutrophils• Lymphocytes• Monocytes• Eosinophils• Basophilsj) Reticulocyte count (% and absolute values)k) Plateletsl) Platelet Distribution Width (PDW)m) Mean Platelet Volume (MPV) [24]n) Platelet Large Cell Ratio (PLCR)o) Immature granulocytes (IG)
Effect of Gender on Full Blood Count Parameters
In prepubertal humans no major differences exist between both genders in red blood cell count or haemoglobin. The gender-related differences in haemoglobin level seems to set in after the onset of menstruation does [25]. This gender-related differences seems to revert to normal 10 years after menopause when the haemoglobin concentration becomes similar to that of aged matched men [26]. Adult men and adult women have different haemoglobin, red cell count and packed cell volume in health. This gender difference is independent of iron status- iron replete premenopausal women have mean haemoglobin levels approximately 12% lower than age and race matched men [27]. The gender-related differences in mean venous haemoglobin levels and red cell mass is generally considered to be caused by a direct stimulatory effect of androgen in men in the bone marrow in association with erythropoietin, a stimulatory effect of androgen on erythropoietin production in the kidney, and an inhibitory effect of oestrogen on the bone marrow in women [28,29]. In the comparison study between genders, there were significantly increased proportion of neutrophils, decreased lymphocytes and monocytes, and higher N/L in female patients than in male patients after gastrectomy [30] (Table 3 & Figure 4).
Haematology Normal Adult Reference Ranges Male Female SI Units
Haemoglobin (HB) 130-180 115-165 g/LWhite Cell Count (WBC) 04-Nov 04-Nov 109/L
Platelet Count (PLT) 150-500 150-500 109/LRed Blood Count (RBC) 4.5-6.5 3.8-5.8 1012/L
Mean Cell Volume (MCV) 80-100 80-100 FlPacked Cell Volume (PCV)/Haematocrit (HCT) 0.40-0.52 0.37-0.47 L/L
Mean Cell Haemoglobin (MCH) 27-32 27-32 Pg
Mean Cell Haemoglobin Concentration (MCHC) 320-360 320-360 g/L
Neutrophil Count 2.0-7.5 2.0-7.5 109/LLymphocyte Count 1.5-4.5 1.5-4.5 109/L
Monocyte Count 0.2-0.8 0.2-0.8 109/LEosinophil Count 0-0.4 0-0.4 109/LBasophil Count 0-0.1 0-0.1 109/LReticulocytes 0.2-2.0 0.2-2.0 %
Table 3: FBC Reference Ranges based on Gender.

Haematology International Journal7
Erhabor O, et al. Interpretation of Full Blood Count Parameters in Health and Disease. Haematol Int J 2021, 5(1): 00180.
Copyright© Erhabor O, et al.
Figure 4: Blood film showing normal red cells.
White Blood Cell (WBC) Count
White blood cells are cellular elements which play a role in humoral and cell mediated immunity. They help the body fight infections. A normal white blood cell count is a reading that falls within a range established through the testing of men, women and children of all ages. Although it is possible to cite general values, exact ranges tend to differ between
laboratories and countries. For men, a normal white blood cell count is anywhere between 5,000 and 10,000 white blood cells per μl of blood. For women, it is a reading of between 4,500 and 11,000 per μl, and for children between 5,000 and 10,000. Not all sources, however, differentiate between male and female values. Values for both genders tend to lie in the range between 4,000 to 4,500 and 10,000 to 11,000 cells per μl [2]. White cells can be counted manually in specially designed chambers (Neubauer). Automated analyzers have advantage of higher accuracy and speed over manual techniques which are often subjective, laborious and prone to errors [31]. A white blood count is most often used to help diagnose disorders related to having a high white blood cell count (leukocytosis) or low white blood cell count (leucopenia). Elevated WBC count is considered a risk marker for cardiovascular disease incidence and mortality [32]. White blood cell (WBC) subsets such as neutrophils, lymphocytes, monocytes, or ratio of neutrophil to lymphocyte counts (N/L) has been identified as an easy, simple, inexpensive, and reliable prognostic index to determine host immunity [33]. There are diseases that are associated with a high and low white blood count (Table 4).
Diseases associated with a high white blood count Diseases associated with a low white blood countAutoimmune diseases (Lupus) Immune suppression -related diseases (HIV/AIDS)
Inflammatory diseases (rheumatoid arthritis) LymphomaBacterial or viral infections Diseases of the liver or spleenCancers such as leukemia Effect of chemotherapy and radiotherapy
Hodgkin disease SplenomegalyAllergic reactions Effect of drugs (antibiotics)
Tissue damage MalnutritionBurns
Alcohol abuseKidney failurePregnancy and labour
Table 4: Diseases that are associated with a high and low white blood count.
Red Cell Count and Haemoglobin
Haemoglobin (Hb) is a protein within the cytoplasm of the red blood cells which is composed of the protoporphyrin ring heme and globin. Haemoglobin plays a role in tissue perfusion. It is the most commonly used marker of anaemia. The red cell count on the other hand reflects the number of circulating red blood cells. The red cell count is particularly useful in identifying erythrocytosis; a normal red cell count with elevated haemoglobin / haematocrit suggests relative erythrocytosis (dehydration), while an elevated red cell count suggests absolute erythrocytosis (polycythaemia vera). A decrease in the red cell count and/or haemoglobin is an indication of anaemia, and depending on the red cell
indices values (MCH, MCV and MCHC), the aetiology of the anaemia can be inferred Trent [34]. The rate of increase in haemoglobin could be used to monitor the treatment of anaemia and determine the amount of blood required for transfusion [35,36].
Anaemia is a common finding in medical patients. It is best characterized in relation to the mean cell volume (MCV). The important causes of microcytic anaemia (MCV <80 fl) are outlined below in order of frequency. In the presence of microcytosis with hypochromia (low mean cell haemoglobin [MCH]) it is essential to check a serum ferritin assay. A low serum ferritin is diagnostic of iron deficiency. Ferritin levels, however, can be elevated in the acute phase response

Haematology International Journal8
Erhabor O, et al. Interpretation of Full Blood Count Parameters in Health and Disease. Haematol Int J 2021, 5(1): 00180.
Copyright© Erhabor O, et al.
often in parallel to the erythrocyte sedimentation rate (ESR) so a normal ferritin does not exclude iron deficiency. A ferritin level over 100 ng/ml virtually excludes iron deficiency regardless of circumstances. A mild microcytosis may be seen in anaemia of chronic disease, but the MCV is rarely less than 70 fl and the serum ferritin is normal. The thalassaemias and thalassaemia traits frequently cause microcytosis and hypochromia but the serum ferritin is normal. If thalassaemia trait is suspected in the presence of a low ferritin it is important to correct the iron deficiency before requesting a haemoglobinopathy screen. These patients have a normal or raised serum ferritin and normal reticulocyte count and do not respond to iron replacement therapy. In parallel, it is common to find elevated polyclonal gamma globulins and raised ESR or C-reactive protein (CRP) in inflammatory and infective disorders, respectively. In any patient with such an anaemia and raised ESR it is clearly important to perform serum electrophoresis to exclude a paraprotein and possible plasma cell dyscrasia. Anaemia in patients with anaemia of chronic disorders (ACD) will only respond to effective management of the underlying disorder though in renal anaemia with erythropoietin deficiency it will often respond to erythropoietin replacement. Anaemia of chronic disease is a secondary anaemia that results from cytokine-mediated suppression of bone marrow erythroid activity and shortened red cell lifespan. When present, it should always lead the physician to consider its cause. It is an important anaemia to recognize as in some patients it can be the first manifestation of an occult tumour. The anaemia resolves when the tumour is excised [5]. Polycythaemia (abnormal high haemoglobin and haematocrit) may be the result of a primary myeloproliferative disorder (MPD), particularly if associated with neutrophilia, thrombocytosis, and splenomegaly. Over 90% of patients with primary polycythaemia and approximately 50% of those with
myelofibrosis and Essential thrombocythaemia harbor a mutation (V617F) in the Janus kinase 2 gene (JAK2) which renders haemopoietic cells more sensitive to growth factors. This mutation can be detected by polymerase chain reaction (PCR) studies on peripheral blood and shows high specificity for myeloproliferative diseases so is very helpful in diagnosis. The presence of this mutation will often mean that investigations such as blood volume studies and erythropoietin levels are not necessary. Polycythaemia is relatively frequently seen as a sole abnormality of the full blood count (FBC) in medical patients in the circumstances outlined in (compared with primary polycythaemia). In many patients the cause will be obvious but in others the finding may be unexpected [37].
Haematocrit (HCT) or Packed Cell Volume
Also called packed cell volume (PCV), in level 1 laboratories is done manually by centrifugation, and in others it is either a calculation based on the red cell count and average size of the red cells or using another technology, a quasi-direct measurement [38]. It is normally 40.7%–50.3% for males and 36.1%–44.3% for females. The measurement depends on the number and size of red blood cells. For children aged 17 and younger, the normal range varies by age and gender (Tables 5 & 6).
Living at a high altitudePregnancy
Significant recent haemorrhageRecent blood transfusion
Severe dehydration
Table 5: Factors that can affect the Haematocrit.
Conditions associated with low haematocrit Conditions associated with high haematocritAnaemia) Dehydration
Associated with long-term illness, infection or a white blood cell disorder such as leukemia or lymphoma
Polycythaemia vera (a myeloproliferative disorder associated with the production of excessive numbers of red cells)
Vitamin or mineral deficiencies Lung or heart disease
Recent or long-term haemorrhage
Administering of Testosterone supplement therapyDengue fever (high haematocrit is a danger sign of an increased
risk of dengue shock syndrome)Chronic obstructive pulmonary disease (COPD)
Other pulmonary conditions associated with hypoxiaDoping or erythropoietin (EPO)
Use of Anabolic androgenic steroid (AAS)Capillary leak syndrome
Table 6: Conditions associated with low and high haematocrit.

Haematology International Journal9
Erhabor O, et al. Interpretation of Full Blood Count Parameters in Health and Disease. Haematol Int J 2021, 5(1): 00180.
Copyright© Erhabor O, et al.
Mean Cell Volume (MCV)
MCV is derived from the Red Blood Cell (RBC) and Haemoglobin (Hb), another valuable parameter which is the ratio of Hb to RBC. The MCH represents the amount of Haemoglobin (Hb) per cell. This is a direct measurement on most FBC auto analyzers. It is a clinically useful component of a FBC and it can play a role in the diagnosis and classication of different types of anaemia. It is a measure of the average size of the red cells. Note that this average size includes that of the reticulocyte (retics), since retics are larger than mature red cells, an increase in reticulocyte will increase the MCV [5]. A low MCV indicates presence of small red blood cells (RBC) (microcytosis) while a raised MCV indicates presence of large red blood cells (RBC) (microcytosis). MCV is clinically indicated in the evaluation and classification of anaemia. MCV is calculated using the formular: MCV= (PCV x10)/RBC. A normal MCV is 80 to 96 femtoliters per cell (1 femtoliter is 10-15). Tables 7-10 shows the conditions commonly associated with a Low and high MCV respectively.
Iron deficiency (there are many different causes of iron deficiency anaemia)
Thalassaemia (there are several types and it is thought to occur in around 30 percent of African Americans)
Anaemia of chronic diseaseSideroblastic anaemiaLead poisoning
Hb C and other haemoglobin hybridsSpherocytosis
Table 7: Conditions commonly associated with a Low.
Vitamin B12 deficiencyFolate deficiency
Liver diseaseAlcoholism
HypothyroidismSome haemolytic anaemia
Cold agglutinin diseaseMyelodysplastic syndromes/preleukaemia
Aplastic anaemiaBenign familial macrocytosisSome chemotherapy drugs
Chronic hypoxia (low oxygen levels in the blood) such as with COPD with CO2 retention
Carbon monoxide poisoningTable 8: Conditions associated with a High MCV.
MCV MCHC Examples of conditions
Low (Microcytic) Low (Hypochromic)
Iron deficiency anemia
Low (Microcytic) Normal (Normochromic) Thalassaemia
Normal (Normocytic)
Normal (Normochromic)
Anaemia of chronic disease
High (Macrocytic)
Normal (Normochromic)
Vitamin B12 deficiency
Table 9: Relationship between MCV and MCHC and Anaemia.
Kidney disease
Acute blood loss (haemorrhage)
Anaemia of chronic disease/inflammation
Endocrine diseases
Some haemolytic anaemias
Table 10: Anaemia associated with a normal MCV (normocytic anaemias).
Mean Cell Hemoglobin Concentration (MCHC)
MCHC is the average concentration of haemoglobin in a given volume of red blood cells. It is the ratio of the Haemoglobin (Hb) to the Haematocrit (Hct) and is a measure of how much Hb is packed into the average cell. It is useful in diagnosing anaemia particularly when used in conjunction with MCV and RDW [40]. It is a measure of the average oxygen-carrying capacity of the red blood. MCHC may also be calculated in 2 ways:
• MCHC = Hb / Haematocrit x 10 (g/L)• MCHC = MCH/MCVNormal range= 320 – 360g/L
A low MCHC (hypochromia) means that there is a lower concentration of haemoglobin within a given volume of red blood cells (reduced O2 carrying capacity). A normal (normochromia) or high (hyperchromia) MCHC means that the oxygen-carrying capacity of the red blood cells is normal. MCHC may be normal, low or high with many types of conditions. Table 11 shows anaemia associated with normal, low and high MCHC.

Haematology International Journal10
Erhabor O, et al. Interpretation of Full Blood Count Parameters in Health and Disease. Haematol Int J 2021, 5(1): 00180.
Copyright© Erhabor O, et al.
Anaemia Associated with normal MCHC Anaemia Associated with low MCHC Causes of a High MCHC
Blood loss anaemia Iron deficiency (with or without anaemia) Autoimmune haemolytic anemiaAnaemia due to kidney disease Lead poisoning Cold agglutinin (CHAD) (falsely raised)
Mixed anaemias Thalassaemia (beta thalassemia, alpha thalassemia, and thalassemia intermedia) Smokers
Bone marrow failure Sideroblastic anemia Hereditary spherocytosis
Haemolytic anaemias (many types) Anaemia of chronic disease
Severe burnsLiver disease
HyperthyroidismSickle cell disease (homozygous)
Haemoglobin C diseaseTable 11: Anaemia associated with normal, low and high MCHC.
Technical validation of FBC result associated with raised MCHC
All cases of raised MCHC from testing a sample on an automated haematology analyzer can potentially affect the result of the following red cell-related parameters (HB, PCV, MCV, MCH, RBC count and RDW) particularly in cases of cold agglutinin related raised MCHC. Such results must be investigated, cause identified and remedial action taken before result is released to the requesting clinicians. The most common causes of a raised MCHC includes: presence of cold agglutinins (Cold Haemagglutinin Disease), presence of spherocytes and lipaemia. Steps to obviate a raised MCHC results include:• Warm sample at 370c and retest (corrected in case of
cold agglutinins).• If not corrected spread a film and check for presence of
spherocytes• If not corrected centrifuge sample and check for lipaemia.
If lipaemic replace a said volume of plasma with saline and retest. Replace platelet count obtained with platelet count obtained in the initial raised MCHC result [41].
Mean Corpuscular Haemoglobin (MCH)
Mean Corpuscular Haemoglobin (MCH) is the average amount of hemoglobin in a person’s red cells. Normal MCH levels are around 27 to 33 picograms (pg) per cell in adults. 1 pg is equal to 10-12/L. It is calculated by dividing the total mass of haemoglobin by the number of red blood cells in a volume of blood MCH= (Hbx10)/RBC. MCH value is low in the following conditions; Hypochromic anaemia and Iron Deficiency Anaemia.
Red Cell Distribution Width (RDW)
The red blood cell distribution width (RDW) is a measure of variation red blood cell (RBC) size. It is easily
calculated by dividing the SD of erythrocyte volumes for the mean corpuscular volume. A modern refinement is the Red Cell Distribution width (RDW), which is a measurement of the variation in size of the RBC, and attempts to give a figure to the degree of anisocytosis, this being a morphological term indicating how much the cells vary in size. It has become increasingly clear that an increased RDW, even in the presence of an otherwise completely normal count, is cause for concern, and the smear must be examined [5]. Normal RDW is about 11.0%–16.0% in normal population and tend to be increased under some physiological and pathological conditions Lippi and Plebani [42], Salvagno, et al. [43]. It is correlates with the degree of anisocytosis or variation in red blood cell width. Normal Range is from 10-15% [44]. RDW may be closely related to the development of ischaemic stroke, carotid artery atherosclerosis and cerebral embolism [45]. Tables 12 & 13 shows the conditions where RDW may be clinically significance.
Chronic liver diseaseColorectal Cancer
Different types of anaemiaIron deficiencyKidney disease
Sickle cell anaemiaThalassemia
Polycythaemia Vera [46]Ischaemic stroke
Carotid artery atherosclerosisCerebral embolism
Table 12: Condition where RDW may be clinically significance.

Haematology International Journal11
Erhabor O, et al. Interpretation of Full Blood Count Parameters in Health and Disease. Haematol Int J 2021, 5(1): 00180.
Copyright© Erhabor O, et al.
Anaemia Type Normal RDW High RDW
Microcytic Thalassaemia
Iron deficiency anemia
Some haemolytic anaemias
Normocytic
Acute blood loss anaemia
Combined anaemias
Anaemia of chronic disease Sickle cell anaemia
Spherocytosis Sideroblastic anaemia
Chronic blood loss
Macrocytic
Aplastic anaemia B12/folate deficiency
Preleukaemia Cold agglutinin disease
Liver diseaseAnaemia Type Normal RDW High RDW
Table 13: Examples of Anaemias Based on MCV and RDW.
The Platelets
A platelet blood count is an important component of a FBC That measures the average number of platelets in the blood. The normal range for platelet count is 150-500 x109/L. Platelets are circulating 3 to 4 μm diameter anuclear fragment of a bone marrow megakaryocyte. Platelets function by maintaining the integrity of the vascular tree, producing the platelet plug in the first phase of clotting, and by producing platelet factor 3, an essential component of the coagulation cascade [47]. Platelet concentration is measured either manually using a haemocytometer or in an automated platelet analyzer based on electrical impedance principle. Low platelet count is known as thrombocytopenia. Platelets are rapidly deployed to sites of injury or infection, and potentially modulate inflammatory processes by interacting with leukocytes and by secreting cytokines, chemokines and other inflammatory mediators. High platelet count is known as thrombocytosis. Patients with low platelet count are said to be thrombocytopenic while those with high platelet count are said to have thrombocytosis. Platelets are important in the initiation of thrombosis and their morphological and functional changes are closely related with the occurrence and development of coronary artery thrombosis [48]. The platelet count and its size can also be used to determine the thrombopoietic activity of the bone marrow. Also, an increase (thrombocytosis) or decrease (thrombocytopenia) in platelet numbers can also point to disorders of haemostasis [49] or liver disease [50] (Tables 14 & 15).
Reactive Myeloproliferative neoplasms Other Causes
Chronic infection Essential thrombocytosis
Associated with other
myeloid neoplasms
Chronic inflammation Polycythemia vera
CongenitalMalignancy
Hyposplenism (post-splenectomy)
Iron deficiencyAcute blood loss
Table 14: Common Causes of Thrombocytosis.
Aplastic anaemiaBabesiosis
ChemotherapyDengue fever
Drug-induced thrombocytopenic purpura (heparin-induced thrombocytopenia (HIT)
Familial thrombocytopeniaGaucher’s diseaseHELLP syndrome
Haemolytic–uremic syndromeIdiopathic thrombocytopenic purpura
Immune thrombocytopenias (ITP)Neonatal alloimmune associated
OnyalaiPregnancy associated
Pseudo thrombocytopeniaSplenomegaly
Thrombotic thrombocytopenic purpuraTransfusion associated
Gilbert’s syndrome
Table 15: Common Causes of Thrombocytopenia.
Reticulocyte Count (% and absolute values)
Reticulocytes are immature red blood cells produced in the bone marrow and released into the peripheral blood where they mature into RBCs within 1 to 2 days. An increase or decrease in reticulocyte count can be an index to measure erythropoietic activity or failure following anaemia, haemorrhage and bone marrow dysfunction. Reticulocyte

Haematology International Journal12
Erhabor O, et al. Interpretation of Full Blood Count Parameters in Health and Disease. Haematol Int J 2021, 5(1): 00180.
Copyright© Erhabor O, et al.
count is a component of the FBC that measures the compensatory ability of the bone marrow to replenish red cells in circulation. The reticulocyte count is reported as the percentage of reticulocytes divided by the total number of red blood cells x 100. The reference range of the reticulocyte percentage in adults is 0.5% to 2.5% in adults and 2% to 6%. Reticulocyte count can either be determined manually by light microscopy light microscopy of blood sample supravitally stained using new methylene blue or brilliant cresyl blue or by automated analyzers using fluorescent dye which stain the RNA and DNA allowing for laser excitation and detection (Table 16). The reticulocyte production index is calculated is used to determine if the bone marrow activity or response
in certain situation (acute haemorrhage and haemolysis) is adequate. Reticulocyte production index (RPI)=% Reticulocyte count x Patient Haematocrit/45(Normal Haematocrit). RPI=>2.5 in a haemorrhage patient is a sign of adequate compensatory erythropoietic activity. Reticulocyte count play a role in the diagnosis of the following conditions:• Anaemia• Bone marrow aplasia • It can help in monitoring patients on chemotherapy,
radiotherapy, engraftment following a bone marrow transplant and following treatment for Fe deficiency anaemia.
Conditions Associated with a low Reticulocyte count Conditions Associated with a high Reticulocyte count
Iron deficiency anaemia Increased premature destruction (haemolytic anaemia)
Nutritional deficiency (Folic acid and vitamin B-12 deficiency) At high altitudes due to hypoxia.
Aplastic anaemia Haemolytic Disease of the Foetus and Newborn (HDFN)
Bone marrow failure due to effect of drug toxicity, infection or cancer
Chronic Blood Loss [51]
Kidney disease
Liver Cirrhosis
Side effects from chemotherapy and radiotherapy
Hypo proliferative disorders
Iron deficiency anaemia
Table 16: Conditions associated with Low and High reticulocyte count.
Platelet Distribution Width (PDW)
Platelet distribution width (PDW) is a component of a normal FBC. It reflects a variation in the size distribution (platelet anisocytosis). Normal range of PDW is 9.6 to 15.3 femtolitres. PDW tend to be increased in inflammatory reaction and clinical diseases. Platelet activation increases PDW [52]. Inflammatory cytokines [interleukin-6 (IL-6), granulocytes colony stimulating factor (G-CSF) and macrophage colony stimulating factor (M-CSF)] regulate megakaryocytic maturation, platelet production and platelet size [53]. It can be used for the diagnosis of immune thrombocytopenia [54]. Increased PDW values have been reported in patients with a wide range of diseases; Diabetes mellitus [55]; Cancer [56]; Cardio-cerebrovascular and respiratory disorders [57,58]. Increased morbidity and mortality among patients with critical illness [59], coronary artery disease [60], cancer [61,62], pulmonary embolism [63] and chronic obstructive pulmonary disease [64].
Mean Platelet Volume (MPV)
MPV measures the average size of platelets. MPV depends on the degree of stimulation of megakaryocyte dependent on thrombopoietic stress. Normal range for MPV is 8.9 to 11.8 femtoliters. Platelets are produced in the bone marrow by megakaryocytes, which are large precursor cells. Platelets play a role in clots formation following a break in vascular endothelium, prevent infection and promote healing. A high MPV with the following platelet counts can suggest associated conditions: Low platelet count along with high MPV occurs when platelets are destroyed, usually by antibodies, an infection, or toxins. For example, immune thrombocytopenic purpura (ITP) is a platelet deficiency caused by the destruction of platelets without a known cause. High platelet count along with high MPV can occur when the bone marrow produces too many platelets, typically due to a genetic mutation or cancer. Normal platelet count along with high MPV suggests conditions such as hyperthyroidism or chronic myelogenous leukemia (CML)- a type of cancer [65].

Haematology International Journal13
Erhabor O, et al. Interpretation of Full Blood Count Parameters in Health and Disease. Haematol Int J 2021, 5(1): 00180.
Copyright© Erhabor O, et al.
Platelet count and volume can be affected by factors such as altitude, hormones, and health risk factors as shown in
Tables 17 & 18.
People who live at low altitudes (below sea level) may have higher than average platelet counts. Those who live at high altitudes may have a high MPV, which has been considered a possible risk factor for heart disease [66]
Smoking, high blood pressure, and high glucose levels (without a diagnosis of diabetes) have all been associated with a high MPV in men [67]
Menstruation and oral contraceptives are associated with high MPV in women.Strenuous exercise has also been associated with an increase in platelet count if it is severe enough to cause tissue dam-
age.
Table 17: Factors that affect platelet count and volume.
Conditions associated with High MPV Conditions associated with Low MPV
Bernard-Soulier Disease (giant platelet syndrome)Low platelet counts along with low MPV points toward bone marrow
disorders that slow down or decrease the production of platelets, such as aplastic anemia.
Bone marrow stimulating drugs, such as erythropoietin or thrombopoietin
High platelet count along with low MPV often signifies an infection, inflammation, or cancer.
Diabetes mellitus [68] Normal platelet count along with low MPV is common with chronic kidney failure.
Genetic abnormalities in platelets
Low platelet counts along with low MPV points toward bone marrow disorders that slow down or decrease the production of platelets,
such as aplastic anemia.
Heart disease or artificial heart valves [69-70].Hyperthyroidism
Non-alcoholic liver diseasePre-eclampsia (toxemia of pregnancy) and HELLP
syndromeRespiratory diseases
Sepsis [71].Table 18: Conditions associated with High and Low MPV.
There are several conditions that may be associated with a low MPV and variable platelet counts as shown in Table 19.
Bone marrow failureLupus
Splenomegaly (an enlargement of the spleen), which often causes platelets to be trapped in the spleenMedications that suppress platelet formation, such as chemotherapy
HypothyroidismIron deficiency anemia
HIV/AIDS [72].Increased MPV value is associated, among others, with hypertension [73]
Diabetes mellitus [74]Renal failure [75]Atrial fibrillation
Elderly [76]Obese patients [77]
Smokers [78]
Table 19: Conditions associated with Low MPV and Variable Platelet Counts.
Haematology International Journal14
Erhabor O, et al. Interpretation of Full Blood Count Parameters in Health and Disease. Haematol Int J 2021, 5(1): 00180.
Copyright© Erhabor O, et al.
Platelet Large Cell Ratio (PLCR)
Platelet-large cell ratio (P-LCR) reflects the proportion of platelets greater than 12 fL (Normal P-LCR is < 30% in the total platelet count). P-LCR is also considered as an indicator of risk factor associated with thromboembolic ischemic events [79]. P-LCR was inversely related to platelet count and directly related to PDW and MPV. Platelet large cell ratio if properly utilized can be a good aid in the differential diagnosis of conditions associated with abnormal platelet counts [80]. Larger platelets are usually relatively young, contain more intracellular granules and more thrombogenic potential. Platelet turnover play a significant role in platelets size. Inflammatory cytokines (interleukin 3 and interleukin 6) play a significant role in the regulation of platelet pool and leads to the production of larger platelets that are more reactive [81,82].
Immature Granulocytes (IG)
Determination of IG count is a component of FBC
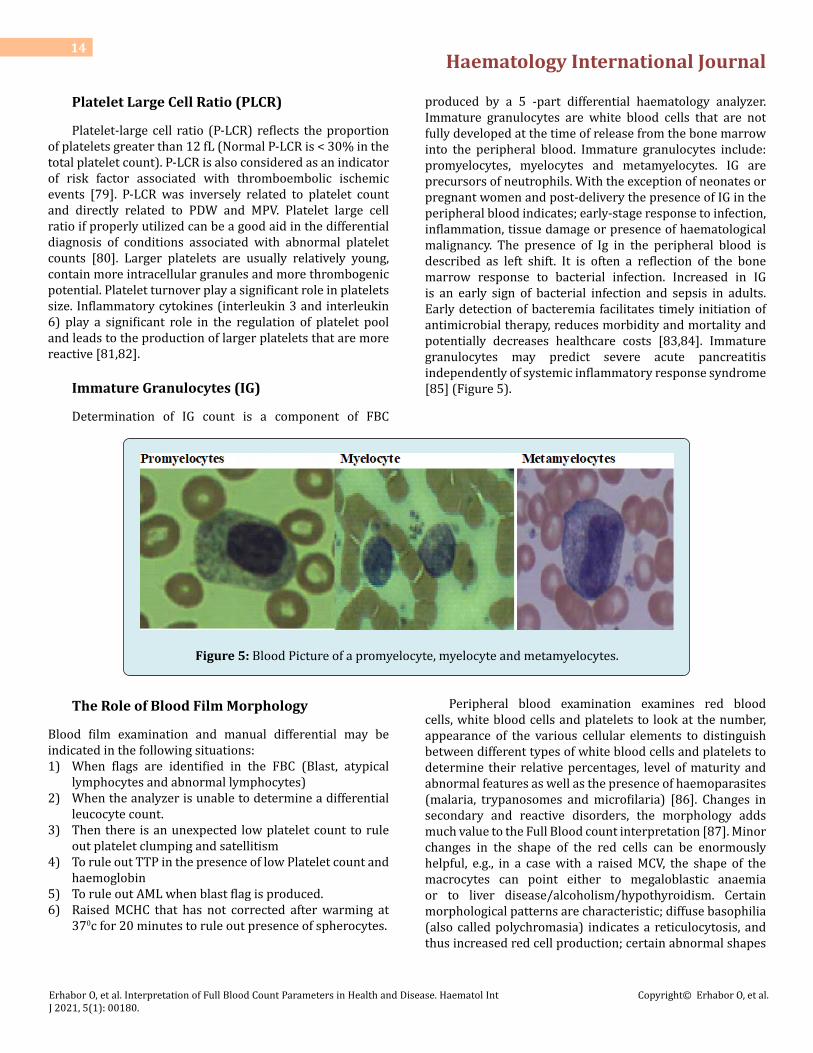
produced by a 5 -part differential haematology analyzer. Immature granulocytes are white blood cells that are not fully developed at the time of release from the bone marrow into the peripheral blood. Immature granulocytes include: promyelocytes, myelocytes and metamyelocytes. IG are precursors of neutrophils. With the exception of neonates or pregnant women and post-delivery the presence of IG in the peripheral blood indicates; early-stage response to infection, inflammation, tissue damage or presence of haematological malignancy. The presence of Ig in the peripheral blood is described as left shift. It is often a reflection of the bone marrow response to bacterial infection. Increased in IG is an early sign of bacterial infection and sepsis in adults. Early detection of bacteremia facilitates timely initiation of antimicrobial therapy, reduces morbidity and mortality and potentially decreases healthcare costs [83,84]. Immature granulocytes may predict severe acute pancreatitis independently of systemic inflammatory response syndrome [85] (Figure 5).
Figure 5: Blood Picture of a promyelocyte, myelocyte and metamyelocytes.
The Role of Blood Film Morphology
Blood film examination and manual differential may be indicated in the following situations:1) When flags are identified in the FBC (Blast, atypical
lymphocytes and abnormal lymphocytes)2) When the analyzer is unable to determine a differential
leucocyte count.3) Then there is an unexpected low platelet count to rule
out platelet clumping and satellitism4) To rule out TTP in the presence of low Platelet count and
haemoglobin5) To rule out AML when blast flag is produced.6) Raised MCHC that has not corrected after warming at
370c for 20 minutes to rule out presence of spherocytes.
Peripheral blood examination examines red blood cells, white blood cells and platelets to look at the number, appearance of the various cellular elements to distinguish between different types of white blood cells and platelets to determine their relative percentages, level of maturity and abnormal features as well as the presence of haemoparasites (malaria, trypanosomes and microfilaria) [86]. Changes in secondary and reactive disorders, the morphology adds much value to the Full Blood count interpretation [87]. Minor changes in the shape of the red cells can be enormously helpful, e.g., in a case with a raised MCV, the shape of the macrocytes can point either to megaloblastic anaemia or to liver disease/alcoholism/hypothyroidism. Certain morphological patterns are characteristic; diffuse basophilia (also called polychromasia) indicates a reticulocytosis, and thus increased red cell production; certain abnormal shapes

Haematology International Journal15
Erhabor O, et al. Interpretation of Full Blood Count Parameters in Health and Disease. Haematol Int J 2021, 5(1): 00180.
Copyright© Erhabor O, et al.
are implicated in poor oxygen delivery to the tissues [88].
Differential Leucocytes Count
The white cells or leukocytes in the peripheral blood comprise of five types of cell:• The Neutrophils• The Eosinophils• The BasophilsThese above three comprise the granulocytes.• The Monocytes• The lymphocytes
Leucocyte differential can be counted either manually (100 total cells are counted). The count of each type of cell is thus first expressed as a percentage and the absolute values are calculated by dividing the differential count in percentage divided by 100 multiplied by the WBC count. The differential lymphocyte count can also be produced by automated FBC auto analyzers along with the absolute values [38]. Changes in peripheral leucocyte count can be highly informative in medical practice and the cell line involved can be specific to certain scenarios. Leucocytosis with an associated neutrophilia or lymphocytosis could infer the presence of a microbial or viral infection [89]. A decrease in the WBC could also be caused by a chemotoxic effect during chemotherapy [90]. Clinicians can use the WBC biomarker to improve risk
prognostication and identify patients in need of immediate treatment and a closer follow-up.
Neutrophilia: Neutrophilia is defined as absolute neutrophil count above 7.5 x 10⁹/L. Normal absolute neutrophil count is 2.0-7.5 x 10⁹/L. Neutrophilia is commonly seen in patients with bacterial infection. The most severe infections are associated with more marked neutrophilia and often a degree of myeloid left shift the presence of immature myeloid cells in peripheral blood) with ‘toxic’ neutrophils granulation. Neutrophilia may also be seen in non-infective disorders. It is a common response to steroid therapy, severe exercise, and following surgery or splenectomy, but can also occur in systemic vasculitis, in the presence of tissue necrosis/burns, Bacteria infection, steroid, post-surgery, Extreme exercise, systemic Vasculitis, Carcinoma and as a response to certain tumours, cadiopulmonary diseases, smoking, etc. Isolated neutropenia can be seen in connective tissue disorders, particularly rheumatoid arthritis and Sjogren’s disease. It can be a result of drug therapy (clozapine, azathioprine, carbimazole and cytotoxic chemotherapy). Patients may need careful and regular monitoring when treated with these agents. It is commonly seen following viral infection (Epstein-Barr virus infection). Physiological Neutrophilia can occur as a normal physiological process. Examples of conditions associated with Neutrophilia and Physiological Neutrophilia are shown in Table 20 & Figure 6.
Conditions associated with Neutrophilia Conditions associated Physiological NeutrophiliaSome fungal infections. Neonates have a higher neutrophil count
Some parasitic infections (Pneumocystis carinii) Women of childbearing age have higher neutrophil counts than men
Acute and chronic bacterial infection (pyogenic bacteria including miliary TB).
Pregnancy causes a marked rise in the neutrophil count
Chronic Myeloid leukaemia Child birth or labour is associated with neutrophiliaInflammation
Vigorous exercise can double the neutrophil count (distribution of white cells within the circulation).
Tissue damage (trauma, surgery, burns, acute pancreatitis)In patient with sickle cell crisis.
Acute hypoxia.Metabolic and endocrine disorders: eg, diabetic ketoacidosis, acute
renal failure, Cushing’s syndrome, eclampsia and pre-eclampsiaSome viral infections (chickenpox, herpes simplex).
InfarctionBurns
Malignancy: carcinoma, lymphoma, melanoma, sarcomaDrugs, especially corticosteroids.
Myeloproliferative and leukaemic disorders (CML, MPD, CMML).
Table 20: Conditions associated with Neutrophilia and Physiological Neutrophilia.

Haematology International Journal16
Erhabor O, et al. Interpretation of Full Blood Count Parameters in Health and Disease. Haematol Int J 2021, 5(1): 00180.
Copyright© Erhabor O, et al.
Figure 6: Blood Picture showing Neutrophilia and Chronic Myeloid Leukaemia.
Neutropenia is defined as absolute neutrophil count less than 1.0 x 10⁹/L. Neutropenic patients are more susceptible to bacterial infections and without prompt treatment with broad-spectrum antibiotics can develop life-threatening neutropenic sepsis [91]. Neutropenia is commonly associated with deficiencies of vit B12, folate, aplastic anaemia, tumors, effect of certain drug, metabolic diseases, e.t.c. A sudden onset neutropenia can be seen in patients with overwhelming bacterial infection and appears to be a poor prognostic sign. A significant persisting neutropenia requires the opinion of a haematologist particularly in patients with cytopenias in other lineages. Mild chronic neutropenia not associated with infection are reasonably common and are sometimes referred to as benign idiopathic neutropenia. Afro-Caribbean patients commonly show mild non-clinically significant neutropenia below the normal range seen in Caucasians [92].
Eosinophil: Eosinophilia is a much less common finding in clinical practice but the search for a likely cause is often rewarding. Normal absolute eosinophil count is 0-0.4 x 10⁹/L. Mild eosinophilia is common in patients with asthma, hay fever, parasitic infection, allergic condition, hypersensitivity-reaction, aspergillosis, vasculitis and eczema. Mild eosinophilia is common in patients with asthma, hay fever, and eczema but rarely exceeds 1.0 x 10⁹/L [93] (Figure 7). A few cases remain unexplained and were previously known as hyper eosinophilic syndrome but these patients are increasingly rare now that molecular diagnostics are able to characterize many of these as clonal eosinophilic leukaemia [37]. Table 21 shows the common causes of eosinophilia [94].
Acute myelogenous leukaemia (AML)Allergies
Ascariasis (a roundworm infection)Asthma
Atopic dermatitis (eczema)Cancer
Churg-Strauss syndromeCrohn’s disease (inflammatory bowel disease)
Drug allergyEosinophilic esophagitisEosinophilic leukaemia
Hay fever (allergic rhinitis)Hodgkin’s lymphoma (Hodgkin’s disease)
Hyper eosinophilic syndromeIdiopathic hyper eosinophilic syndrome (HES) (high
eosinophil count of unknown origin)Lymphatic filariasis (a parasitic infection)
Ovarian cancerParasitic infection
Primary immunodeficiencyTrichinosis (a roundworm infection)
Ulcerative colitisTable 21: Common causes of eosinophilia.

Haematology International Journal17
Erhabor O, et al. Interpretation of Full Blood Count Parameters in Health and Disease. Haematol Int J 2021, 5(1): 00180.
Copyright© Erhabor O, et al.
Figure 7: Picture showing Eosinophilia and Eosinophilic Leukaemia.
Monocytosis: Monocytosis is an increase in the number of monocytes circulating in the blood. Normal monocytes count is 0.2-0.8 x10⁹/L. Monocytosis can be a feature in chronic infection with tuberculosis and syphilis, as part of the inflammatory reaction in Crohn’s disease and ulcerative colitis and as a response to certain carcinomas. A persistent
monocytosis that is unexplained, particularly if associated with anaemia or thrombocytopenia, may be a feature of myelodysplastic and myeloproliferative disorders, so a haematology assessment is advised in these cases (Figure 8) [92]. Table 22 shows condition that are associated with monocytosis.
PregnancyInfections: tuberculosis, brucellosis, listeriosis, subacute bacterial endocarditis, syphilis, and other viral infections and many
protozoal and rickettsial infections (kala azar, malaria, Rocky Mountain spotted fever).Blood and immune causes: chronic neutropenia and myeloproliferative disorders.
Autoimmune diseases and vasculitis: systemic lupus erythematosus, rheumatoid arthritis and inflammatory bowel disease.Malignancies: Hodgkin’s disease and certain leukaemias, such as chronic myelomonocytic leukaemia (CMML) and monocytic
leukemia.
Table 22: Condition that are associated with monocytosis.
Figure 8: Picture showing monocytosis and chronic Myelomonocytic leukaemia.
Lymphocytosis: Lymphocytosis is a used to define higher-than-normal number of lymphocytes (absolute lymphocyte >4.5 x10⁹/L). Normal range is 1.5 -4.5 x 10⁹/L. Lymphocytes represent around 20 to 40% of WBC. If there is persistent
lymphocytosis > 7 x 10⁹/L with smear cells, it may necessary to request lymphocyte markers (flow immunophenotype) to rule out a lymphoproliferative disorder. If there are atypical or reactive lymphocytosis, it may be necessary to rule out

Haematology International Journal18
Erhabor O, et al. Interpretation of Full Blood Count Parameters in Health and Disease. Haematol Int J 2021, 5(1): 00180.
Copyright© Erhabor O, et al.
viral infection [infectious mononucleosis, Epstein-Barr Virus (EBV)] [95] (Figure 9). Lymphocytes play a role in humoral
and immune mediated immunity. Table 23 shows condition commonly associated with lymphocytosis.
Acute lymphocytic leukaemia (rapidly rising lymphocyte count and blast cells present)Chronic lymphocytic leukemia (lymphadenopathy or hepatosplenomegaly).
Cytomegalovirus (CMV) infectionViral infections (Hepatitis A, Hepatitis B, Hepatitis C, HIV/AIDS and HTLV-1)
Hypothyroidism (underactive thyroid)Pharyngitis
Non-Hodgkin’s Lymphoma (mantle cell lymphoma (mcl), marginal zone lymphoma, hairy cell leukemia, follicular lymphoma Sezary syndrome and adult T- cell lymphoma/leukemia (ATLL).
MononucleosisSyphilis
TuberculosisWhooping cough
Table 23: Shows condition commonly associated with lymphocytosis.
Figure 9: Picture showing lymphocytosis and chronic lymphocytic leukaemia.
Basophilia: Basophils are the least numerous of the myelogenous cells with large blue granules. Basophilia is defined as basophil count of 0-0.1 x10⁹/L. Basophilia in the presence of numerous circulating blasts suggests the possibility of acute myeloid leukemia. Elevation of basophils may also be representative of multiple other underlying neoplasms such as polycythemia vera (PV), myelofibrosis, thrombocythemia, or, in rare cases, solid tumors, allergic reactions or chronic inflammation related to infections such as tuberculosis, influenza, inflammatory bowel disorder, or an inflammatory autoimmune disease [96]. Chronic haemolytic anaemia and infectious diseases such as smallpox also demonstrate elevated basophil levels. Certain drug usage and food ingestion can also correlate with symptoms of basophilia [97]. Figure 10 shows the picture of a basophil.
Figure 10: Picture of a Basophil.

Haematology International Journal19
Erhabor O, et al. Interpretation of Full Blood Count Parameters in Health and Disease. Haematol Int J 2021, 5(1): 00180.
Copyright© Erhabor O, et al.
Morphology of Platelet
Thrombocytosis is commonly seen as a reactive phenomenon in patients with active chronic infection, inflammation, and malignancy. Chronic bleeding and iron deficiency anaemia is frequently associated with thrombocytosis and it will resolve when the bleeding source and iron deficiency is corrected. Reactive thrombocytosis seen after splenectomy, accounts for the majority of cases seen in general medical practice. Thrombocytosis is also a feature of a number of myeloproliferative disorders, often in association with abnormalities in the haemoglobin or platelet count. These cases will not show elevation of inflammatory
markers and the blood film typically shows large platelets with wide variation in individual size. As noted above, testing for the JAK2 mutation (rule out myeloproliferative disorders) can be very helpful in diagnosis. These patients are at increased risk of vascular occlusive events so it is important they are identified. Thrombocytopenia is seen in a myriad of medical scenarios but it is important to establish that it is not pseudo thrombocytopenia that is confirmed on a blood film. Spurious thrombocytopenia can result from in vitro platelet clumping and satellitism [98]. Table 24 shows conditions commonly associated with thrombocytosis and thrombocytopenia on a peripheral blood film examination.
Thrombocytosis Thrombocytopenia
Splenectomy Thrombotic Thrombocytopenic Purpura (TTP)
Inflammation (Reactive) Disseminated Intravascular Coagulation (DIC)
Myeloproliferative disease (ET) Immune Thrombocytopenia (ITP)
Iron deficiency anemia
Blood loss
Splenomegaly
Medication use (antibiotics)
Viral infections
Bone marrow disorder (leukaemia) [99]
Bone marrow failure (Aplastic anaemia)
Table 24: Conditions associated with thrombocytosis and thrombocytopenia on a peripheral blood film examination.
Technical and Clinical Validation of Unexpected Low Platelet Count
Medical laboratory scientists have a professional responsibility to ensure that result generated in the laboratory are accurate, precise and reproducible (Figures 10 & 11). All
cases of unexpected low platelet count must be investigated (technical and clinical validation) before releasing of result to the requesting clinician. This is to prevent the unnecessary and non-clinically indicated platelet transfusion. Table 25 shows the technical and clinical validation steps to be followed before releasing an unexpected low platelet count.
Technical validation of unexpected low platelet count Clinical validation in unexpected low platelet count
Check for integrity of sample (sample fresh, in right anticoagulated tube and appropriately stored).
Check clinical details of patient for possible cause of low platelet count [Bleeding (PPH, APH, GI Bleed, DIC, ITP, TTP]Check for presence of clot
Check blood film for platelet clumping and satellitism [100]
Table 25: Technical and clinical validation steps to be followed in case of an unexpected low platelet count.
Haematology International Journal20
Erhabor O, et al. Interpretation of Full Blood Count Parameters in Health and Disease. Haematol Int J 2021, 5(1): 00180.
Copyright© Erhabor O, et al.
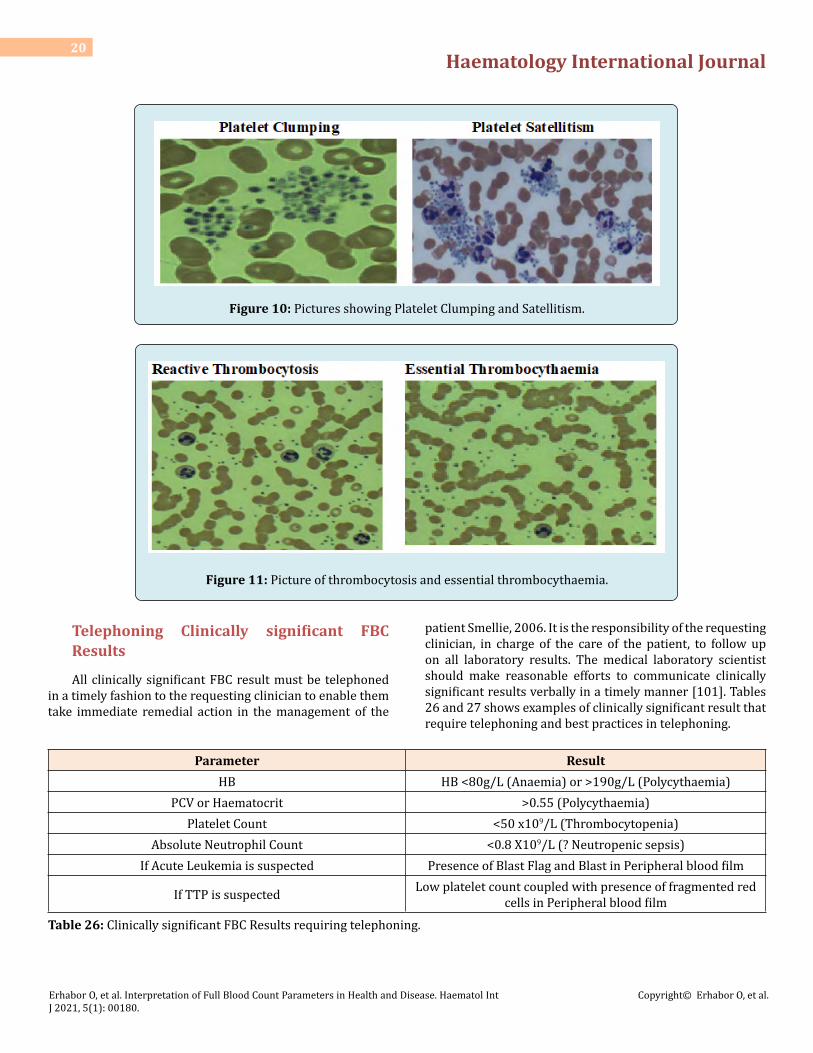
Figure 10: Pictures showing Platelet Clumping and Satellitism.
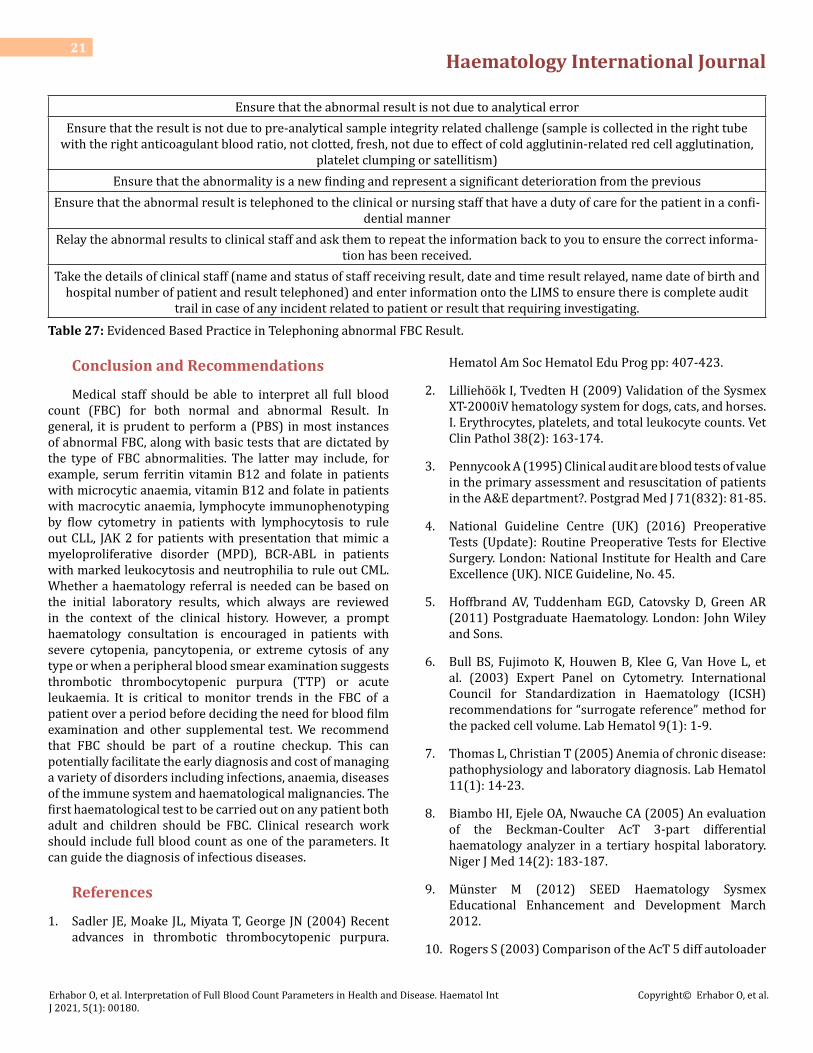
Figure 11: Picture of thrombocytosis and essential thrombocythaemia.
Telephoning Clinically significant FBC Results
All clinically significant FBC result must be telephoned in a timely fashion to the requesting clinician to enable them take immediate remedial action in the management of the
patient Smellie, 2006. It is the responsibility of the requesting clinician, in charge of the care of the patient, to follow up on all laboratory results. The medical laboratory scientist should make reasonable efforts to communicate clinically significant results verbally in a timely manner [101]. Tables 26 and 27 shows examples of clinically significant result that require telephoning and best practices in telephoning.
Parameter ResultHB HB <80g/L (Anaemia) or >190g/L (Polycythaemia)
PCV or Haematocrit >0.55 (Polycythaemia)Platelet Count <50 x109/L (Thrombocytopenia)
Absolute Neutrophil Count <0.8 X10⁹/L (? Neutropenic sepsis)If Acute Leukemia is suspected Presence of Blast Flag and Blast in Peripheral blood film
If TTP is suspected Low platelet count coupled with presence of fragmented red cells in Peripheral blood film
Table 26: Clinically significant FBC Results requiring telephoning.
Haematology International Journal21
Erhabor O, et al. Interpretation of Full Blood Count Parameters in Health and Disease. Haematol Int J 2021, 5(1): 00180.
Copyright© Erhabor O, et al.
Ensure that the abnormal result is not due to analytical errorEnsure that the result is not due to pre-analytical sample integrity related challenge (sample is collected in the right tube
with the right anticoagulant blood ratio, not clotted, fresh, not due to effect of cold agglutinin-related red cell agglutination, platelet clumping or satellitism)
Ensure that the abnormality is a new finding and represent a significant deterioration from the previousEnsure that the abnormal result is telephoned to the clinical or nursing staff that have a duty of care for the patient in a confi-
dential mannerRelay the abnormal results to clinical staff and ask them to repeat the information back to you to ensure the correct informa-
tion has been received.Take the details of clinical staff (name and status of staff receiving result, date and time result relayed, name date of birth and
hospital number of patient and result telephoned) and enter information onto the LIMS to ensure there is complete audit trail in case of any incident related to patient or result that requiring investigating.
Table 27: Evidenced Based Practice in Telephoning abnormal FBC Result.
Conclusion and Recommendations
Medical staff should be able to interpret all full blood count (FBC) for both normal and abnormal Result. In general, it is prudent to perform a (PBS) in most instances of abnormal FBC, along with basic tests that are dictated by the type of FBC abnormalities. The latter may include, for example, serum ferritin vitamin B12 and folate in patients with microcytic anaemia, vitamin B12 and folate in patients with macrocytic anaemia, lymphocyte immunophenotyping by flow cytometry in patients with lymphocytosis to rule out CLL, JAK 2 for patients with presentation that mimic a myeloproliferative disorder (MPD), BCR-ABL in patients with marked leukocytosis and neutrophilia to rule out CML. Whether a haematology referral is needed can be based on the initial laboratory results, which always are reviewed in the context of the clinical history. However, a prompt haematology consultation is encouraged in patients with severe cytopenia, pancytopenia, or extreme cytosis of any type or when a peripheral blood smear examination suggests thrombotic thrombocytopenic purpura (TTP) or acute leukaemia. It is critical to monitor trends in the FBC of a patient over a period before deciding the need for blood film examination and other supplemental test. We recommend that FBC should be part of a routine checkup. This can potentially facilitate the early diagnosis and cost of managing a variety of disorders including infections, anaemia, diseases of the immune system and haematological malignancies. The first haematological test to be carried out on any patient both adult and children should be FBC. Clinical research work should include full blood count as one of the parameters. It can guide the diagnosis of infectious diseases.
References
1. Sadler JE, Moake JL, Miyata T, George JN (2004) Recent advances in thrombotic thrombocytopenic purpura.
Hematol Am Soc Hematol Edu Prog pp: 407-423.
2. Lilliehöök I, Tvedten H (2009) Validation of the Sysmex XT-2000iV hematology system for dogs, cats, and horses. I. Erythrocytes, platelets, and total leukocyte counts. Vet Clin Pathol 38(2): 163-174.
3. Pennycook A (1995) Clinical audit are blood tests of value in the primary assessment and resuscitation of patients in the A&E department?. Postgrad Med J 71(832): 81-85.
4. National Guideline Centre (UK) (2016) Preoperative Tests (Update): Routine Preoperative Tests for Elective Surgery. London: National Institute for Health and Care Excellence (UK). NICE Guideline, No. 45.
5. Hoffbrand AV, Tuddenham EGD, Catovsky D, Green AR (2011) Postgraduate Haematology. London: John Wiley and Sons.
6. Bull BS, Fujimoto K, Houwen B, Klee G, Van Hove L, et al. (2003) Expert Panel on Cytometry. International Council for Standardization in Haematology (ICSH) recommendations for “surrogate reference” method for the packed cell volume. Lab Hematol 9(1): 1-9.
7. Thomas L, Christian T (2005) Anemia of chronic disease: pathophysiology and laboratory diagnosis. Lab Hematol 11(1): 14-23.
8. Biambo HI, Ejele OA, Nwauche CA (2005) An evaluation of the Beckman-Coulter AcT 3-part differential haematology analyzer in a tertiary hospital laboratory. Niger J Med 14(2): 183-187.
9. Münster M (2012) SEED Haematology Sysmex Educational Enhancement and Development March 2012.
10. Rogers S (2003) Comparison of the AcT 5 diff autoloader

Haematology International Journal22
Erhabor O, et al. Interpretation of Full Blood Count Parameters in Health and Disease. Haematol Int J 2021, 5(1): 00180.
Copyright© Erhabor O, et al.
hematology analyzer to the Abbott Cell-Dyn 3200 analyzer at Charlevoix Area Hospital. Lab Hematol 9(3): 160-166.
11. Meintker l, Ringwald J, Rauh M, Krause SW (2013) Comparison of Automated Differential Blood Cell Counts from Abbott Sapphire, Siemens Advia 120, Beckman Coulter DxH 800, and Sysmex XE-2100 in Normal and Pathologic Samples. Am J Clin Pathol 139(5): 641-650.
12. Pierre RV (2002) Peripheral blood film review. The demise of the eye count leukocyte differential. Clin Lab Med 22(1): 279-297.
13. Xu W, Yu Q, Xie L, Chen B, Zhang L (2017) Evaluation of Sysmex XN-1000 hematology analyzer for cell count and screening of malignant cells of serous cavity effusion. Med 96(27): 7433.
14. Sysmex XN-1000™ Hematology Analyzer.
15. International Committee for Standardization in Haematology; Expert Panel on Cytometry (1988) The assignment of values to fresh blood used for calibrating automated blood cell counters. Clin Lab Haematol 10: 203-212.
16. NCCLS (1999) Calibration and Quality Control of Automated Hematology Analyzers. Proposed Standard, NCCLS document H38-P. NCCLS, PA 19087-1898.
17. Briggs C, Culp N, Davis B, Onofrio DG, Zini G, et al. (2014) ICSH guidelines for the evaluation of blood cell analysers including those used for differential leucocyte and reticulocyte counting. Int J Lab Hematol 36(6): 613-627.
18. Rabinovitch A, Barnes P, Curcio KM, Dorman J, Huisman A, et al. (2010) Validation, Verification, and Quality Assurance of Automated Hematology Analyzers; Approved Standards- 2nd (Edn.), Clinical and Laboratory Standards Institute.
19. Gulati GL, Hyun BH (1986) Quality control in hematology. Clin Lab Med 6(4): 675-688.
20. Van Assendelft OW, Houwen B (2002) Calibration, Control of Hematology Analyzers. Elite Learning 11(2): 43.
21. Tatsumi N, Takubo T, Tsuda I, Hino M (1997) [Current problems in quality control (QC) in Hematology]. Rinsho Byori 45(10): 997-1002.
22. Cembrowski GS, Smith B, Tung D (2010) Rationale for using insensitive quality control rules for today’s hematology analyzers. Int J Lab Hematol 32(2): 606-615.
23. Ozarda Y, Ichihara K, Barth J, Klee G (2013) Committee on Reference Intervals and Decision Limits (C-RIDL), International Federation for Clinical Chemistry and Laboratory Medicine, Protocol and standard operating procedures for common use in a worldwide multicenter study on reference values. Clin Chem Lab Med 51(5): 1027-1040.
24. Tefferi A, Elliott MA (2004) Schistocytes on the peripheral blood smear. Mayo Clin Proc 79(6): 809.
25. Valberg LS, Sorbie J, Ludwig J, Pelletier O (1976) Serum ferritin and the iron status of Canadians. Can Med Assoc J 114(5): 417-421.
26. Myers AM, Saunders CRG, Chalmers DG (1968) The haemoglobin level of fit elderly people. Lancet 2(7562): 261-263.
27. Murphy WG (2014) The sex difference in haemoglobin levels in adults- mechanisms, causes, and consequences. Blood Rev 28(2): 41-47.
28. Jelkmann W (2011) Regulation of erythropoietin production. J Physiol 589(6): 1252-1258.
29. Shahani S, Braga Basaria M, Maggio M, Basaria S (2009) Androgens and erythropoiesis: past and present. J Endocrinol Invest 32(8): 704-716.
30. Gwak MS, Choi SJ, Kim JA, Ko JS, Kim TH, et al. (2007) Effects of gender on white blood cell populations and neutrophil-lymphocyte ratio following gastrectomy in patients with stomach cancer. J Korean Med Sci Suppl pp: 104-108.
31. Blumenreich MS (1990) The White Blood Cell and Differential Count. In: Walker HK, et al. (Eds.), Clinical Methods: The History, Physical, and Laboratory Examinations. 3rd (Edn.), Boston: Butterworths, USA.
32. Madjid M, Fatemi O (2013) Components of the complete blood count as risk predictors for coronary heart disease: in-depth review and update. Tex Heart Inst J 40(1): 17-29.
33. Jee SH, Park JY, Kim HS, Lee TY, Samet JM (2005) White blood cell count and risk for all-cause, cardiovascular, and cancer mortality in a cohort of Koreans. Am J Epidemiol 162(11): 1062-1069.
34. Trent RJA (2006) Diagnosis of the Haemoglobinopathies. Clin Biochem Rev 27(1): 27-38.
35. Taher AT, Musallam KM, Inati A (2009) Iron overload: consequences, assessment and monitoring. Hemoglobin 33(1): 46-57.

Haematology International Journal23
Erhabor O, et al. Interpretation of Full Blood Count Parameters in Health and Disease. Haematol Int J 2021, 5(1): 00180.
Copyright© Erhabor O, et al.
36. Tettey M, Aniteye E, Sereboe F, Kotei ED, Tamatey M, et al. (2009) Predictors of post-operative bleeding and blood transfusion in cardiac surgery. Ghana Med J 43(2): 71-76.
37. Bolton Maggs PH, Wood EM, Wiersu Osselton JC (2015) Wrong blood in tube potentials for desrious outcomes. Br J Haematol 168(1): 3-13.
38. Sarma PR (1990) Red Cell Indices. In: Walker HK, et al. (Eds.), Clinical Methods: The History, Physical, and Laboratory Examinations. 3rd (Edn.), Boston: Butterworths, USA.
39. Brill JR, Baumgardner DJ (2000) Normocytic anemia. Am Fam Phy 62(10): 2255-2264.
40. Sgnaolin V, Engroff P, Ely LS, Schneider RH, Schwanke CHG, et al. (2013) Hematological parameters and prevalence of anemia among free-living elderly in south Brazil. Rev Bras Hematol Hemoter 35(2): 115-118.
41. Pendse S, Singh AK (2015) Complications of chronic kidney disease: anemia, mineral metabolism, and cardiovascular disease. Med Clin North Am 89(3): 549-561.
42. Lippi G, Plebani M (2014) Red blood cell distribution width (RDW) and human pathology. One size fit all. Clin Chem Lab Med 52(9): 1247-1249.
43. Salvagno GL, Sanchis Gomar F, Picanza A, Lippi G (2015) Red blood cell distribution width: a simple parameter with multiple clinical applications. Crit Rev Clin Lab Sci 52(2): 86-105.
44. Alcindor T, Bridges KR (2002) Sideroblastic anaemias. Br J Haematol 116(4): 733-743.
45. Ani C, Ovbiagele B (2009) Elevated red blood cell distribution width predicts mortality in persons with known stroke. J Neurol Sci 277(1-2): 103-108.
46. Yonemitsu H, Kodama A, Sakuma H, Oyama M, Shimada T, et al. (1989) [Clinical significance of red cell distribution width in polycythemia vera]. Rinsho Byori 37(7): 813-818.
47. Stiff PJ (1990) Platelets. In: Walker HK, et al. (Eds.), Clinical Methods: The History, Physical, and Laboratory Examinations, 3rd (Edn.), Boston, Butterworths, USA.
48. Ding L, Sun L, Wang F, Zhu L, Zhang T, et al. (2019) Clinical Significance of Platelet Volume and Other Platelet Parameters in Acute Myocardial Infarction and Stable Coronary Artery Disease. Arq Bras Cardiol 112(6): 715-719.
49. Radaelli F, Colombi M, Calori R, Zilioli VR, Bramanti S, et al. (2007) Analysis of risk factors predicting thrombotic and/or haemorrhagic complications in 306 patients with essential thrombocythemia. Hematol Oncol 25(3): 115-120.
50. Adams LA (2011) Biomarkers of liver fibrosis. J Gastroenterol Hepatol 26(5): 802-809.
51. Gehrs BC, Friedberg RC (2002) Autoimmune hemolytic anemia. Am J Hematol 69(4): 258-271.
52. Vagdatli E, Gounari E, Lazaridou E, Katsibourlia E, Tsikopoulou F, et al. (2010) Platelet distribution width: a simple, practical and specific marker of activation of coagulation. Hippokratia 14(1): 28-32.
53. Kaushansky K (1998) Growth factors and hematopoietic cell fate. A new feature: controversies in haematology. Blood 92(2): 345-344.
54. Kaito K, Otsubo H, Usui N, Yoshida M, Tanno J, et al. (2005) Platelet size deviation width, platelet large cell ratio, and mean platelet volume have sufficient sensitivity and specificity in the diagnosis of immune thrombocytopenia. Br J Haematol 128(5): 698-702.
55. Jindal S, Gupta S, Gupta R, Kakkar A, Singh HV, et al. (2011) Platelet indices in diabetes mellitus: indicators of diabetic microvascular complications. Hematol 16(2): 86-89.
56. Yu YJ, Li N, Yun ZY, Niu Y, Xu JJ, et al. (2017) Preoperative mean platelet volume and platelet distribution associated with thyroid cancer. Neoplasms 64(4): 594-598.
57. Kamisli O, Kamisli S, Kablan Y, Gonullu S, Ozcan C (2013) The prognostic value of an increased mean platelet volume and platelet distribution width in the early phase of cerebral venous sinus thrombosis. Clin Appl Thromb Hemost 19(1): 29-32.
58. Sezgi C, Taylan M, Kaya H, Sen HS, Abakay O, et al. (2015) Alterations in platelet count and mean platelet volume as predictors of patient outcome in the respiratory intensive care unit. Clin Respir J 9(4): 403-408.
59. Zhang S, Cui YL, Diao MY, Deng Chang C, Zhao Fen L, et al. (2015) Use of platelet indices for determining illness severity and predicting prognosis in critically ill patients. Chin Med J 128(15): 2012-2018.
60. Kern A, Gil RJ, Bojko K, Sienkiewicz E, Januszko Giergielewicz B, et al. (2017) Platelet distribution width as the prognostic marker in coronary bifurcation treatment. Eur J Clin Invest 47(7): 524-530.

Haematology International Journal24
Erhabor O, et al. Interpretation of Full Blood Count Parameters in Health and Disease. Haematol Int J 2021, 5(1): 00180.
Copyright© Erhabor O, et al.
61. Takeuchi H, Abe M, Takumi Y, Hashimoto T, Kobayashi R, et al. (2017) The prognostic impact of the platelet distribution width-to-platelet count ratio in patients with breast cancer. PLoS One 12(12): e0189166.
62. Song X, Zhu H, Pei Q, Tan F, Li C, et al. (2017) Significance of inflammation-based indices in the prognosis of patients with non-metastatic colorectal cancer. Oncotarget 8(28): 45178-45189.
63. Araz O, Albez FS, Ucar EY, Kerget B, Yilmaz N, et al. (2017) Predictive value of mean platelet volume for pulmonary embolism recurrence. Lung 195(4): 497-502.
64. Bialas AJ, Pedone C, Piotrowski WJ, Incalzi RA (2017) Platelet distribution width as a prognostic factor in patients with COPD -pilot study. Int J Chron Obstruct Pulmon Dis 12: 2261-2267.
65. Icli A, Tayyar S, Varol E, Aksoy F, Arslan A, et al. (2013) Mean platelet volume is increased in infective endocarditis and decreases after treatment. Med Princ Pract 22(3): 270-273.
66. Al Sweedan SA, Alhaj M (2012) The effect of low altitude on blood count parameters. Hematol Oncol Stem Cell Ther 5(3): 158-161.
67. Alper AT, Sevimli S, Hasdemir H, Nurkalem Z, Guvenc TS, et al. (2009) Effects of high altitude and sea level on mean platelet volume and platelet count in patients with acute coronary syndrome. J Thromb Thrombolysis 27(2): 130-134.
68. Korniluk A, Koper Lenkiewicz OM, Kaminska J, Kemona H, Dymicka Piekarska V (2019) Mean Platelet Volume (MPV): New Perspectives for an Old Marker in the Course and Prognosis of Inflammatory Conditions. Mediators of Inflamm.
69. Schmoeller D, Picarelli MM, Paz Munhoz T, Poli de figueiredo CE, Staub HL (2017) Mean Platelet Volume and Immature Platelet Fraction in Autoimmune Disorders. Front Med (Lausanne) 4: 146.
70. Endler G, Klimesch A, Sunder Plassmann H, Schillinger M, Exner M, et al. (2002) Mean platelet volume is an independent risk factor for myocardial infarction but not for coronary artery disease. Br J Haematol 117(2): 399-404.
71. Yan K, Ding B, Huang J, Dai Y, Xiong S, et al. (2015) Normal platelet counts mask abnormal thrombopoiesis in patients with chronic myeloid leukemia. Oncol Lett 10(4): 2390-2394.
72. Qadri S, Holman S, Dehovitz J, Crystal H, Minkoff H, et
al. (2013) Mean platelet volume is decreased in HIV-infected women. HIV Med 14(9): 549-555.
73. Karabacak M, Dogan A, Turkdogan AK (2014) Mean platelet volume is increased in patients with hypertensive crises. Platelets 25(6): 423-426.
74. Lippi G, Plebani M (2014) Red blood cell distribution width (RDW) and human pathology. One size fit all. Clin Chem Lab Med 52(9): 1247-1249.
75. Ucar H, Gur M, Koyunsever NY, Seker T, Turkoglu C, et al. (2014) Mean platelet volume is independently associated with renal dysfunction in stable coronary artery disease. Platelets 25(4): 274-278.
76. De Luca G, Secco GG, Verdoia M, Cassetti E, Schaffer A, et al. (2014) Combination between mean platelet volume and platelet distribution width to predict the prevalence and extent of coronary artery disease: results from a large cohort study. Blood Coagul. 25(1): 86-91.
77. Kalay N, Dogdu O, Koc F, Yarlioglues M, Ardic I, et al. (2012) Hematologic parameters and angiographic progression of coronary atherosclerosis. Angiol 63(3): 213-217.
78. Cho SY, You E, Lee HJ, Lee WI, Park TS, et al. (2014) Smoking cession decreases mean platelet volume in healthy Korean populations. Clin Lab 60(8): 1413-1416.
79. Grotto HZ, Noronha JF (2004) Platelet larger cell ratio (P-LCR) in patients with dyslipidemia. Clin Lab Haematol 26(5): 347-349.
80. Babu E, Basu D (2004) Platelet large cell ratio in the differential diagnosis of abnormal platelet counts. Journal of Pathology and Microbiology 47(2): 202-205.
81. Debili N, Masse JM, Katz A, Guichard J, Breton Gorius J, et al. (1993) Effects of the recombinant hematopoietic growth factors interleukin-3, interleukin-6, stem cell factor, and leukemia inhibitory factor on the megakaryocytic differentiation of CD34+ cells. Blood 82(1): 84-95.
82. Tschoepe D, Roesen P, Esser J, Schwippert B, Nieuwenhuis HK, et al. (1991) Large platelets circulate in an activated state in diabetes mellitus. Semin Thromb Hemost 17(4): 433-438.
83. Frings DP, Montag B, Heydorn A, Friedemann M, Pothmann W, et al. (2003) Immature granulocytes, immature myeloid cells and outcome in adult severe sepsis and septic shock, in Proceedings of the 16th Annual Congress of the European Society of Intensive Care Medicine (ESICM 03), Amsterdam, Netherlands.

Haematology International Journal25
Erhabor O, et al. Interpretation of Full Blood Count Parameters in Health and Disease. Haematol Int J 2021, 5(1): 00180.
Copyright© Erhabor O, et al.
84. Senthilnayagam B, Kumar T, Sukumaran JJM, Rao RK (2012) Automated Measurement of Immature Granulocytes: Performance Characteristics and Utility in Routine Clinical Practice. Pathol Res Intern 12: 483670.
85. Lipinski M, Rydzewska G (2017) Immature granulocytes predict severe acute pancreatitis independently of systemic inflammatory response syndrome. Przeglad Gastroenterologiczny 12(2): 140-144.
86. Pierre RV (2002) Peripheral blood film review. The demise of the eye count leukocyte differential. Clin Lab Med 22(1): 279-297.
87. Bashour FN, Teran JC, Mullen KD (2000) Prevalence of peripheral blood cytopenias (hypersplenism) in patients with nonalcoholic chronic liver disease. American J Gastroenterol 95(10): 2936-2939.
88. Ilesanmi OO (2010) Pathological basis of symptoms and crises in sickle cell disorder: implications for counseling and psychotherapy. Hematol Rep 2(1): 2.
89. Estridge BH, Reynolds PA, Walters NJ (2000) Basic haematology In: Estridge BH, et al. (Eds.), Basic Laboratory Techniques. 4th (Edn.), Albany NY: Delmar-Thompson Learning pp: 200-201.
90. Debled M, Houede N, Madranges N, Donamaria C, Floquet A, et al. (2007) Does chemotherapy-induced neutropaenia result in a postponement of adjuvant or neoadjuvant regimens in breast cancer patients? Results of a retrospective analysis. BJC 97(12): 1642-1647.
91. Schwartzberg LS (2006) Neutropenia: etiology and pathogenesis. Clin Cornerstone 8(5): 5-11.
92. Old JM (2003) Screening and genetic diagnosis of haemoglobin disorders. Blood Rev 17(1): 43-53.
93. Snow CF (2009) Laboratory diagnosis of vitamin B12 and
folate deficiency: a guide for the primary care physician. Arch Intern Med 159(12): 1289-1298.
94. Van den Bemt PM, Meyboom RHB, Egberts AC (2004) Drug-induced immune thrombocytopenia. Drug Saf 27: 1243-1252.
95. Brigden ML, Au S, Thompson S, Brigden S, Doyle P, et al. (1999) Infectious mononucleosis in an outpatient population: diagnostic utility of 2 automated hematology analyzers and the sensitivity and specificity of Hoagland’s criteria in heterophile-positive patients. Arch Pathol Lab Med 123(10): 875-881.
96. Sticco K, Lynch D (2019) “Basophilia”. National Center for Biotechnology Information, U.S. National Library of Medicine. StatPearls Publishing. PMID 30570986.
97. Talent P, Sotlar K, Blatt K, Hartmann K, Reiter A, et al. (2017) Proposed diagnostic criteria and classification of basophilic leukemias and related disorders. Leuk 31(4): 788-797.
98. Lombardo JF, Cusack NA, Rajagopalan C, Sangaline RJ, Ambruso DR (2019) Flow cytometric analysis of residual white blood cell concentration and platelet activation antigens double filtered platelet concentrates. J Lab Clin Med 122(5): 557-566.
99. Sadler JE, Moake JL, Miyata T, George JN (2014) Recent advances in thrombotic thrombocytopenic purpura. Hematol (American Society of Hematology Education Program), pp: 407-423.
100. Barron BA, Hoyer JD, Tefferi A (2016) A bone marrow report of absent stainable iron is not diagnostic of iron deficiency. J Hematol 80: 166-169.
101. IBMS (2018) Education and Professional Standards Committee. IBMS Policy on the Communication of Pathology Results, pp: 1-12.