internet use and opinion formation in countries with different
TRANSCRIPT

Observatorio (OBS*) Journal, 6 (2008), 121-149 1646-5954/ERC123483/2008 121
Internet Use and Opinion Formation in Countries with Different ICT Contexts
Ellen Helsper, Oxford Internet Institute, UK
Abstract Use of the internet has become central to social, civic and economic participation in many societies. Countries with early adopters and skilled users are clearly advantaged in comparison to those whose population remains disengaged. A positive public opinion about the internet and technologies can therefore be a major asset to the development and competitiveness of a country on the world stage. It remains unclear to which extent the processes through which public opinion about the internet is formed are similar around the world. World Internet Project data from Chile, the US and the UK are used to model the processes behind opinion formation in countries which are at different stages of development in terms of internet infrastructure and policy making. The findings show that socio-economic factors are more important in countries at the beginning of the diffusion curve, while individual skills and self-efficacy are more important in countries that are further developed. A proactive digital inclusion policy, as found in the UK, seems to achieve a reduction in the importance of skills and economics but cannot diminish the effects of socialization and exposure to ICTs Keywords: digital exclusion; ICT expertise; opinion; internet; international comparison.
In its early years, the internet was seen as a medium that might end social inequalities by providing access
to information and education without barriers. But it soon became clear that certain groups could not
access or use the internet and that the gap between the “information rich” and the “information poor”
might be growing (Commission of the European Communities, 2002; Jung, Qiu, & Kim, 2001; Norris 2001).
Such research has come to be known under the framework of the “digital divide” and “knowledge gap”
hypotheses (Warschauer, 2002). These assume that if no action is taken by policymakers the gap between
the advantaged and the disadvantaged is only going to grow wider.
There is no doubt that connectivity and the internet are indeed high on the agenda of many policy-makers
and researchers. The consequences of not having access to ‘new interactive’ media are seen as detrimental
in a broad range of areas from personal career options to civic participation. The former Secretary-General
of the United Nations (UN), Kofi Annan, was particularly active in stressing that no individual or country
should be left behind when it comes to accessing new technologies
“A “digital divide” threatens to exacerbate already-wide gaps between rich and poor, within and
among countries. The stakes are high indeed. Timely access to news and information can
promote trade, education, employment, health and wealth. One of the hallmarks of the
information society – openness -- is a crucial ingredient of democracy and good governance.
Copyright © 2008 (Ellen Helsper). Licensed under the Creative Commons Attribution Noncommercial No Derivatives (by-nc-nd). Available at http://obs.obercom.pt.

Ellen Helsper Observatorio (OBS*) Journal, 6 (2008) 122
Information and knowledge are also at the heart of efforts to strengthen tolerance, mutual
understanding and respect for diversity” (Annan, 2003)
The fear is that countries or groups that could obtain greater benefits from having access to the internet
are the ones slowest in the uptake. Politicians argue that the hurdles for developing countries are much
higher than those in countries where the infrastructure and general public awareness are already in place.
Defining Divides
The digital divide has been studied at a number of levels; the most general characterization would be
global divides and local divides. While the first refers to the gaps in access and use of technologies between
nations, the second relates to the disadvantages certain groups have within a country in terms of access
and use of digital media. In general, a worldwide spread of digital infrastructure and the multiplication of
internet networks in developing countries were seen as the vehicles to close the gaps between rich and
poor countries. While in itself access is a pre-requisite for inclusion in a digital world, the danger of such a
focused approach is that it precludes the consideration of differences in culture and the nature of political
processes that play a role in technological and educational development. International organizations like
the UN and the Association for Progressive Communication (APC) suggest distinct policies aimed at specific
countries or regions and at the needs that groups in those societies have (Souter, 2004;The Association for
Progressive Communication, 2003).
On a local or national level the debate has in many countries changed from seeing a lack of resources as
the most important culprit for low internet use to including attitudes and skills as important factors that
influence certain groups’ lack of engagement with the internet. A decade of experience and research has
shown that disadvantaged groups will not immediately start using government information, education, and
job opportunities when they are provided with access to the internet. Not all people are innately
enthusiastic about Information and Communication Technologies (ICTs) and often they are not sure about
what use technologies such as the internet could have in their daily lives (Haddon, 2000; Selwyn, 2004;
Selwyn et al., 2003; Selwyn, Gorard, & Williams, 2001).
Approaches to Digital Exclusion
Lately, policy makers in Europe and the US have been relatively optimistic affirming that everyone will have
access to the internet within the next 5 years. For example, in 2008, the UK Schools Minister announced
that by 2010 all parents with school going children should be able provide a broadband connection for their
Observatorio (OBS*) Journal, 6 (2008) Ellen Helsper 123
children at home (Knight, 2008). In the US, government officials adopted the stance that the digital divide
would be overcome through market forces and that it, as a political concept, no longer exists (Samuelson,
2002). It is certainly true that the majority of people in the EU and the US now have access to the internet,
whether it is through work, school or at home, and thus the issue of availability should have become less
important in determining the use of internet (Jung et al., 2001).
Widespread access does not diminish the importance of understanding why there is more resistance
towards the take up of technology in some countries and some groups than in others. Nor does it mean
that ubiquity of internet access and computer training lead to equal use of the internet by all. Currently, the
differences in internet use between advantaged and disadvantaged groups in society seem to be expressed
not only quantity of use but also in quality (Becta, 2002; Jackson, Ervin, Gardner, & Schmitt, 2001; Ono &
Zavodny, 2003; Selwyn, 2004b; Stewart, 2003; Warschauer, 2002). It is unclear where new differences lie
exactly, but the suggestion has been that it rests in the breadth of actions undertaken online and thus in
the extent to which the use of the internet penetrates all aspects of people’s lives (Cho, Gil de Zúñiga,
Rojas, & Shah, 2003; Oxford Internet Institute, 2003; Pew Research Center, 2002). Various scholars claim
that it is a lack of skills that keeps some from taking full advantage of the internet. Still, others argue that it
might actually be a lack of interest that keeps some from exploiting the benefits of this medium (Durndell &
Haag, 2002; E-envoy, 2003; Faulkner, 2002; Harris, 1999; Rommes, 2003; Schumacher & Morahan-Martin,
2001). Social circumstances and experiences might cause a person to form negative opinions of the
internet even if the person has the skills and the equipment necessary to use the internet (Eastin & LaRose,
2000; Foley, Alfonso, Brown, & Fisher, 2003; Foley, Alfonso, & Ghani, 2002; Jung et al., 2001; Loges,
1994; Loges & Jung, 2001). These negative attitudes could inhibit certain groups or societies that share
these opinions from taking full advantage of the internet. It can thus not be assumed that just providing
access will get people to actively use the internet; there has to be an overall positive climate for the most
disinclined to become interested.1
Digital Choice and Digital Exclusion
Once digital divide frameworks include factors such as self-efficacy and attitudes it becomes important to
look at explanations of digital choice as well as digital exclusion. That is, some individuals or groups of
individuals will choose to be disengaged with technologies even when there are no practical hurdles for
them to do so, in contrast to those groups who are forcefully excluded due to a lack of resources to access
1 This paper does not argue that a broader, more frequent use of the internet is all round positive. It does argue that in a world where more and more services are moving online and the online services tend to be cheaper and more accessible, being left behind without an informed choice of what the opportunities are is a serious disadvantage.

Ellen Helsper Observatorio (OBS*) Journal, 6 (2008) 124
and use these technologies. Haddon (2000) uses the term self-exclusion to describe how people from some
groups reject media or show no interest in them without their being practical reasons to do so. Selwyn
(2004b) suggested that a lack of interest in the internet might hide a lack of confidence in ones own skills
to work with the internet or a feeling that the internet is not directed at the group they belong to leading
people to turn away from technologies. Eastin and LaRose (2003) formulated the same idea in stressing
that factors like self-efficacy could play a more important role than socio-demographic factors in
determining why and how the internet is used (See also Livingstone, 2003; Owen et al., 2003; Torkzadeh &
Van Dyke, 2002; Wang & Newlin, 2002). Liberal feminist theories refer to similar principles in arguing that
socialisation and stereotyping make individuals from disadvantaged groups think that a technology is not
made for them or that it is not ‘appropriate’ for them to use it. They go on to argue that an active rejection
of the technology is part of identity formation for some groups (Gill & Grint, 1995). These processes of
opinion formation take place at an individual or cultural level and might be the precursors to a more
general public opinion about the internet and other ICTs.
All this is especially important at a local level if governmental institutions decide to go online completely.
Connected groups will have more information about and say in politics through online forums and will be
able to make better informed decisions in eSocieties. They will have easier access to government services
like online tax forms and social security benefits. At present, those who are excluded from the internet have
a number of other resources available in the form of books and service centres. But these might become
less and less viable alternatives in the future if the standard available format becomes the online version. At
a global level, policy makers and academics need to understand how processes of opinion formation and
use work in relation to these new media differ in different cultural and national contexts to be able to
adjust their policy making to the issues present in specific countries.
Comparative Research on Internet Adoption and Attitude Formation
Although some exploratory work has been done on how opinions are formed about ICTs on a local level,
little is known about how these opinion formation processes compare at an international or global level.
The digital divide is often discussed in a unilateral way with the underlying assumption being that digital
divides have the same origins in different countries and for different groups. An untested hypothesis is that
there are differences in opinion formation processes between countries that are at different stages on the
adoption-diffusion curve (Rogers, 1995). It has been suggested that the tendency of effects of demographic
characteristics to be mediated by self-perception and experience might be specific to countries where the
internet has been wide spread and has been in massive use for a longer period of time (Author, 2004). It is
hypothesized that in developing nations factors like age, education, income and gender remain the most

Observatorio (OBS*) Journal, 6 (2008) Ellen Helsper 125
important in determining the level of internet use and the forming of opinions regarding ICTs (Godoy &
Herrera, 2004) In other word, the aim of this paper is to test whether (perceptions of) internet skills are
less important in countries where the internet is relatively new and undeveloped (Chile), while in countries
where the internet is more developed (the US and the UK) these mediating variables play a bigger role.
The exploratory analyses that follow attempt to address these issues at both the global and the local level
of the digital divide. By doing so the author aims to refute the idea of a unilateral divide by using
compatible World Internet Project (WIP) databases which contained data from 20032. Three countries at
different stages of development were compared (the US, the UK and Chile)3 and a theoretical model was
tested on the local level using path analyses. The use of path modeling techniques4 allows for investigation
into the nature of opinion formation in relation to the internet in these two different countries. The
literature shows that use of the internet, although related to socio-demographic factors, can often be
explained by self-perceptions and experience. These self-perceptions do not only influence how much one
does on the internet, but also what one does and how people form opinions about ICTs. For the purposes
of this paper it is assumed that these differences in opinions about the internet are significant factors
through which the extent of digital divide will be increased or decreased within and between certain
countries. Other models are clearly possible, but in the context of this chapter these path analyses will
serve their purpose by shedding a new light on the mechanisms underlying differences in internet use
between groups and countries that would be impossible to obtain using other techniques.
Background Chile, the US and the UK
In 2003 Chile, the US and the UK differ in two important ways. First, the US and the UK were countries
with a high penetration of internet use (71% users in the US, 59% users in the UK) in comparison to Chile
where 35% of the population used the internet (Godoy & Herrera, 2004). There is data that shows that in
Chile the penetration of the internet is progressing at as high a speed as it was in the early days of the
introduction of the internet in the US (Buchi, 2002) and current figures are no doubt different. The
assumption is thus that Chile in 2003 was at an early phase of the adoption curve and on a similar
developmental path to the one the US and the UK have followed.
The second difference is that these countries have different policies towards the internet. Spokespersons of
the US government have indicated that the digital divide is now negligible in the UK and that therefore no
2 A detailed report on the survey and the general analysis conducted are available at http://www.worldinternetproject.net 3 In this paper the term developed country is used to indicate a country that has been in touch and has been using a technology longer on a massive scale. The intention is not to rank countries as more developed or less developed in other areas. 4 For a given set of variables, among which the correlations have been measured, path analysis allows the researcher to propose a causal model which can then be tested against the data. It is commonly used to assess the relative importance of various direct and indirect causal paths to the dependent variable.

Ellen Helsper Observatorio (OBS*) Journal, 6 (2008) 126
official action will be taken to assure access and training for all (Samuelson, 2002). In Chile and the UK
however, the government is very much concerned with differences in access and skills between different
sections of the population and is thinking of ways to diminish these gaps (Digital action group, 2004). The
UK had a high internet penetration lagging only slightly behind the US, but in contrast to the US its
government prioritizes actively fighting digital exclusion since it sees it as an important factor in battling
social exclusion and a as a major asset in strengthening the countries economy (Ofcom, 2007).
The Theoretical Model and Hypotheses
Traditionally internet research into the digital divide has focussed on the direct effects of demographic
factors on the number of hours a person uses the internet (GVUCenter, 1998; Loges & Jung, 2001;
Marahan-Martin, 1998; NTIA, 2002). New developments in research show more complex relationships that
include expertise variables such as self-efficacy and experience as mediating variables between socio-
demographic variables and use of the internet. Through these variables and through different uses of the
internet people then develop varying opinions about the medium.
This study will use the model indicated in Figure 1 to test the mediating effects of the before mentioned
variables on the relationship between these explanatory variables and opinions regarding the medium.
Figure 1 Hypothetical model of processes behind opinion formation
OpinionsExpertise
Demographics
SocialGrade
Gender
Selfefficacy
Months online
Personal
World
Politics
Breadth of Use
TimeOnline
Age
Figure 1 shows a simple theoretical model in which the arrows indicate a direct relationship between two
variables. The assumed direction of the relationship is indicated by the arrow’s path; its origin is the

Observatorio (OBS*) Journal, 6 (2008) Ellen Helsper 127
independent variable and it points towards the dependent variable. For example, the model argues that
demographic variables are understood to directly influence opinions about the internet (visualized by an
uninterrupted arrow from demographics to opinions).
However, demographics are also assumed to have indirect influences on opinions through their effect on
expertise variables (self-efficacy, time spent online and years of access) which are directly related to
opinions. Another way of saying this is that the effects of socio-demographic characteristics on opinions are
understood to be mediated by expertise and internet use. It is important to note that positive opinions are
said to then increase use again reinforcing positive patterns between use and opinions.
Three different kinds of opinions were studied through this model. The first is an opinion related to the
personal: the idea of how satisfactory or effective the internet is. A second is related to the global; what
have information technologies done for the world, and the third area of opinions is related to people’s
thoughts on the impact of the internet on political participation.5 In the UK questionnaire the attitudinal
questions were phrased differently and only the influence on the personal opinion was measured in the UK.
Methodology
What follows is a short description of the WIP project and the methods used to collect the data in the three
countries studied for this chapter.
The WIP surveys have been designed to be internationally comparable. All participating countries in this
world survey apply the same questions to measure the variables of interest and a serious effort of testing
and retesting has been made to render them internationally comparable. Even though there will still be
cultural differences in interpretation and problems of translation which are hard to avoid, the data obtained
should be comparable.
Another advantage is that the WIP surveys have been shown to have a high response rates and a robust
sampling method leading to a representative sample of the population in both countries (Cole, 2004; Dale,
Arber, & Procter, 1988; Godoy & Herrera, 2004; Dutton & Helsper 2007). The samples consisted in Chile of
2200, in the US of 2000 and in the UK of 2,029 participants; all three surveys were conducted over a 3
month period in 2003. In Chile stratified sampling techniques were used, while in the US equal probability
sampling methods were applied and in the UK a national stratified random sample was used. All three
databases were weighted on the basis of national census data which makes generalisations to the larger
population possible.
5 These were the types of opinions that were present and uniformly measured in both the US and the Chilean WIP databases. The UK database lacked the political and world questions.

Ellen Helsper Observatorio (OBS*) Journal, 6 (2008) 128
For purposes of analysis the Chilean project over-sampled internet users since random sampling would
have led to the numbers of internet users being too small to compare different groups of users statistically.
This paper focuses only on users of the internet and, since the sampling of users was random, the
difference in sampling procedures was not regarded as problematic. The reasons for focussing on users will
be explained in the next section on sample and measures.
A further difference between Chile and the US existed in the methods used to collect the data. While US
interviews were conducted by phone, in Chile and the UK interviews were conducted face to face. This
difference was due to the fact that in Chile people are not accustomed to telephone interviewing and
because half the population does not have a landline (Gobierno de Chile-Subsecretaria de
telecomunicaciones, 2003). In the UK, the length of the survey made the study difficult to conduct by
telephone and higher response rates for face-to-face surveys further made this the preferred technique.
The distribution of cases over the complete databases was the following for the three countries.
Table 1 Database details
Chile US UK
Total number interviewed 2,200 2,000 2,029
Total number of internet users 894 1,422 1,201
Average age 35 39 45
Percentage of women 53% 50% 51%
This paper aims to compare the differences in use and opinions between different groups of internet users
and their opinions about the internet. There was only limited data for non-users on their opinions about
technologies and no information about the nature of their experience with to the internet (if any). This
paper thus does not focus upon the digital divide between non-users and users, but between
infrequent/narrow and frequent/broad users. Only data pertaining to those actively using the internet from
any location were incorporated in the analyses6.
Most variables included in the model shown in Figure 1 are single item measures and were formulated in
the same way in both the Chilean and the US questionnaires, there were small differences with the UK
questionnaire.
6 Path-analyses were conducted using the statistical package AMOS 5.0.

Observatorio (OBS*) Journal, 6 (2008) Ellen Helsper 129
Table 2 Items from WIP questionnaires
Variable name Question asked in WIP survey
Internet expertise
Months Online How many months/years have you used the internet? (Translated into
months)
Internet self-efficacy How would you rate your ability to use the internet?’ (Scale 1 to 4,
from beginner to expert)
Time (spent) online How many hours and minutes do you use the internet in an average
week? All responses were converted into minutes.
Opinions
Personal improvement In Chile and the US: How satisfied are you in general with what the
internet has to offer
(Scale 1 extremely unsatisfied to 5 extremely satisfied)
In the UK: The internet will make my life better
(Scale 1 completely disagree to 5 completely agree)
World improvement Do you think that new information technologies like the internet, mobile
telephones and beepers have made this world a better place? (Scale 1
worse place to 3 better place)
Political opinion 1:
Understanding of politics
Using the internet people like me will understand politics better (Scale
1 (completely disagree) to 5 (completely agree))
Political opinion 2:
influence in politics
Using the internet people like me will have more influence in what the
government does.
(Scale 1 completely disagree to 5 completely agree)
Besides the straight forward measures mentioned above and transparent socio-demographic measures (age
and gender) there were a number of variables that needed to be converted to make comparison between
countries possible.
Socialgrade. Since absolute income measures do not have much meaning in a comparison between two
countries that have considerable differences in wealth, the scales for income were divided into three strata.
33% percent positioned in the lowest category, 33% in the average and 33% in the highest category7.
These categorical variables were used in the model as indicators of social class. This is a very crude
measure, but the only one available that was comparable between the two countries. 7 This division was done for the complete databases including both users and non users
Ellen Helsper Observatorio (OBS*) Journal, 6 (2008) 130
To study breadth of use a composite variable was created by counting the number of actions that a person
had undertaken on the internet, resulting in a score between 0 and 9. Where 0 meant that the person had
undertaken none of the actions and 9 that the person had undertaken all of the counted actions. For all
three countries there were more than nine actions included in the original questionnaire, but only those
were present in the questionnaires of the countries were counted to create an equal measure of breadth of
use.
Findings
To understand the differences between the three countries two different types of analyses were performed,
first a simple comparative descriptive analyses and second, a more in depth study of the processes leading
to opinion formation using path analyses.
Cross country comparison
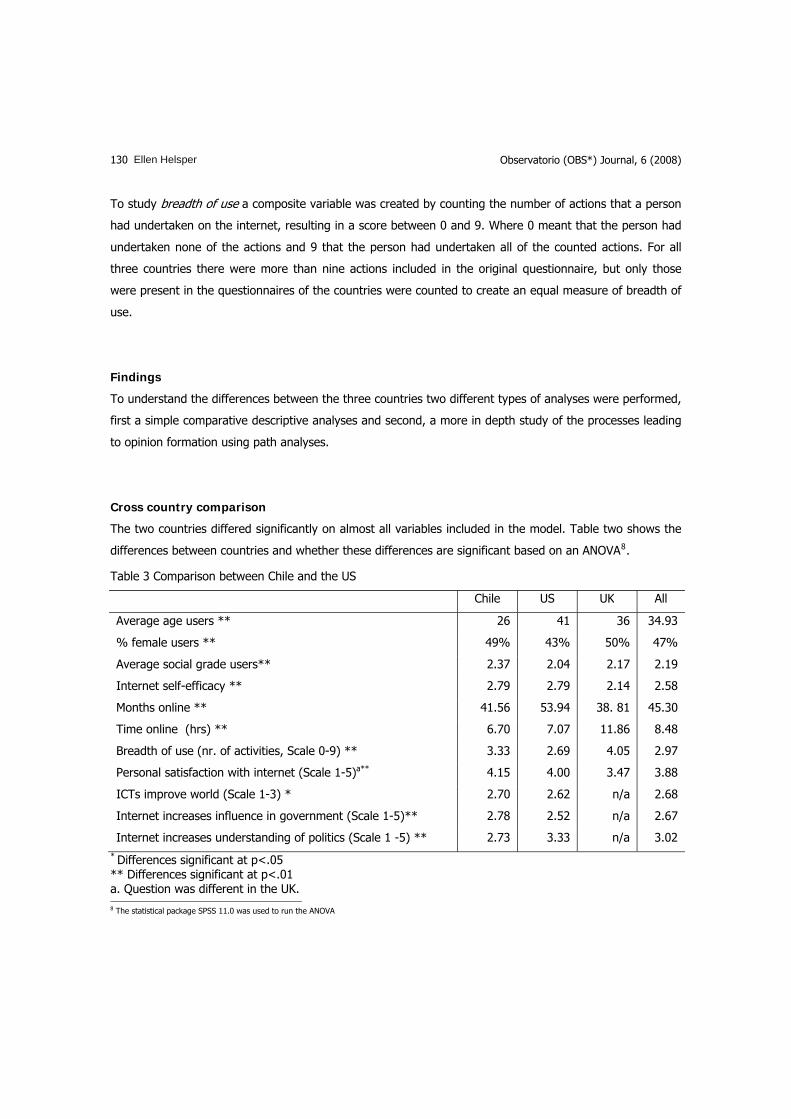
The two countries differed significantly on almost all variables included in the model. Table two shows the
differences between countries and whether these differences are significant based on an ANOVA8.
Table 3 Comparison between Chile and the US
Chile US UK All
Average age users ** 26 41 36 34.93
% female users ** 49% 43% 50% 47%
Average social grade users** 2.37 2.04 2.17 2.19
Internet self-efficacy ** 2.79 2.79 2.14 2.58
Months online ** 41.56 53.94 38. 81 45.30
Time online (hrs) ** 6.70 7.07 11.86 8.48
Breadth of use (nr. of activities, Scale 0-9) ** 3.33 2.69 4.05 2.97
Personal satisfaction with internet (Scale 1-5)a** 4.15 4.00 3.47 3.88
ICTs improve world (Scale 1-3) * 2.70 2.62 n/a 2.68
Internet increases influence in government (Scale 1-5)** 2.78 2.52 n/a 2.67
Internet increases understanding of politics (Scale 1 -5) ** 2.73 3.33 n/a 3.02* Differences significant at p<.05 ** Differences significant at p<.01 a. Question was different in the UK. 8 The statistical package SPSS 11.0 was used to run the ANOVA

Observatorio (OBS*) Journal, 6 (2008) Ellen Helsper 131
The internet users in the US were older, included fewer women, were of lower social grade, had more
experience in years but did less different things online than those in Chile and the UK. US users were
therefore advantaged in terms of experience but the Chilean and UK users made broader use of what the
internet had to offer. The Chilean users seemed to hold a more positive opinion towards the internet’s
capacities to change the world and were more satisfied with what it had to offer than the American users.
In comparison to the US users, the Chilean users did not have great faith however in the ability of the
internet to increase understanding of or influence in politics. In contrast, while the UK users were the
broadest users of the internet and used the internet for more hours than the users in the other countries,
there opinions towards technologies and their own abilities were more negative.
It is surprising that while the countries differed significantly on most measured variables, they did not do so
in ways that could be considered consistent with the internet developmental stage of the country. This
indicates that there is not one unilateral digital divide, but that there are different divides and that for some
indicators of internet use a country considered to be developing in other areas might actually be ahead
(breadth of use in this case).
Processes behind opinion formation
To explore the processes behind engagement with the internet further, a comparison was made between
the path-models in the individual countries. The differences confirm the idea that opinion formation
processes regarding technologies take varying routes in countries with different policies and at distinct
stages of development. The Figures that are presented are schematized, with notes explaining the specific
relationships that are significant and not significant within the models.
Ellen Helsper Observatorio (OBS*) Journal, 6 (2008) 132
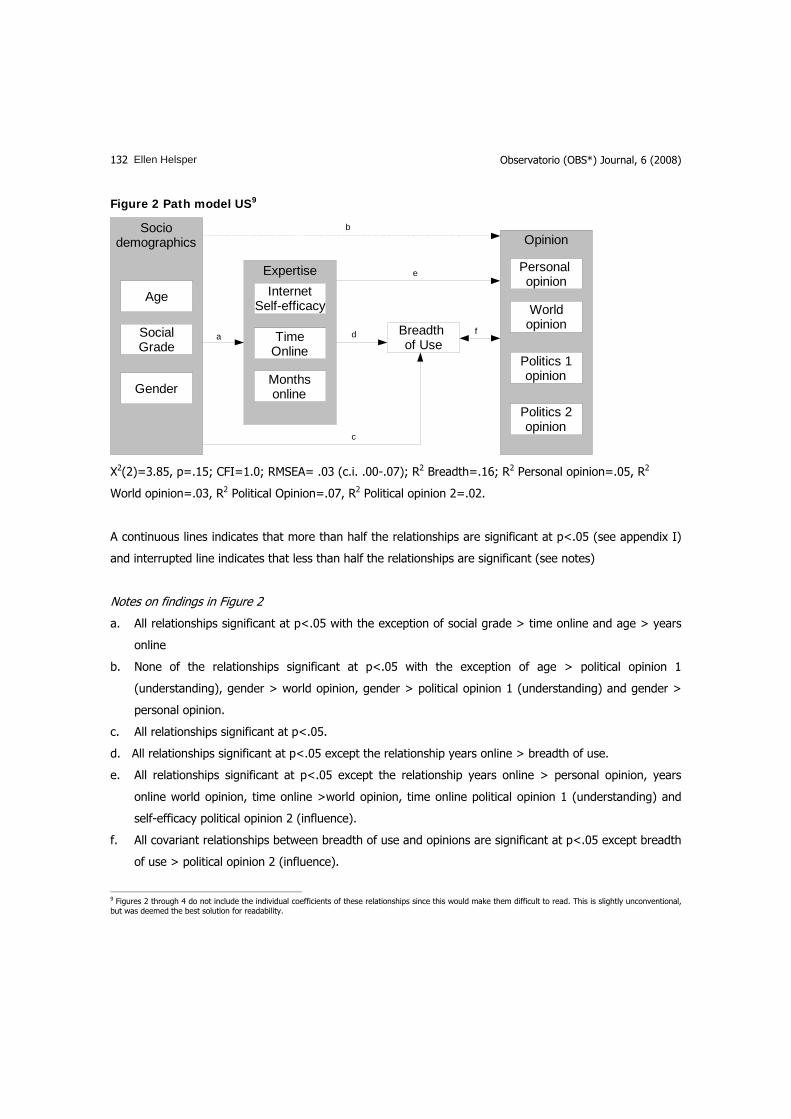
Figure 2 Path model US9
Opinion
Expertise
Sociodemographics
Gender
InternetSelf-efficacy
Monthsonline
Personal opinion
Worldopinion
Politics 1opinion
Politics 2opinion
Breadth of UseTime
Online
Age
SocialGrade
da
c
f
b
e
Χ2(2)=3.85, p=.15; CFI=1.0; RMSEA= .03 (c.i. .00-.07); R2 Breadth=.16; R2 Personal opinion=.05, R2
World opinion=.03, R2 Political Opinion=.07, R2 Political opinion 2=.02.
A continuous lines indicates that more than half the relationships are significant at p<.05 (see appendix I)
and interrupted line indicates that less than half the relationships are significant (see notes)
Notes on findings in Figure 2
a. All relationships significant at p<.05 with the exception of social grade > time online and age > years
online
b. None of the relationships significant at p<.05 with the exception of age > political opinion 1
(understanding), gender > world opinion, gender > political opinion 1 (understanding) and gender >
personal opinion.
c. All relationships significant at p<.05.
d. All relationships significant at p<.05 except the relationship years online > breadth of use.
e. All relationships significant at p<.05 except the relationship years online > personal opinion, years
online world opinion, time online >world opinion, time online political opinion 1 (understanding) and
self-efficacy political opinion 2 (influence).
f. All covariant relationships between breadth of use and opinions are significant at p<.05 except breadth
of use > political opinion 2 (influence).
9 Figures 2 through 4 do not include the individual coefficients of these relationships since this would make them difficult to read. This is slightly unconventional, but was deemed the best solution for readability.

Observatorio (OBS*) Journal, 6 (2008) Ellen Helsper 133
Figure 3 Path model Chile
Opinion
Expertise
Sociodemographics
Gender
InternetSelf-efficacy
Monthsonline
Personal opinion
Worldopinion
Politics 1opinion
Politics 2opinion
Breadth of UseTime
Online
Age
SocialGrade
da
c
f
b
e
Χ2(2)=7.89, p=.02; CFI=.99; RMSEA= .07 (c.i. .02-.11); R2 Breadth=.19; R2 Personal opinion=.02, R2
World opinion=.02, R2 Political Opinion=.02, R2 Political opinion 2=.02.
A continuous lines indicates that more than half the relationships are significant at p<.05 (see appendix II)
and interrupted line indicates that less than half the relationships are significant (see notes)
Notes on findings in Figure 3
a. All relationships significant at p<.05 with the exception of age > self-efficacy.
b. None of the relationships significant at p<.05 with the exception of age > political opinion 1
(understanding), gender > world opinion and gender > political opinion 2 (influence).
c. All relationships significant at p<.05.
d. All relationships significant at p<.05 except years online > breadth of use.
e. None of the relationships significant at p<.05 with the exception of Years online >political opinion 2
(influence), self-efficacy > personal opinion, and self-efficacy political opinion 1 (understanding).
f. None of the relationships significant at p<.05 with the exception of Breadth > political opinion 1
(understanding).

Ellen Helsper Observatorio (OBS*) Journal, 6 (2008) 134
Figure 4 Path model UK
Opinion
Expertise
Sociodemographics
Gender
InternetSelf-efficacy
Years online
Personal opinion
Breadth of UseTime
Online
Age
SocialGrade
da
c
f
b
e
Χ2(2)=3.12, p=.21; CFI=.98; RMSEA= .02 (c.i. .00-.07); R2 Breadth=.16; R2 Personal opinion=.03
A continuous lines indicates that more than half the relationships are significant at p<.05 (see appendix III)
and interrupted line indicates that less than half the relationships are significant (see notes)
Notes on findings in Figure 4
a. Half of the relationships are significant at p<.05. The relationships that are not significant are Social
grade > Time Online, age > years online, gender > years online and gender > self-efficacy.
b. None of the relationships significant at p<.05, except gender and personal opinion.
c. All relationships significant at p<.05 except age > breadth.
d. All relationships significant at p<.05 except self-efficacy > breadth.
e. All relationships significant at p<.05 except self-efficacy > personal opinion.
f. Covariance between breadth of use and personal opinion significant at p<.05.
Many details could be highlighted from Figures 2 through 4 but for the purposes of this paper a more
general overview of trends is sufficient to make the argument that the models that explain opinion
formation and internet use differ between countries.
The first observation is that within these countries with different cultural and political backgrounds there
are quite a few similarities in the processes through which opinions about ICTs are formed.
Observatorio (OBS*) Journal, 6 (2008) Ellen Helsper 135
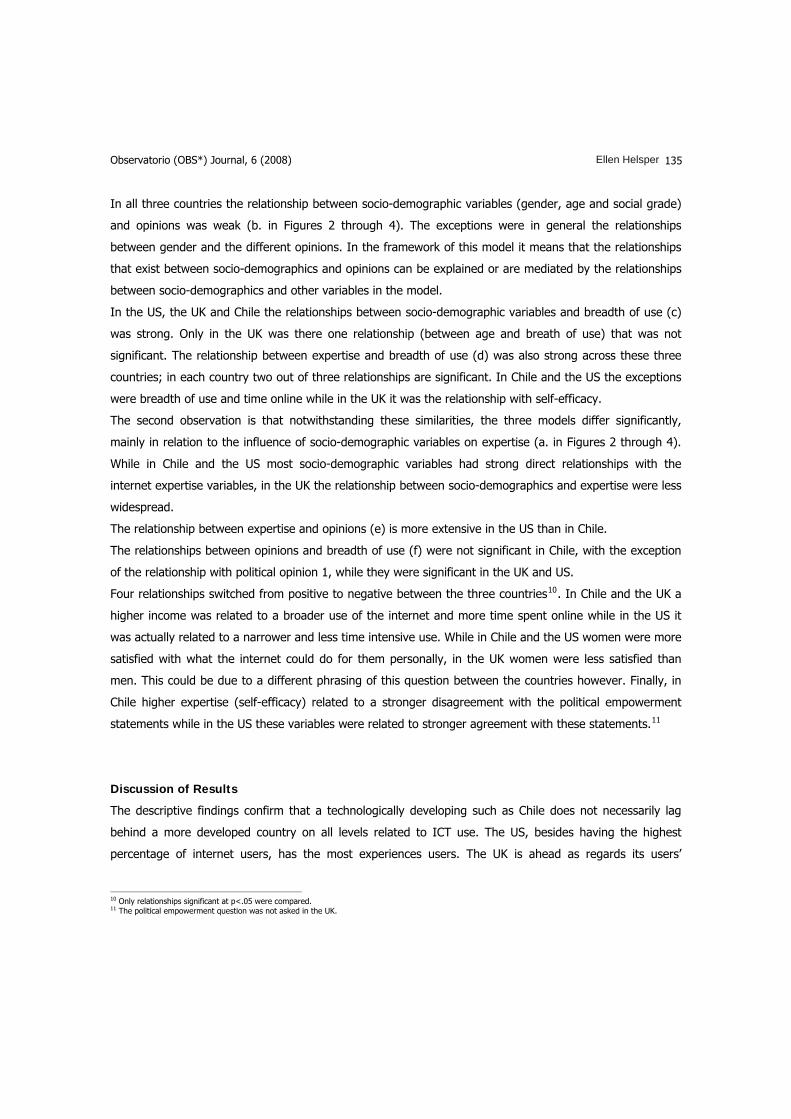
In all three countries the relationship between socio-demographic variables (gender, age and social grade)
and opinions was weak (b. in Figures 2 through 4). The exceptions were in general the relationships
between gender and the different opinions. In the framework of this model it means that the relationships
that exist between socio-demographics and opinions can be explained or are mediated by the relationships
between socio-demographics and other variables in the model.
In the US, the UK and Chile the relationships between socio-demographic variables and breadth of use (c)
was strong. Only in the UK was there one relationship (between age and breath of use) that was not
significant. The relationship between expertise and breadth of use (d) was also strong across these three
countries; in each country two out of three relationships are significant. In Chile and the US the exceptions
were breadth of use and time online while in the UK it was the relationship with self-efficacy.
The second observation is that notwithstanding these similarities, the three models differ significantly,
mainly in relation to the influence of socio-demographic variables on expertise (a. in Figures 2 through 4).
While in Chile and the US most socio-demographic variables had strong direct relationships with the
internet expertise variables, in the UK the relationship between socio-demographics and expertise were less
widespread.
The relationship between expertise and opinions (e) is more extensive in the US than in Chile.
The relationships between opinions and breadth of use (f) were not significant in Chile, with the exception
of the relationship with political opinion 1, while they were significant in the UK and US.
Four relationships switched from positive to negative between the three countries10. In Chile and the UK a
higher income was related to a broader use of the internet and more time spent online while in the US it
was actually related to a narrower and less time intensive use. While in Chile and the US women were more
satisfied with what the internet could do for them personally, in the UK women were less satisfied than
men. This could be due to a different phrasing of this question between the countries however. Finally, in
Chile higher expertise (self-efficacy) related to a stronger disagreement with the political empowerment
statements while in the US these variables were related to stronger agreement with these statements.11
Discussion of Results
The descriptive findings confirm that a technologically developing such as Chile does not necessarily lag
behind a more developed country on all levels related to ICT use. The US, besides having the highest
percentage of internet users, has the most experiences users. The UK is ahead as regards its users’
10 Only relationships significant at p<.05 were compared. 11 The political empowerment question was not asked in the UK.

Ellen Helsper Observatorio (OBS*) Journal, 6 (2008) 136
exposure to a variety of applications. However, Chile leads these three countries in terms of qualitative
appreciation both of themselves and ICTs in general.
It is also apparent from the analysis done that the factors that explain different uses and opinions
regarding the internet are not the same in different countries (Godoy & Herrera, 2004; Author, 2004).
While in Chile it was mainly socio-demographic variables that directly explained opinions about the internet,
in the US it was self-perception and use variables that had more direct relationships with opinion variables.
In the UK income and self-perception related (i.e. self-efficacy) variables were less important, instead other
processes such as exposure and socialization (gender and age) determined use.
The general picture in a comparison of the three models is that in Chile and in the US socio-demographic
variables are important factors in determining internet expertise and to some extent use of and opinions
about the internet, while in the UK these are slightly less influential. Especially gender plays a smaller role
in the UK. This suggests that in a country like the UK, with a widespread ICT infrastructure and a pro-active
social policy oriented towards diminishing digital exclusion, the traditional indicators of exclusion are or
have become less influential in determining digital inclusion.
In the US expertise variables seem more important than in Chile and the UK in influencing the processes
behind opinion formation and use. This suggests that in a country where a market approach is taken to
solve digital exclusion expertise and exposure to the medium are more important than in those countries
that have active government intervention.
At a local level the findings support the notion that models which incorporate both macro (socio-
demographics) and micro (expertise) concepts are necessary to understand the processes behind opinion
formation. These results thus show that a focus purely on socio-demographic factors and access in the
digital divide debate is to simplistic because it ignores the strong effects of self-perception and other non-
demographic variables as indicators of internet use especially in countries like the US which emphasise a
DIY or individualistic approach to solving digital exclusion (Eastin & LaRose, 2000; Selwyn, 2004a, 2004b).
On the other hand, just looking at the micro (person) level ignores the effects of societal structures and
physical infrastructure.
If one assumes that individual opinions can be aggregated into public opinions this paper shows that there
is no ‘international public opinion’ formation process. Analyses that looked at the combined databases of
Chile, the US and the UK (Author, 2004) showed a different picture than the one that was shown through
separate country analyses in this paper. The processes behind opinion formation in relation to this new
technology seem to differ according to the stage at which the country finds itself in the diffusion of the
internet and the policy that a country has. One could of course also argue that the underlying explanatory
factor is culture and that these paths to opinion formation will be different no matter how long Chileans will

Observatorio (OBS*) Journal, 6 (2008) Ellen Helsper
137
have accessed and used the internet. In this context Chile is not in a process of catching up, but is on a
different course of development.
If one knows which routes opinion formation takes in different countries and for different groups one can
adjust policies to global differences between nations and local differences between groups. Different
solutions to adverse public opinion and its relationships to use of new technologies can be found for
different countries in order to close ‘the gap’ in the digital divide. In the US for example, if the government
would be interested in influencing public opinion regarding new technologies, one can imagine focusing on
generally improving people’s perceptions of themselves as users and broadening general use of the internet
without linking it necessarily to certain demographic groups. On the other hand, in Chile based on the fact
that socio-demographic variables are linked to many internet expertise and use variables and directly
related to opinions about new media, more basic policies would to be needed to improve use and access
for groups that are now disengaged. In the UK, more fundamental processes of socialization of different
groups and the simple fact of exposure to technologies suggest that social norms and stereotypes should
be the most important focus for policy makers in this country if they want to engage people more broadly
with technologies. The one thing these analyses have shown is that countries at different stages of
development in terms of the introduction of a new medium will need to implement different strategies to
get people on board and prevent further divisions and use in opinions and use of the internet.
Further Research…
This was an exercise done for only three countries. They differ on many more levels than just their phase
of uptake of this new technology. It is of extreme importance to look at other countries and confirm the
ideas proposed by this chapter. It would be interesting to see how the processes of opinion formation take
place in countries that are at a similar stage in the uptake of the internet and have similar policy
environments. By gathering data for more countries it would be possible to test if there is an ideal model
that fits all, although the findings reported in this paper would suggest otherwise.
Another avenue that future research should take is including latent variables into the model by using more
refined measures. By doing this one could monitor perceptions of democratic processes and their relation to
the use of new interactive media in more detail.
In further research a more detailed picture could then be given of how these models work differently for a
variety of marginal groups. The causes and paths of opinion formation can be to be different for different
groups just as they were different for different countries.
A final observation related to international research on opinion formation about ICTs in particular is that
there is a lack of data on ICT opinions that can be linked to expertise and use variables especially in

Ellen Helsper Observatorio (OBS*) Journal, 6 (2008) 138
databases that serve for international comparisons. The WIP has improved considerably in this area since
2003 but the level of detail in this and other studies is still not sufficient to conduct the nuanced analyses
necessary for a proper understanding of this area. This would also mean that the variance explained by the
models used in this paper is low especially for the different opinions and the availability of more detailed
measures should considerably improve this.
References
Anan, K. (2002). On the digital divide. Geneva: United Nations.
Anan, K. (2003, 18 June 2003). Secretary-General's message [delivered by Amir Dossal, Executive Director,
UN Fund for International Partnerships]. Paper presented at the The Net World Order: Bridging the Global
Digital Divide, New York.
Becta. (2002, 19 February). Digital divide. Paper presented at the Digital divide seminar.
Buchi, R. (2002). Internet en Chile. Perspectivas, 5(2), 173-197.
Cho, J., Gil de Zúñiga, H., Rojas, H., & Shah, D. v. (2003). Beyond Access: The Digital Divide And Internet
Uses And Gratifications. IT & Society, 1(4), 46-72.
Cole, J. (2004). The digital future report. Los Angeles: USC Annenberg school Center for the digital future.
Commission of the European Communities. (2002). eEurope 2005: An information society for all (No. Com
[2002] final). Brussels: European Union.
Dale, A., Arber, S., & Procter, M. (1988). Doing secondary analysis. London: Unwin Hyman.
Digital action group. (2004). Digital agenda: bringing your closer to the future. Retrieved 26/01/05, 2004,
from http://www.agendadigital.cl/agenda_digital/agendadigital.nsf/

Observatorio (OBS*) Journal, 6 (2008) Ellen Helsper
139
Durndell, A., & Haag, Z. (2002). Computer self efficacy, computer anxiety, attitudes towards the Internet
and reported experience with the Internet, by gender, in an East European sample. Computers in Human
Behavior, 00018(00005), 521-536.
Dutton, W., & Helsper, E. J. (2007). The internet in Britain: 2007. Oxford Internet Institute, Oxford
Univeristy: UK.
Eastin, M. S., & LaRose, R. (2000). Internet self-efficacy and the psychology of the digital divide. Journal of
Computer-Mediated Communication, 6(1).
E-envoy. (2003). UK Online Anual Report. London: e-Envoy.
Faulkner, W. (2002). Women, gender in/and ICT: Evidence and reflections from the UK. (No. IST-2000-
26329): SIGIS.
Foley, P., Alfonso, X., Brown, K., & Fisher, J. (2003). Connecting people: Tackling exclusion?, January 2008,
from www.london.gov.uk
Foley, P., Alfonso, X., & Ghani, S. (2002). The digital divide in a world city, January 2008,
from www.london.gov.uk
tml
Gill, R., & Grint, K. (1995). The gender technology relation: Contemporary theory and research. In R. Gill &
K. Grint (Eds.), The gender-technology relation (pp. 1-28). London: Taylor and Francis.
Gobierno de Chile-Subsecretaria de telecomunicaciones. (2003). Estadisticas del sector de las
telecomunicaciones en Chile. Santiago: Chilean government.
Godoy, S., & Herrera, S. (2004) Internet usage in Chile and the world: first results of the world intenret
project-Chile. Cuadernos de informacion, 16.
GVUCenter. (1998). GVUs www users surveys, 2003,
from http://www.cc.gatech.edu/gvu/user_surveys/survey-1998-10/tenthreport.h

Ellen Helsper Observatorio (OBS*) Journal, 6 (2008) 140
Haddon, L. (2000). Social exclusion and information and communication technologies. Lessons from studies
of single parents and the young elderly. New Media & Society, 2(4), 387-406.
Harris, R. W. (1999). Attitudes towards end-user computing: a structural equation model. Behaviour &
Information Technology, 18(2), 109-125.
Helsper, E. (2004, 26 December). Self-efficacy and breadth of internet use. Paper presented at the Joint
Westminster/Goldsmith/LSE Media research conference., Westminster University, London.
Jackson, L. A., Ervin, K. S., Gardner, P. D., & Schmitt, N. (2001). Gender and the Internet: Women
communicating and men searching. Sex Roles, 44(5-6), 363-379.
Johnson, C., Schaller, M., & Mullen, B. (2000). Social categorization and stereotyping: 'You mean I am one
of them?' British Journal of Social Psychology, 39, 1-25.
Jung, J. Y., Qiu, J. L., & Kim, Y. C. (2001). Internet connectedness and inequality - Beyond the "divide".
Communication Research, 28(4), 507-535.
Kirkman, G., Cornelius, P. K., Sachs, J. D., & Schwab, K. (2002). The global information technology report
2001-2002: Readiness for the networked world: Oxford university press.
Knight, J. (2008). All parents to get refulat online reports on their children's progress, BETT. London.
Retrieved February 2008, from http://www.dfes.gov.uk/pns/DisplayPN.cgi?pn_id=2008_0006
Livingstone, S. (2003). The changing nature and uses of media literacy. In R. Gill, Pratt, A., Rantanen, T. &
Couldry, N. (Ed.), Media@LSE electronic working papers (Vol. 4). London.
Loges, W. E. (1994). Canaries in the coal-mine - perceptions of threat and media system dependency
relations. Communication Research, 21(1), 5-23.
Loges, W. E., & Jung, J. Y. (2001). Exploring the digital divide - Internet connectedness and age.
Communication Research, 28(4), 536-562.

Observatorio (OBS*) Journal, 6 (2008) Ellen Helsper
141
Marahan-Martin, J. (1998, 25-27 of March). Women and girls last: Females and the internet. Paper
presented at the IRISS, Bristol, UK.
National Telecommunication and Information Administration (NTIA). (2000). Falling through the net.
Retrieved December 2007, from http://www.ntia.doc.gov/ntiahome/fttn00/contents00.html
NTIA. (2002). A nation online: How Americans are expanding their use of the internet. Retrieved January
2008, from http://www.ntia.doc.gov/ntiahome/dn/anationonline2.pdf
Ofcom. (2007). The communications market 2007 nations and regions. London: Ofcom.
Ono, H., & Zavodny, M. (2003). Gender and the Internet. Social Science Quarterly, 84(1), 111-121.
Owen, D., Green, A. E., McLeod, M., Law, I., Challis, T., & Wilkinson, D. D. (2003). The Use Of And
Attitudes Towards Information And Communication Technologies (ICT) By People From Black And Minority
Ethnic Groups Living In Deprived Areas (No. Research Report 450): Centre for Research in Ethnic Relations
and Institute for Employment Research, University of Warwick.
Oxford Internet Institute. (2003). How much is enough for the internet? Retrieved 3/02, 2003
Pew Research Center. (2002). The ever shifting internet population. Retrieved February 2008,
from http://www.pewinternet.org/reports
Rogers, E. M. (1995). Diffusion of innovations. New York: The free press.
Rommes, E. (2003). I don't know how to fit it into my life'; the gap between the inclusion initiative
introduction courses and the internet and the personal stories of the excluded. (No. IST-2000-26329).
Twente: SIGIS.
Samuelson, S. J. (2002). Less to "digital divide" arguments than meets the eye: NCPA.
Schumacher, P., & Morahan-Martin, J. (2001). Gender, Internet and computer attitudes and experiences.
Computers in Human Behavior, 17(1), 95-110.

Ellen Helsper Observatorio (OBS*) Journal, 6 (2008) 142
Selwyn, N. (2004a). Reconsidering political and popular understandings of the digital divide. New Media &
Society, 6(3), 341-362.
Selwyn, N. (2004b). Technology and social inclusion. British Journal of Educational Technology, 35(1), 127-
127.
Selwyn, N., Gorard, S., Furlong, J., et al. (2003). Older adults' use of information and communications
technology in everyday life. Ageing and Society, 23, 561-582.
Selwyn, N., Gorard, S., & Williams, S. (2001). Digital divide or digital opportunity? The role of technology in
overcoming social exclusion in us education. Educational Policy, 15(2), 258-277.
Stewart, J. (2003). Information society, the internet and gender. A summary of pan-european statistical
data. In.
Torkzadeh, G., & Van Dyke, T. P. (2002). Effects of training on Internet self-efficacy and computer user
attitudes. Computers in Human Behavior, 00018(00005), 479-495.
UCLA. (2001). Surveying the digital future, Retrieved December 2003, from http://www.ccp.ucla.edu
Wajcman, J. (2000). Reflections on gender and technology studies: In what state is the art? Social Studies
of Science, 30(3), 447-464.
Wang, A. Y., & Newlin, M. H. (2002). Predictors of web-student performance: the role of self-efficacy and
reasons for taking an on-line class. Computers in Human Behavior, 18(2), 151-164.
Warschauer, M. (2002, July). Reconceptualizing the digital divide. Retrieved July 2007,
from htttp://firstmonday.org/issues/issue7_7/warschauer/index.html
Yang, B., & Lester, D. (2003). Liaw's scales to measure attitudes toward computers and the Internet.
Perceptual and Motor Skills, 97(2), 384-384.

Observatorio (OBS*) Journal, 6 (2008) Ellen Helsper
143
Author’s Note
I wish to thank the World Internet Project teams from the US, Chile and the UK for providing the data used
in this paper.

Ellen Helsper Observatorio (OBS*) Journal, 6 (2008) 144
Appendix I: Estimates for US Model Path in the model b s.e. p β
Soc-Dem >
Expertise
Social grade ---> Years online 9.05 1.36 ** 0.20
Social grade ---> Self-efficacy 0.10 0.03 ** 0.10
Social grade ---> Time Online -0.69 0.41 0.09 -0.05
Age ---> Years online 0.00 0.06 0.99 0.00
Age ---> Time Online -0.04 0.02 0.03 -0.06
Age ---> Self-efficacy -0.02 0.00 ** -0.36
Gender ---> Years online 4.98 2.11 0.02 0.07
Gender ---> Time Online 1.99 0.63 0.00 0.09
Gender ---> Self-efficacy 0.11 0.05 0.02 0.06
Soc-Dem
> Breadth
Age ---> Breadth of use -0.01 0.00 ** -0.15
Gender ---> Breadth of use 0.33 0.08 ** 0.11
Social grade ---> Breadth of use -0.11 0.05 0.04 -0.06
Soc -Dem >
Opinions
Social grade ---> Personal improvement -0.04 0.03 0.20 -0.04
Age ---> Personal improvement 0.00 0.00 0.59 -0.02
Gender ---> Personal improvement -0.10 0.04 0.02 -0.06
Social grade ---> World improvement -0.01 0.03 0.84 -0.01
Age ---> World improvement 0.00 0.00 0.19 0.06
Gender ---> World improvement 0.10 0.05 0.04 0.08
Social grade ---> Political understanding 0.03 0.04 0.48 0.02
Age ---> Political understanding -0.01 0.00 ** -0.13
Gender ---> Political understanding 0.14 0.07 0.03 0.06
Social grade ---> Political Influence 0.03 0.04 0.52 0.02
Age ---> Political Influence 0.00 0.00 0.86 -0.01
Gender ---> Political Influence 0.10 0.07 0.16 0.04
Expertise >
Breadth
Years online ---> Breadth of use 0.00 0.00 0.07 0.05
Time Online ---> Breadth of use 0.03 0.00 ** 0.20
Self-efficacy ---> Breadth of use 0.26 0.05 ** 0.16
Expertise >
Opinions
Years online ---> Personal improvement 0.00 0.00 0.91 0.00
Years online ---> World improvement 0.00 0.00 0.85 0.01
Years online ---> Political understanding 0.00 0.00 ** 0.11
Years online ---> Political Influence 0.00 0.00 0.04 0.07
Time Online ---> Personal improvement 0.01 0.00 ** 0.11
Time Online ---> World improvement 0.00 0.00 0.71 -0.02
Time Online ---> Political understanding 0.00 0.00 0.19 0.04
Time Online ---> Political Influence 0.01 0.00 0.01 0.08
Self-efficacy ---> Personal improvement 0.15 0.03 ** 0.16
Self-efficacy ---> World improvement 0.10 0.03 0.00 0.14
Self-efficacy ---> Political understanding 0.14 0.05 0.00 0.11
Self-efficacy ---> Political Influence 0.05 0.05 0.23 0.04
Breadth
< > Opinions
Breadth <--> Personal improvement 0.10 0.03 ** 0.30
Breadth <--> Political understanding 0.09 0.03 0.01
Breadth <--> World improvement 0.17 0.05 **
Breadth <--> Political Influence 0.07 0.05 0.15

Observatorio (OBS*) Journal, 6 (2008) Ellen Helsper
145
Estimates covariants US model
Path in the model b s.e. p
Opinions
< > Opinions
Political understanding <--> Personal improvement 0.10 0.02 **
Political Influence <--> Personal improvement 0.14 0.03 **
Political Influence <--> Political understanding 0.05 0.03 0.08
Political Influence <--> World improvement 0.49 0.04 **
World improvement <--> Political understanding 0.05 0.03 0.05
World improvement <--> Personal improvement 0.16 0.03 **
Expertise < >
Expertise
Years online <--> Time Online 10.78 0.91 **
Years online <--> Self-efficacy 70.85 11.53 **
Time Online <--> Self-efficacy 2.10 0.26 **
Social grade <--> Age 0.48 0.42 0.25

Ellen Helsper Observatorio (OBS*) Journal, 6 (2008) 146
Appendix II: Estimates for Chilean Model Path in the model b s.e. p β
Soc-Dem >
Expertise
Social grade ---> Years online 13.53 2.36 ** 0.22
Social grade ---> Self-efficacy 0.15 0.04 ** 0.13
Social grade ---> Time Online 1.36 0.66 0.04 0.08
Age ---> Years online 0.31 0.12 0.01 0.10
Age ---> Time Online -0.15 0.03 ** -0.18
Age ---> Self-efficacy 0.00 0.00 0.19 -0.05
Gender ---> Years online 10.32 2.81 ** 0.14
Gender ---> Time Online 2.21 0.79 0.01 0.11
Gender ---> Self-efficacy 0.26 0.05 ** 0.19
Soc-Dem
> Breadth
Age ---> Breadth of use -0.04 0.01 ** -0.30
Gender ---> Breadth of use 0.24 0.12 0.04 0.07
Social grade ---> Breadth of use 0.29 0.10 0.00 0.11
Soc-Dem
> Opinions
Social grade ---> Personal improvement -0.02 0.05 0.64 -0.02
Age ---> Personal improvement 0.00 0.00 0.85 0.01
Gender ---> Personal improvement -0.04 0.05 0.44 -0.03
Social grade ---> World improvement -0.03 0.05 0.57 -0.02
Age ---> World improvement 0.00 0.00 0.41 0.03
Gender ---> World improvement 0.22 0.06 ** 0.14
Social grade ---> Political understanding 0.07 0.10 0.49 0.03
Age ---> Political understanding -0.01 0.01 0.01 -0.11
Gender ---> Political understanding 0.12 0.12 0.33 0.04
Social grade ---> Political Influence 0.05 0.10 0.62 0.02
Age ---> Political Influence -0.01 0.01 0.06 -0.08
Gender ---> Political Influence 0.24 0.12 0.04 0.08
Expertise >
Breadth
Years online ---> Breadth of use 0.00 0.00 0.19 0.05
Time Online ---> Breadth of use 0.02 0.01 ** 0.12
Self-efficacy ---> Breadth of use 0.49 0.09 ** 0.21
Expertise >
Opinions
Years online ---> Personal improvement 0.00 0.00 0.90 -0.01
Years online ---> World improvement 0.00 0.00 0.97 0.00
Years online ---> Political understanding 0.00 0.00 0.30 -0.04
Years online ---> Political Influence 0.00 0.00 0.02 -0.10
Time Online ---> Personal improvement 0.00 0.00 0.28 0.04
Time Online ---> World improvement 0.00 0.00 0.92 0.00
Time Online ---> Political understanding 0.00 0.01 0.49 -0.03
Time Online ---> Political Influence 0.00 0.01 0.66 0.02
Self-efficacy ---> Personal improvement 0.12 0.04 0.00 0.13
Self-efficacy ---> World improvement 0.05 0.05 0.29 0.04
Self-efficacy ---> Political understanding -0.19 0.09 0.04 -0.09
Self-efficacy ---> Political Influence -0.06 0.09 0.49 -0.03
Breadth
< > Opinions
Breadth <--> Personal improvement 0.06 0.04 0.10
Breadth <--> Political understanding 0.11 0.04 0.02
Breadth <--> World improvement 0.03 0.08 0.73
Breadth <--> Political Influence -0.03 0.09 0.71

Observatorio (OBS*) Journal, 6 (2008) Ellen Helsper
147
Estimates covariants Chilean Model
Path in the model b s.e. p
Opinions < >
Opinions
Political understanding <--> Personal improvement 0.06 0.02 0.00
Political Influence <--> Personal improvement 0.03 0.04 0.44
Political Influence <--> Political understanding 0.10 0.05 0.03
Political Influence <--> World improvement 1.29 0.10 **
World improvement <--> Political understanding 0.04 0.04 0.32
World improvement <--> Personal improvement 0.08 0.04 0.05
Expertise < >
Expertise
Years online <--> Time Online 6.68 0.97 **
Years online <--> Self-efficacy 8.90 14.15 0.53
Time Online <--> Self-efficacy 0.97 0.27 **
Social grade <--> Age 1.53 0.30 **

Ellen Helsper Observatorio (OBS*) Journal, 6 (2008) 148
Appendix III: Estimates for UK Model Path in the model b s.e. p β
Soc-Dem
>
Expertise
Social grade ---> Years online 5.34 1.34 ** 0.15
Social grade ---> Self-efficacy 1.79 0.18 ** 0.35
Social grade ---> Time Online 0.55 0.95 0.57 0.02
Age ---> Years online -0.01 0.04 0.91 0.00
Age ---> Time Online -0.07 0.03 0.01 -0.07
Age ---> Self-efficacy -0.03 0.01 ** -0.13
Gender ---> Years online 2.31 1.56 0.14 0.04
Gender ---> Time Online 2.49 1.10 0.02 0.07
Gender ---> Self-efficacy 0.12 0.22 0.59 0.02
Soc Dem
>
Breadth
Age ---> Breadth of use 0.00 0.00 0.96 0.00
Gender ---> Breadth of use 0.35 0.10 ** 0.09
Social grade ---> Breadth of use 0.21 0.10 0.03 0.08
Soc -Dem
>
Opinions
Social grade ---> Personal improvement -0.06 0.05 0.30 -0.04
Age ---> Personal improvement 0.00 0.00 0.54 -0.02
Gender ---> Personal improvement 0.12 0.06 0.04 0.06
Social grade ---> World improvement
Age ---> World improvement
Gender ---> World improvement
Social grade ---> Political understanding
Age ---> Political understanding
Gender ---> Political understanding
Social grade ---> Political Influence
Age ---> Political Influence
Gender ---> Political Influence
Expertise
>
Breadth
Years online ---> Breadth of use 0.01 0.00 ** 0.16
Time Online ---> Breadth of use 0.03 0.00 ** 0.31
Self-efficacy ---> Breadth of use -0.01 0.02 0.55 -0.02
Expertise
>
Opinions
Years online ---> Personal improvement 0.00 0.00 0.02 0.07
Years online ---> World improvement
Years online ---> Political understanding
Years online ---> Political Influence
Time Online ---> Personal improvement 0.01 0.00 ** 0.13
Time Online ---> World improvement
Time Online ---> Political understanding
Time Online ---> Political Influence
Self-efficacy ---> Personal improvement 0.01 0.01 0.17 0.05
Self-efficacy ---> World improvement
Self-efficacy ---> Political understanding
Self-efficacy ---> Political Influence
Breadth
< >
Opinions
Breadth <--> Personal improvement 0.05 6.16 **
Breadth <--> Political understanding
Breadth <--> World improvement
Breadth <--> Political Influence

Observatorio (OBS*) Journal, 6 (2008) Ellen Helsper
149
Covariants UK Model
Path in the model b s.e. p
Opinions
< >
Opinions
Political understanding <--> Personal improvement
Political Influence <--> Personal improvement
Political Influence <--> Political understanding
Political Influence <--> World improvement
World improvement <--> Political understanding
World improvement <--> Personal improvement
Expertise
< >
Expertise
Years online <--> Time Online 2.94 0.20 0.85
Years online <--> Self-efficacy 14.80 5.13 **
Time Online <--> Self-efficacy 2.08 -0.89 0.38
Social grade <--> Age 0.57 -2.34 0.02