internet access and children's online opportunities in brazil
TRANSCRIPT
A evolução da Internet no Brasil 26 de março de 2009 – São Paulo
Addressing the digital divide: Internet access and children’s online opportunities in Brazil
Children’s and Young People’s Rights in the Digital Age
IAMCR 2016 Pre-conference London | 26-27th of July 2016

A evolução da Internet no Brasil 26 de março de 2009 – São Paulo
2005
ICT Surveys in Brazil 10 years producing data for evidence-based policymaking
MEASURING ACCESS TO AND USE OF ICT CETIC.br: areas of investigation
2012

A evolução da Internet no Brasil 26 de março de 2009 – São Paulo
Barbosa, A., O’Neill, B., Ponte, C., Simões, J.A., and Jereissati, T. (2013). Risks and safety on the internet: Comparing Brazilian and European children. LSE, London: EU Kids Online.
Sozio, M. E. ; Ponte, C. ; Sampaio, I. V. ; Senne, F. J. N. ; Olafsson, K. ; Alves, S. J. Z. ; Garroux, C. (2015) . Children and Internet use: A comparative analysis of Brazil and seven European countries. EU Kids Online, v. 1, p. 1-19.
COMPARATIVE ANALYSES ICT Kids Online Brazil and European Projects

A evolução da Internet no Brasil 26 de março de 2009 – São Paulo
LACKOCoordinaciónBrasil/Chile
EUKOGKO
UNICEF–LSE
Interna>onalOrganiza>ons
LATIN AMERICAN KIDS ONLINE
o Argentina o Brazil o Chile o Colombia o Costa Rica o Ecuador o Uruguay

A evolução da Internet no Brasil 26 de março de 2009 – São Paulo
94 Million Internet users in
2014
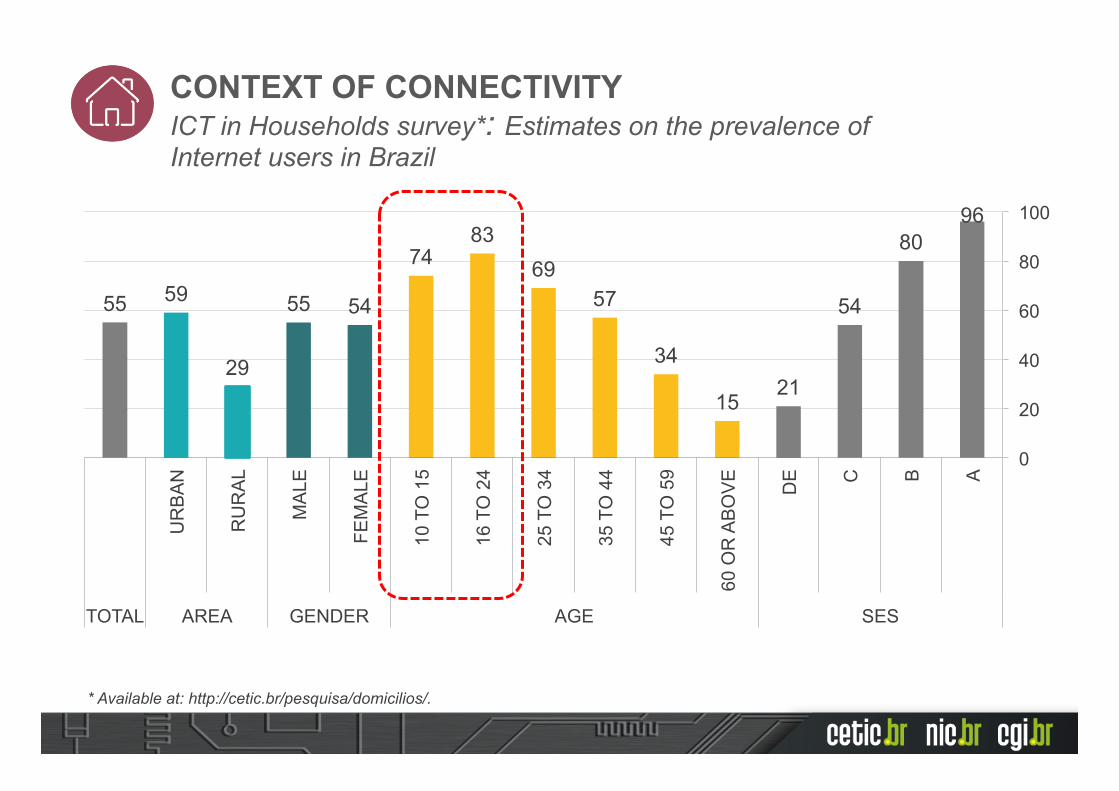
CONTEXT OF CONNECTIVITY ICT in Households survey*: Estimates on the prevalence of Internet users in Brazil
43%
63% 56%
48%
54%
Internet user: those individuals who have used the Internet at least once in the three months prior to the interview (ITU, 2014).
34 39 41
46 49 51 55
0
20
40
60
80
100
2008 2009 2010 2011 2012 2013 2014
A evolução da Internet no Brasil 26 de março de 2009 – São Paulo
CONTEXT OF CONNECTIVITY ICT in Households survey*: Estimates on the prevalence of Internet users in Brazil
* Available at: http://cetic.br/pesquisa/domicilios/.
55 59
29
55 54
74 83
69 57
34
15 21
54
80 96
0
20
40
60
80
100
UR
BA
N
RU
RA
L
MA
LE
FEM
ALE
10 T
O 1
5
16 T
O 2
4
25 T
O 3
4
35 T
O 4
4
45 T
O 5
9
60 O
R A
BO
VE
DE
C
B
A
TOTAL AREA GENDER AGE SES

• Main challenges and shortcomings: o Digital divide: Internet users represent 55% of the total population
and 77% of the population aged 10 to 17 years (ICT in Households 2014);
o Regional differences: higher between regions than across countries;
o Increased costs and operational effort to find the target population of the survey;
• Improvement in survey design:
2015 – Sampling design optimization and cost reduction: Integration to the ICT in Households sample design and survey operations
ICT KIDS ONLINE BRAZIL Improvements in survey design

A evolução da Internet no Brasil 26 de março de 2009 – São Paulo
* Estimated sample sizes. Currently in data collection.
2012 2013 2014 2015* Sample design PPS / IS PPS / IS PPS / IS PPS / SRS
Number of municipalities 125 150 150 350
Number of enumeration areas 250 300 300 2.000
Number of interviews
Children 1.580 2.261 2.105 3.000
Parents/ legal guardians 1.580 2.261 2.105 3.000
Total 3.160 4.522 4.210 6.000
Mode of data collections
PAPI (Paper-and-pencil personal interviewing) SAQ (Self-administered questionnaire)
PAPI (Paper-and-pencil personal interviewing) SAQ (Self-administered questionnaire)
CAPI (Computer-assisted personal interviewing) CASI (Computer-assisted self-interviewing)
CAPI (Computer-assisted personal interviewing) CASI (Computer-assisted self-interviewing)
ICT KIDS ONLINE BRAZIL Survey design 2012-2015
A evolução da Internet no Brasil 26 de março de 2009 – São Paulo
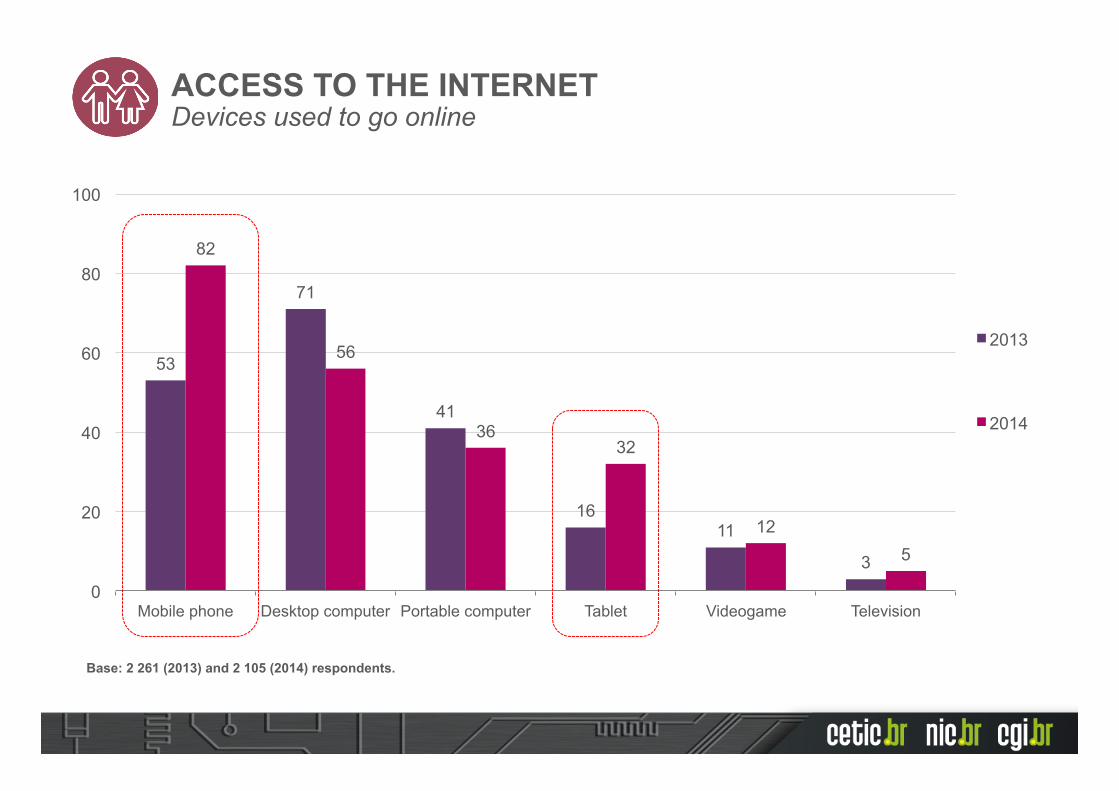
53
71
41
16 11
3
82
56
36 32
12 5
0
20
40
60
80
100
Mobile phone Desktop computer Portable computer Tablet Videogame Television
2013
2014
Base: 2 261 (2013) and 2 105 (2014) respondents.
ACCESS TO THE INTERNET Devices used to go online

A evolução da Internet no Brasil 26 de março de 2009 – São Paulo
ACCESS TO THE INTERNET Type of Internet connection (2014)
Base: 2 105 (2014) respondents.
72
83
72
50
64 58
63
79
37 42
37 32
0
20
40
60
80
100
HIGH MEDIUM LOW
TOTAL SES
WiFi only 3G or 4G Both

A evolução da Internet no Brasil 26 de março de 2009 – São Paulo
40
26
38 34
18
42 35
68
57 54
45
35 37
22
7
81 73
60 54
49
38
22 17
0
20
40
60
80
100
Shared place at home
Child's own bedroom
Relatives' home
Friends' home On the move School Cybercafé Public library, telecenter or other public
space
2012
2013
2014
ACCESS TO THE INTERNET Location of Internet use
Base: 1 560 (2012), 2 261 (2013) and 2 105 (2014) respondents.

A evolução da Internet no Brasil 26 de março de 2009 – São Paulo
DIGITAL SKILLS Skills for a safe use of the Internet
Base: 1 560 (2012), 2 261 (2013) and 2 105 (2014) respondents.
63
54 50
41
57 58
46 42
58 56 50
46
0
20
40
60
80
100
Bookmark a website Change privacy settings on SNS
Delete the record of visited websites
Compare different websites to decide if information is true
2012
2013
2014
A evolução da Internet no Brasil 26 de março de 2009 – São Paulo
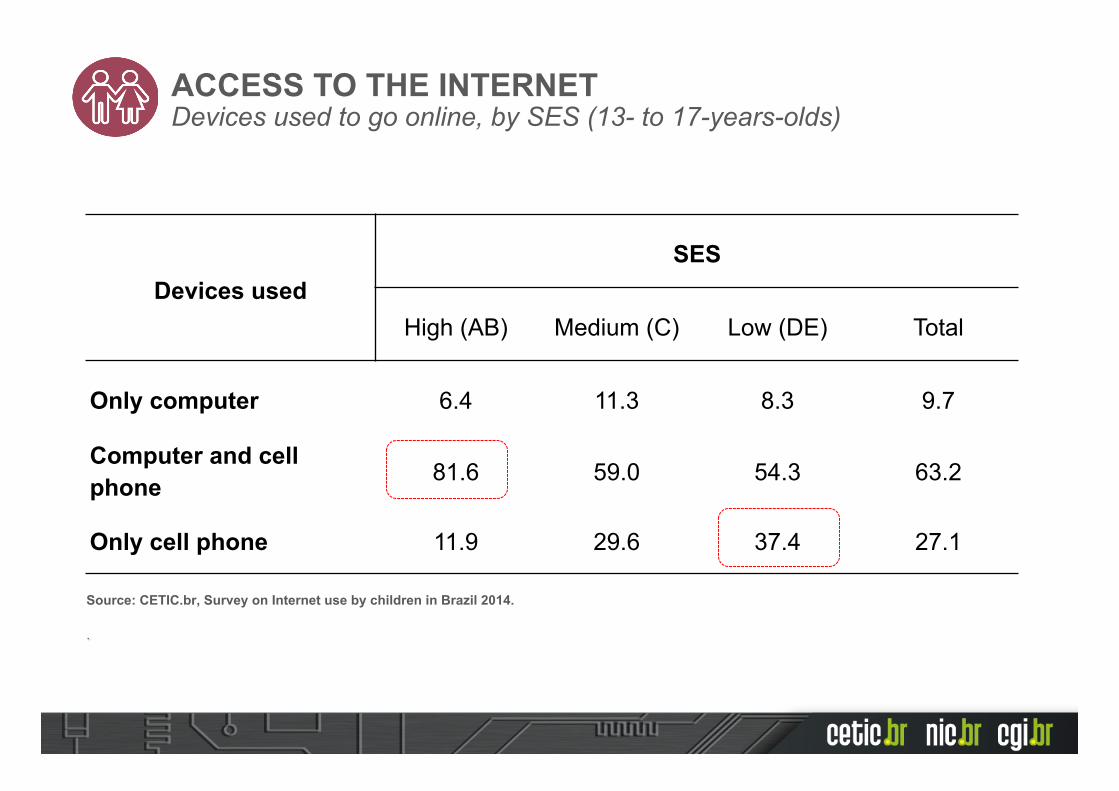
Source: CETIC.br, Survey on Internet use by children in Brazil 2014.
.
ACCESS TO THE INTERNET Devices used to go online, by SES (13- to 17-years-olds)
Devices usedSES
High (AB) Medium (C) Low (DE) Total
Only computer 6.4 11.3 8.3 9.7
Computer and cell phone 81.6 59.0 54.3 63.2
Only cell phone 11.9 29.6 37.4 27.1

A evolução da Internet no Brasil 26 de março de 2009 – São Paulo
MULTIPLE CORRESPONDENCE ANALYSIS (MCA) Factor dimensions
Source: CETIC.br, Survey on Internet use by children in Brazil 2014.
Variable Fac1 Fac2 Fac3 Fac4Internet use for school work 6.35 3.08 36.59* 2.67
Watched online videos 8.90 4.04 2.96 2.90
Downloaded music or movies 12.37* 1.24 12.76 9.29
Read/watched online news 9.21 4.13 0.04 7.09
Researched things on the Internet 14.19* 0.85 16.45* 0.18
Watched online programs, TV series and movies 11.73* 6.36 0.08 6.49
Listened to music on the Internet 11.77* 0.99 25.69* 3.09
Entered, accessed a social network 8.92 8.20 0.00 31.82*
Used instant messaging 9.57 13.83 5.07 17.77*
Played games with other people on the Internet 3.01 23.60* 0.03 11.22
Played games alone on the Internet 3.98 33.69* 0.33 7.47
Total 100.0 100.0 100.0 100.0
• 4 factors explain 80.2% of variability
A evolução da Internet no Brasil 26 de março de 2009 – São Paulo
Source: CETIC.br, Survey on Internet use by children in Brazil 2014.
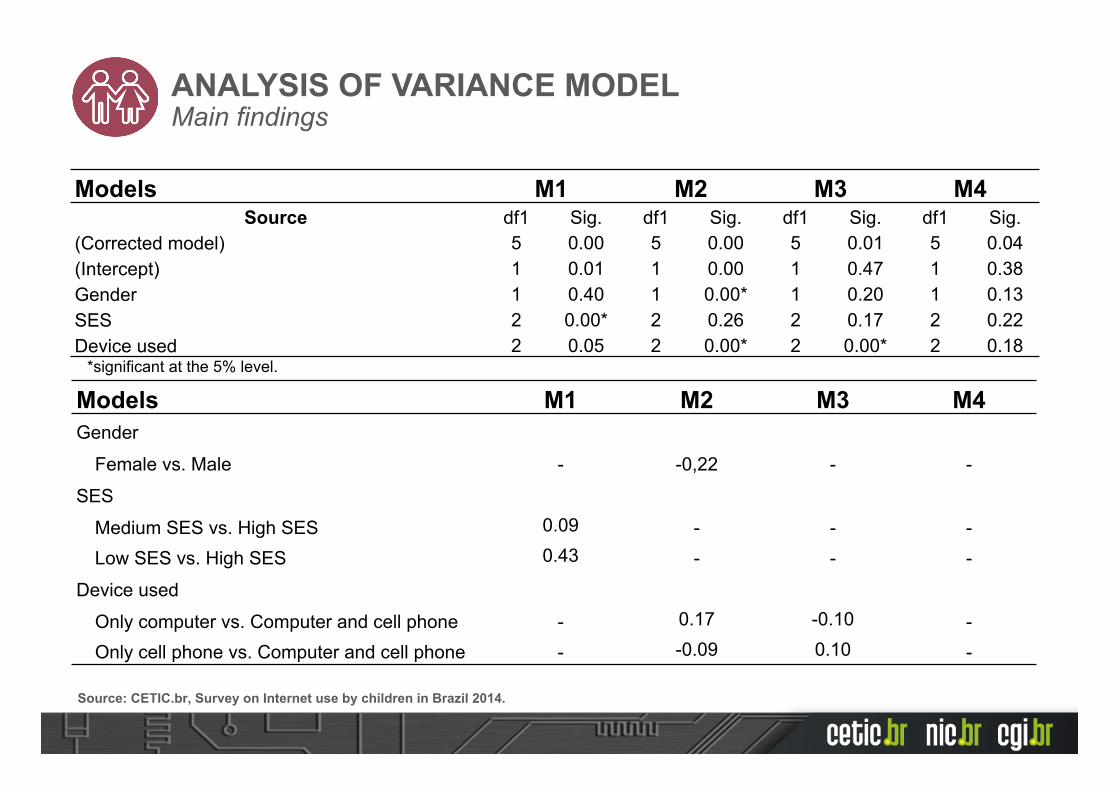
Models M1 M2 M3 M4 Source df1 Sig. df1 Sig. df1 Sig. df1 Sig.
(Corrected model) 5 0.00 5 0.00 5 0.01 5 0.04 (Intercept) 1 0.01 1 0.00 1 0.47 1 0.38 Gender 1 0.40 1 0.00* 1 0.20 1 0.13 SES 2 0.00* 2 0.26 2 0.17 2 0.22 Device used 2 0.05 2 0.00* 2 0.00* 2 0.18
Models M1 M2 M3 M4 Gender
Female vs. Male - -0,22 - -
SES
Medium SES vs. High SES 0.09 - - - Low SES vs. High SES 0.43 - - -
Device used
Only computer vs. Computer and cell phone - 0.17 -0.10 - Only cell phone vs. Computer and cell phone - -0.09 0.10 -
*significant at the 5% level.
ANALYSIS OF VARIANCE MODEL Main findings

ANALYSIS OF VARIANCE MODEL Main findings
o Model 1: Controlling for Gender and Device used, data analysis indicates that SES is critical for activities related to entertainment and the consumption of audio-visual media, and that high SES is associated with performing these activities.
o Model 2: Although the prevalence of boys in gaming activities is well documented in the literature, data shows that the use of computer is also relevant for explaining gaming.
o Model 3: Controlling for Gender and SES, data analysis shows that access to computer is critical for activities related to education and access to information.
o Model 4: Data analysis indicates that social networking and instant messaging are disseminated among children regardless of Gender, SES or Device used.
A evolução da Internet no Brasil 26 de março de 2009 – São Paulo
Thank you! www.cetic.br
[email protected] @ComuNICbr Facebook.com/nic.br